

StarRocks performance tuning
Statements for performance tuning
Query tuning in StarRocks usually starts with understanding how a query is planned, then checking how it actually runs, and finally analyzing detailed runtime metrics to locate bottlenecks. This article describes the main tools used in this process:
-
EXPLAIN — shows the optimizer-generated execution plan before a query is run.
-
EXPLAIN ANALYZE — runs a query and adds actual runtime statistics to the execution plan.
-
Query profile — provides detailed runtime metrics for completed or running queries.
See details in StarRocks documentation.
Key terms
The following terms are used throughout this article:
-
Operator — a step in a query execution plan, such as scanning data, joining datasets, aggregating rows, sorting results, or exchanging data between nodes.
-
Predicate — a filtering condition, for example a condition from a
WHEREclause. -
Predicate pushdown — applying a predicate as early as possible, usually during data scanning, to reduce the amount of data processed by later operators.
-
Cardinality — the estimated or actual number of rows processed or produced by an operator.
-
Cost — an optimizer estimate of the resources required to execute an operation. Cost estimates can include CPU, memory, network, and row-count estimates.
-
Partition — a logical division of table data that groups data by a specific attribute, such as time or date. Partition pruning allows StarRocks to skip partitions that are not required for a query.
-
Tablet — a micro-partition: the minimum storage and replication unit distributed across storage nodes.
-
Exchange — an operator that transfers intermediate data between compute nodes. Depending on the plan, data can be shuffled, broadcast, or gathered.
EXPLAIN
The EXPLAIN statement shows the execution plan generated by the StarRocks optimizer for an SQL statement without running it. Use it before execution to understand how SCAN, JOIN, and AGGREGATE operators, predicates, and data exchanges are planned. See details in StarRocks documentation.
StarRocks supports several EXPLAIN modes:
-
EXPLAIN LOGICAL— shows a simplified logical plan. -
EXPLAIN— shows a basic physical plan. -
EXPLAIN VERBOSE— shows a physical plan with detailed information. -
EXPLAIN COSTS— shows estimated costs for plan operations. This mode is useful for diagnosing issues related to table and column optimizer statistics.
The example query below finds which user age groups are responsible for the highest number of purchases:
EXPLAIN
SELECT u.age, count(e.event_id) AS total_events
FROM user_events e
JOIN users u ON e.user_id = u.user_id
WHERE e.event_type = 'purchase'
GROUP BY u.age
ORDER BY total_events DESC;
The output contains a tree of operators that represents the query execution flow. Read the plan from bottom to top: start with the data scan operators and follow the tree up to the final result.
+-----------------------------------------------------------------------+
| Explain String                                                        |
+-----------------------------------------------------------------------+
| PLAN FRAGMENT 0                                                       |
|  OUTPUT EXPRS:6: age | 8: count                                       |
|   PARTITION: UNPARTITIONED                                            |
|                                                                       |
|   RESULT SINK                                                         |
|                                                                       |
|   10:MERGING-EXCHANGE                                                 |
|                                                                       |
| PLAN FRAGMENT 1                                                       |
|  OUTPUT EXPRS:                                                        |
|   PARTITION: HASH_PARTITIONED: 6: age                                 |
|                                                                       |
|   STREAM DATA SINK                                                    |
|     EXCHANGE ID: 10                                                   |
|     UNPARTITIONED                                                     |
|                                                                       |
|   9:SORT                                                              |
|   |  order by: <slot 8> 8: count DESC                                 |
|   |  offset: 0                                                        |
|   |                                                                   |
|   8:AGGREGATE (merge finalize)                                        |
|   |  output: count(8: count)                                          |
|   |  group by: 6: age                                                 |
|   |                                                                   |
|   7:EXCHANGE                                                          |
|                                                                       |
| PLAN FRAGMENT 2                                                       |
|  OUTPUT EXPRS:                                                        |
|   colocate exec groups: ExecGroup{groupId=3, nodeIds=[0, 1, 4, 5, 6]} |
|   PARTITION: RANDOM                                                   |
|                                                                       |
|   STREAM DATA SINK                                                    |
|     EXCHANGE ID: 07                                                   |
|     HASH_PARTITIONED: 6: age                                          |
|                                                                       |
|   6:AGGREGATE (update serialize)                                      |
|   |  STREAMING                                                        |
|   |  output: count(1: event_id)                                       |
|   |  group by: 6: age                                                 |
|   |                                                                   |
|   5:Project                                                           |
|   |  <slot 1> : 1: event_id                                           |
|   |  <slot 6> : 6: age                                                |
|   |                                                                   |
|   4:HASH JOIN                                                         |
|   |  join op: INNER JOIN (BUCKET_SHUFFLE)                             |
|   |  colocate: false, reason:                                         |
|   |  equal join conjunct: 2: user_id = 5: user_id                     |
|   |                                                                   |
|   |----3:EXCHANGE                                                     |
|   |                                                                   |
|   1:Project                                                           |
|   |  <slot 1> : 1: event_id                                           |
|   |  <slot 2> : 2: user_id                                            |
|   |                                                                   |
|   0:OlapScanNode                                                      |
|      TABLE: user_events                                               |
|      PREAGGREGATION: ON                                               |
|      PREDICATES: 3: event_type = 'purchase'                           |
|      partitions=1/1                                                   |
|      rollup: user_events                                              |
|      tabletRatio=4/4                                                  |
|      tabletList=81270,81271,81272,81273                               |
|      cardinality=333333                                               |
|      avgRowSize=21.667553                                             |
|                                                                       |
| PLAN FRAGMENT 3                                                       |
|  OUTPUT EXPRS:                                                        |
|   PARTITION: RANDOM                                                   |
|                                                                       |
|   STREAM DATA SINK                                                    |
|     EXCHANGE ID: 03                                                   |
|     BUCKET_SHUFFLE_HASH_PARTITIONED: 5: user_id                       |
|                                                                       |
|   2:OlapScanNode                                                      |
|      TABLE: users                                                     |
|      PREAGGREGATION: ON                                               |
|      partitions=1/1                                                   |
|      rollup: users                                                    |
|      tabletRatio=4/4                                                  |
|      tabletList=81262,81263,81264,81265                               |
|      cardinality=10000                                                |
|      avgRowSize=12.0                                                  |
+-----------------------------------------------------------------------+
83 rows in set (0.09 sec)
When you analyze an EXPLAIN output, focus on the following areas:
-
SCANoperators — identify which tables, partitions, and tablets are scanned, and verify whether predicates are pushed down. In the example,OlapScanNodefor theuser_eventstable applies theevent_type = 'purchase'predicate during scanning. -
JOINoperators — review the join order, join type, join strategy, and join conditions. In the example, StarRocks uses aHASH JOINoperator with theBUCKET_SHUFFLEdistribution strategy. -
AGGREGATEoperators — determine where partial and final aggregation steps occur. In the example, theupdate serializestage is the partial aggregation step, and themerge finalizestage is the final aggregation step. -
EXCHANGEoperators — look for data movement between nodes, including shuffle, broadcast, and gather operations. In the example,EXCHANGEoperators redistribute intermediate results between plan fragments. -
Cardinality estimates — verify whether estimated row counts are realistic.
If the plan does not meet your expectations, start with query-level changes such as rewriting the query, adding filters earlier, adjusting join conditions, or refreshing optimizer statistics. If these changes are not enough, review schema tuning or consider query hints.
EXPLAIN ANALYZE
The EXPLAIN ANALYZE statement runs a query and displays the actual execution plan together with runtime statistics. Unlike EXPLAIN, it provides real execution information, such as operator-level timing, row counts, and resource usage. Use it when the logical plan looks acceptable, but the query still runs slowly.
StarRocks supports EXPLAIN ANALYZE for SELECT and INSERT INTO statements. For INSERT INTO statements, StarRocks can analyze the query profile without actually loading data. This is supported for internal tables in the default_catalog catalog. In this mode, StarRocks analyzes the query but automatically cancels the load operation to prevent unintended data changes. See details in StarRocks documentation.
Syntax:
EXPLAIN ANALYZE <sql_statement>;Example:
EXPLAIN ANALYZE
SELECT u.age, count(e.event_id) AS total_events
FROM user_events e
JOIN users u ON e.user_id = u.user_id
WHERE e.event_type = 'purchase'
GROUP BY u.age
ORDER BY total_events DESC;+--------------------------------------------------------------------------------------------------------------------------------------------------------------+ | Explain String | +--------------------------------------------------------------------------------------------------------------------------------------------------------------+ | Summary | | QueryId: 01a0c3d7-f4fc-73b7-b233-d679d08c631e | | Version: 4.0.10.1-4.4.0-0-fd9add6 | | State: Finished | | TotalTime: 63ms | | ExecutionTime: 24.368ms [Scan: 6.170ms (25.32%), Network: 6.923ms (28.41%), ResultDeliverTime: 0ns (0.00%), ScheduleTime: 22.641ms (92.91%)] | | CollectProfileTime: 5ms | | FrontendProfileMergeTime: 15.092ms | | QueryPeakMemoryUsage: ?, QueryAllocatedMemoryUsage: 35.019 MB | | Top Most Time-consuming Nodes: | | 1. HASH_JOIN (id=4) [BUCKET_SHUFFLE, INNER JOIN]: 7.017ms (29.78%) | | 2. OLAP_SCAN (id=0) : 6.246ms (26.51%) | | 3. EXCHANGE (id=7) [SHUFFLE]: 4.980ms (21.14%) | | 4. EXCHANGE (id=3) [SHUFFLE]: 1.706ms (7.24%) | | 5. MERGE_EXCHANGE (id=10) [GATHER]: 1.430ms (6.07%) | | 6. OLAP_SCAN (id=2) : 1.068ms (4.53%) | | 7. AGGREGATION (id=6) [serialize, update]: 605.244us (2.57%) | | 8. SORT (id=9) [ROW_NUMBER, SORT]: 162.046us (0.69%) | | 9. AGGREGATION (id=8) [finalize, merge]: 141.763us (0.60%) | | 10. RESULT_SINK: 100.992us (0.43%) | | Top Most Memory-consuming Nodes: | | NonDefaultVariables: | | enable_adaptive_sink_dop: false -> true | | enable_async_profile: true -> false | | enable_profile: false -> true | | Fragment 0 | | │ BackendNum: 1 | | │ InstancePeakMemoryUsage: 66.227 KB, InstanceAllocatedMemoryUsage: 162.500 KB | | │ PrepareTime: ? | | └──RESULT_SINK | | │ TotalTime: 100.992us (0.43%) [CPUTime: 100.992us] | | │ OutputRows: 60 | | │ SinkType: MYSQL_PROTOCAL | | └──MERGE_EXCHANGE (id=10) [GATHER] | | Estimates: [row: 60, cpu: 720.00, memory: 720.00, network: 720.00, cost: 11940955.65] | | TotalTime: 1.430ms (6.07%) [CPUTime: 329.854us, NetworkTime: 1.100ms] | | OutputRows: 60 | | PeakMemory: ?, AllocatedMemory: ? | | | | Fragment 1 | | │ BackendNum: 3 | | │ InstancePeakMemoryUsage: 739.049 KB, InstanceAllocatedMemoryUsage: 2.763 MB | | │ PrepareTime: ? | | └──DATA_STREAM_SINK (id=10) | | │ PartitionType: UNPARTITIONED | | └──SORT (id=9) [ROW_NUMBER, SORT] | | │ Estimates: [row: 60, cpu: 720.00, memory: 720.00, network: 720.00, cost: 11938075.65] | | │ TotalTime: 162.046us (0.69%) [CPUTime: 162.046us] | | │ OutputRows: 60 | | │ PeakMemory: ?, AllocatedMemory: ? | | │ OrderByExprs: [<slot 8> 8: count] | | └──AGGREGATION (id=8) [finalize, merge] | | │ Estimates: [row: 60, cpu: 720.00, memory: 720.00, network: 0.00, cost: 11935195.65] | | │ TotalTime: 141.763us (0.60%) [CPUTime: 141.763us] | | │ OutputRows: 60 | | │ PeakMemory: ?, AllocatedMemory: ? | | │ AggExprs: [count(8: count)] | | │ GroupingExprs: [6: age] | | └──EXCHANGE (id=7) [SHUFFLE] | | Estimates: [row: 60, cpu: 72.00, memory: 0.00, network: 72.00, cost: 11933395.65] | | TotalTime: 4.980ms (21.14%) [CPUTime: 454.472us, NetworkTime: 4.526ms] | | OutputRows: 720 | | PeakMemory: ?, AllocatedMemory: ? | | Detail Timers: | | OverallTime: 3.487ms [min=1.709ms, max=4.747ms] | | WaitTime: 3.334ms [min=1.538ms, max=4.624ms] | | | | Fragment 2 | | │ BackendNum: 3 | | │ InstancePeakMemoryUsage: 3.932 MB, InstanceAllocatedMemoryUsage: 29.957 MB | | │ PrepareTime: ? | | └──DATA_STREAM_SINK (id=7) | | │ PartitionType: HASH_PARTITIONED | | │ PartitionExprs: [6: age] | | └──AGGREGATION (id=6) [serialize, update] | | │ Estimates: [row: 60, cpu: 927305.85, memory: 72.00, network: 0.00, cost: 11933251.65] | | │ TotalTime: 605.244us (2.57%) [CPUTime: 605.244us] | | │ OutputRows: 720 | | │ PeakMemory: ?, AllocatedMemory: ? | | │ AggExprs: [count(1: event_id)] | | │ GroupingExprs: [6: age] | | │ SubordinateOperators: | | │ LOCAL_EXCHANGE [Passthrough] | | └──PROJECT (id=5) | | │ Estimates: [row: ?, cpu: ?, memory: ?, network: ?, cost: ?] | | │ TotalTime: 31.415us (0.13%) [CPUTime: 31.415us] | | │ OutputRows: 333.649K (333649) | | │ Expression: [1: event_id, 6: age] | | └──HASH_JOIN (id=4) [BUCKET_SHUFFLE, INNER JOIN] | | │ Estimates: [row: 331180, cpu: 14726391.79, memory: 120000.00, network: 0.00, cost: 11469454.73] | | │ TotalTime: 7.017ms (29.78%) [CPUTime: 7.017ms] | | │ OutputRows: 333.649K (333649) | | │ PeakMemory: ?, AllocatedMemory: ? | | │ BuildTime: 461.809us | | │ ProbeTime: 465.010us | | │ EqJoinConjuncts: [2: user_id = 5: user_id] | | │ SubordinateOperators: | | │ CHUNK_ACCUMULATE | | │ LOCAL_EXCHANGE [Partition(BUCKET_SHUFFLE_HASH_PARTITIONED)] | | ├──<PROBE> PROJECT (id=1) | | │ │ Estimates: [row: ?, cpu: ?, memory: ?, network: ?, cost: ?] | | │ │ TotalTime: 70.353us (0.30%) [CPUTime: 70.353us] | | │ │ OutputRows: 333.649K (333649) | | │ │ Expression: [1: event_id, 2: user_id] | | │ └──OLAP_SCAN (id=0) | | │ Estimates: [row: 333333, cpu: 7222517.67, memory: 0.00, network: 0.00, cost: 3611258.83] | | │ TotalTime: 6.246ms (26.51%) [CPUTime: 635.010us, ScanTime: 5.611ms] | | │ OutputRows: 333.649K (333649) | | │ RuntimeFilter: 333.649K (333649) -> 333.649K (333649) (0.00%) | | │ Table: : user_events | | │ SubordinateOperators: | | │ CHUNK_ACCUMULATE | | │ Detail Timers: [ScanTime = IOTaskExecTime + IOTaskWaitTime] | | │ IOTaskExecTime: 4.819ms [min=4.443ms, max=5.575ms] | | │ SegmentRead: 3.535ms [min=3.081ms, max=4.286ms] | | │ BlockFetch: 2.122ms [min=1.595ms, max=2.577ms] | | │ IOTaskWaitTime: 32.778us [min=25.964us, max=36.608us] | | └──<BUILD> EXCHANGE (id=3) [SHUFFLE] | | Estimates: [row: 10000, cpu: 120000.00, memory: 0.00, network: 120000.00, cost: 300000.00] | | TotalTime: 1.706ms (7.24%) [CPUTime: 409.628us, NetworkTime: 1.296ms] | | OutputRows: 10.000K (10000) | | PeakMemory: ?, AllocatedMemory: ? | | | | Fragment 3 | | │ BackendNum: 3 | | │ InstancePeakMemoryUsage: 315.516 KB, InstanceAllocatedMemoryUsage: 2.140 MB | | │ PrepareTime: ? | | └──DATA_STREAM_SINK (id=3) | | │ PartitionType: BUCKET_SHUFFLE_HASH_PARTITIONED | | │ PartitionExprs: [5: user_id] | | └──OLAP_SCAN (id=2) | | Estimates: [row: 10000, cpu: 120000.00, memory: 0.00, network: 0.00, cost: 60000.00] | | TotalTime: 1.068ms (4.53%) [CPUTime: 509.054us, ScanTime: 559.300us] | | OutputRows: 10.000K (10000) | | Table: : users | | | +--------------------------------------------------------------------------------------------------------------------------------------------------------------+ 136 rows in set (0.08 sec)
When analyzing the output of EXPLAIN ANALYZE, first examine the Summary section at the beginning of the profile. It contains summary information for the entire query: the query ID, StarRocks version, execution state, total execution time, memory usage, and the list of operators that took the most time. In this example, the most time-consuming operators are HASH_JOIN, OLAP_SCAN, and EXCHANGE, so the main areas for optimization are join processing, table scanning, and data redistribution.
After analyzing the Summary, proceed to the operator tree, which starts below with the Fragment sections. In this part of the output, metrics no longer refer to the entire query but to individual plan operators. Read the operator tree from bottom to top: start with the SCAN operators and trace the data flow through JOIN, AGGREGATE, EXCHANGE, SORT, and RESULT_SINK.
For each operator, compare the optimizer estimates with the runtime metrics. Large differences between estimated and actual row counts can indicate outdated or missing optimizer statistics.
Pay special attention to the following metrics:
-
TotalTime— the total time spent by an operator. -
OutputRows— the number of rows produced by an operator. Compare it withEstimatesto detect inaccurate cardinality estimates. -
CPUTime— the time spent on CPU processing. -
ScanTime— the time spent reading data in scan operators. High values can indicate expensive table scans, insufficient pruning, or inefficient predicate pushdown. -
NetworkTime— the time spent transferring data between nodes. High values inEXCHANGEoperators can indicate expensive data redistribution. -
PeakMemoryandAllocatedMemory— memory usage of an operator, when available. High memory usage is common for joins, aggregations, and sorts.
In this example, the OLAP_SCAN operator for the user_events table reads about 333.649K rows, and HASH_JOIN produces about the same number of rows. The first aggregation then reduces the result to 720 rows before the data is redistributed and finalized. This means that the query scans and joins a relatively large number of rows, but aggregation significantly reduces the intermediate result size.
For deeper runtime diagnostics after query execution, use the query profile.
Query profile
Query profile provides a more detailed runtime view than EXPLAIN ANALYZE. Use it when you need full execution diagnostics for a completed or running query, including memory consumption, network transfer, scan statistics, and detailed operator metrics. See details in StarRocks documentation.
To interpret query profile and speed up slow queries, use StarRocks query profile tuning recommendations described in StarRocks documentation.
Query profile is disabled by default. To collect profiles for all queries in the current session, run:
SET enable_profile = true;|
NOTE
Running |
After the query finishes, view the profile information in one of the following ways:
-
In the StarRocks web UI.
-
By calling the
get_query_profileSQL function:SELECT get_query_profile('<query_id>');where
<query_id>is the identifier of the query you want to analyze (e.g.01a0c845-2b07-781b-9907-2dc78f9b782d).
See details in StarRocks documentation.
Web UI
You can download query profile on the queries page in the StarRocks web UI.
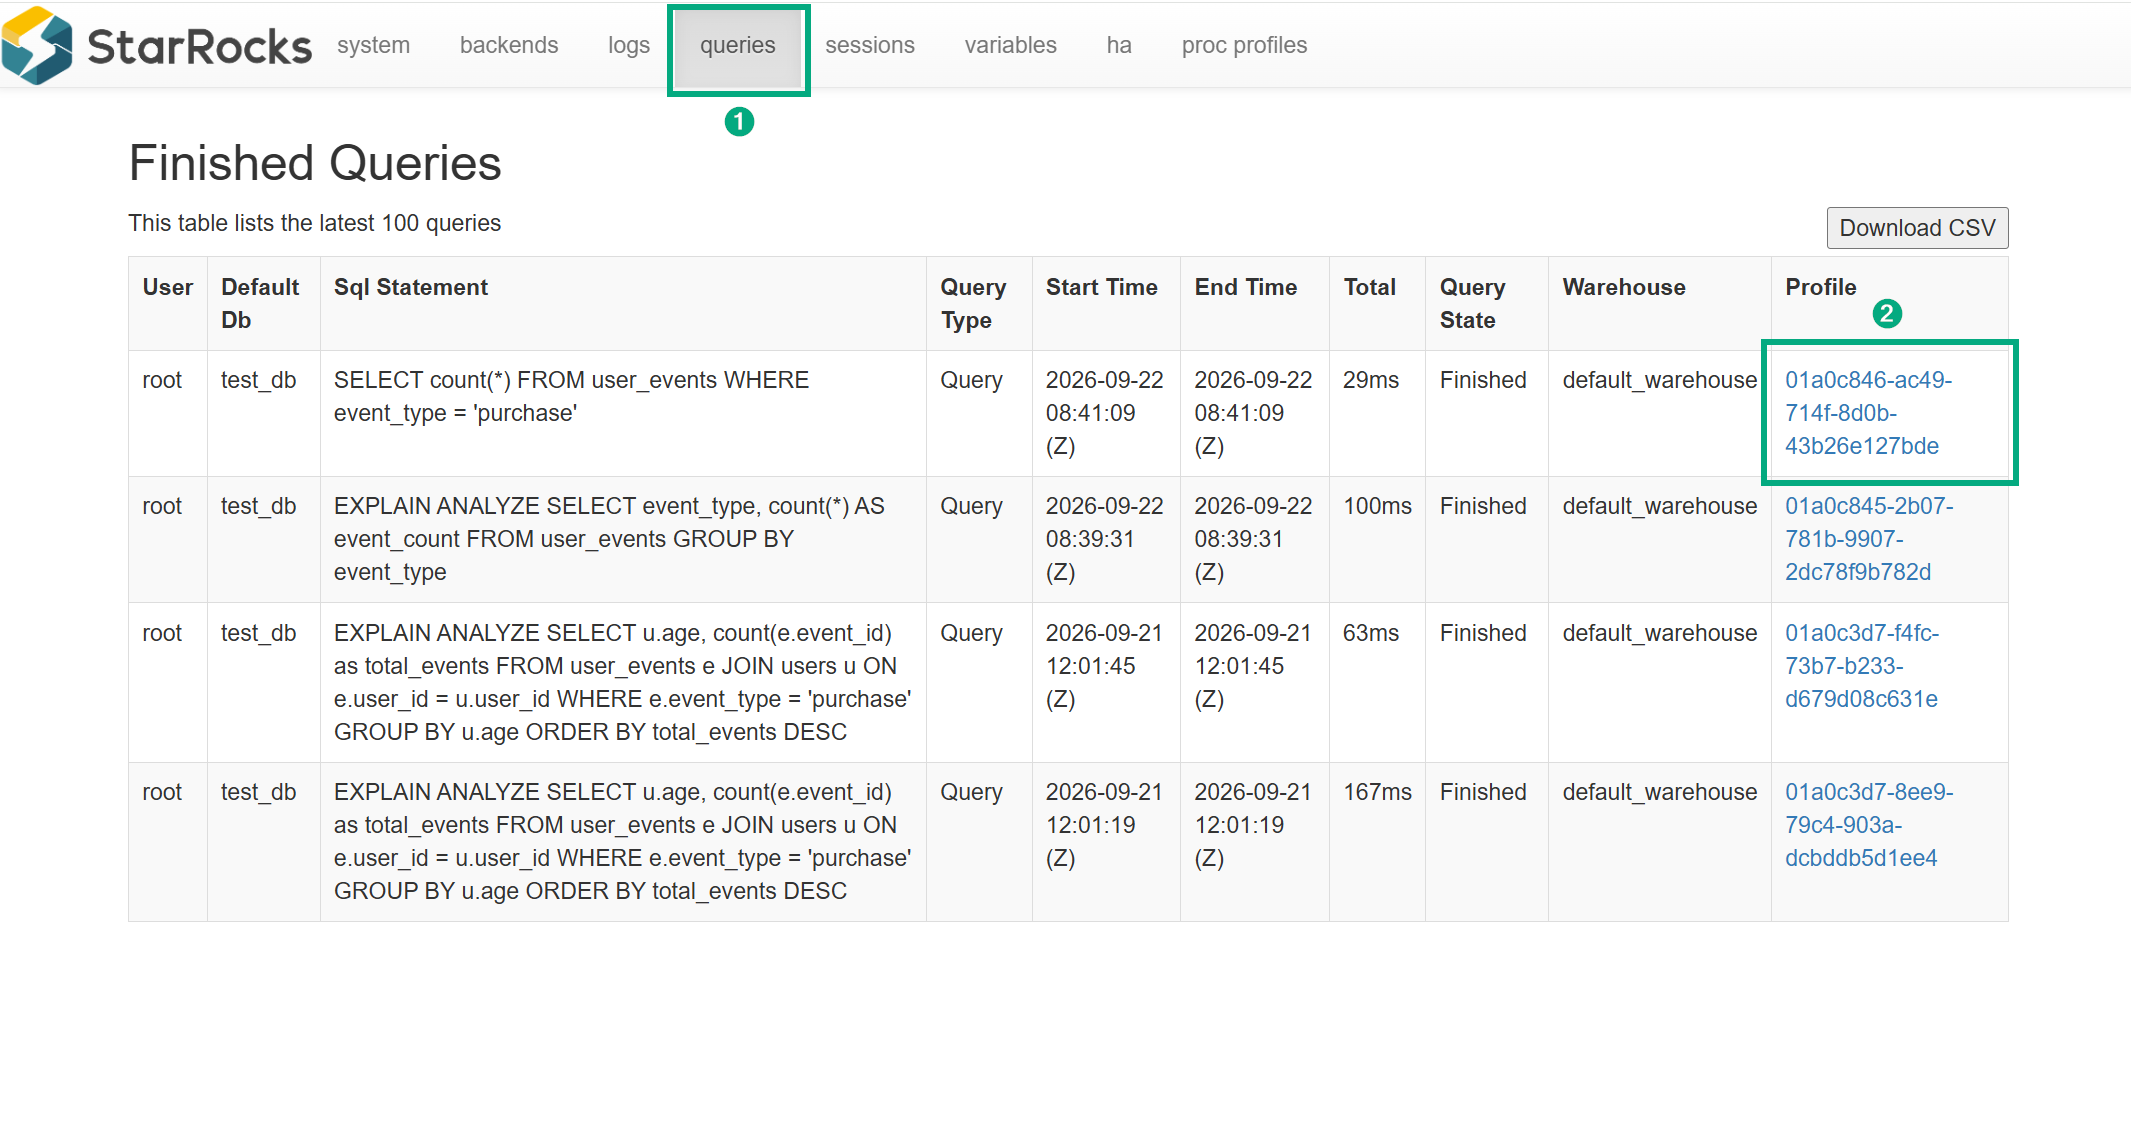
See details in StarRocks documentation.
Schema tuning
If query-level tuning does not sufficiently improve performance, review schema design. In StarRocks, table model, sort key, distribution strategy, partitioning, and materialized views can affect how much data is scanned, moved, and aggregated. See details in StarRocks documentation.
Query hints
Query hints are directives that influence optimizer decisions. Use hints cautiously: they can improve a specific plan, but they can also make queries less adaptive when data volume or distribution changes.
Typical cases for using hints include:
-
Forcing or avoiding a specific join strategy.
-
Adjusting optimizer behavior for a known data distribution.
-
Testing alternative execution plans during troubleshooting.
See details in StarRocks documentation.