YARN UI overview
YARN web interfaces (UI) display diagnostic information and enable access to the logs, configuration, and job status. The UIs are available by the http://<server‑hostname>:<port>/ URL, where <server‑hostname> is the IP address or, if you have configured the redirect in the hosts file, FQDN of a host.
And <port> is the port of the YARN component’s UI.
If you have an SSL certificate configured, use https:// instead of http://.
| Component | URL |
|---|---|
MapReduce History Server |
http://<IP>:19888/jobhistory |
YARN NodeManager |
http://<IP>:8042/node |
YARN ResourceManager (legacy) |
http://<IP>:8088/cluster/cluster |
YARN ResourceManager (UI2) |
http://<IP>:8088/ui2/ |
YARN Timeline Server |
http://<IP>:8188/applicationhistory/ |
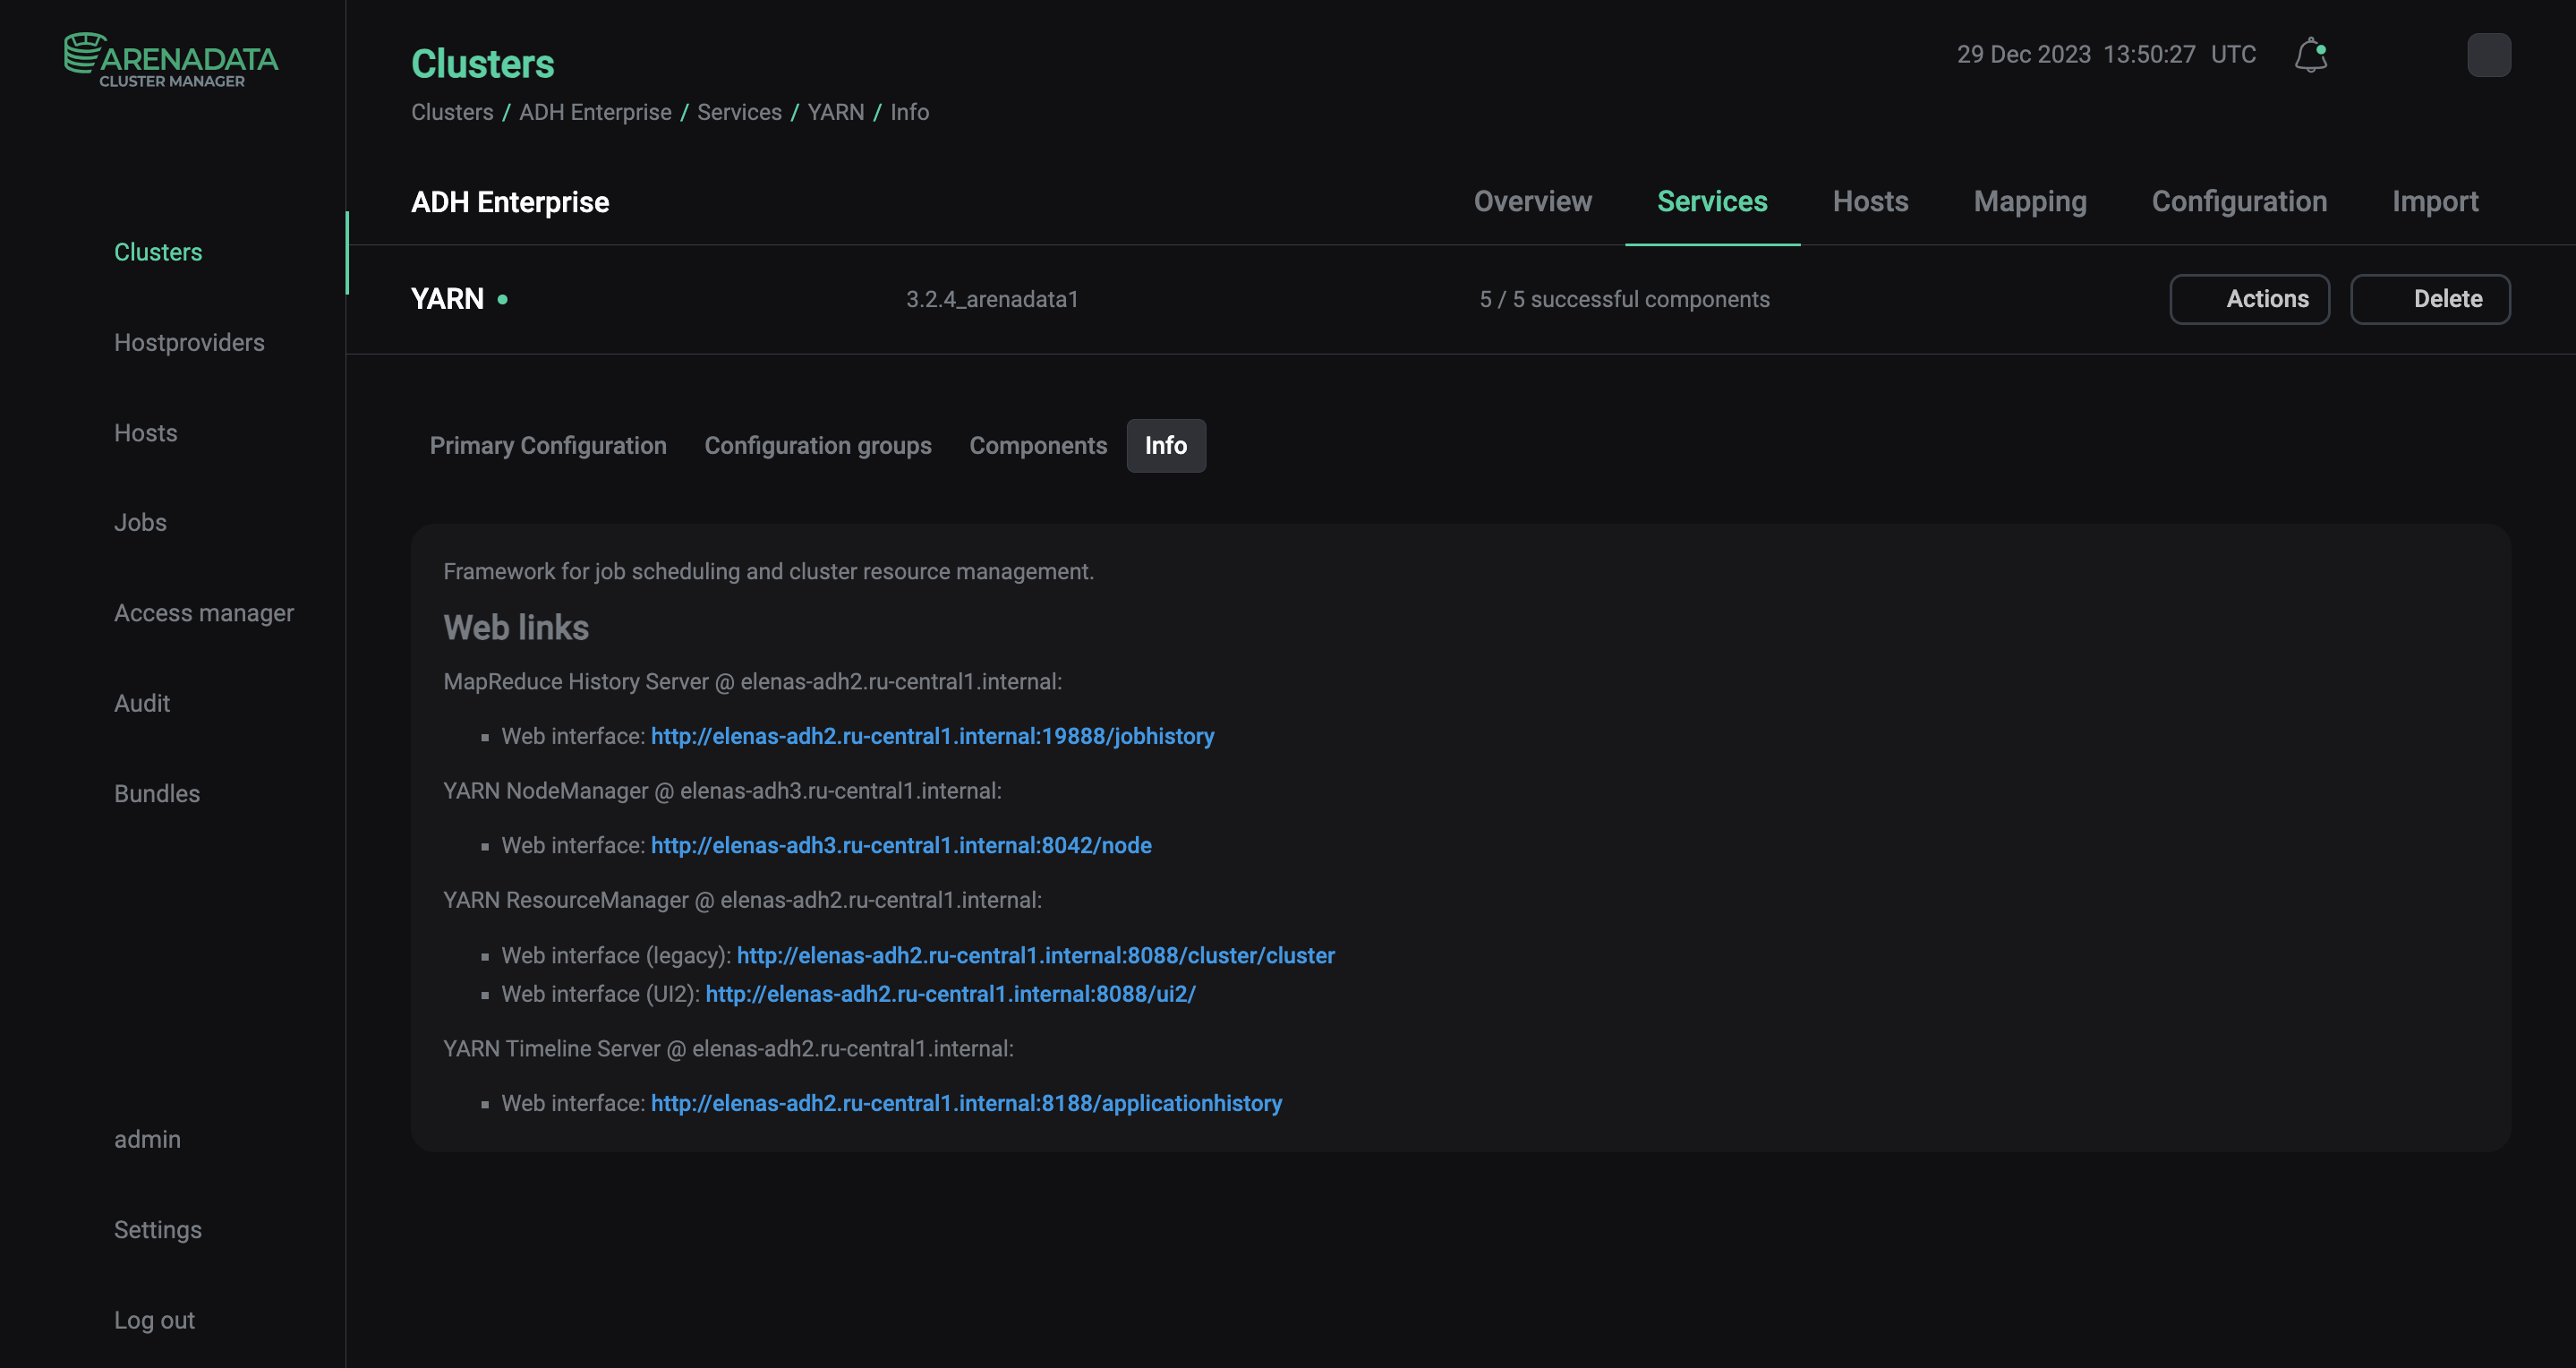
You can find links to YARN UIs in ADCM:
-
On the Clusters page, select the desired cluster.
-
Go to the Services tab and click YARN.
-
Select Info.
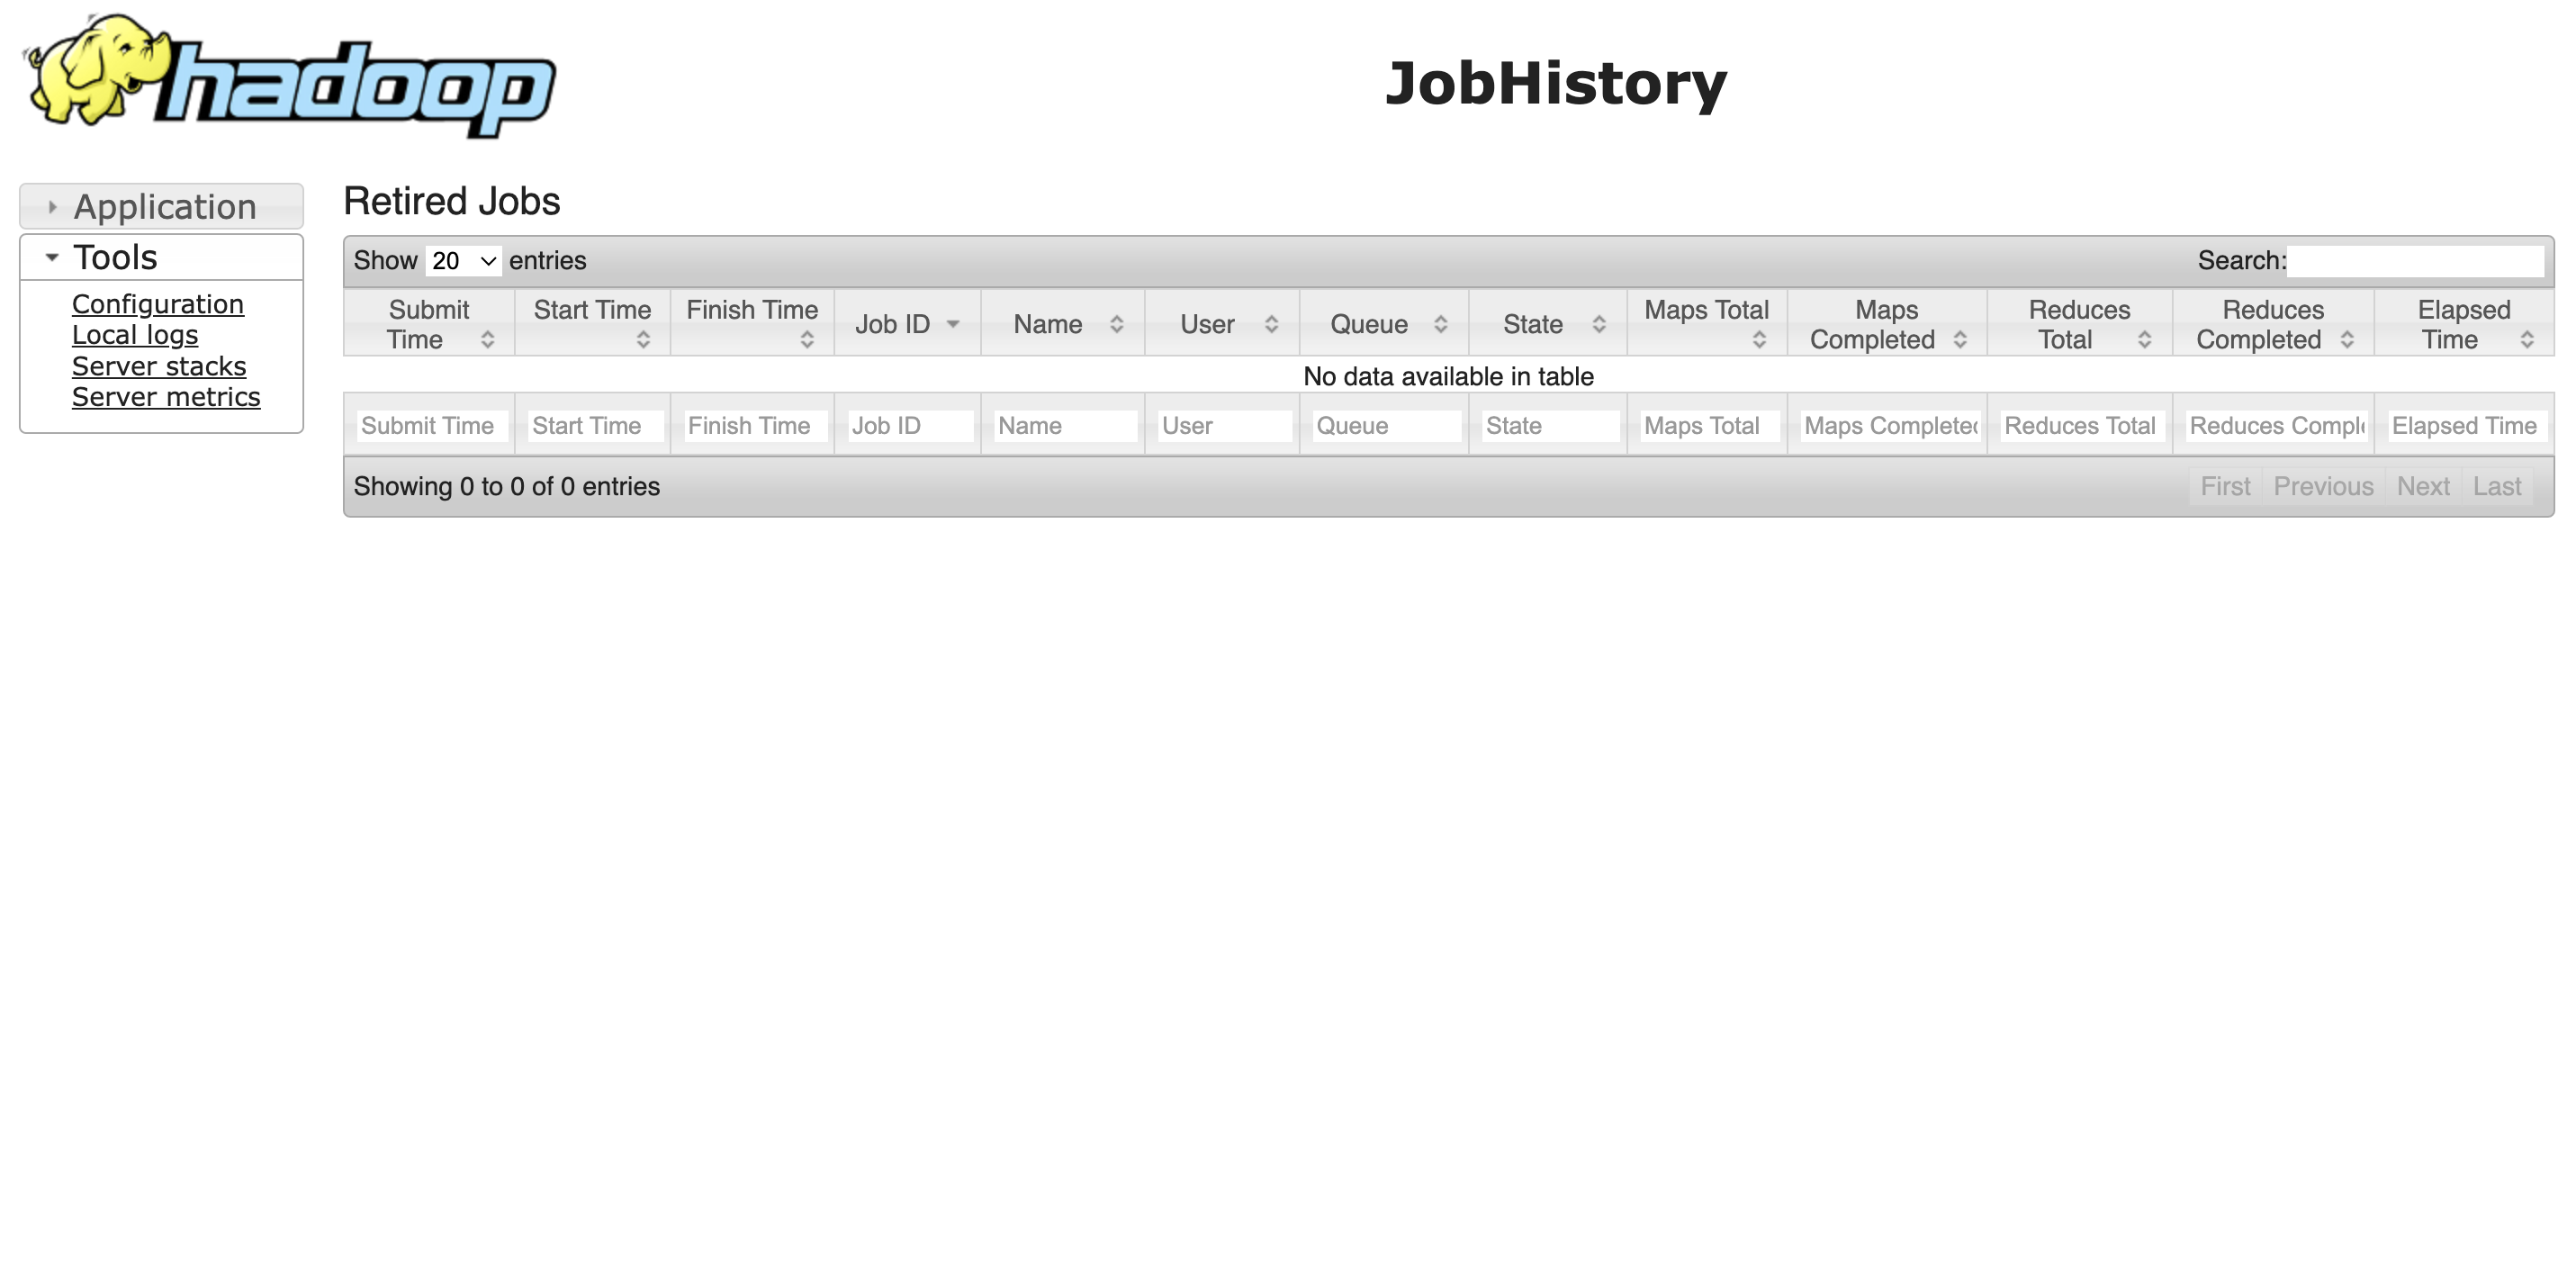
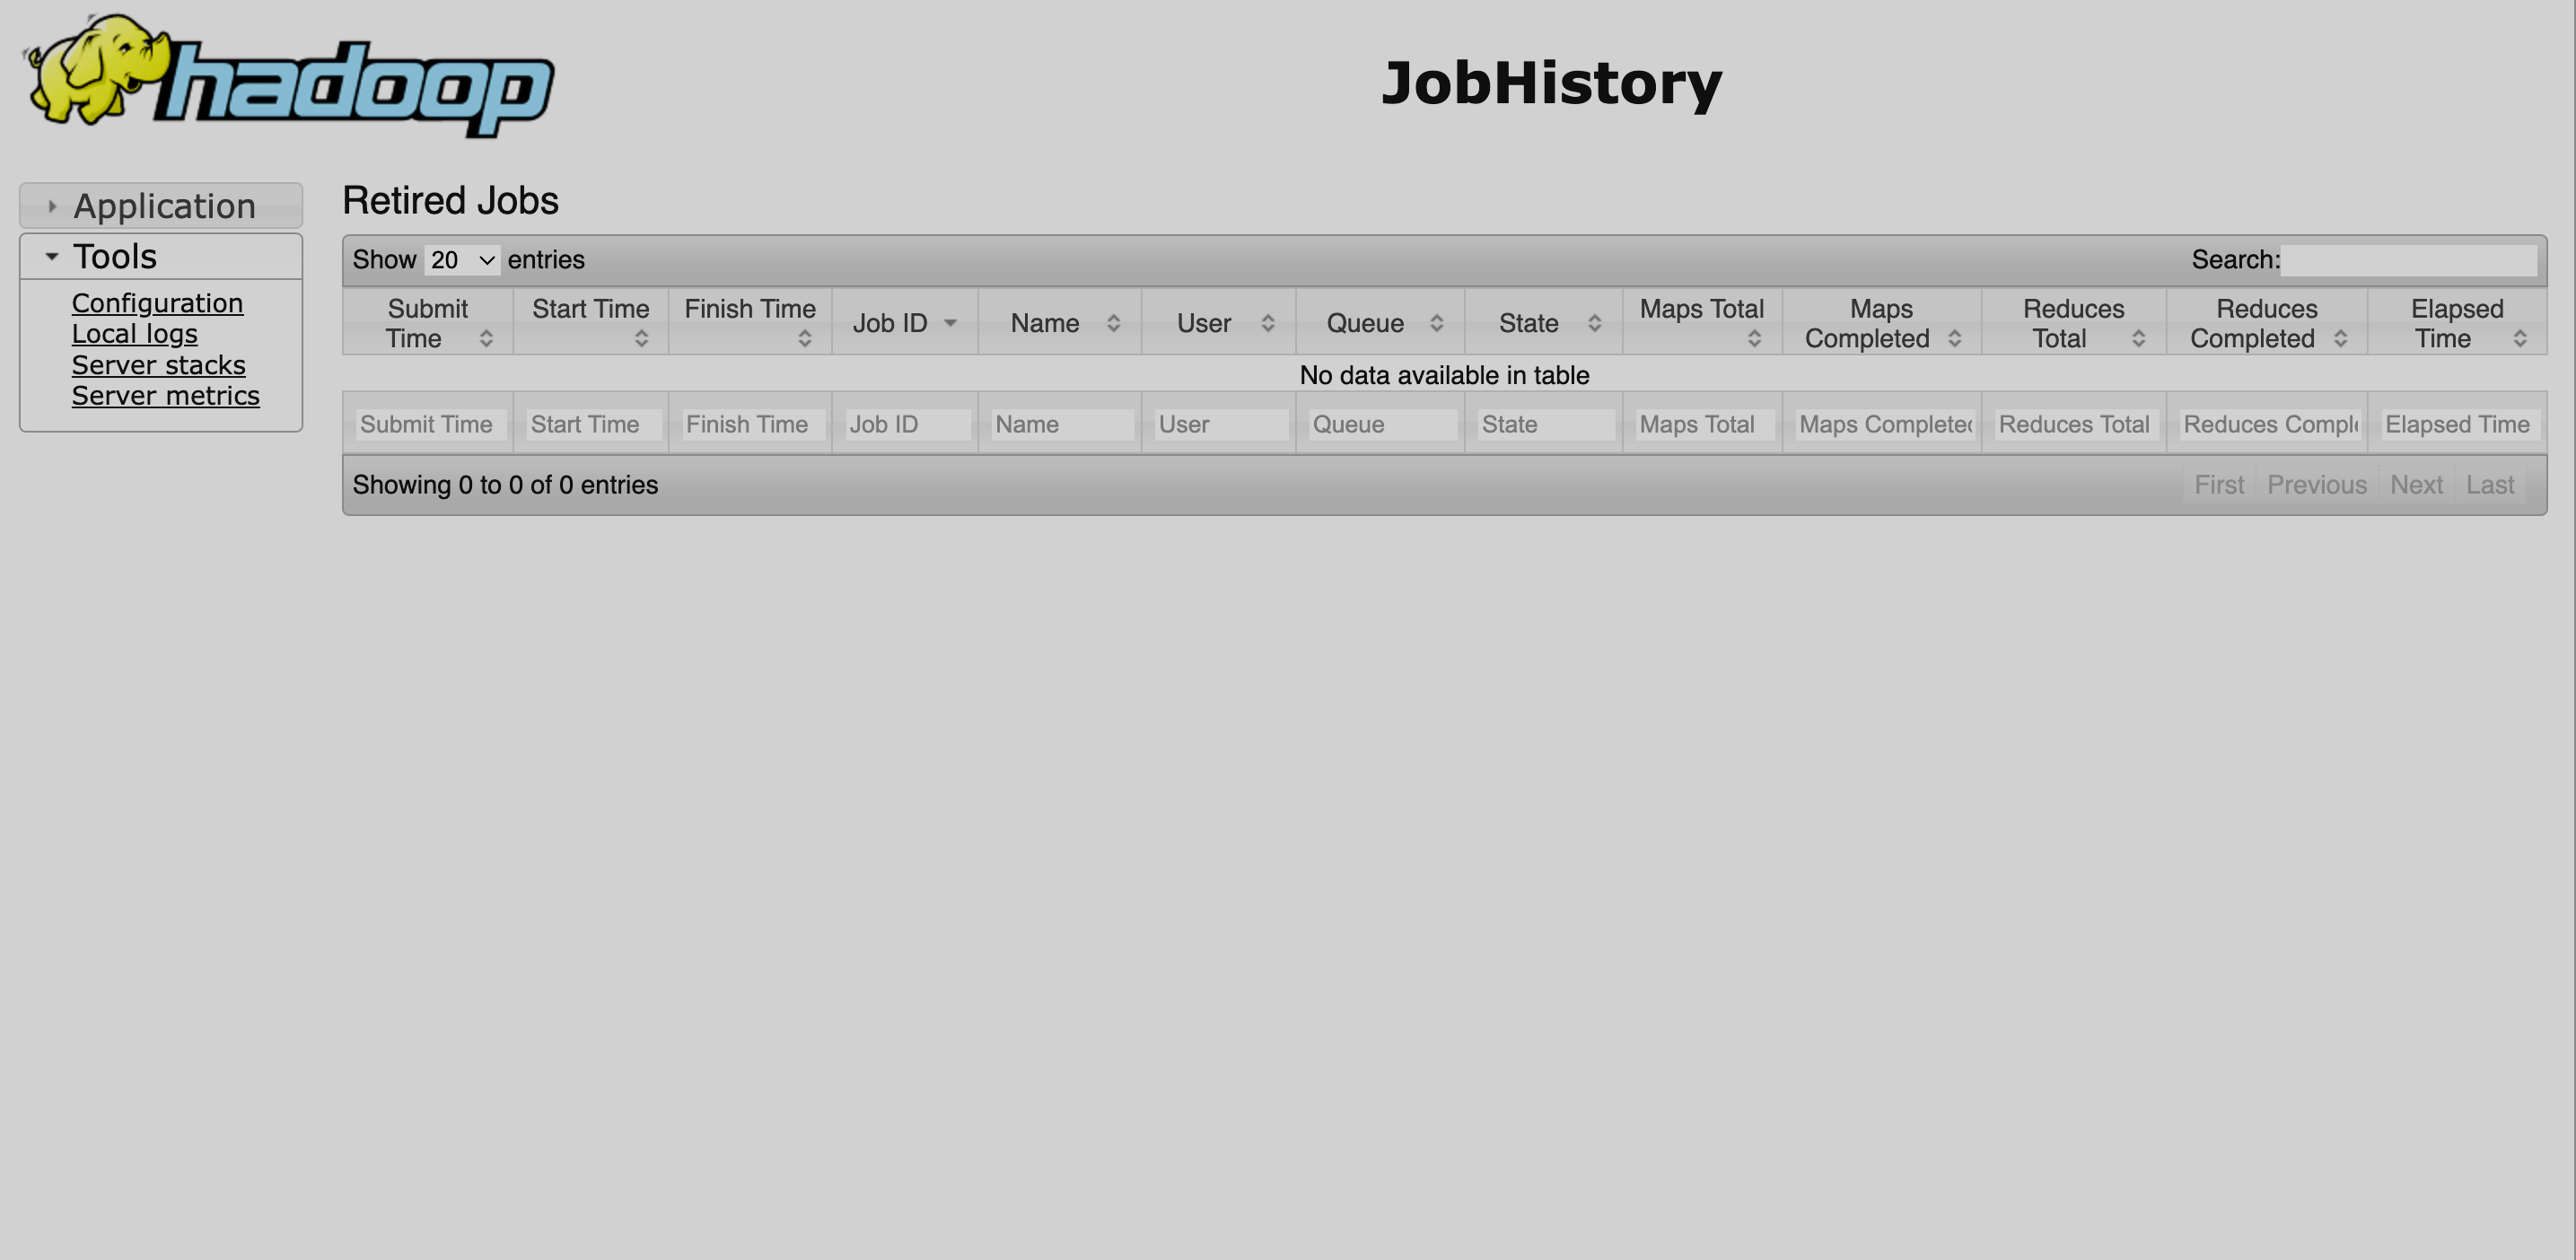
MapReduce History Server
The main MapReduce History Server UI page has a navigation menu on the left with two sections: Applicaion, which contains information about the build version and the server’s start time, and Tools.
The Tools section contains links to the following information:
-
Configuration — an XML file that includes all HDFS and YARN configuration files;
-
Local logs — the list of MapReduce History Server logs located on the host;
-
Server stacks — the list of active threads and their status;
-
Server metrics — the list of JMX metrics.
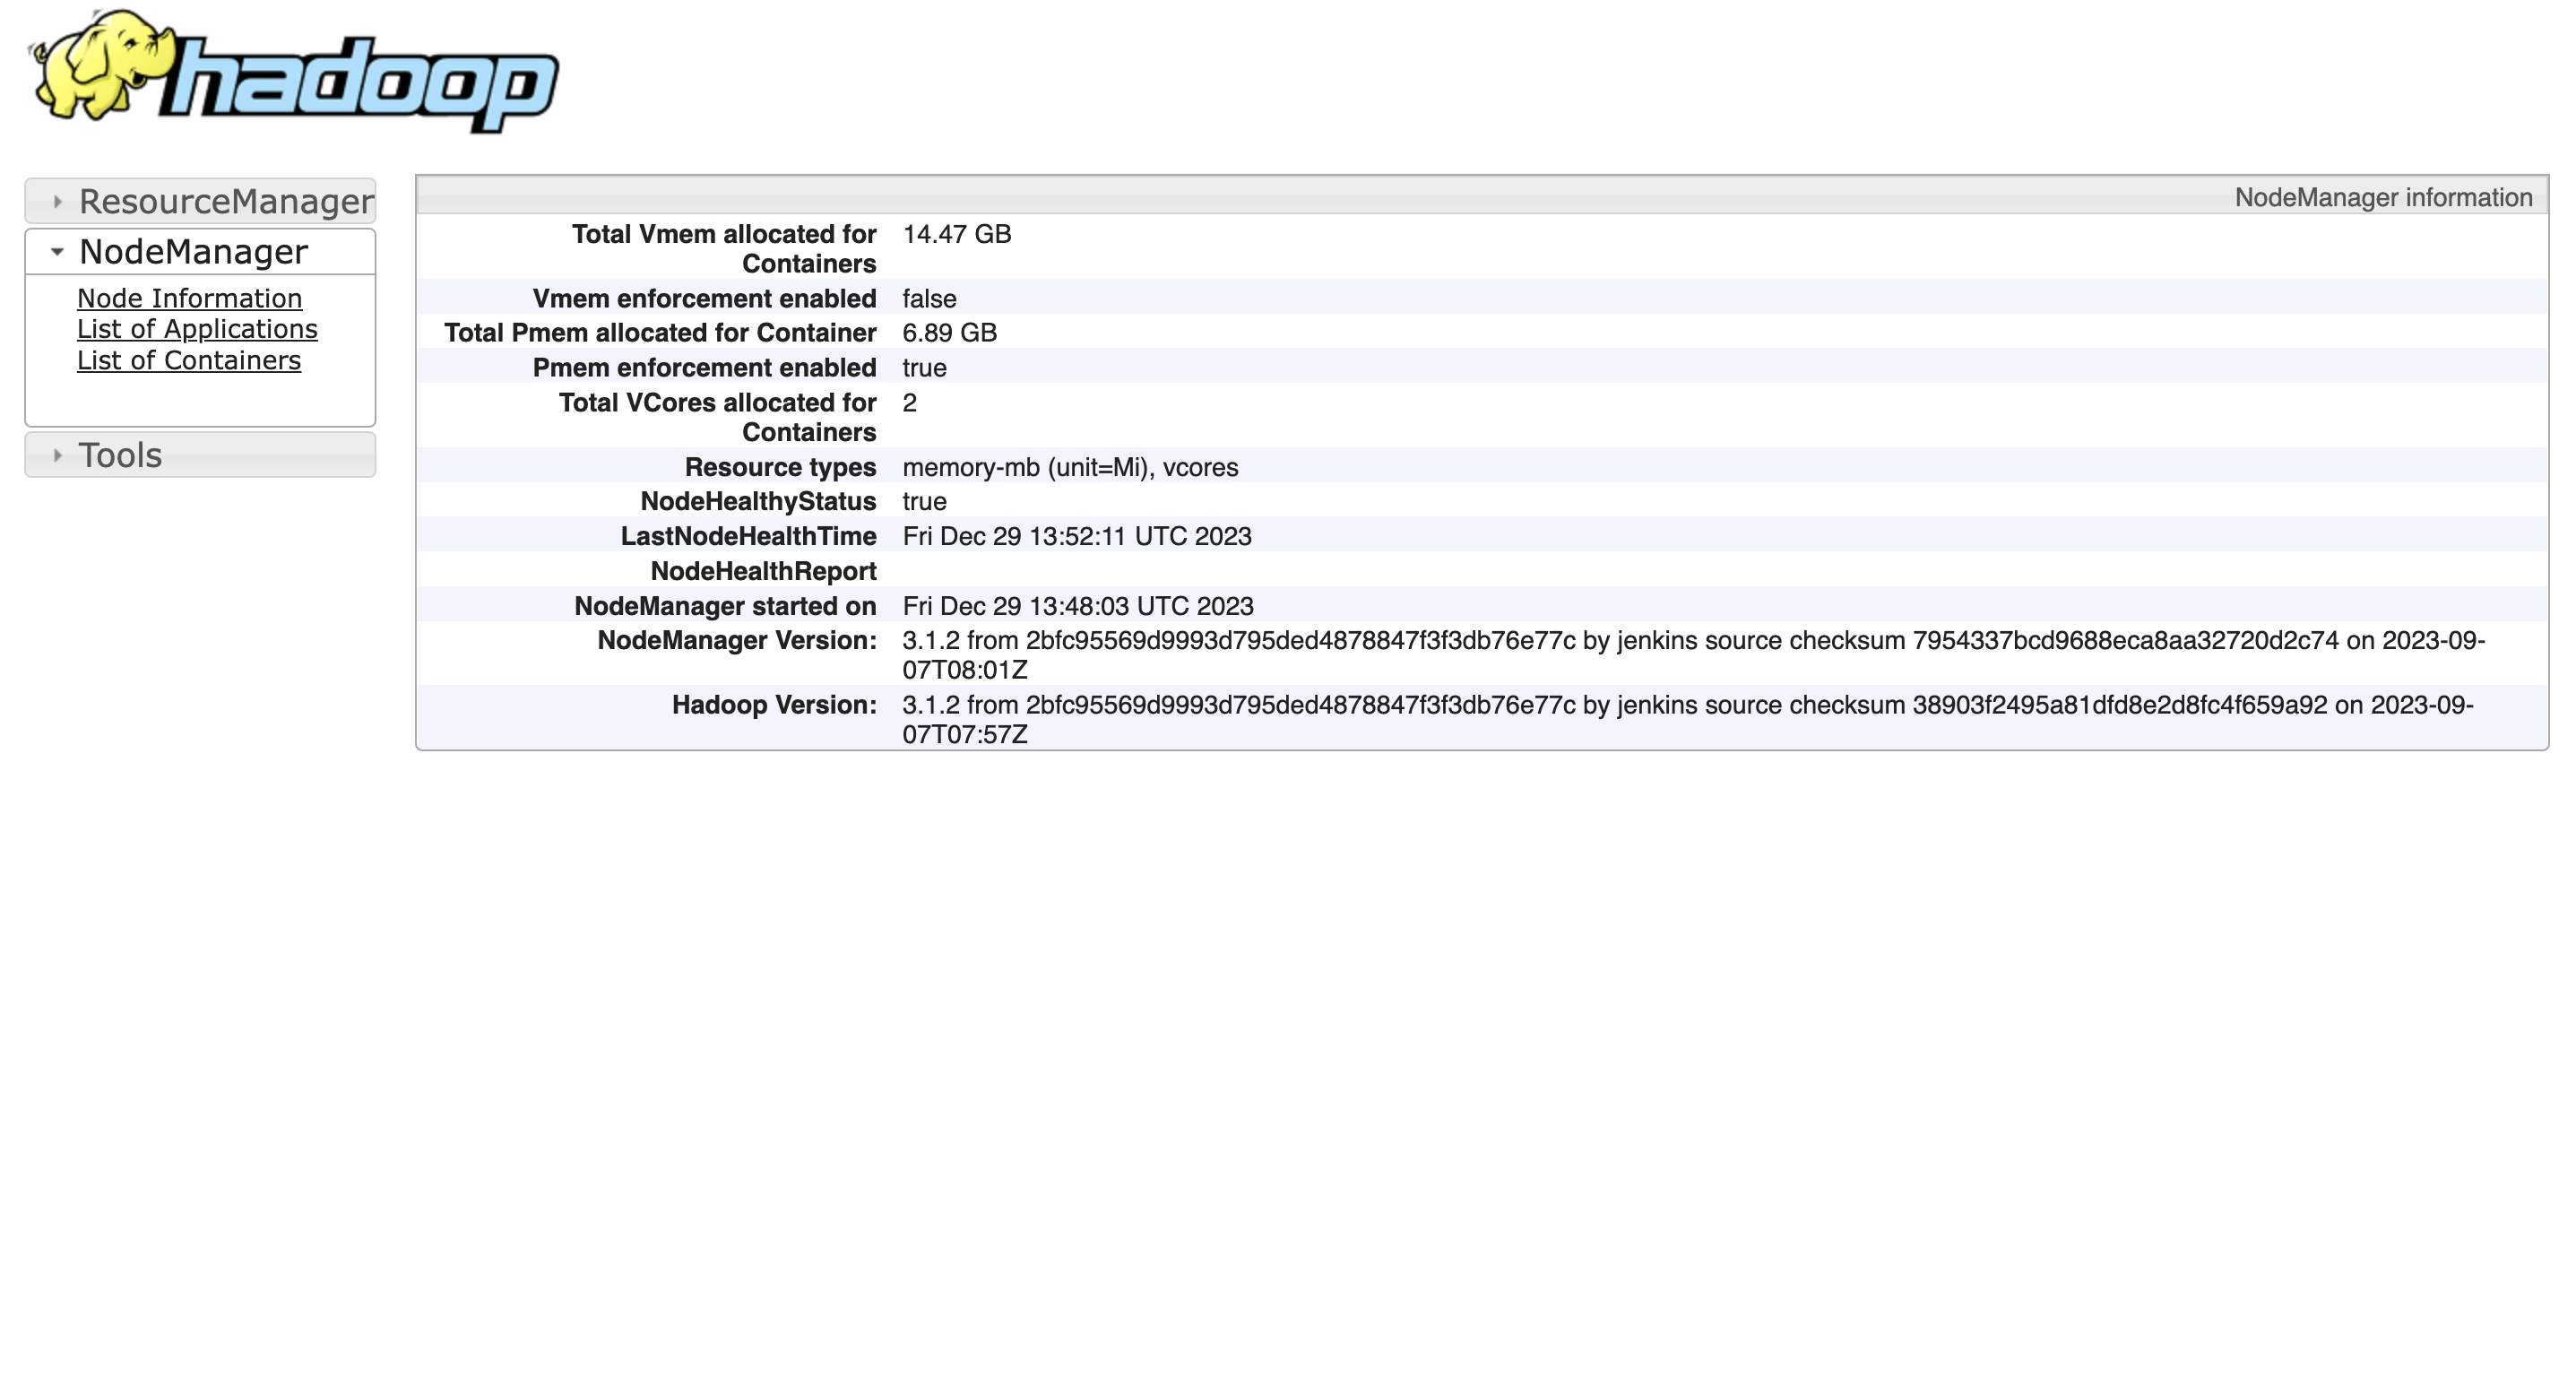
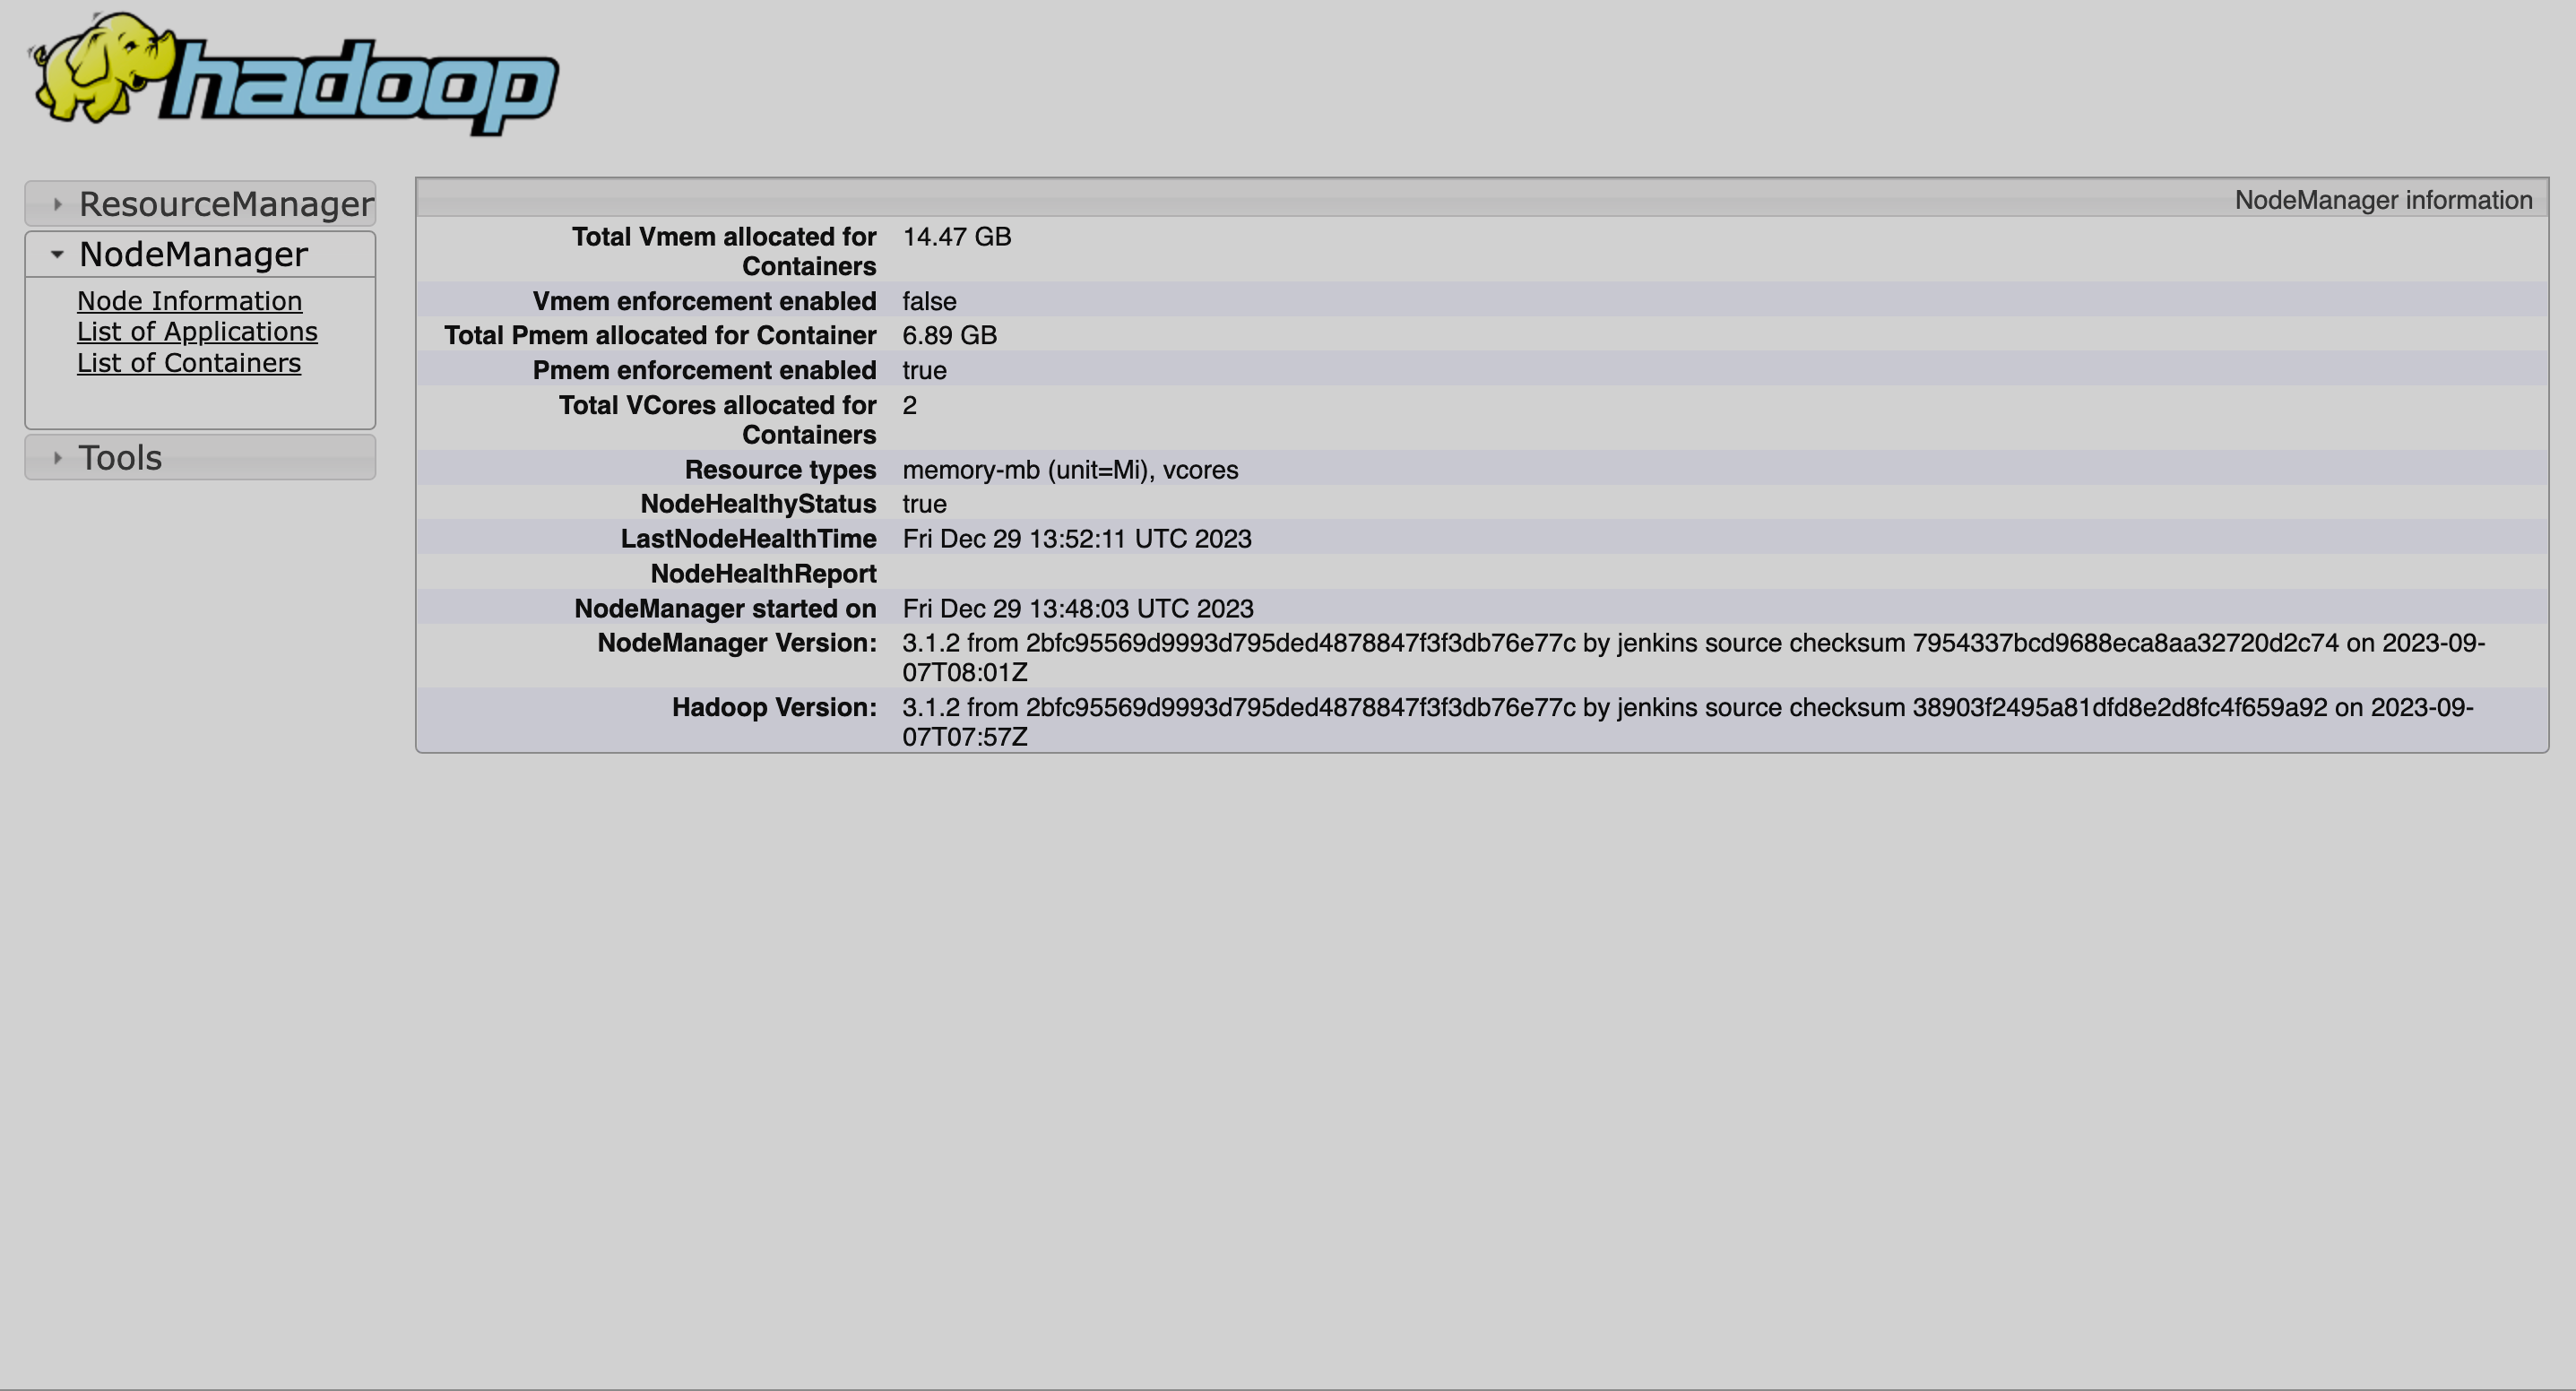
NodeManager
The main NodeManager UI page has a navigation menu on the left with three sections:
-
ResourceManager — contains a link to the ResourceManager UI.
-
NodeManager — contains NodeManager information, the list of running applications, and the list of running containers.
-
Tools — contains links to the following information:
-
Configuration — an XML file that includes all HDFS and YARN configuration files;
-
Local logs — the list of NodeManager logs located on the host;
-
Server stacks — the list of active threads and their status;
-
Server metrics — the list of JMX metrics.
-
ResourceManager
There are two ResourceManager UIs:
-
Legacy UI: http://<IP>:8088/cluster/cluster.
-
UI2: http://<IP>:8088/ui2/.
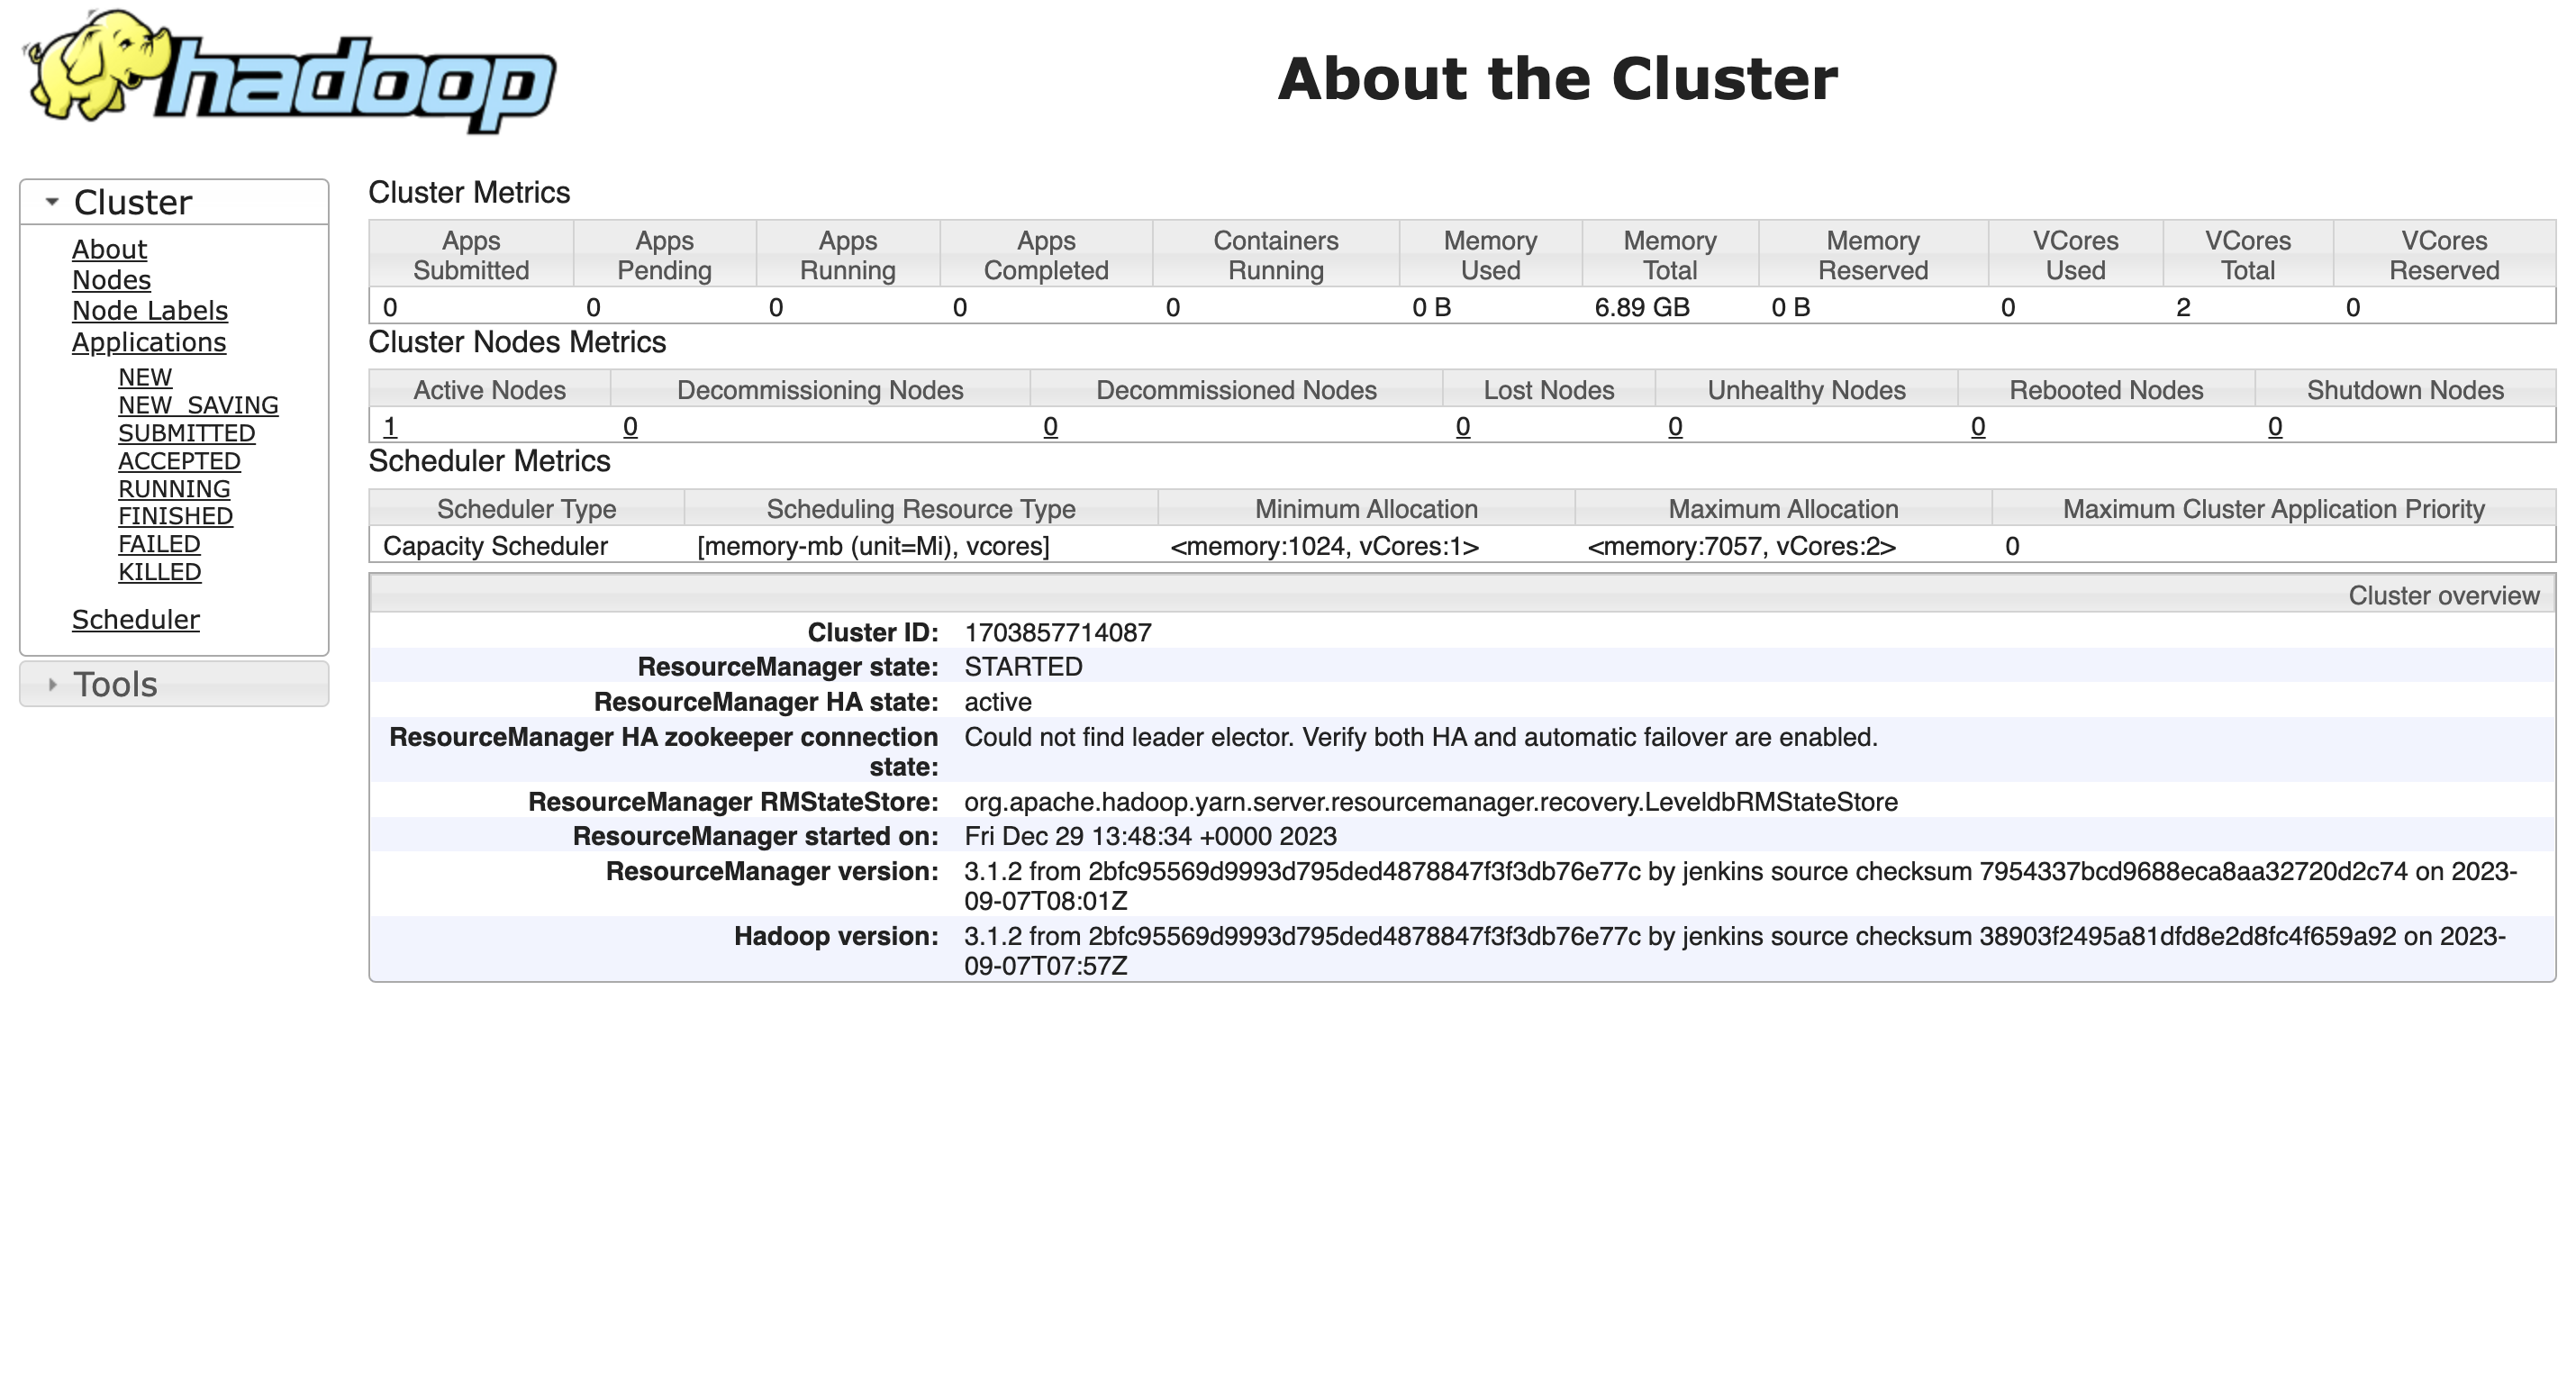
Both web interfaces provide information about the cluster:
-
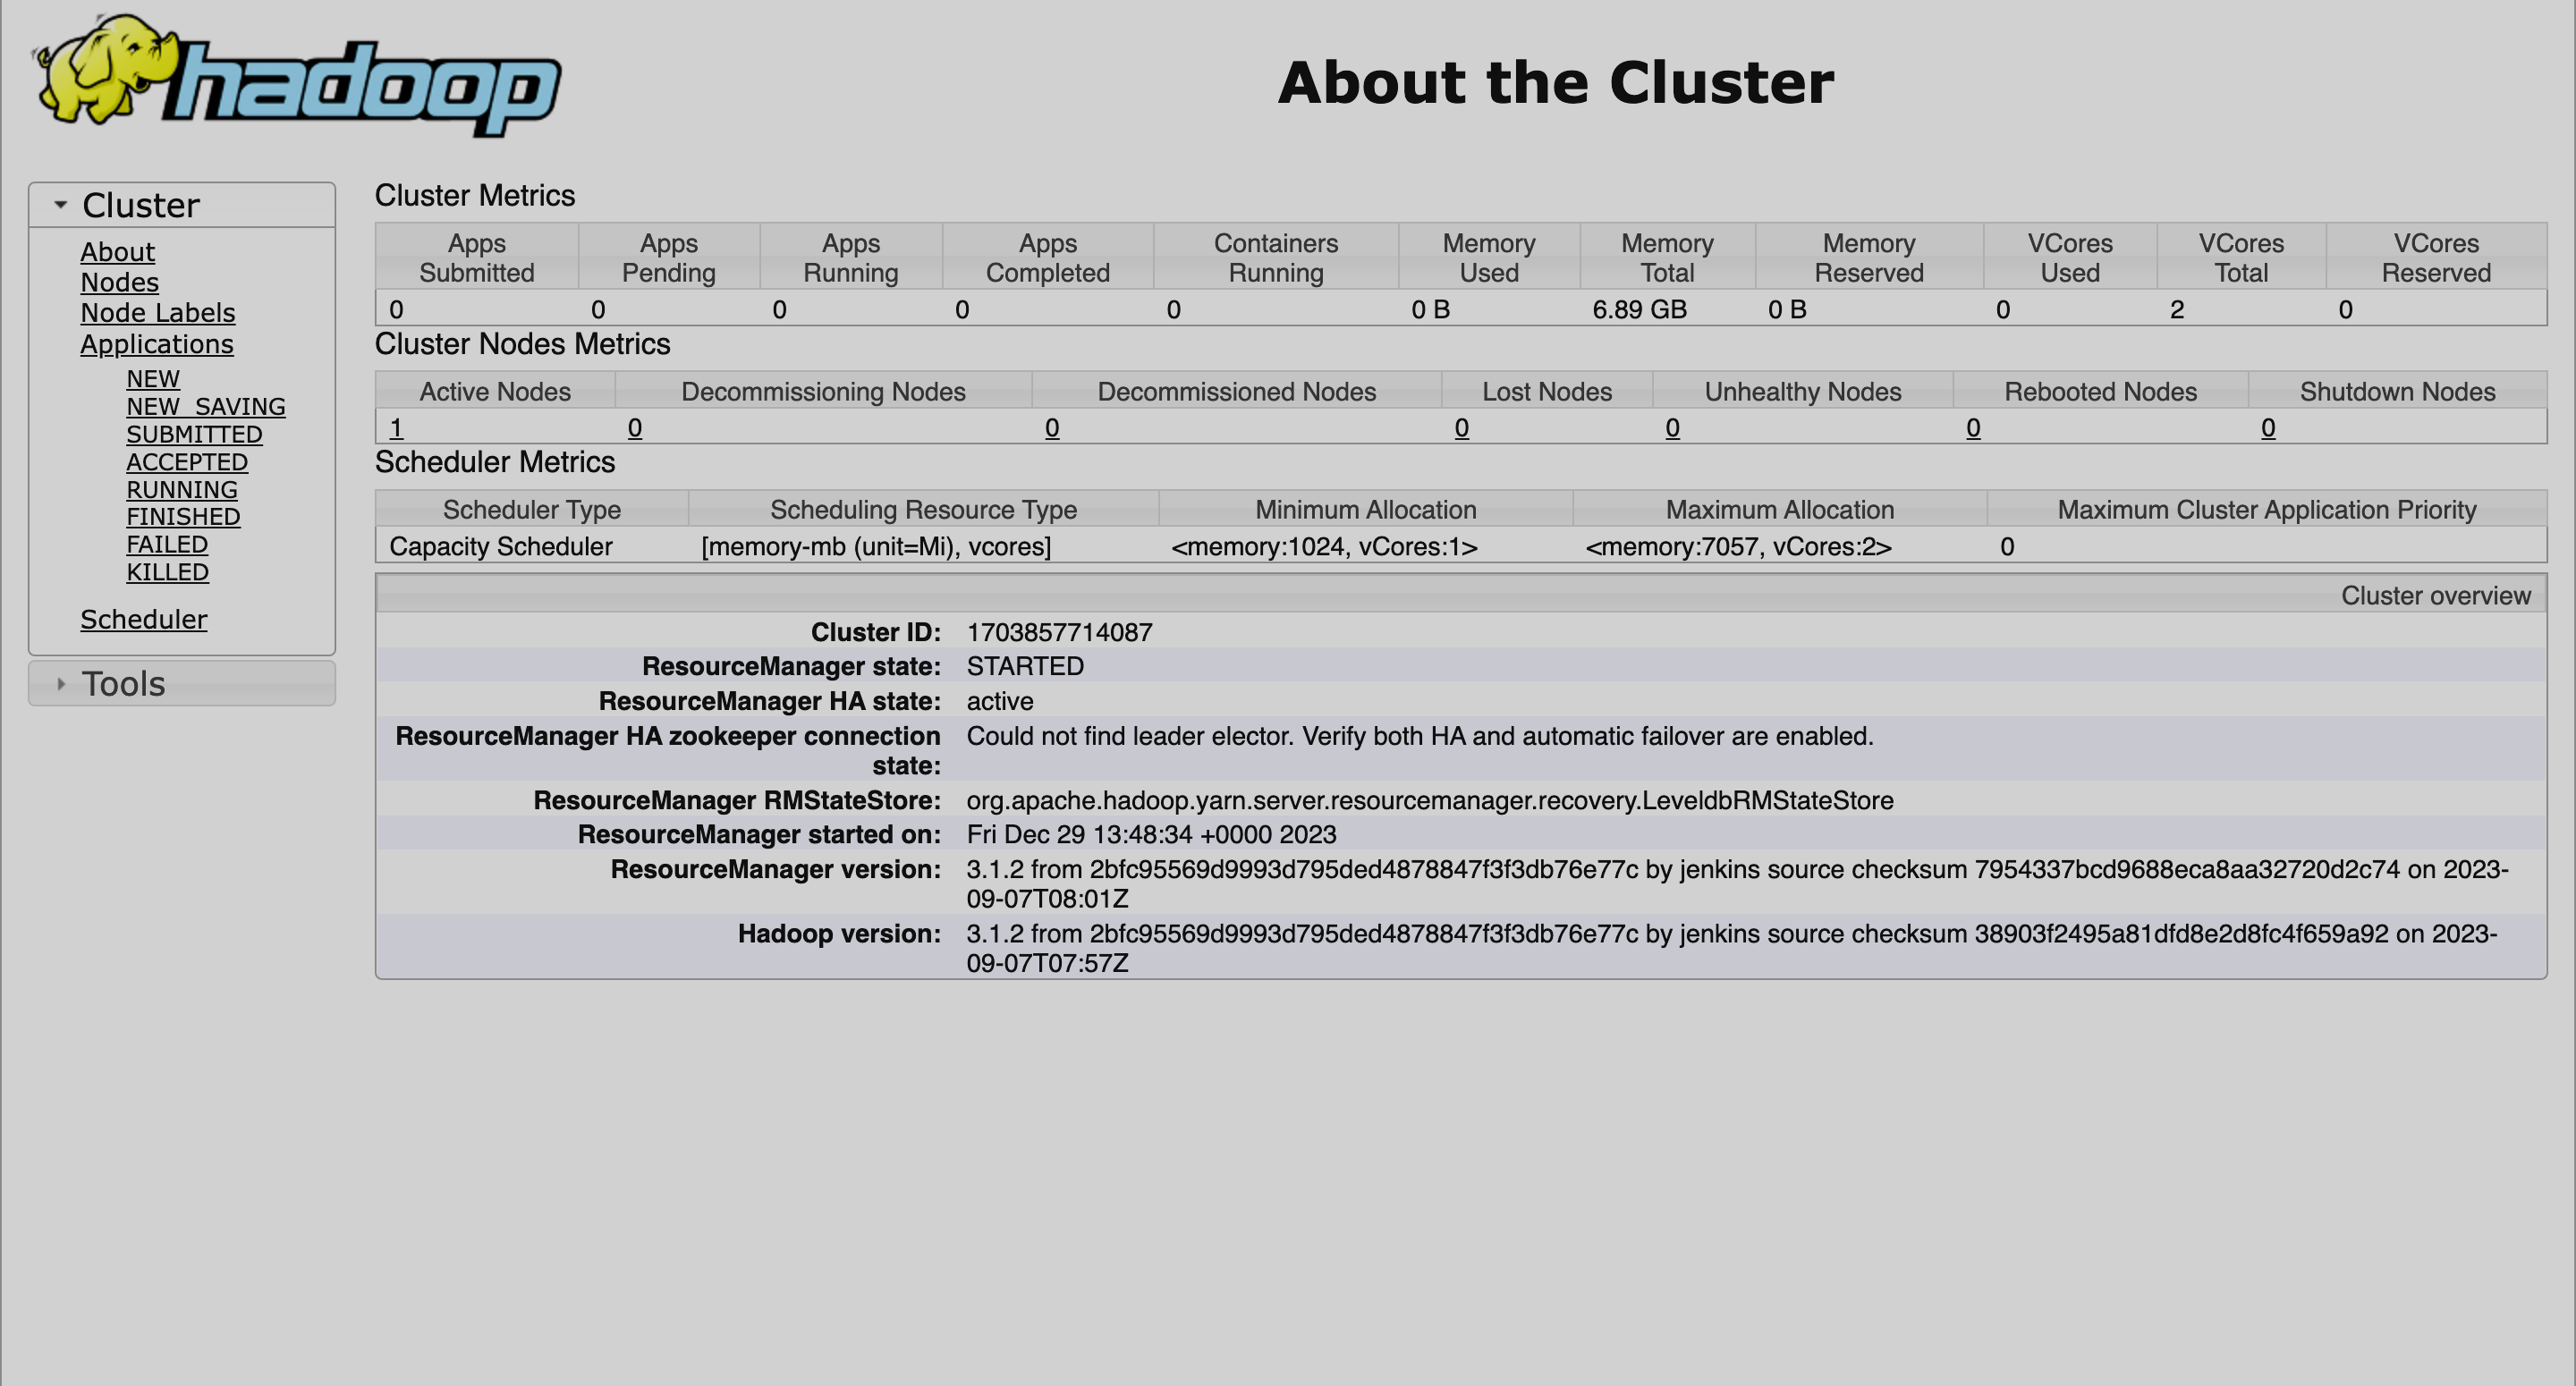
About — contains information about the cluster and the list of its metrics as well as the nodes and scheduler metrics.
-
Nodes — shows NodeManager information and metrics table from the About section.
-
Node Labels — lists node labels of the cluster and information about them.
-
Applications — contains the list of applications with information about them and links to each application’s page.
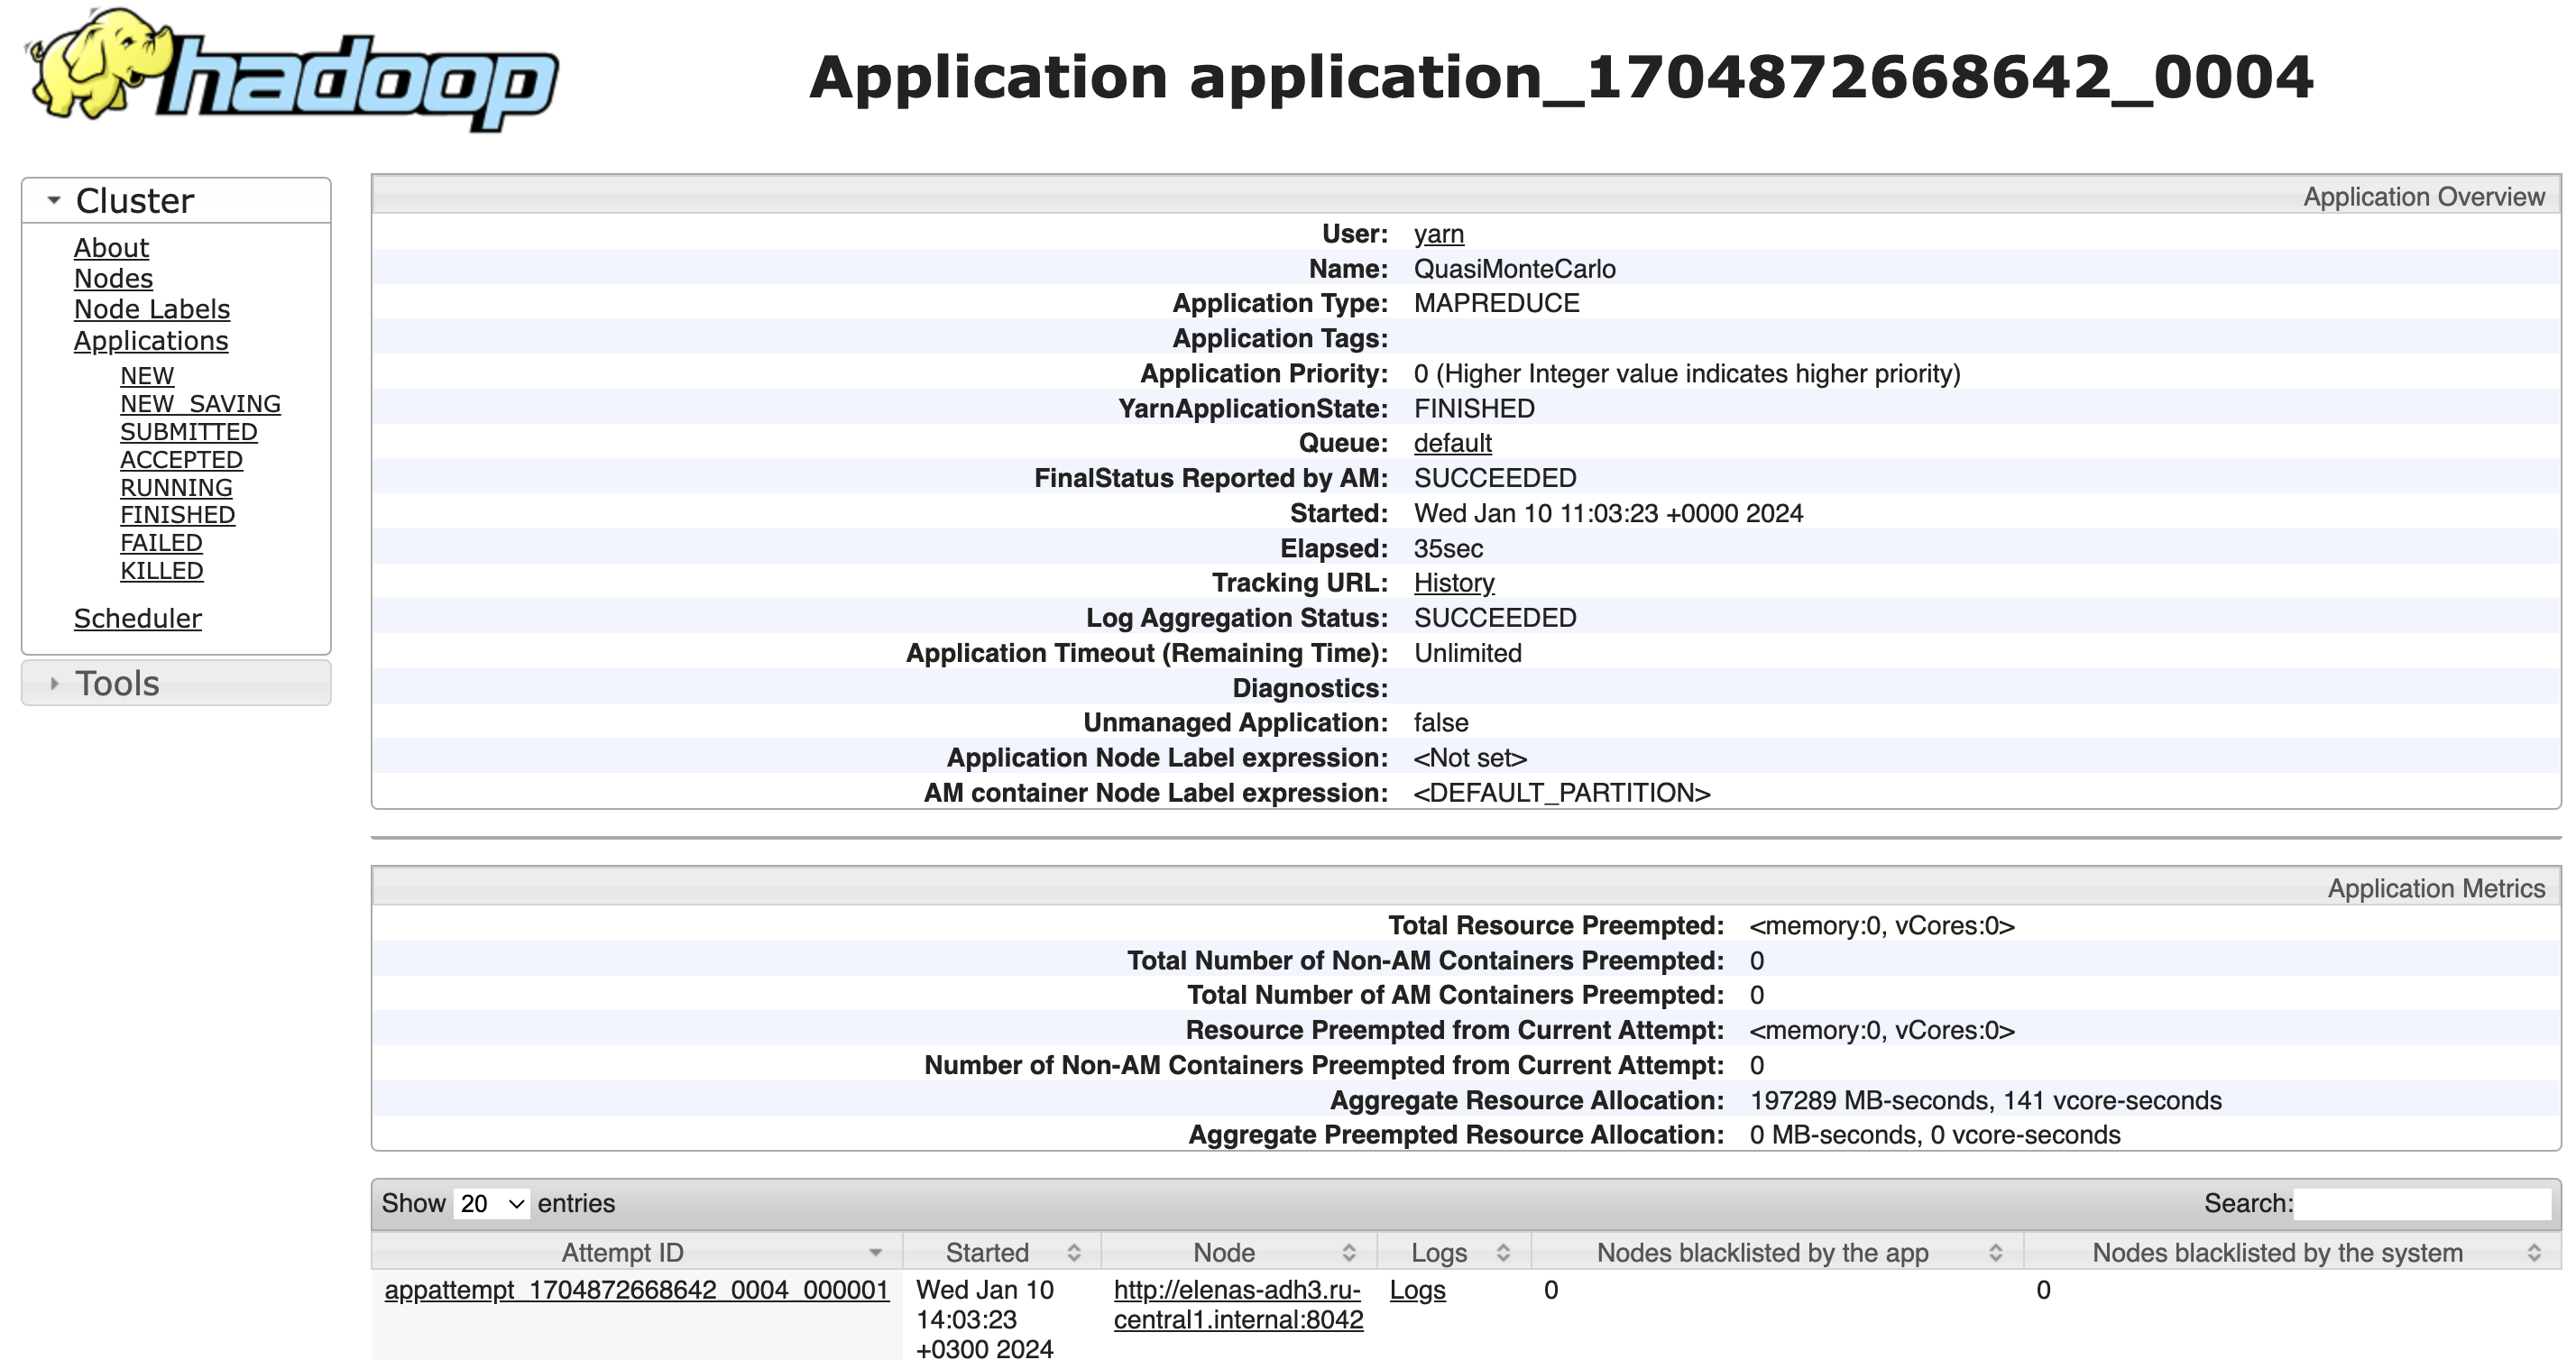 Legacy ResourceManager UI: application page
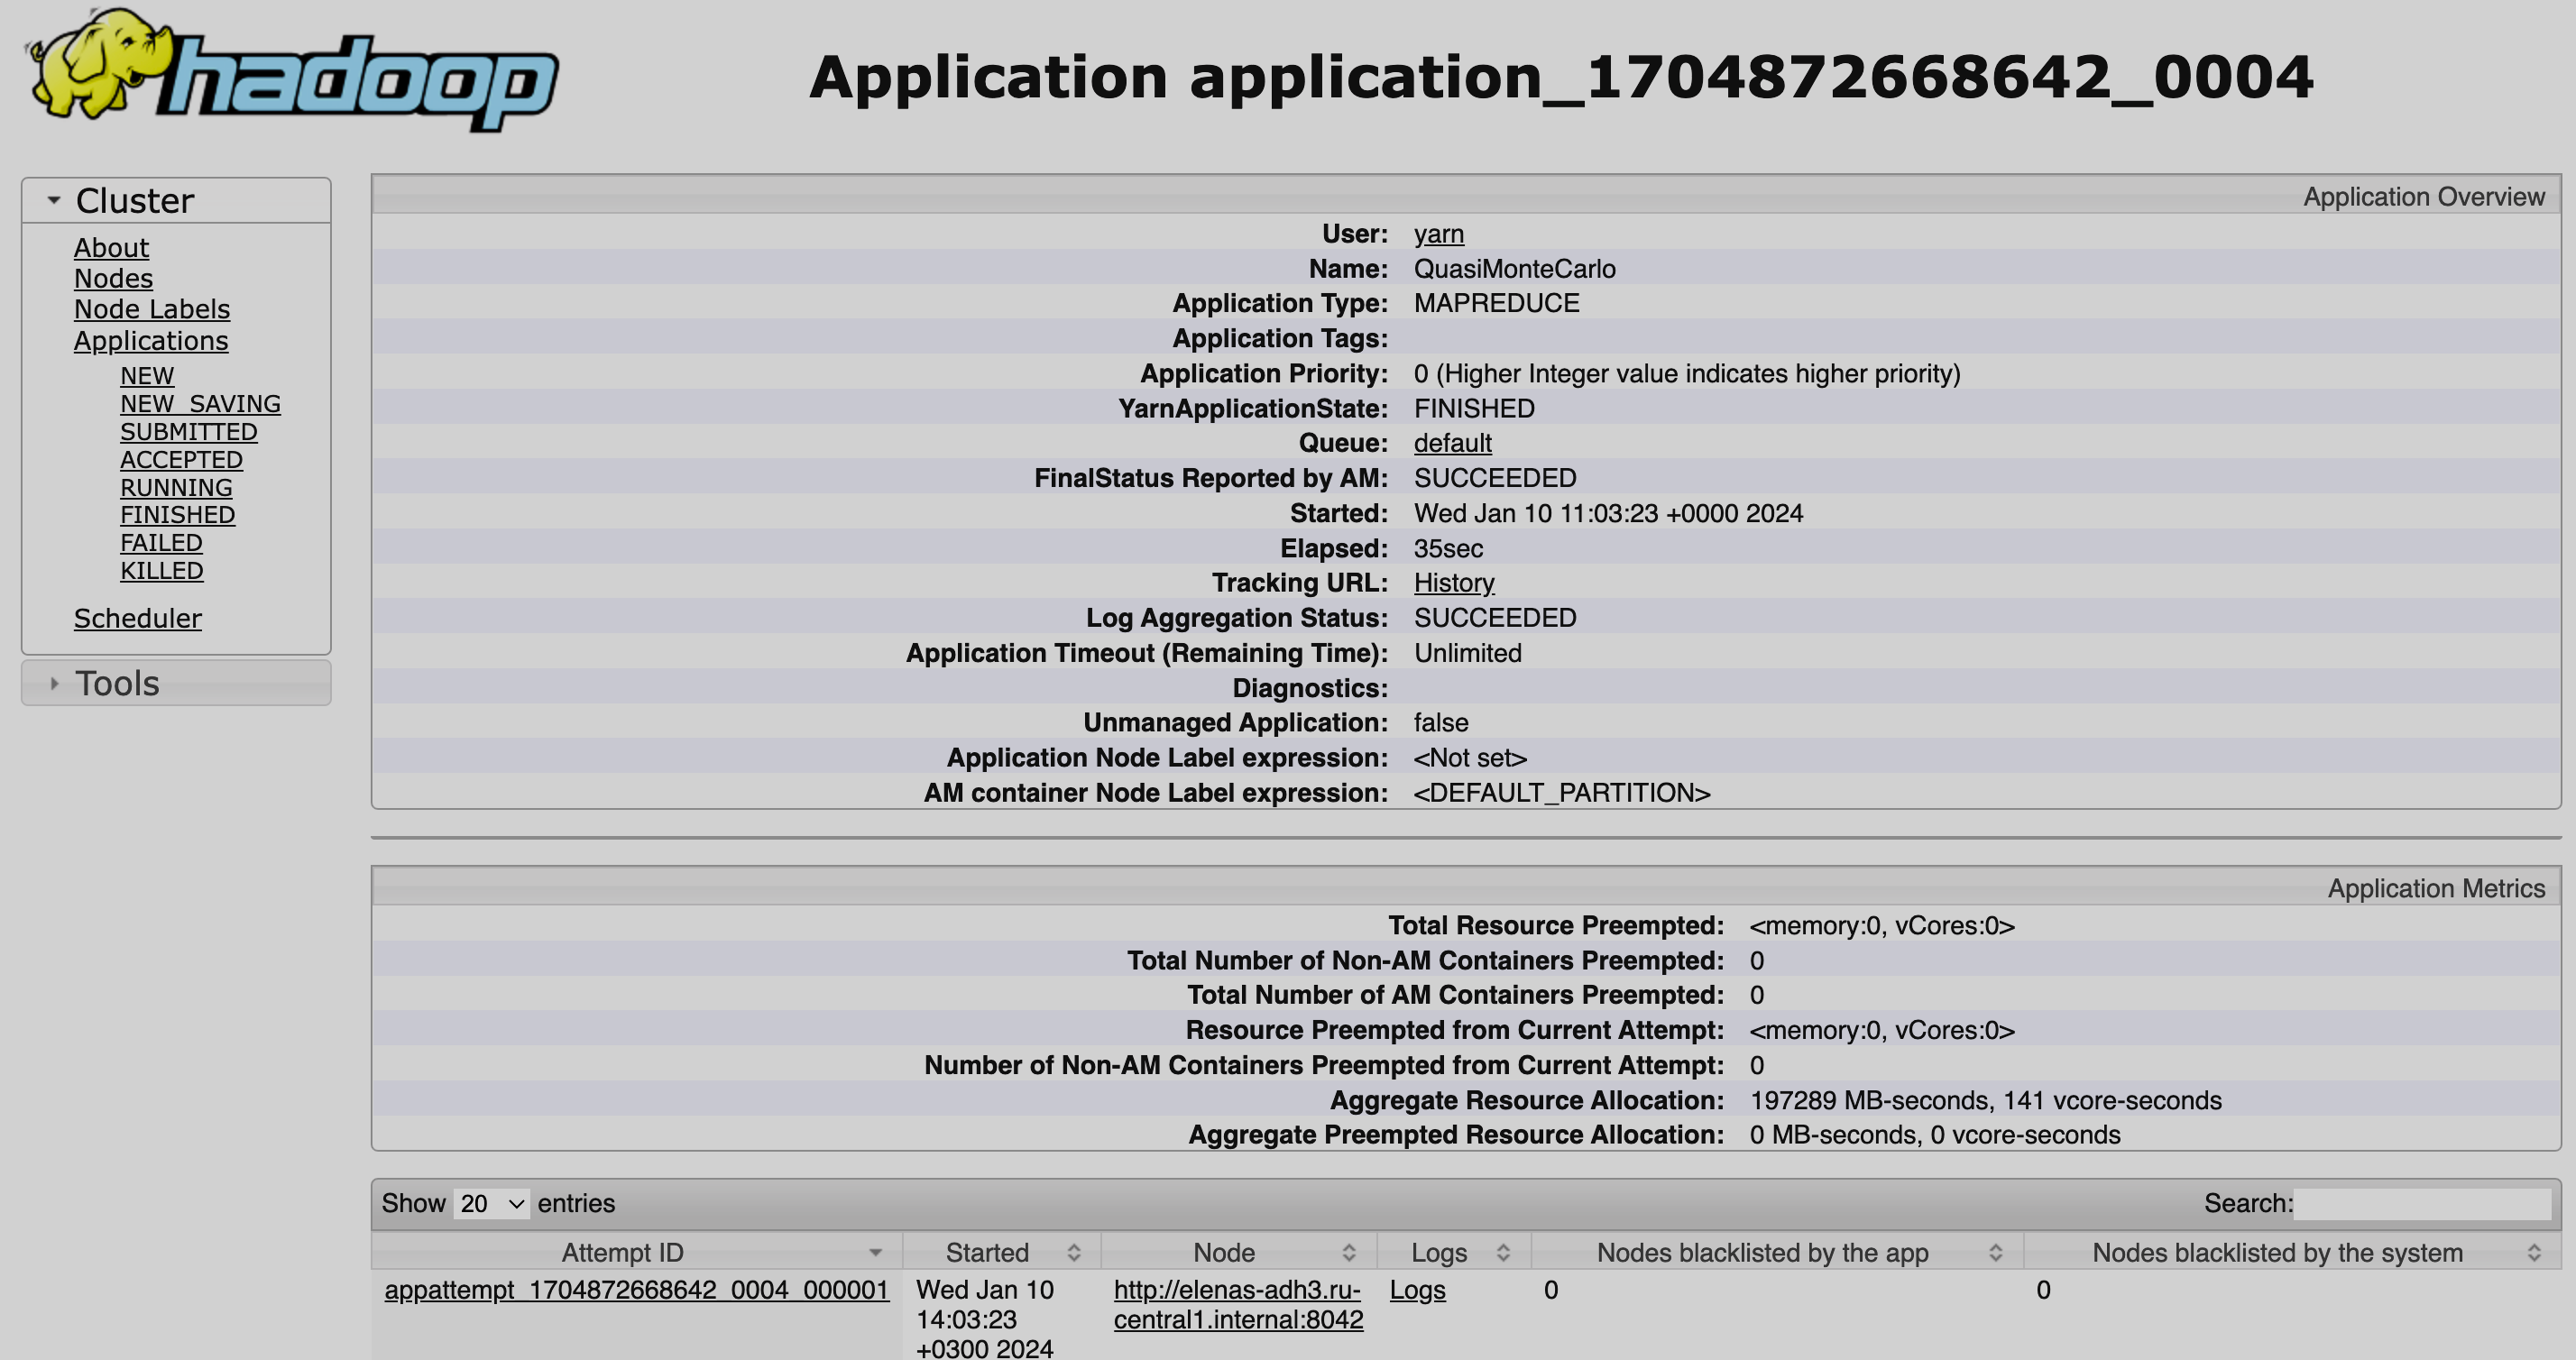 Legacy ResourceManager UI: application page
 -
Scheduler — displays application queues information and metrics table from the About section.
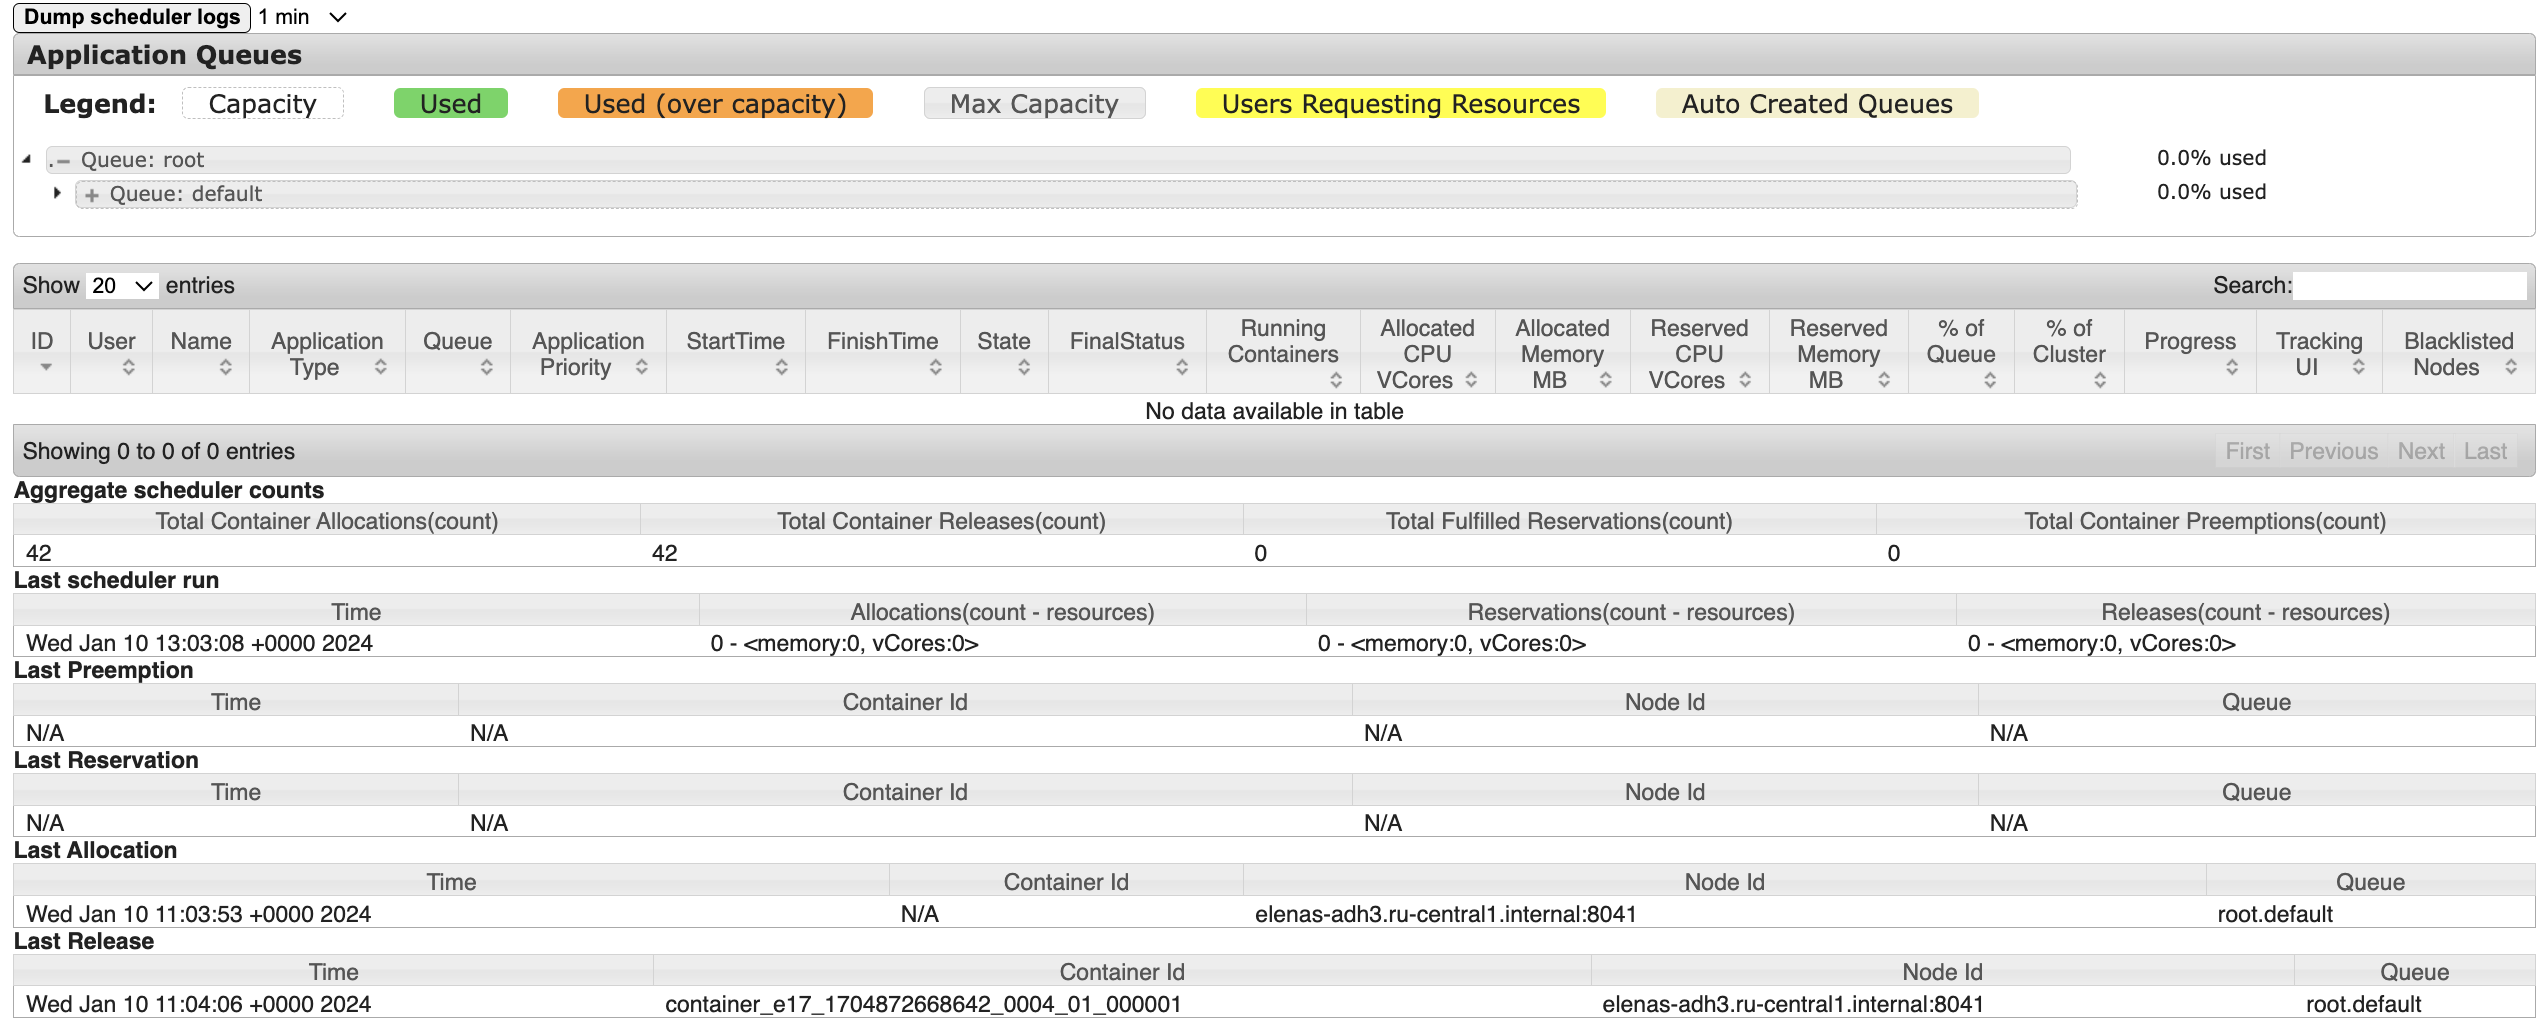 Legacy ResourceManager UI: Application Queues table
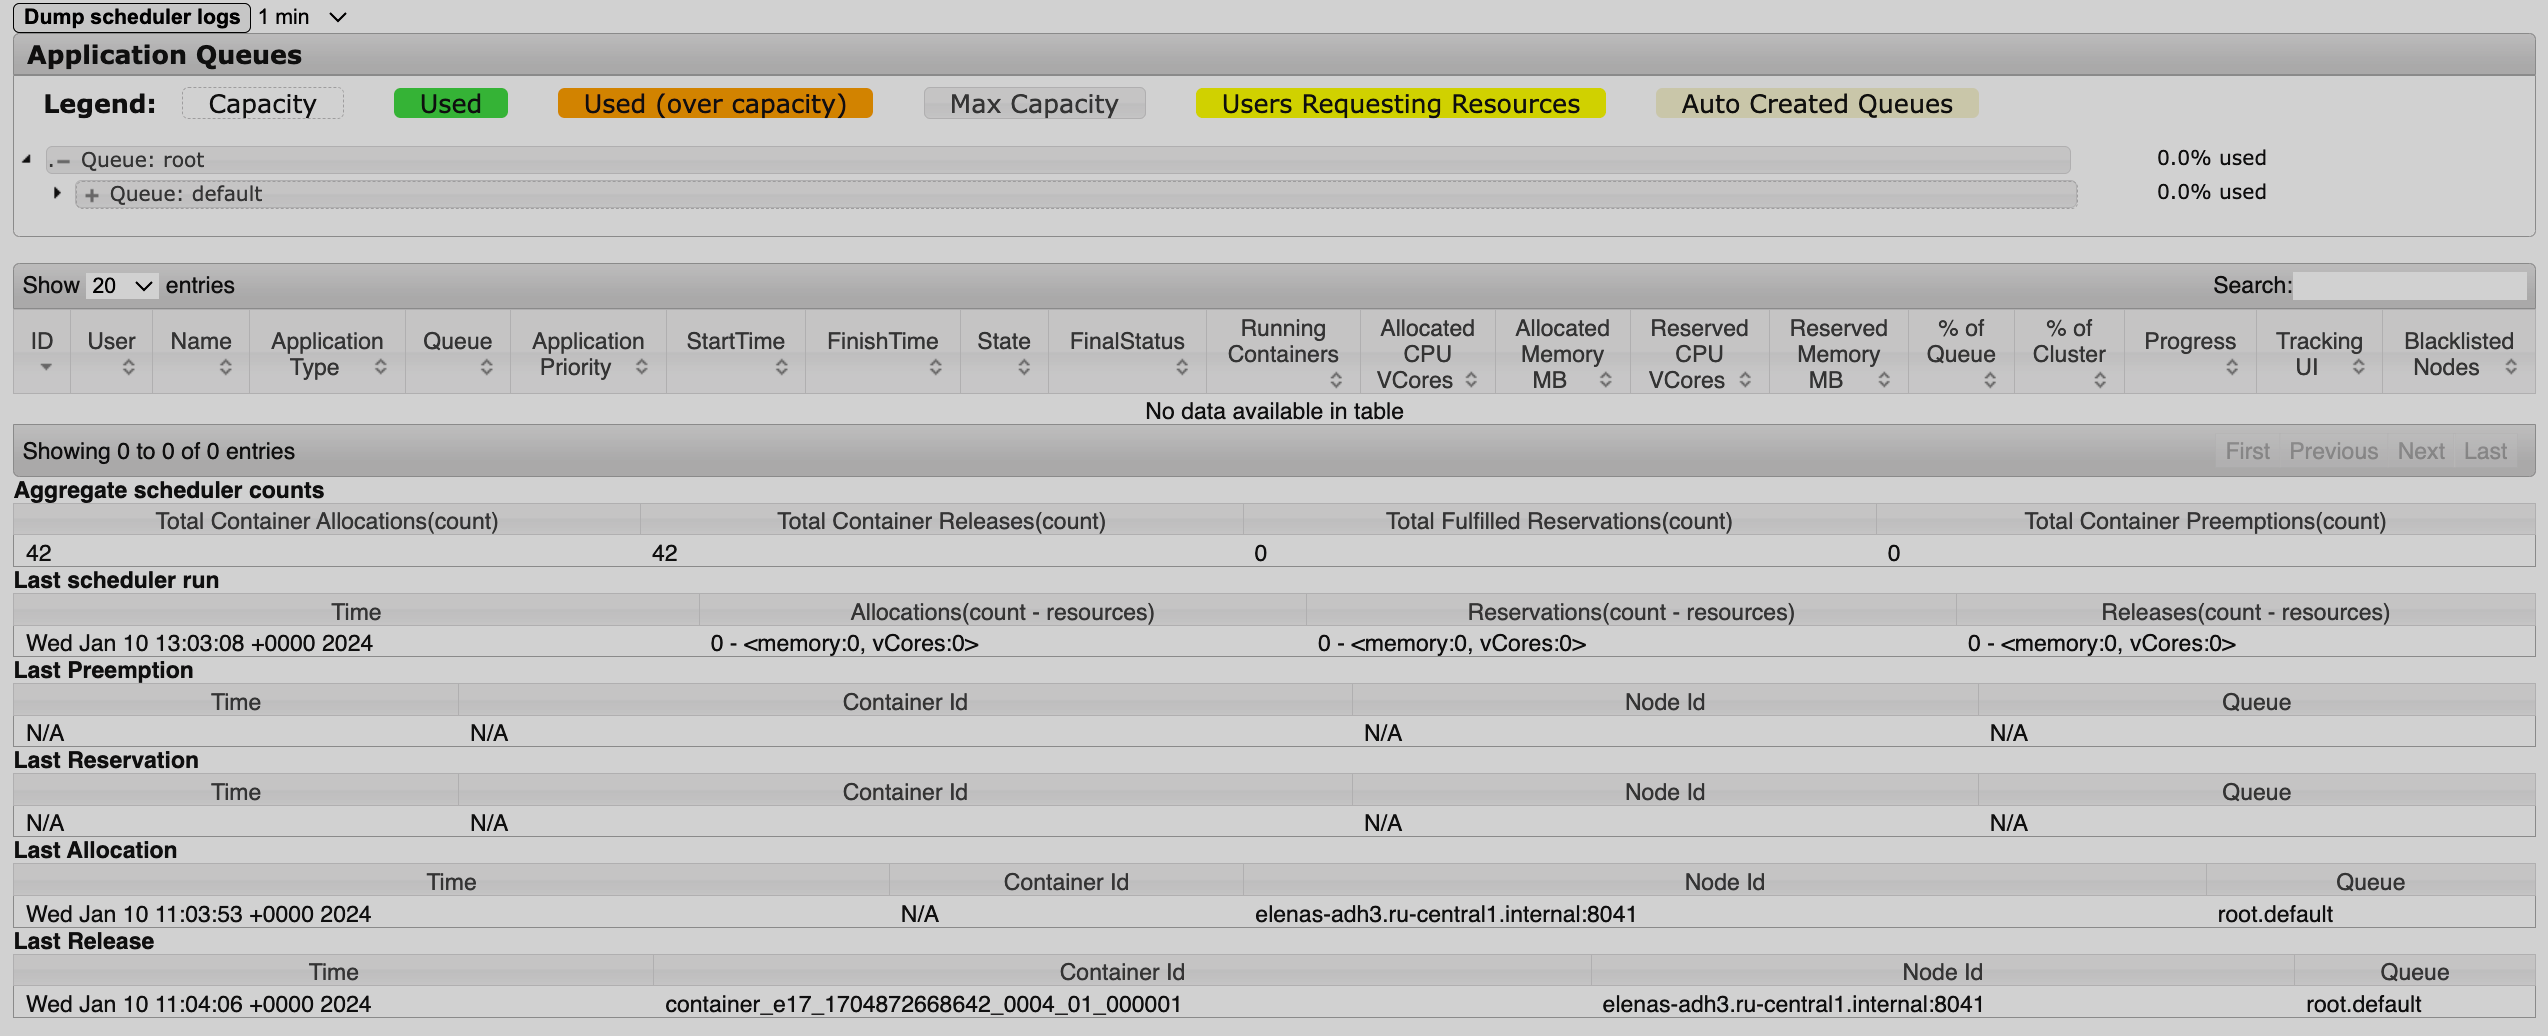 Legacy ResourceManager UI: Application Queues table
Same as other YARN web interfaces, both ResourceManager UIs contain links to YARN tools:
-
Configuration — an XML file that includes all HDFS and YARN configuration files;
-
Local logs — the list of YARN logs located on the host;
-
Server stacks — the list of active threads and their status;
-
Server metrics — the list of JMX metrics.
The new ResourceManager web interface, UI2, provides the same information but in the form of tabs instead of links. Additionally, some information from tables is represented as graphs.
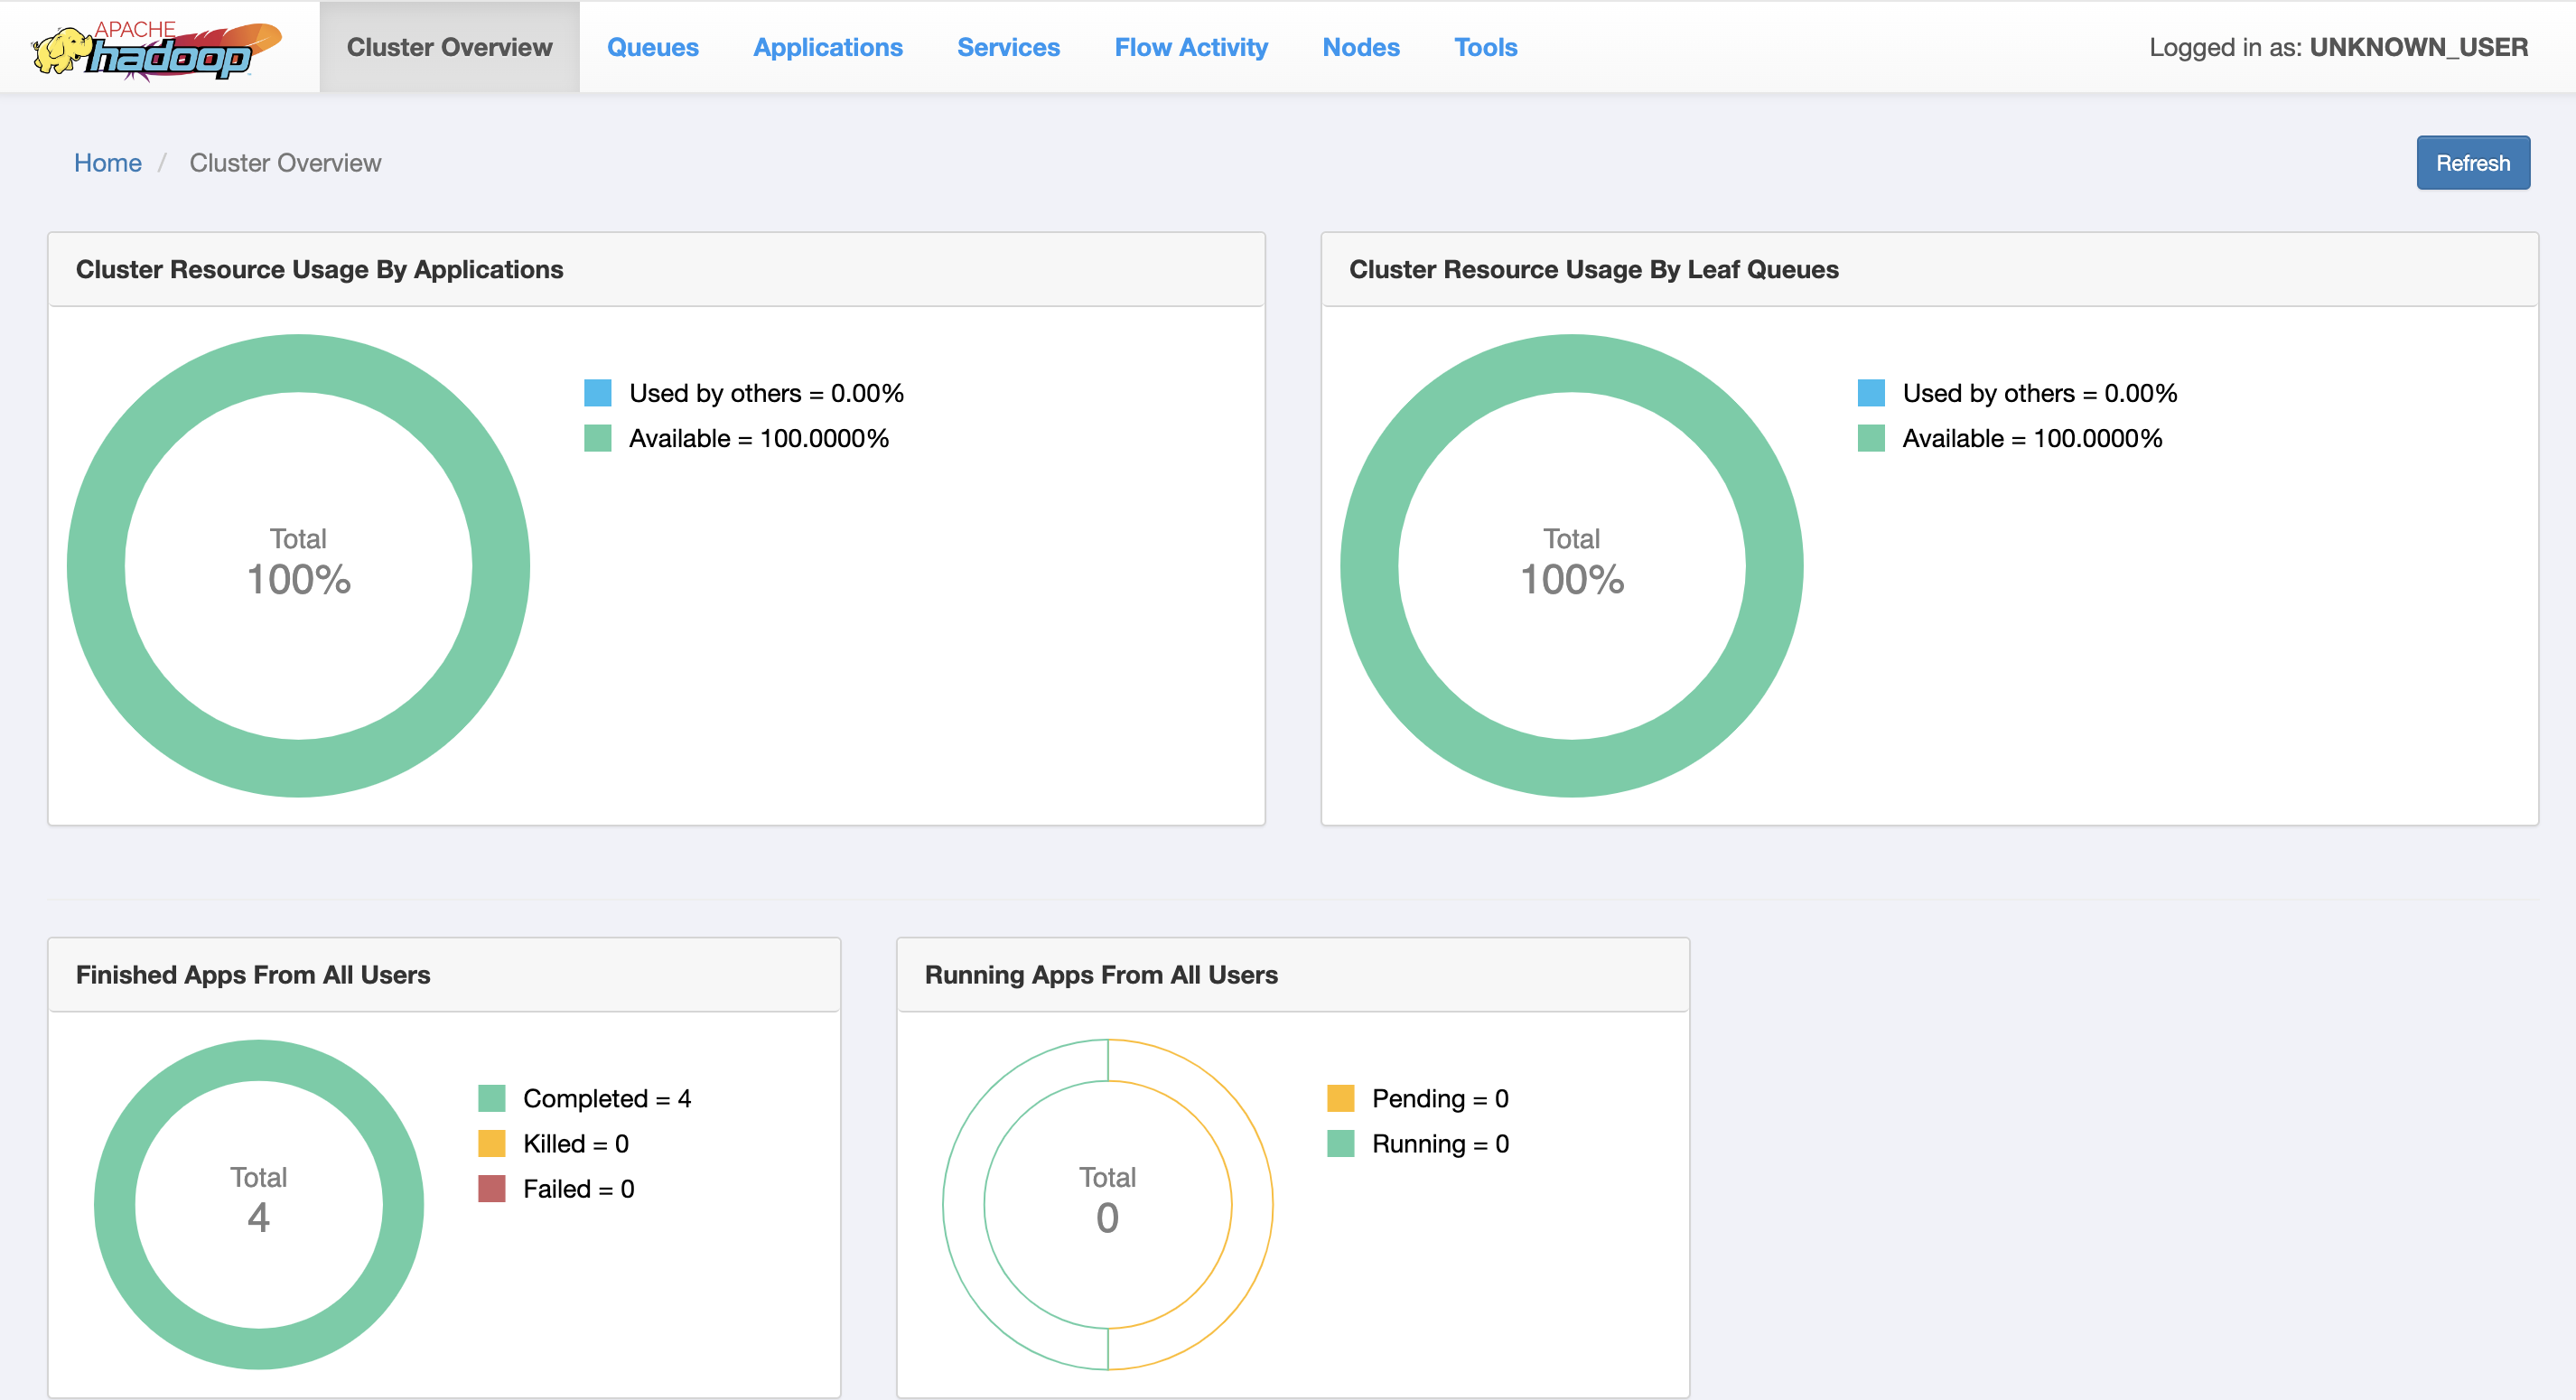
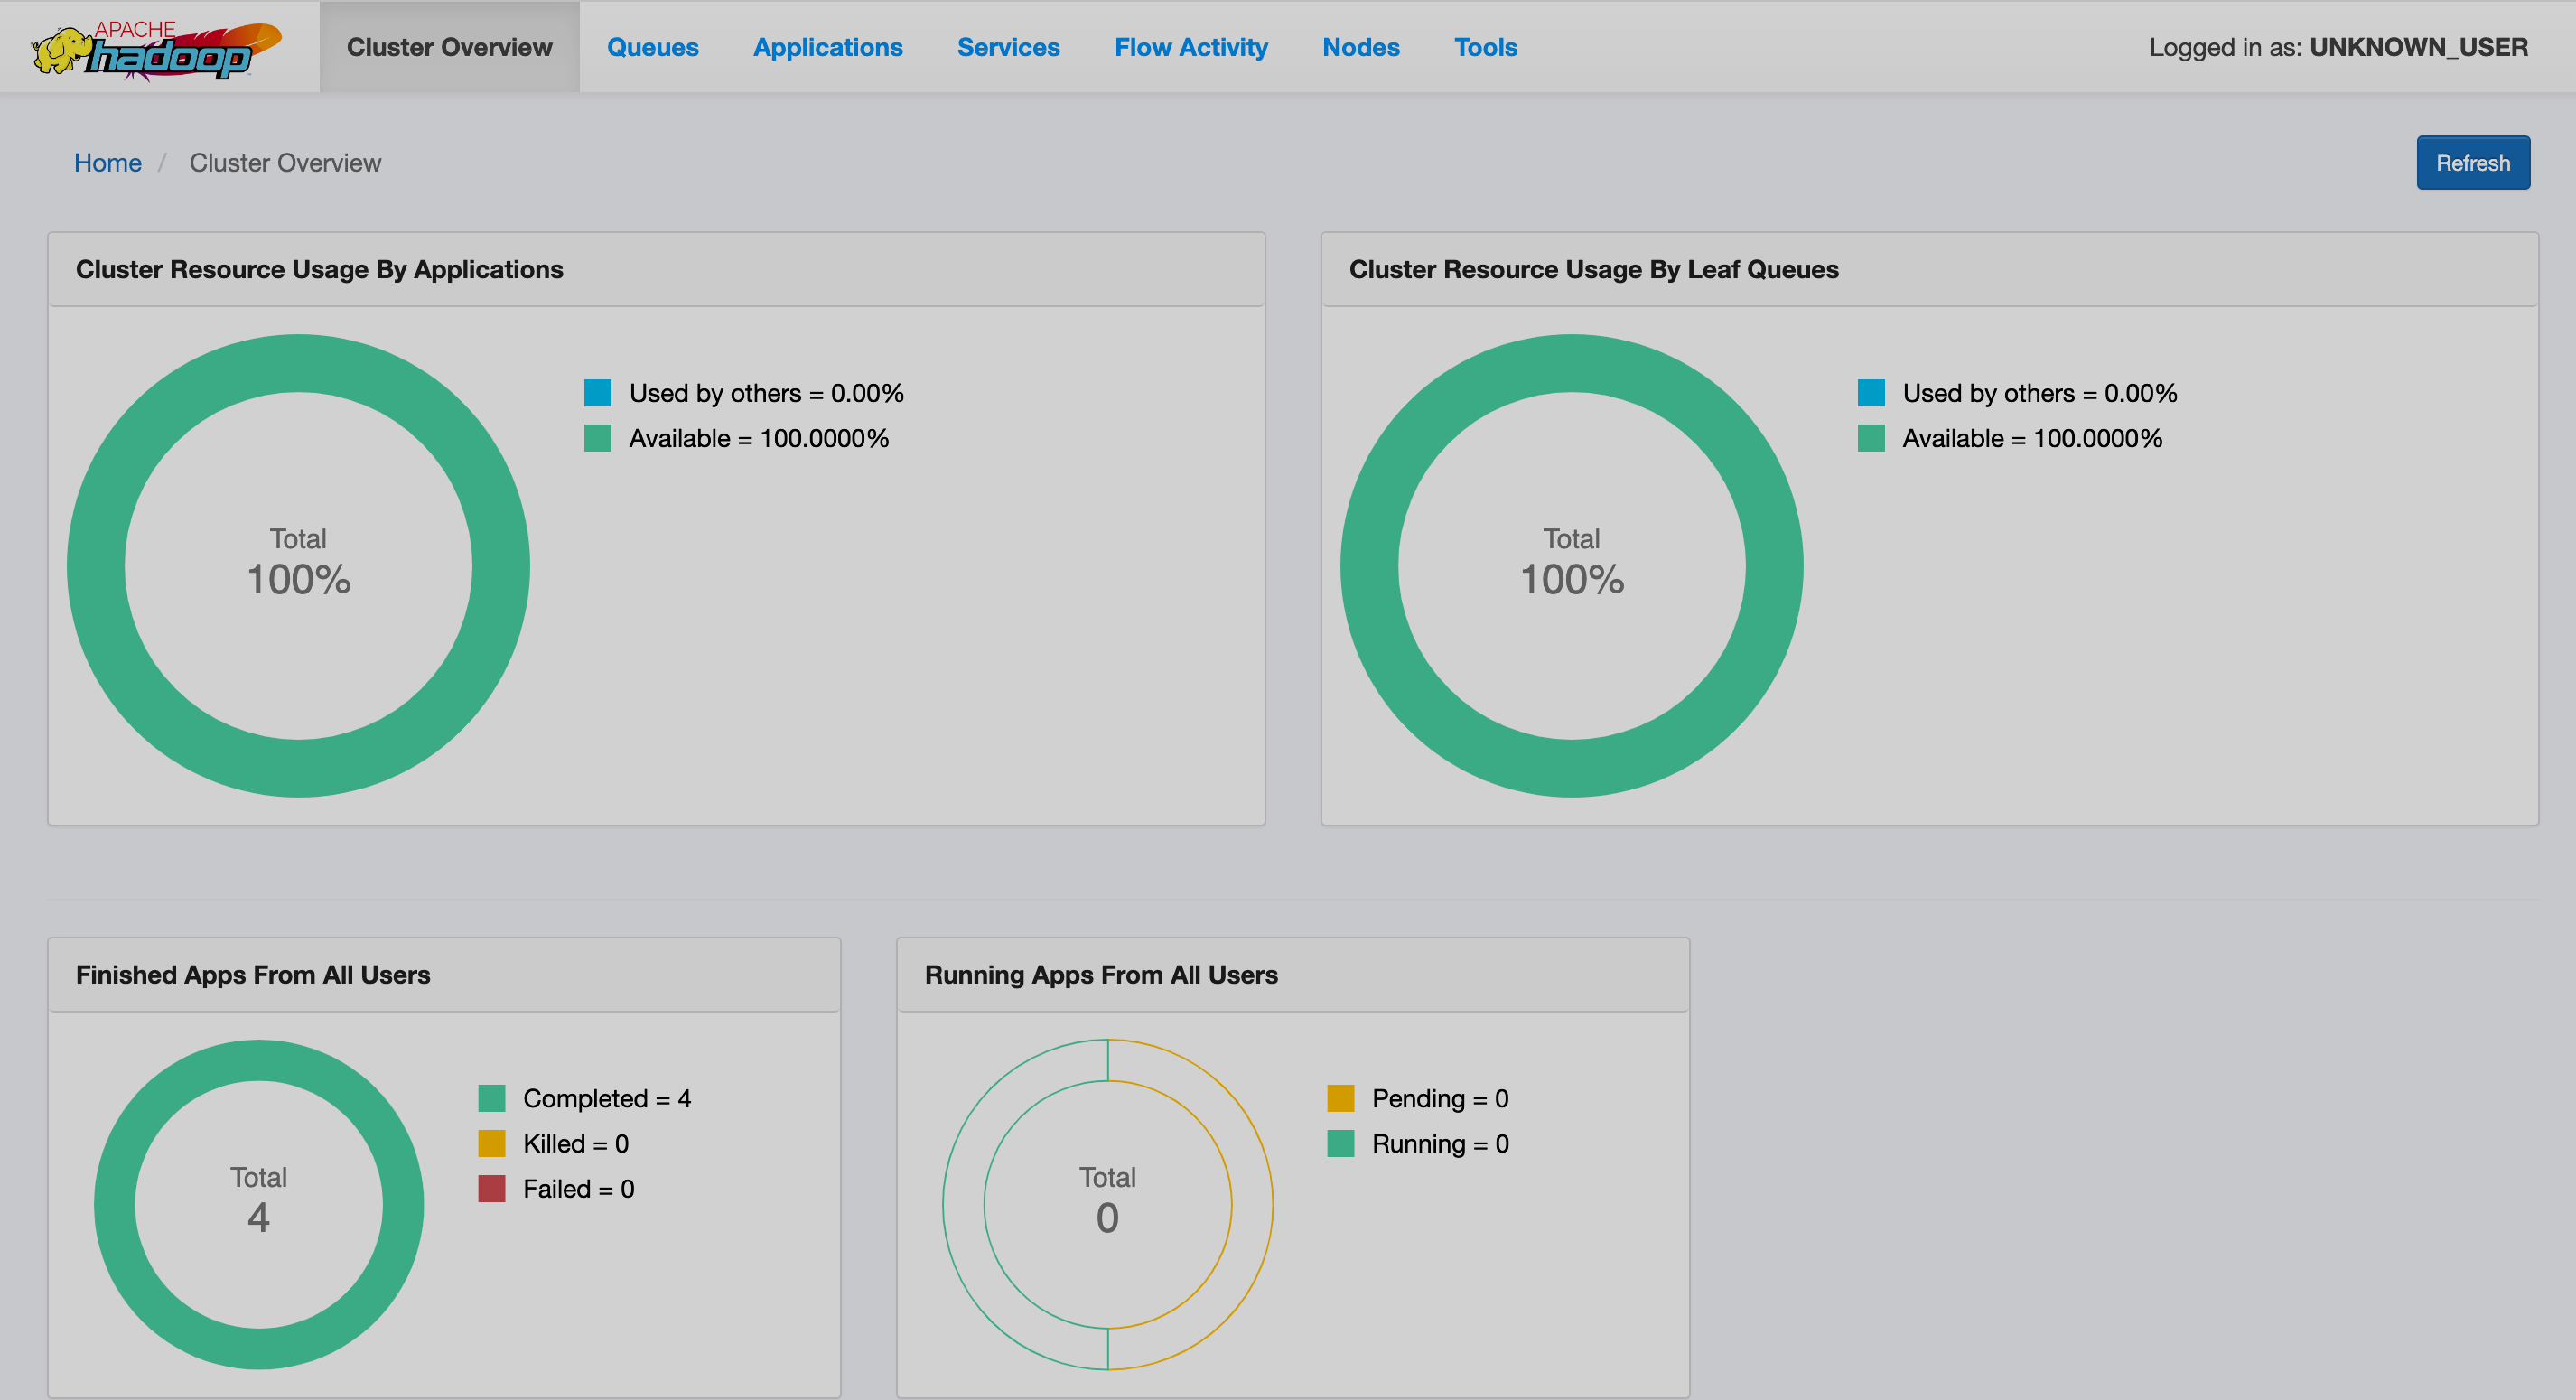
The tabs from the ResourceManager UI2 contain the following information:
-
Cluster Overview — cluster resource statistics and application metrics as graphs.
-
Queues — scheduler queues graphs and resource statistics.
-
Applications — the list of applications with information about them and links to each application’s page.
-
Services — the list of services that run applications and a tool for creating them.
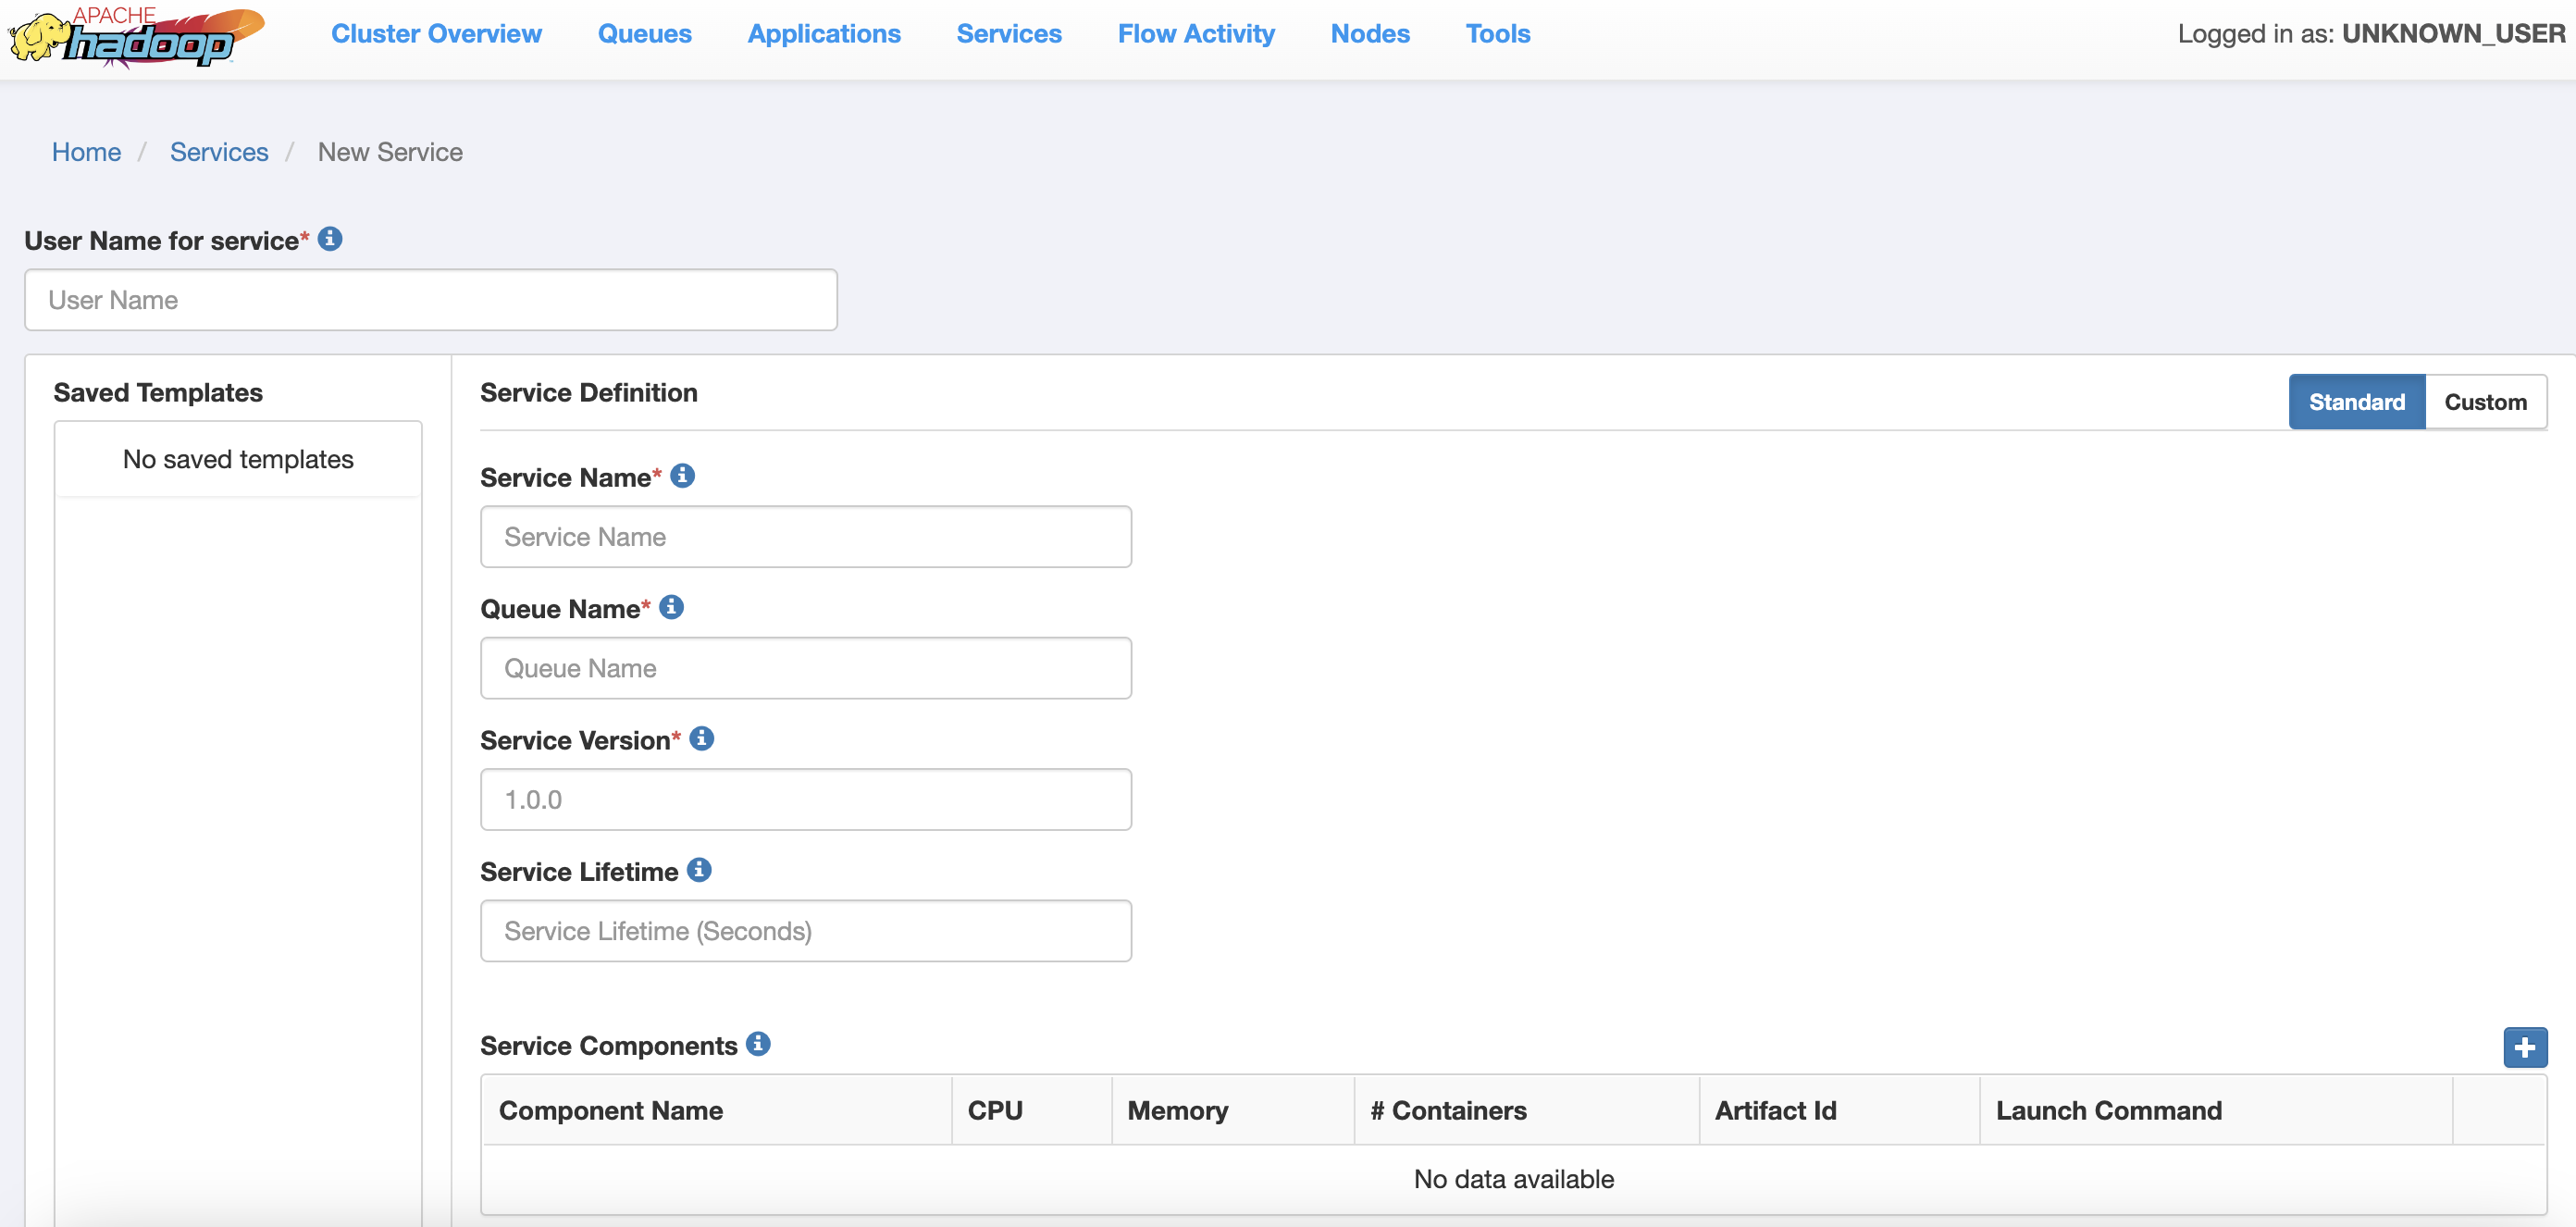 ResourceManager UI2: service creation page
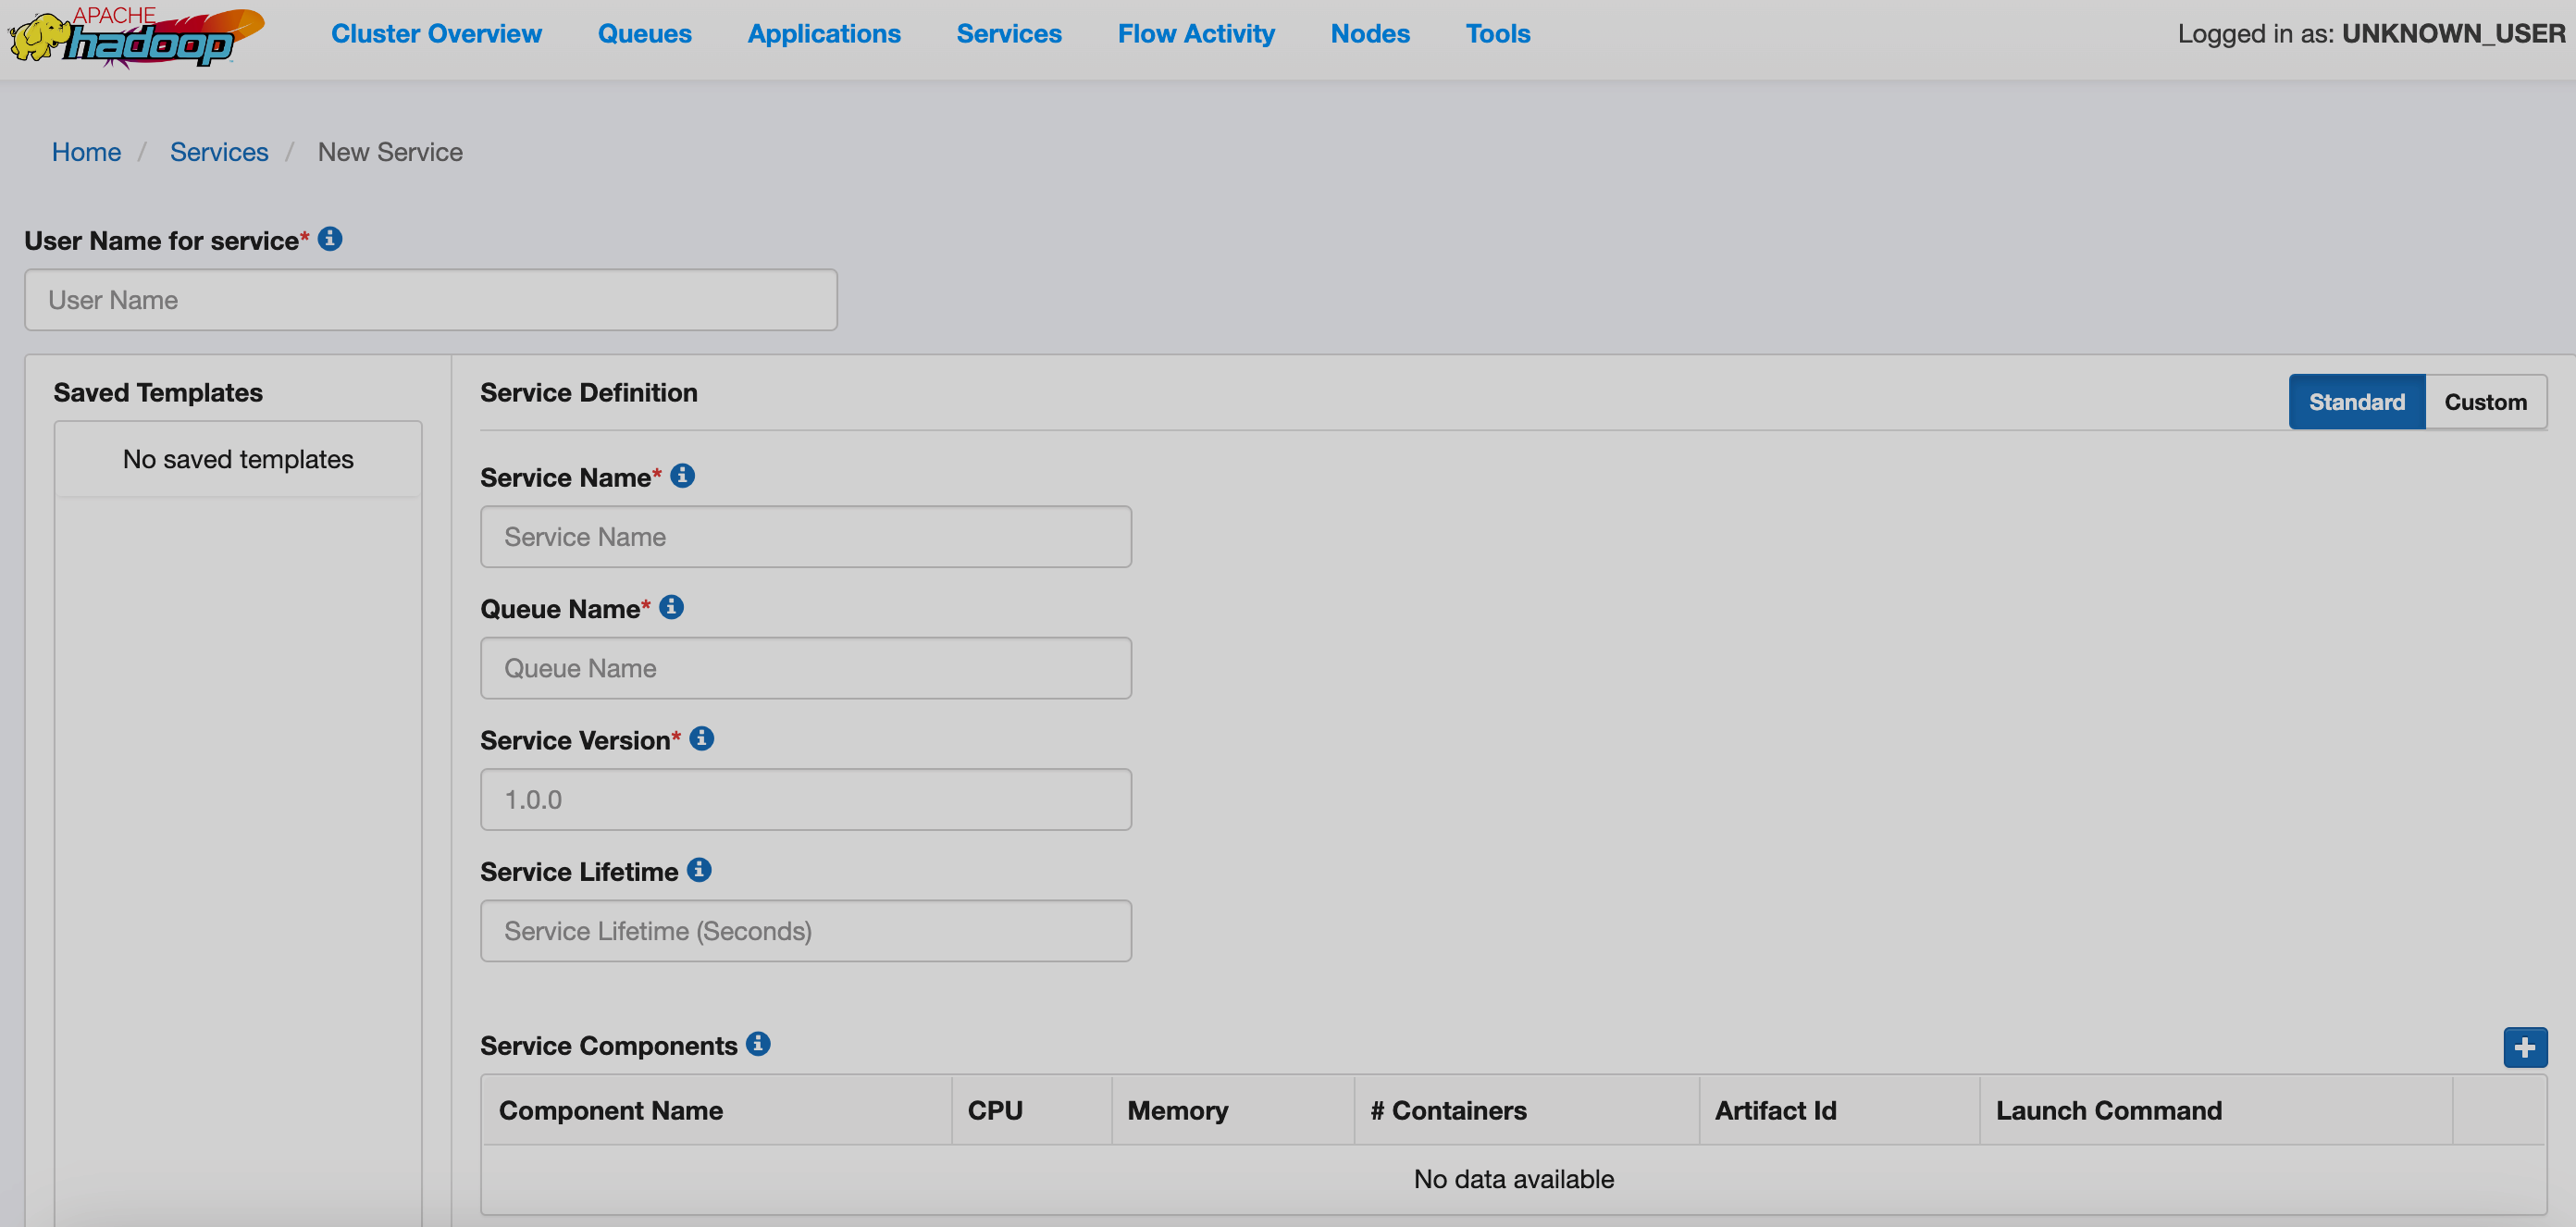 ResourceManager UI2: service creation page
 -
Flow Activity — timeline server information page.
-
Nodes — details about the cluster nodes that host NodeManagers.
-
Tools — a web interface for viewing YARN logs and configuration files.
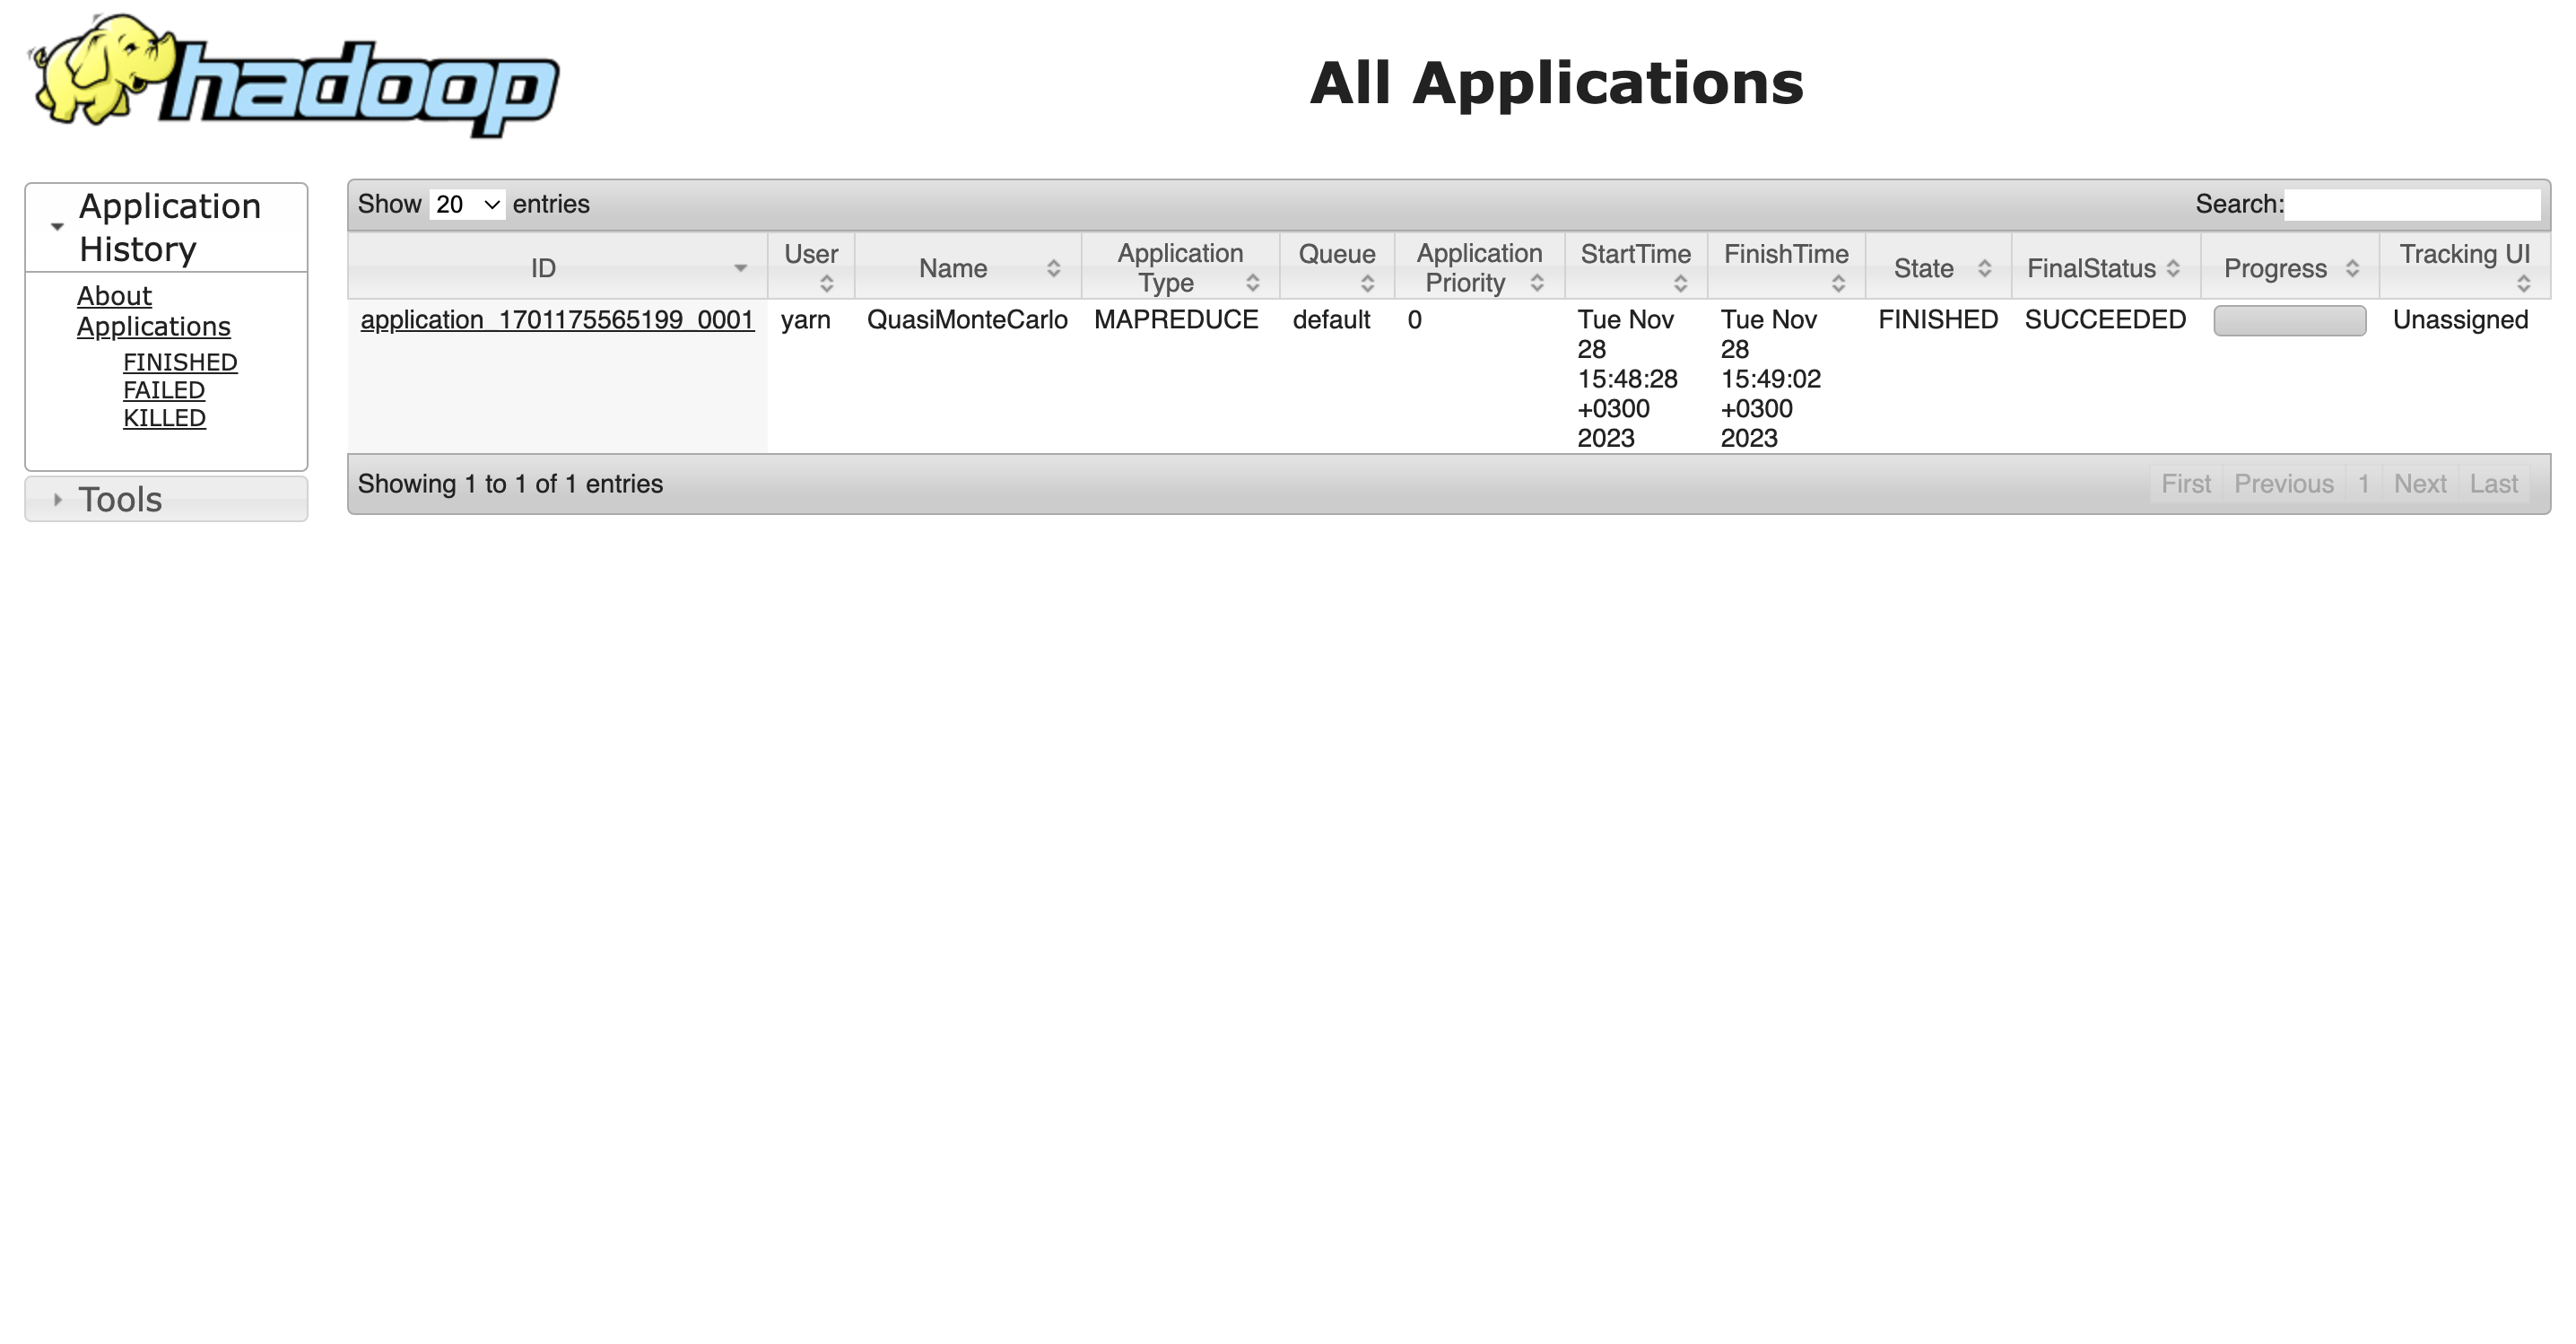
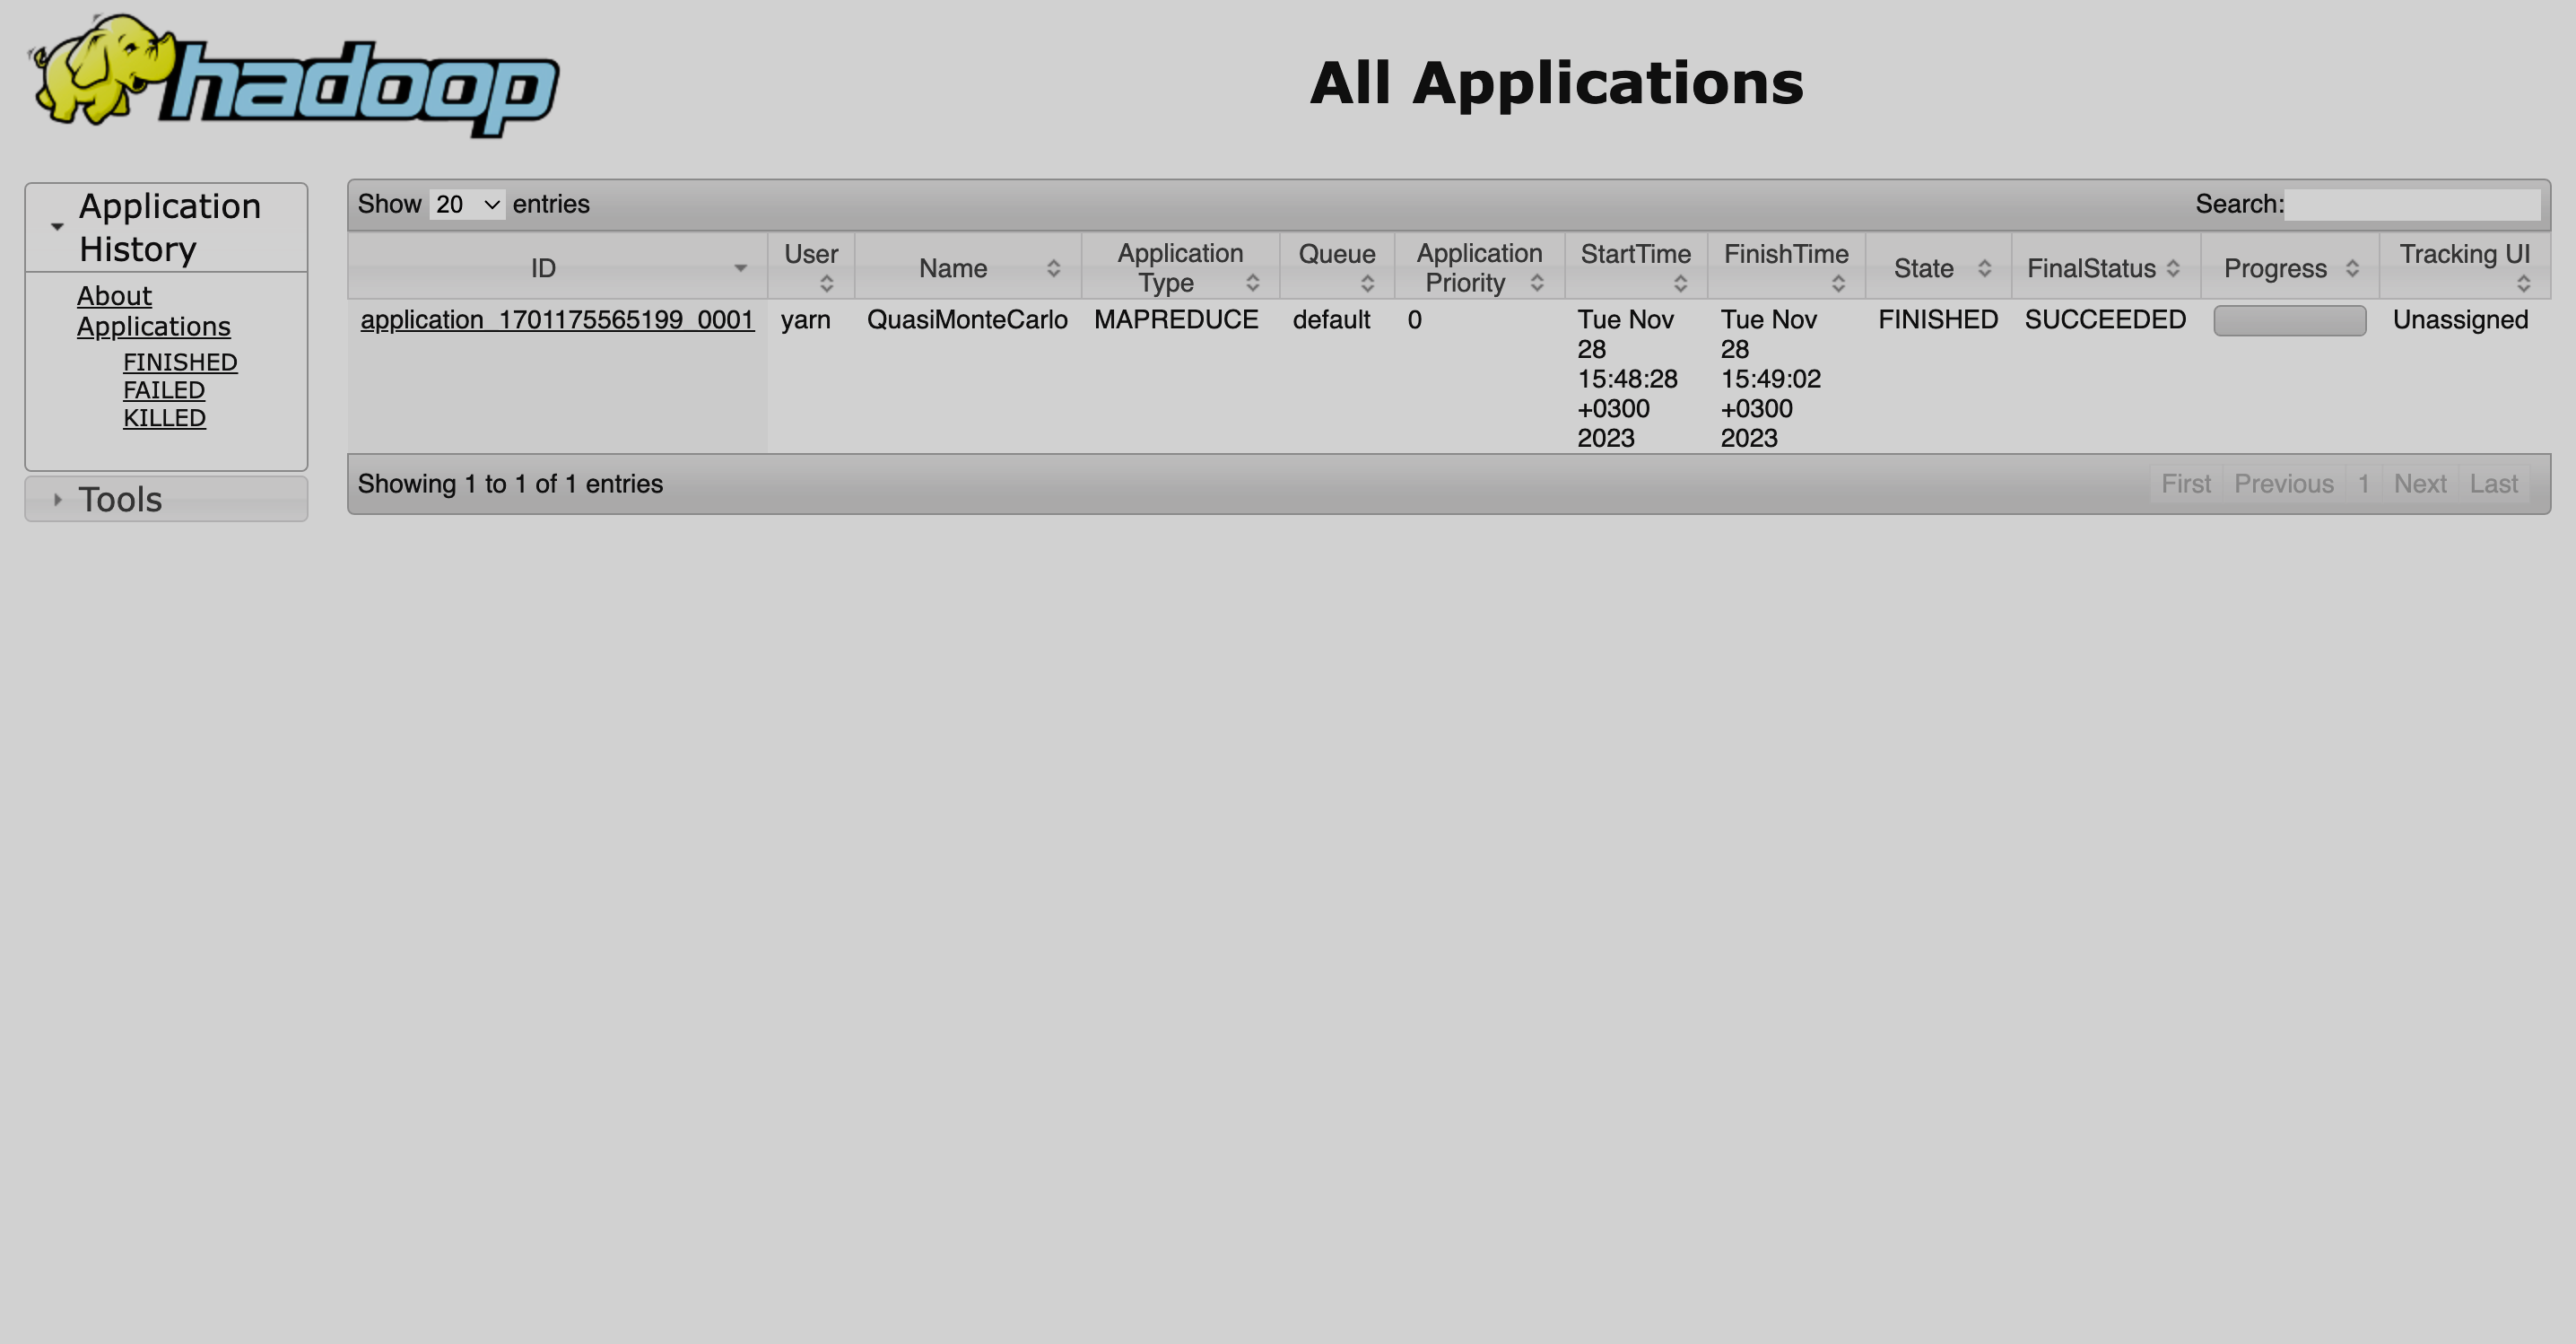
Timeline server
The main Timeline server UI page has a navigation menu on the left with two sections:
-
Application History — contains information about the timeline server and the list of all launched applications that can be filtered by state: successfully finished, failed, and killed (stopped).
-
Tools — contains links to the following information:
-
Configuration — an XML file that includes all HDFS and YARN configuration files;
-
Local logs — the list of Timeline server logs located on the host;
-
Server stacks — the list of active threads and their status;
-
Server metrics — the list of JMX metrics.
-