

Impala web UIs overview
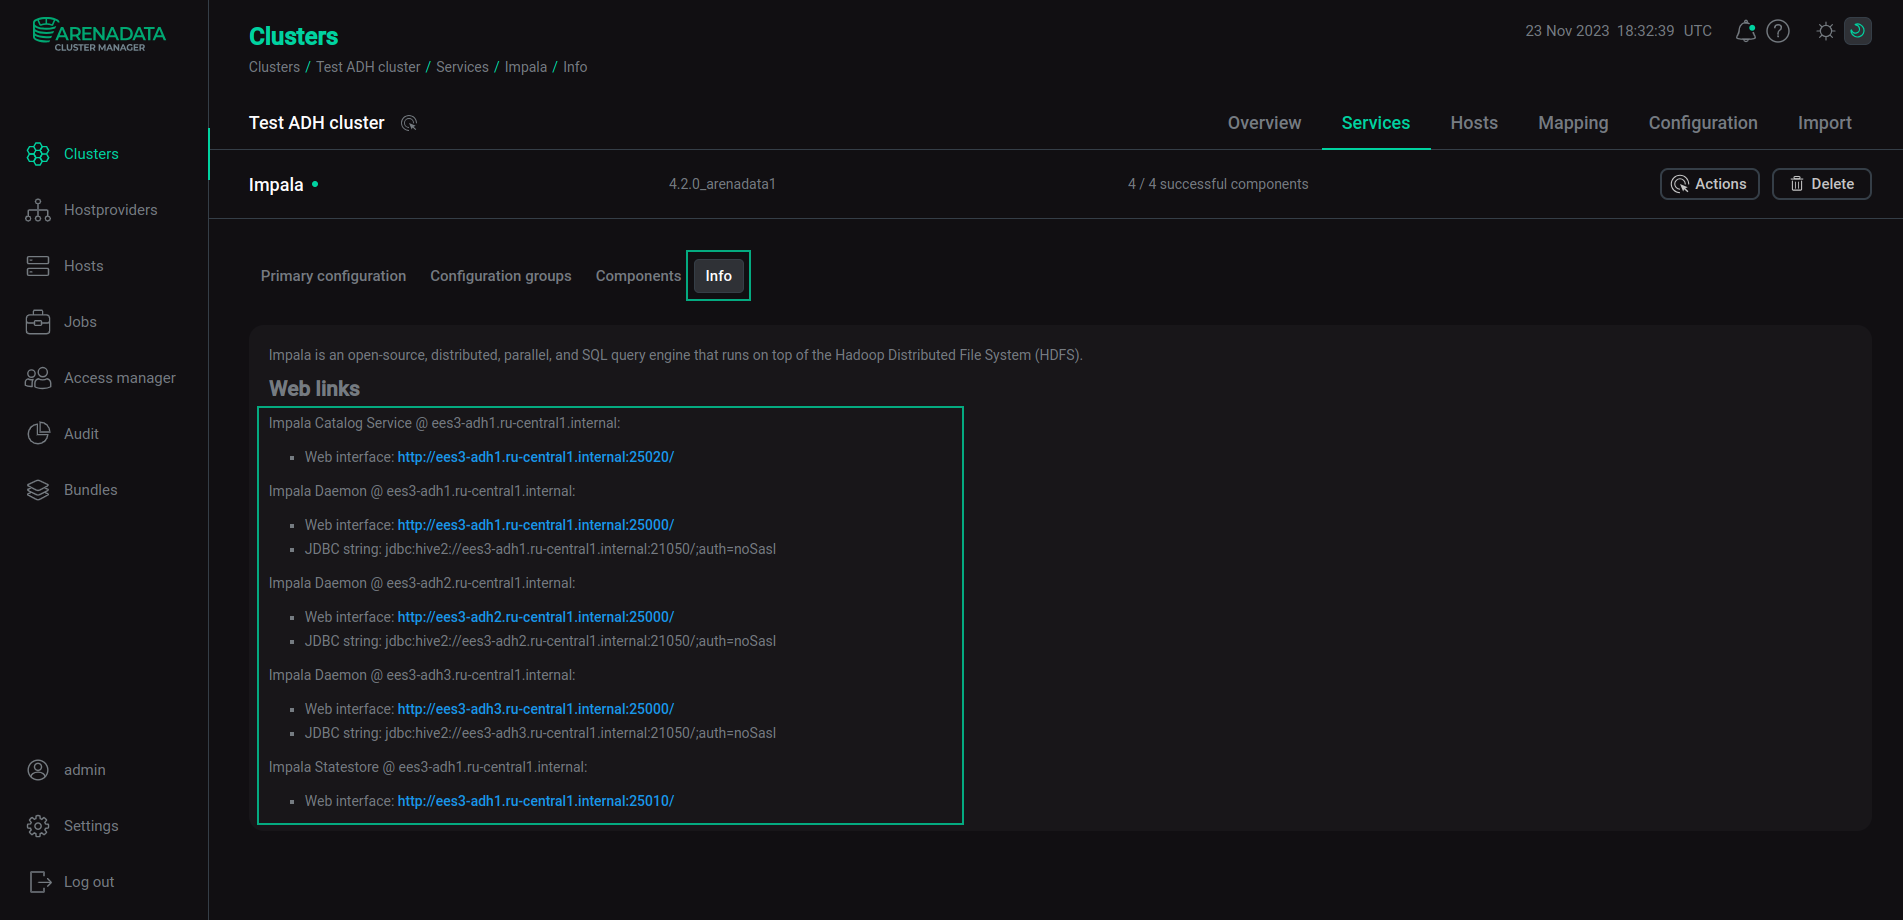
Each of the Impala daemons (impalad, statestored, and catalogd) provides a built-in web server that displays diagnostic and status information. You can find links to these web interfaces on the Info tab of the Impala service in the ADCM UI.
A URL has the following form: http://<server‑hostname>:<port>/.
Example: http://adh-host1.ru-central1.internal:25000/.
For secure clusters, use https:// instead of http://.
The default web server ports are listed in the table below.
| Component | Daemon | Port |
|---|---|---|
Impala Daemon |
impalad |
25000 |
Impala Statestore |
statestored |
25010 |
Impala Catalog Service |
catalogd |
25020 |
To change the default web server port, open the Primary Configuration tab of a corresponding Impala component and set the webserver_port parameter. To disable Web UI, disable the enable_webserver checkbox and restart the required component using the Restart Impala Daemon, or Restart Impala Statestore, or Restart Impala Catalog component action.
Impala Web UIs support SPNEGO to provide security through Kerberos. This protocol passes negotiation tokens through HTTP headers to secure HTTP requests with Kerberos. To enable authorization using SPNEGO, activate the webserver_require_spnego checkbox (on the component Primary Configuration tab in the ADCM UI) for each component that should utilize SPNEGO.
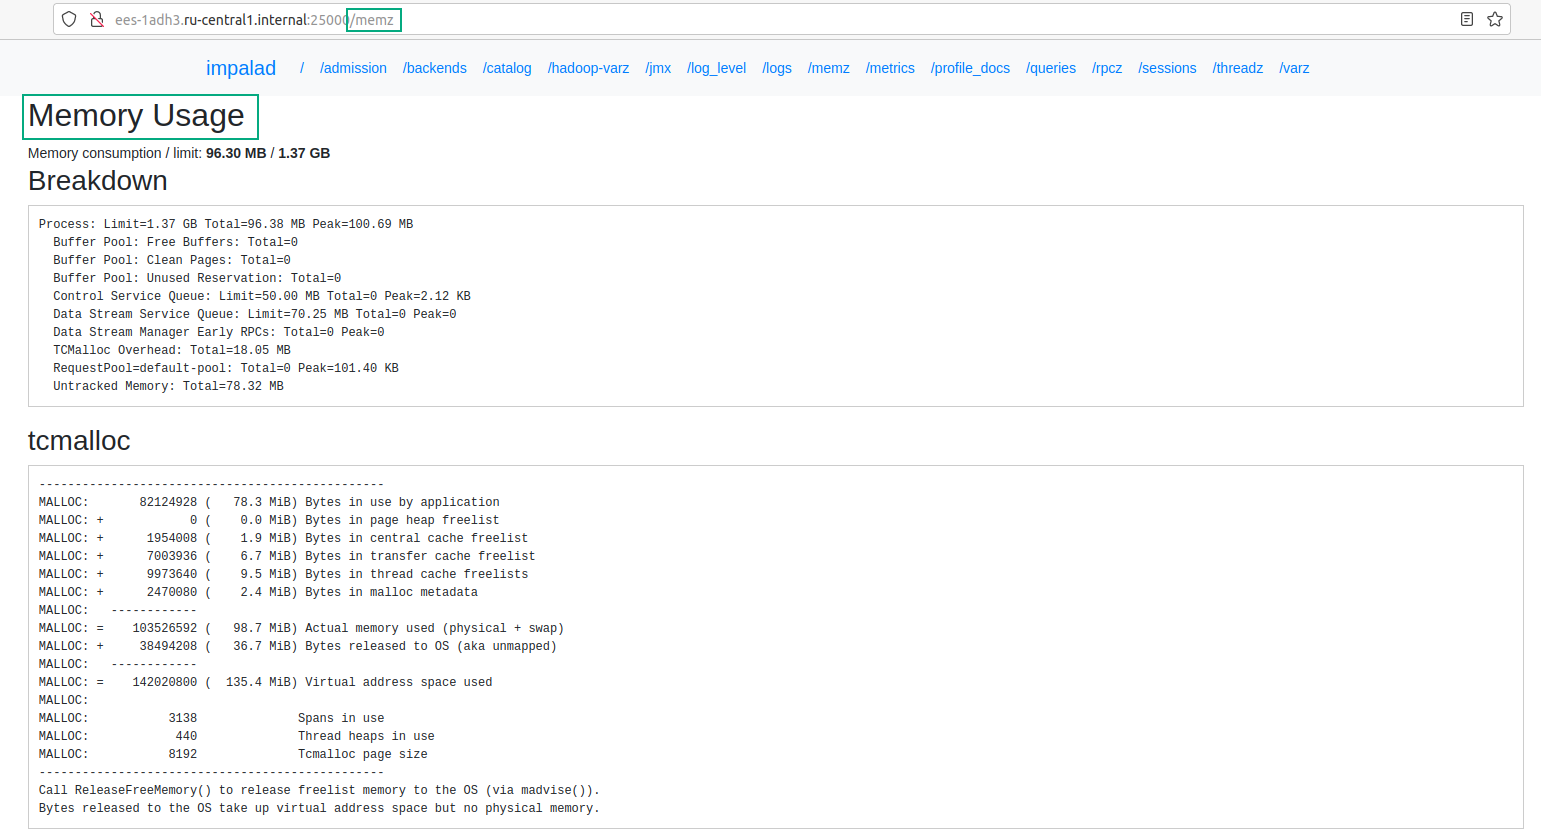
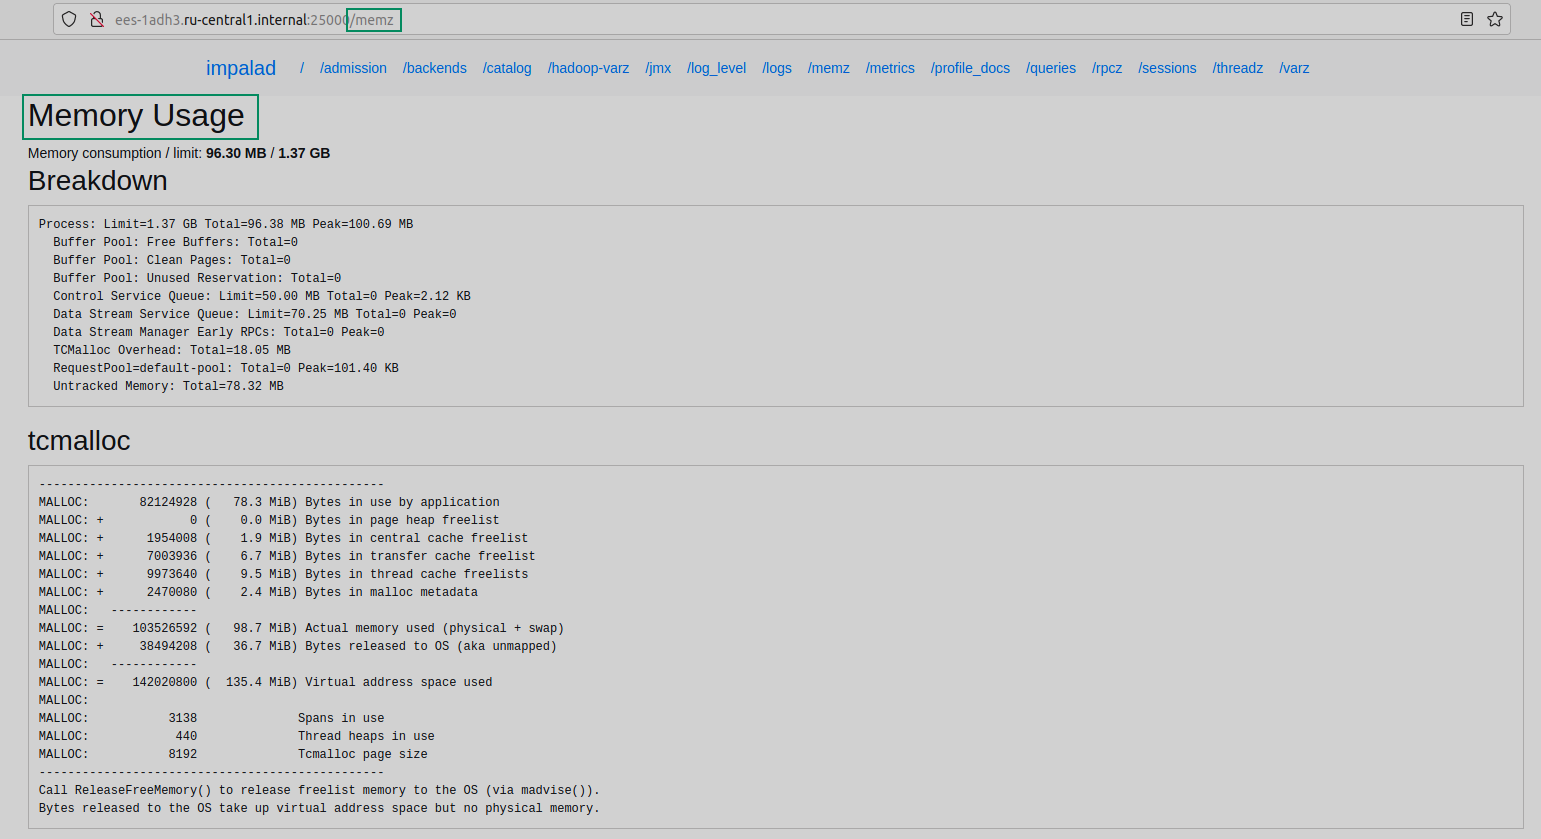
You can use the menu at the top of the main web UIs pages to navigate through the pages described below. Alternatively, add a slash (/) and the page name (for example, /memz) to the HTTP address in the browser to open this page.
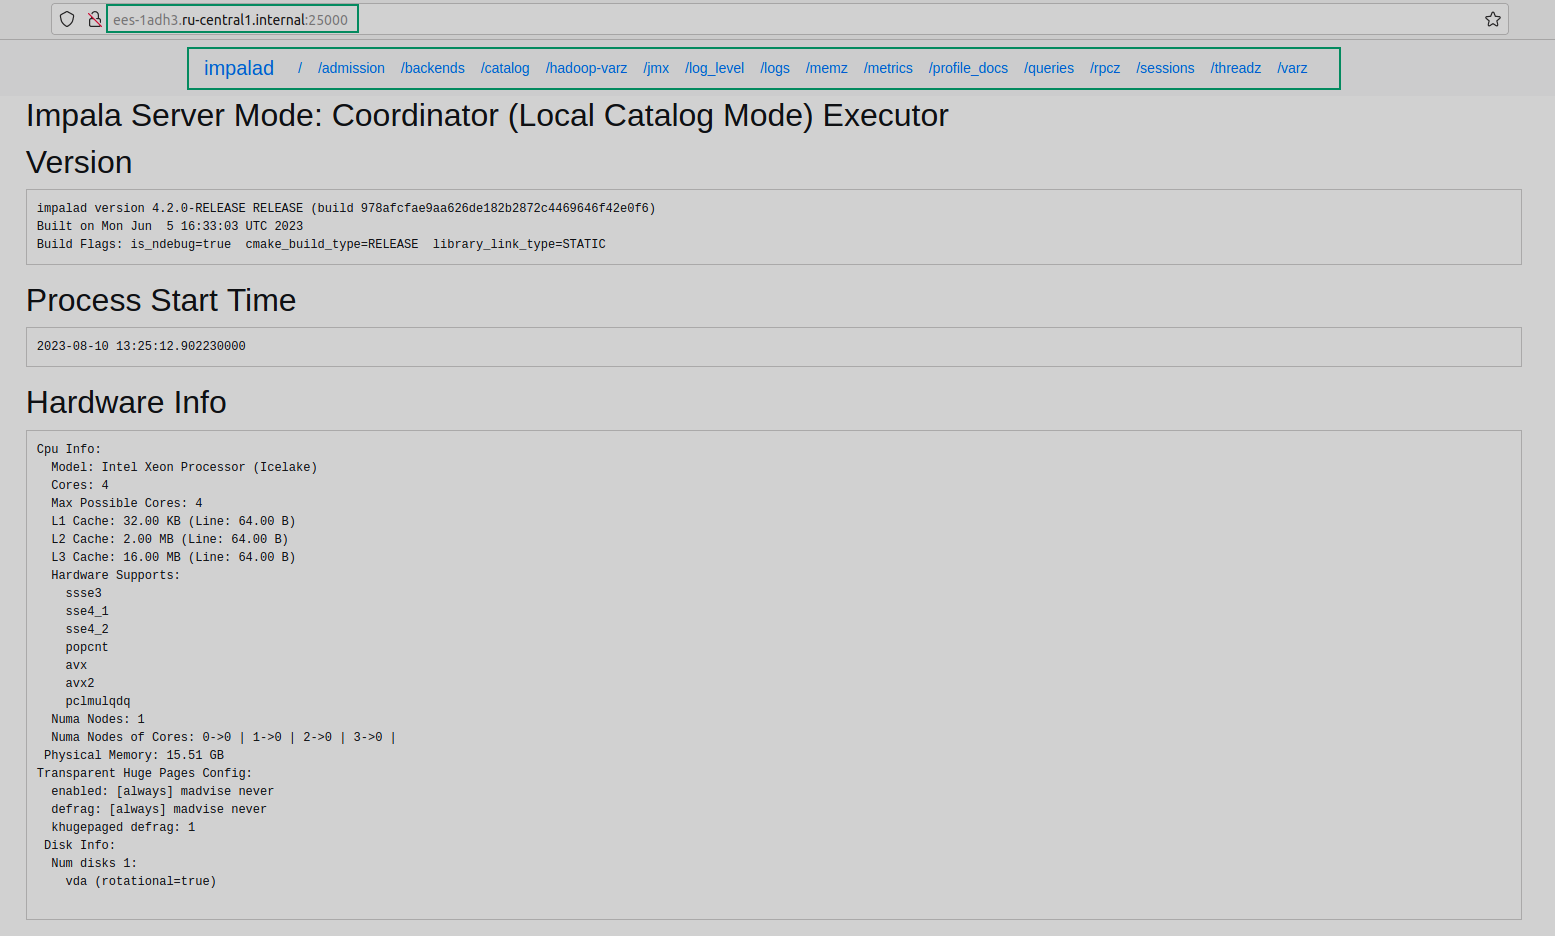
Impala Daemon (impalad) web UI
The impalad web UI includes information about configuration settings, running and completed queries, and associated performance and resource usage for queries.
Each host that runs the impalad daemon has its own instance of the web UI, with details about queries for which this host was a coordinator. To investigate a problem with queries, select the node that was the coordinator for them.
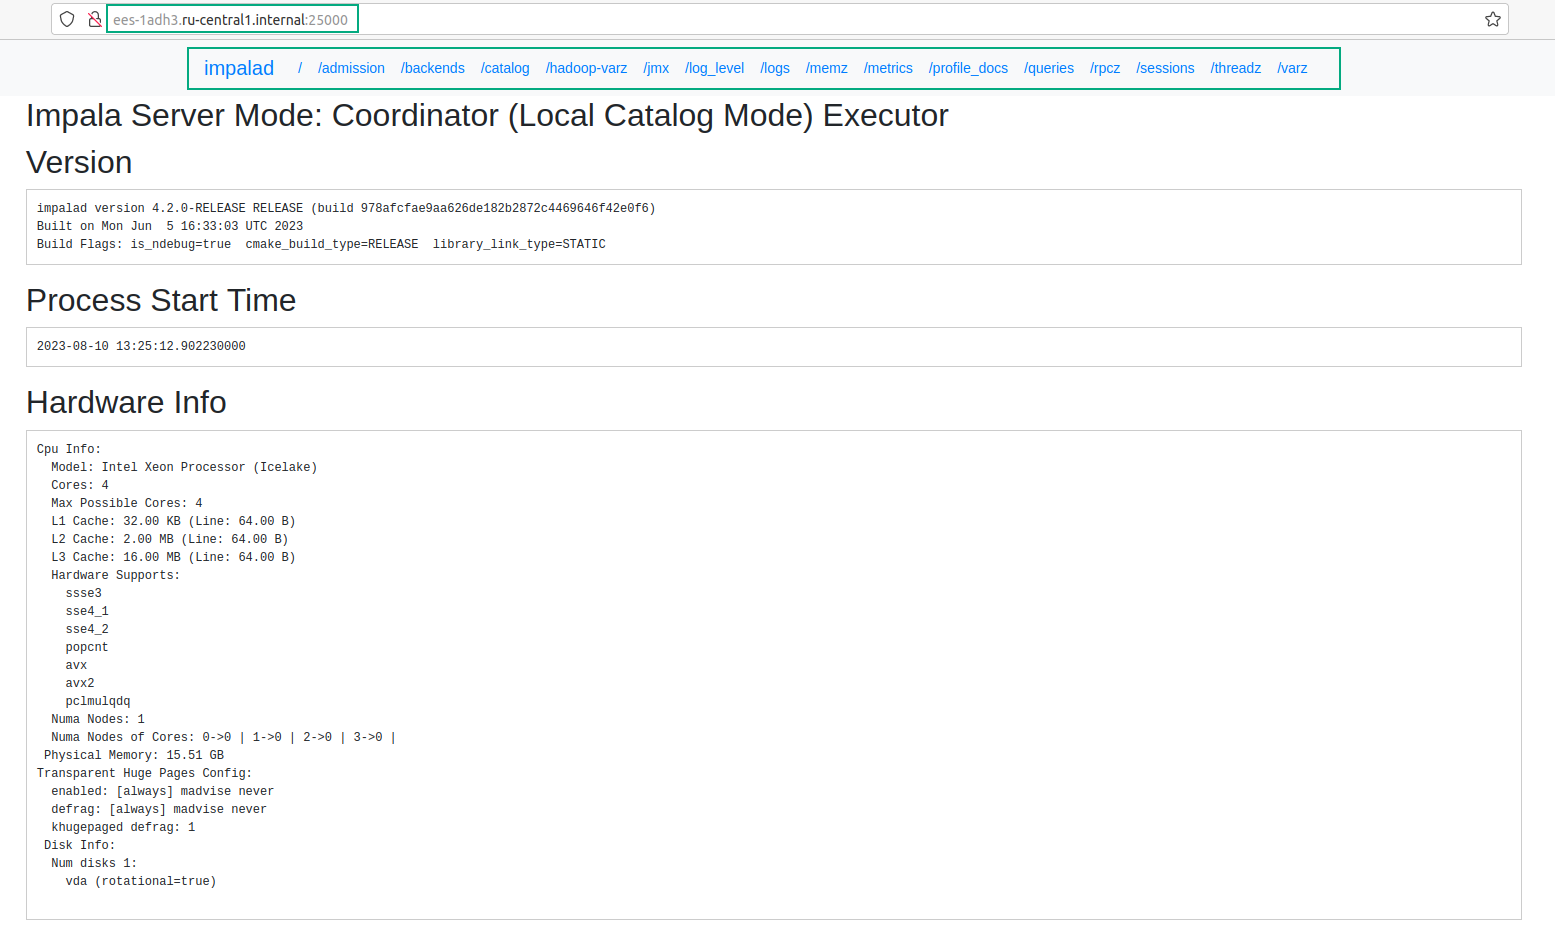
The main impalad web UI page contains the following information about impalad:
-
Version — the version of the daemon and information about when Impala was built and what build flags were used.
-
Process start time — the time when the daemon was started.
-
Hardware info — information about the host hardware.
-
OS information — information about the operating system that is installed on the host.
-
Process information — information about the daemon process.
-
CGroup information — information about CGroup settings.
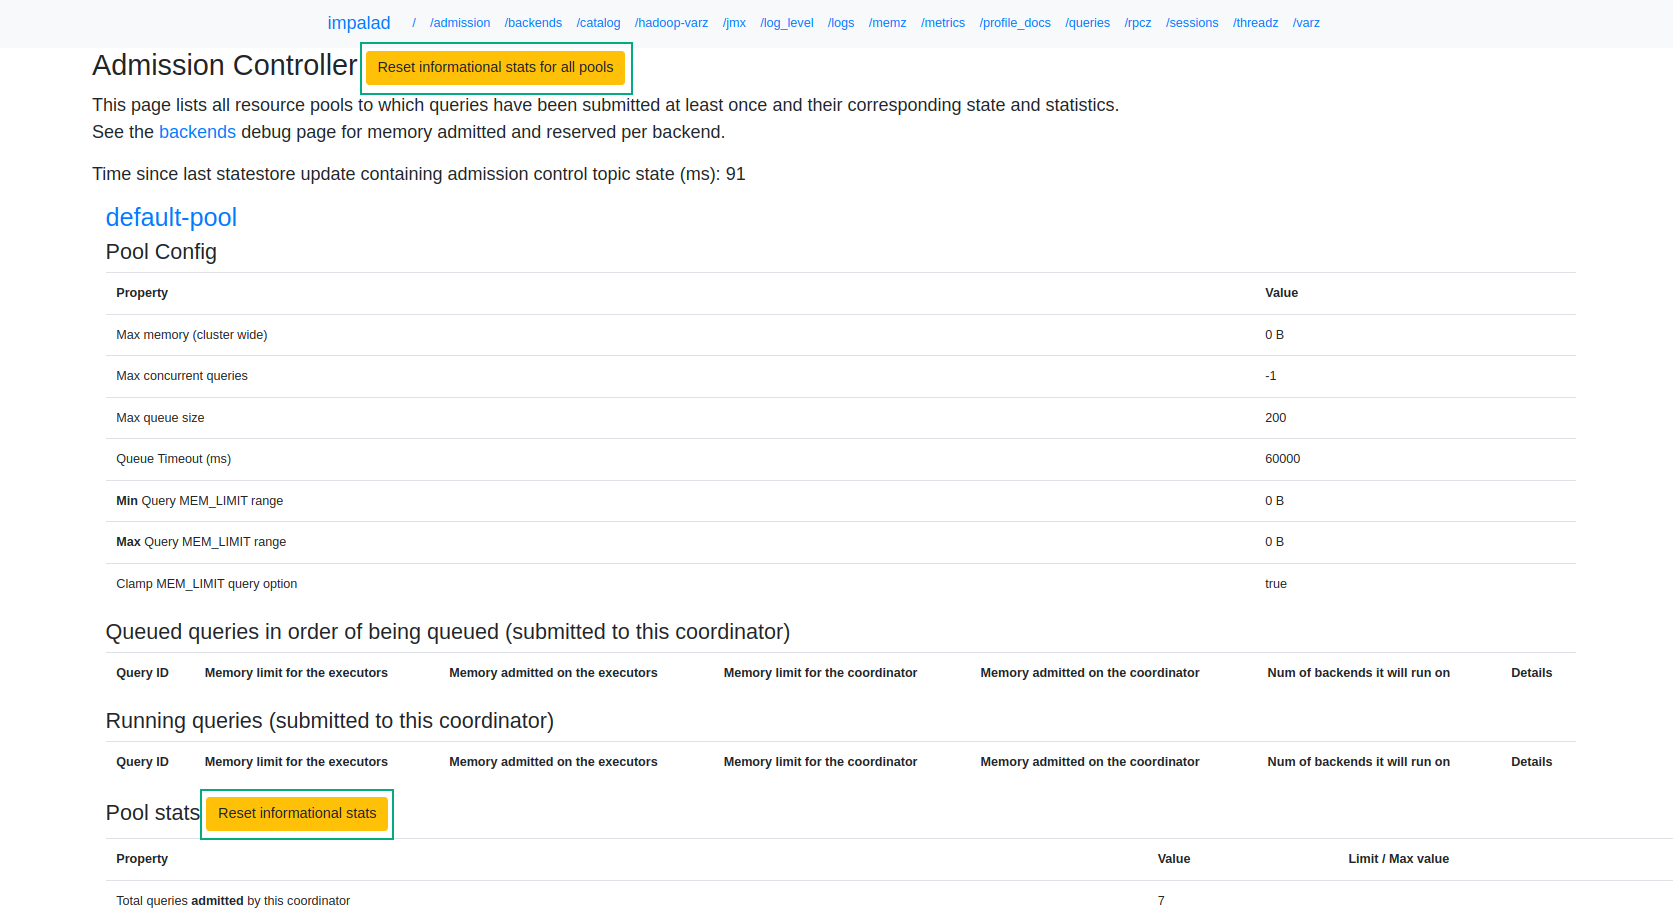
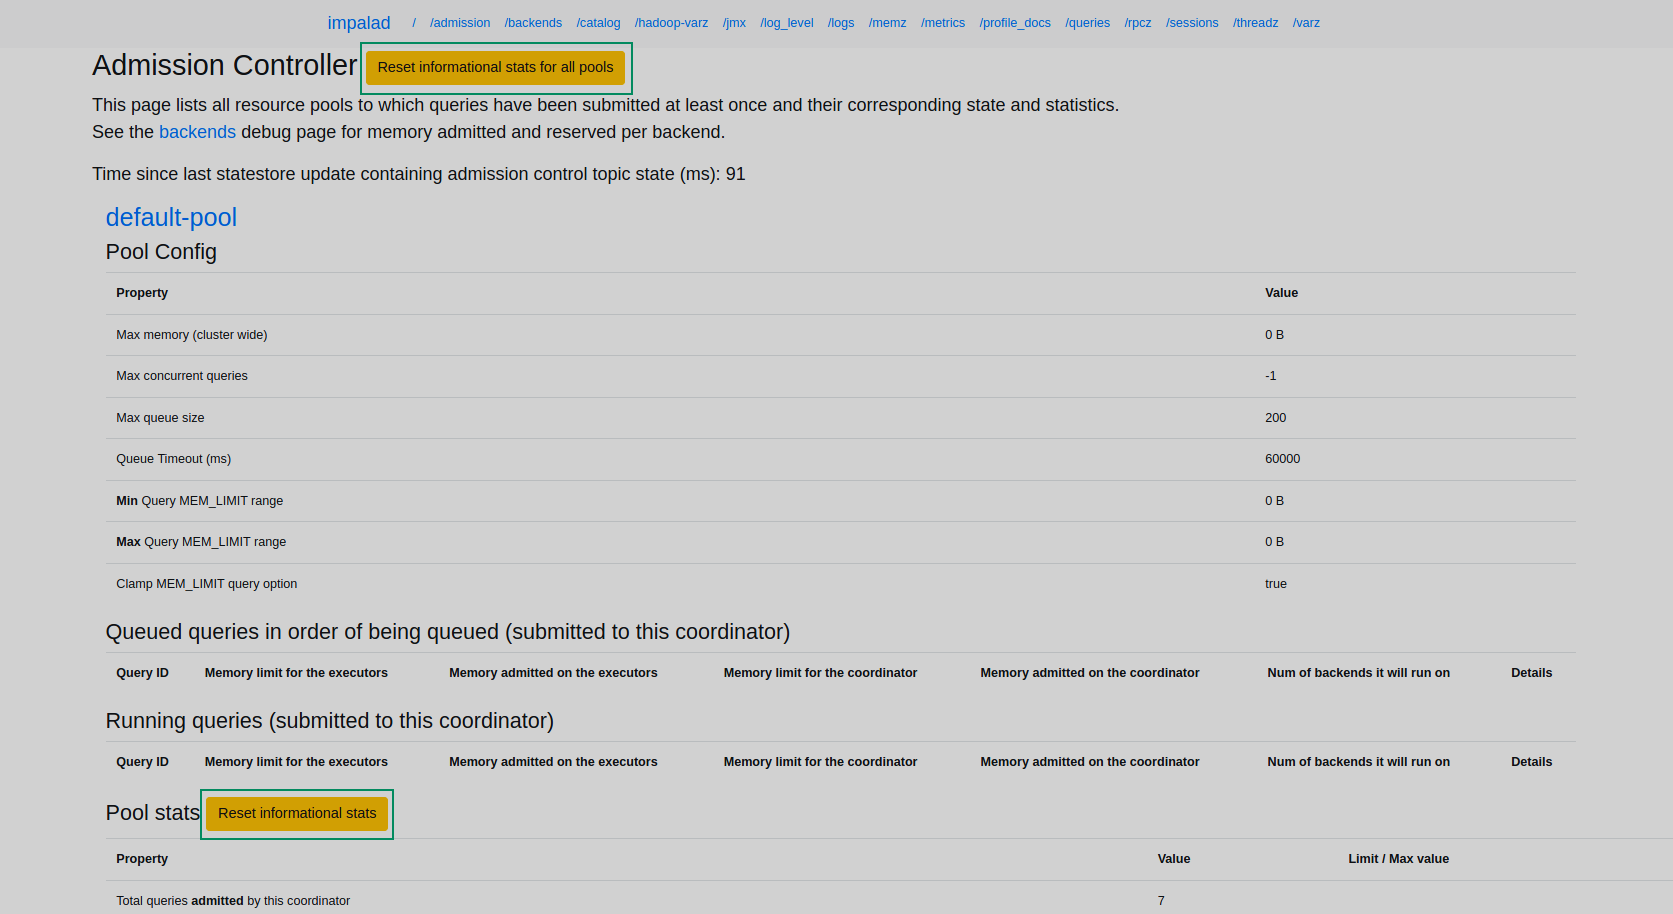
The Admission Controller page lists all resource pools to which queries have been submitted at least once and their state and statistics.
The page provides the following information about each resource pool:
-
The time since the statestored received the last update.
-
A warning if this impalad is disconnected from the statestored and the information on this page can be out of date.
-
Pool configuration.
-
Queued queries submitted to this coordinator in the order of submission.
-
Running queries submitted to this coordinator.
-
Pool statistics. The time in queue parameter is calculated as an exponential moving average which represents the average time in queue over the last 10 to 12 queries. If a query is accepted immediately, this average wait time is calculated using the wait time
0. -
Histogram of the peak memory distribution. It takes into account the memory used by queries admitted to the pool. The histogram displays data for all queries admitted to the pool, including completed, canceled, and failed queries.
You can click Reset informational stats to reset the statistics of historical data, such as total stats, time in queue, and the histogram for a current pull or click Reset informational stats for all pulls to clear statistics for all pools.
The Admission Controller statistics are also available as a JSON object from the following HTTP endpoint: http://<server‑hostname>:<port>/admission?json. Example: /http://adh-host1.ru-central1.internal:25000/admission?json. For more information, see Admission Control and Query Queuing.
This page lists the following info for each of the impalad nodes in the cluster:
-
Address — address of the node (a host name and port).
-
KRPC Address — a KRPC address of the node. It can be used in the
SHUTDOWNcommand. -
Backend Id.
-
Coordinator — a boolean value that shows whether the node is a coordinator.
-
Executor — a boolean value that shows whether the node is an executor.
-
Memory Limit for Admission — the amount of memory that can be admitted to this backend by the admission controller.
-
Memory Reserved — the amount of memory reserved by queries on this backend.
-
Memory Admitted by Queries Submitted to this Coordinator — the memory required for queries processed by this coordinator.
-
Admission Control Slots In Use — the number of used Admission control slots.
-
Num. Queries Admitted by this Coordinator — the number of queries processed by the current coordinator.
-
Executor Groups.
If there is any stopped impalad daemon, nodes are divided into two tables: Active backend(s) and Quiescing backend(s).
Since each impalad daemon knows about other impalad daemons through Statestore, all impalad web servers should display the same information.
The Catalog page displays a list of databases and associated tables. You can use this page to determine which database includes a particular table, check the spelling of a database or table name, search for the same table names in multiple databases. The main use case in debugging would be to check if the impalad instance knows about a table from a particular database.
This page displays the Hadoop common configuration settings with which Impala is running.
This page displays monitoring information about various JVM subsystems in the JSON format, for example, memory pools, thread management, runtime, and others.
This page displays the current Java and backend log levels and allows you to change the log levels dynamically without restarting the daemon.
This page shows the latest entries of the impalad.INFO
log file, including the info, warning, and error logs. You can see the details of the most recent operations to determine whether the operations succeeded or encountered errors.
This page allows you to avoid searching log files in the file system.
This page displays the summary and detailed information about memory usage by the impalad daemon.
The page displays the current set of metrics, counters, and flags representing various aspects of the daemon internal operations.
The page lists counters of the PROFILE statement.
The page contains the following tables:
-
Queries in flight — running queries.
-
Waiting to be closed — queries that have completed their execution, but have not been closed yet.
-
Last 100 completed queries — the latest completed queries. You can control the number of queries and therefore the amount of memory allocated to store information about completed queries, by specifying the
--query_log_sizestartup option for impalad. -
Query Locations — shows how running queries are distributed among the impalad hosts.
The queries are listed in reverse chronological order, with the most recent at the top.
The Details link for each query displays alternative views of the query including a graphical representation of the plan, and the output of the EXPLAIN, SUMMARY, and PROFILE statements from impala-shell. On the Profile tab of the query Details page, you can export the query profile output to the Thrift, JSON, or text format.
The page displays information about the duration of RPC communications of the current daemon with other Impala daemons.
The page displays information about the sessions currently connected to this impalad instance. For example, sessions can include connections from impala-shell or JDBC.
The page displays information about the threads used by the current daemon and shows which categories they are grouped into.
The page shows the configuration settings that are used when this daemon communicates with other Hadoop components such as HDFS and YARN. The settings are collected from configuration files.
The page contains metrics in the Prometheus format. Prometheus can consume this data for monitoring and alerting.
The menu does not contain the /metrics_prometheus option. To display this page, add /metrics_prometheus to the HTTP address in the browser.
Impala Statestore (statestored) web UI
The statestored web UI includes information about memory usage, configuration settings, and ongoing health checks. Since there is only a single instance of the statestored within a cluster, you can access the statestored web UI only on a host with the Impala Statestore component.
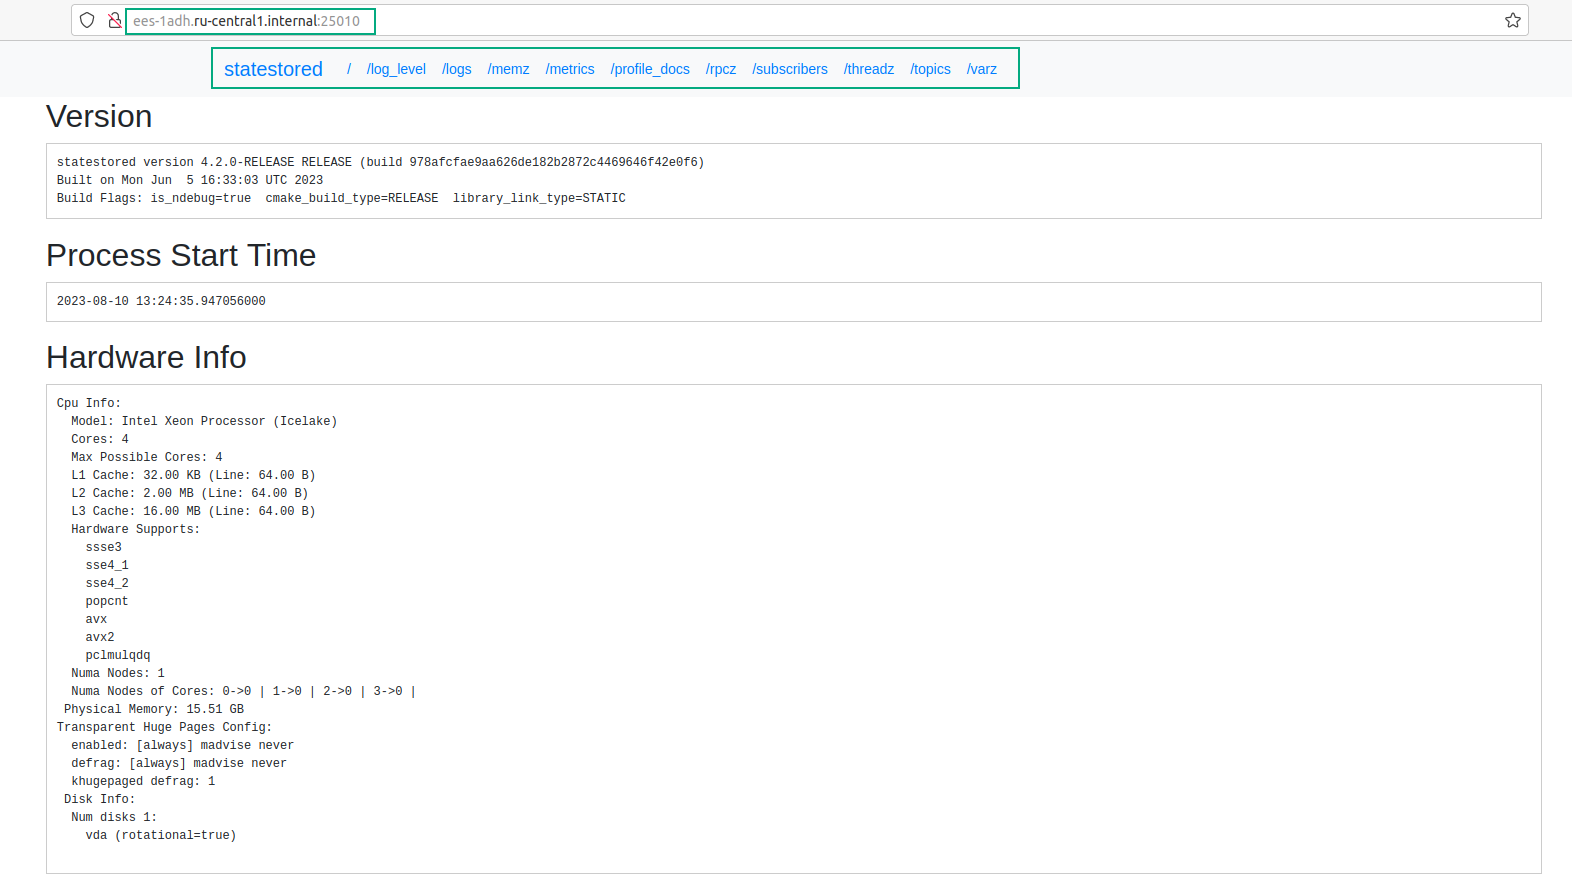
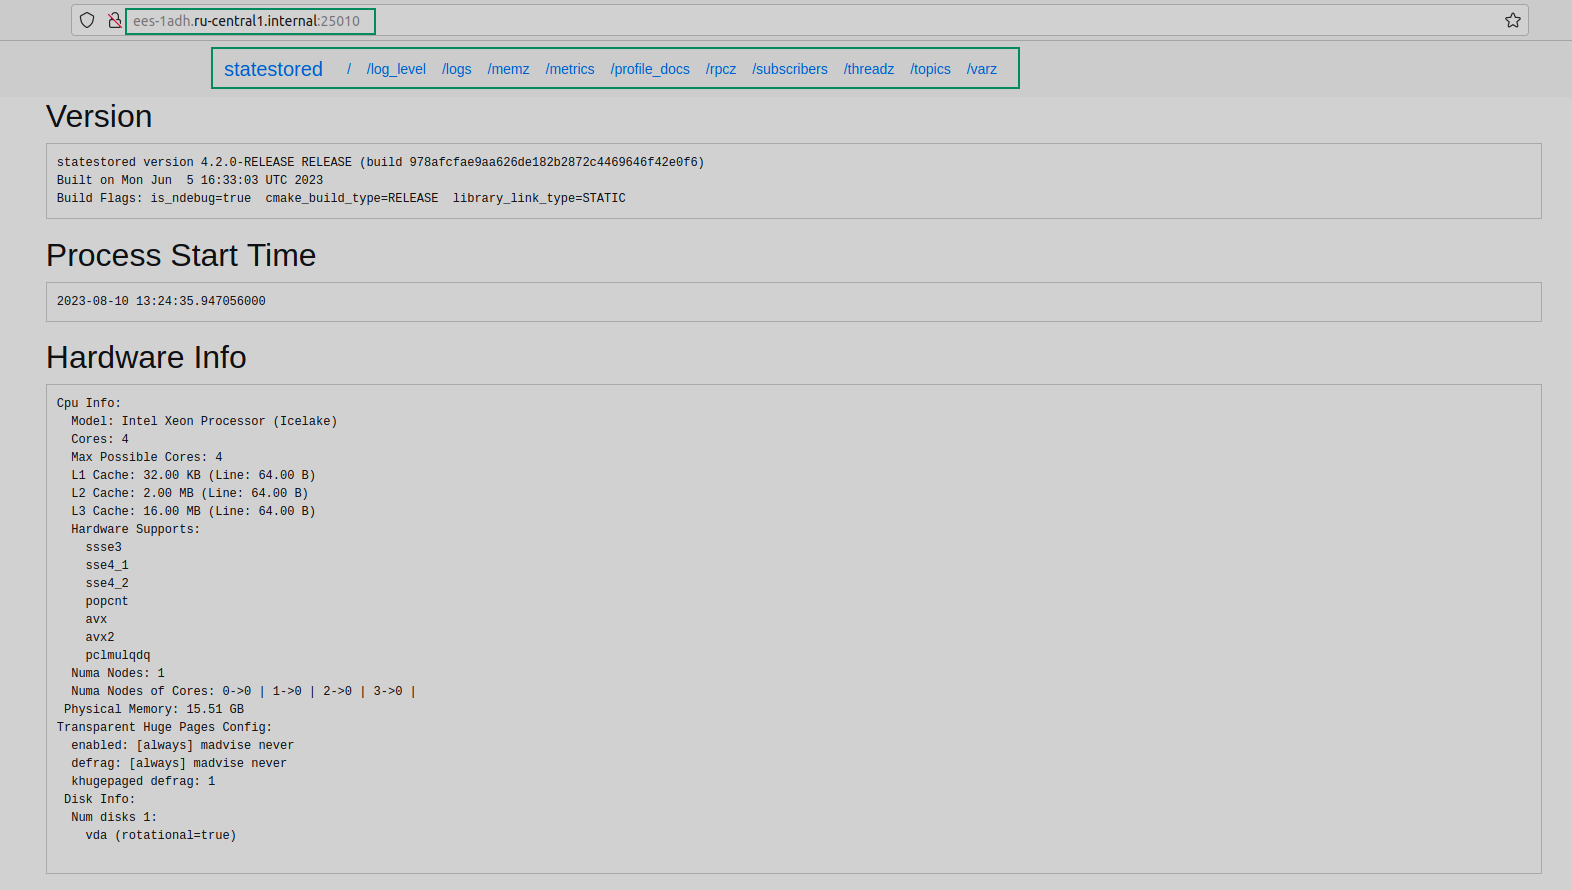
The main statestored web UI page contains the following information about statestored:
-
Version — the version of the daemon and information about when Impala was built and what build flags were used.
-
Process start time — the time when the daemon was started.
-
Hardware info — information about the host hardware.
-
OS information — information about the operating system that is installed on the host.
-
Process information — information about the daemon process.
-
CGroup information — information about CGroup settings.
This page displays the current Java and backend log levels and allows you to change the log levels dynamically without restarting the daemon.
This page shows the latest entries of the statestored.INFO
log file, including the info, warning, and error logs. You can see the details of the most recent operations to determine whether the operations succeeded or encountered errors.
This page allows you to avoid searching log files in the file system.
This page displays the summary and detailed information about memory usage by the statestored daemon.
The page displays the current set of metrics, counters, and flags representing various aspects of the daemon internal operations.
The page lists counters of the PROFILE statement.
The page displays information about the duration of RPC communications of the current daemon with other Impala daemons.
The page displays information about Impala daemons that registered with the statestored to receive and send updates.
The page displays information about the threads used by the current daemon and shows which categories they are grouped into.
The page displays information about the metadata topics to which the other Impala daemons subscribed to receive updates.
The page shows the configuration settings that are used when this daemon communicates with other Hadoop components such as HDFS and YARN. The settings are collected from configuration files.
The page contains metrics in the Prometheus format. Prometheus can consume this data for monitoring and alerting.
The menu does not contain the /metrics_prometheus option. To display this page, add /metrics_prometheus to the HTTP address in the browser.
Impala Catalog Service (catalogd) web UI
The catalogd web UI includes information about the databases, tables, and other objects managed by Impala, in addition to the resource usage and configuration settings of the catalogd. Since there is only a single instance of the catalogd within a cluster, you can access the catalogd web UI only on a host with the Impala Catalog Service.
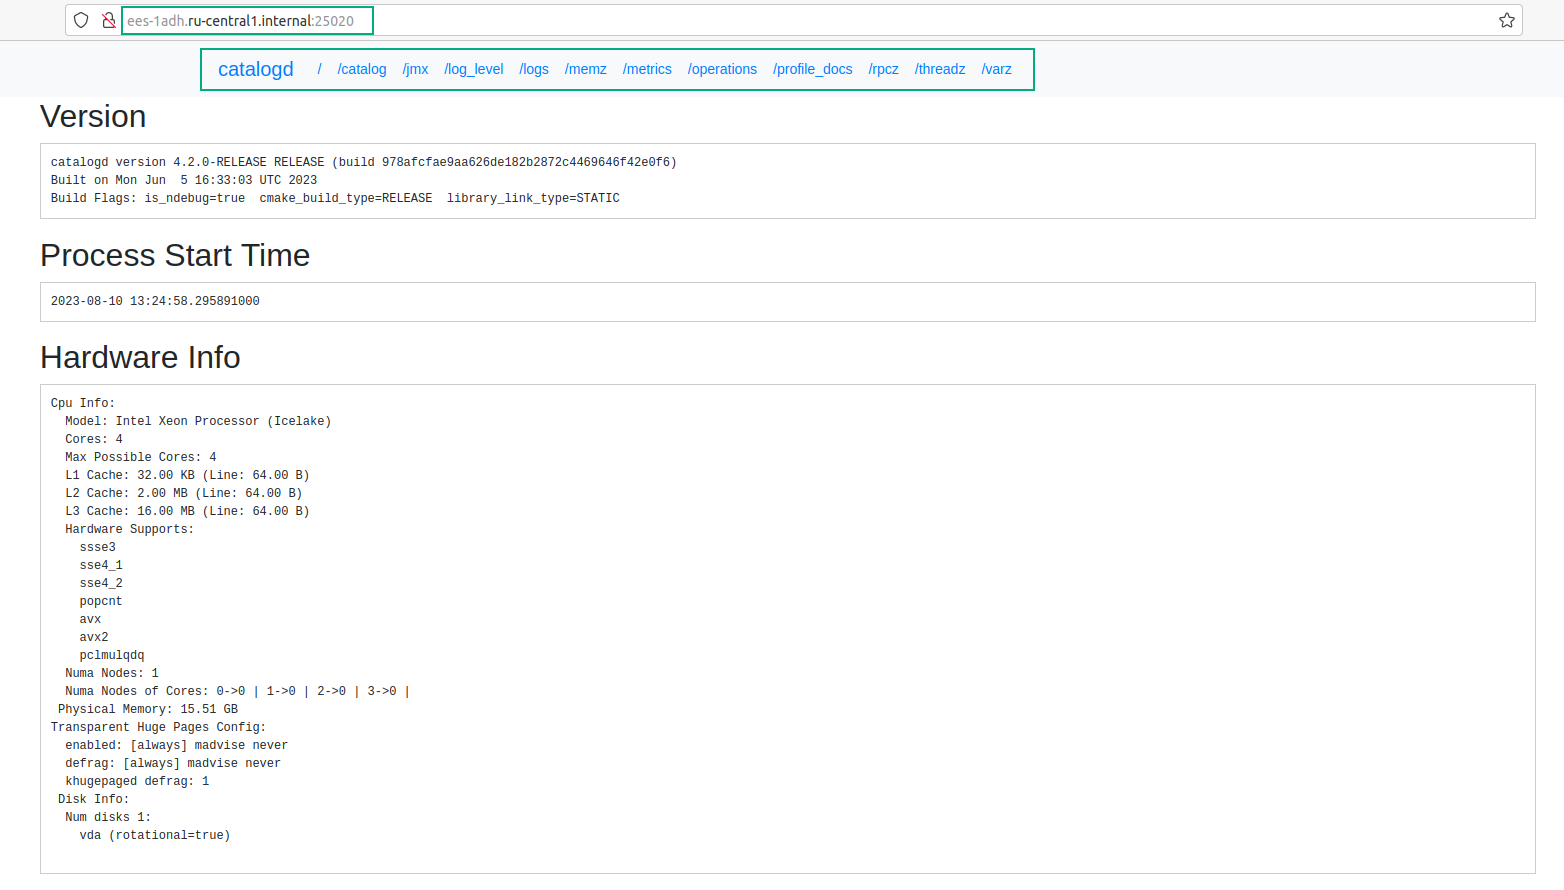
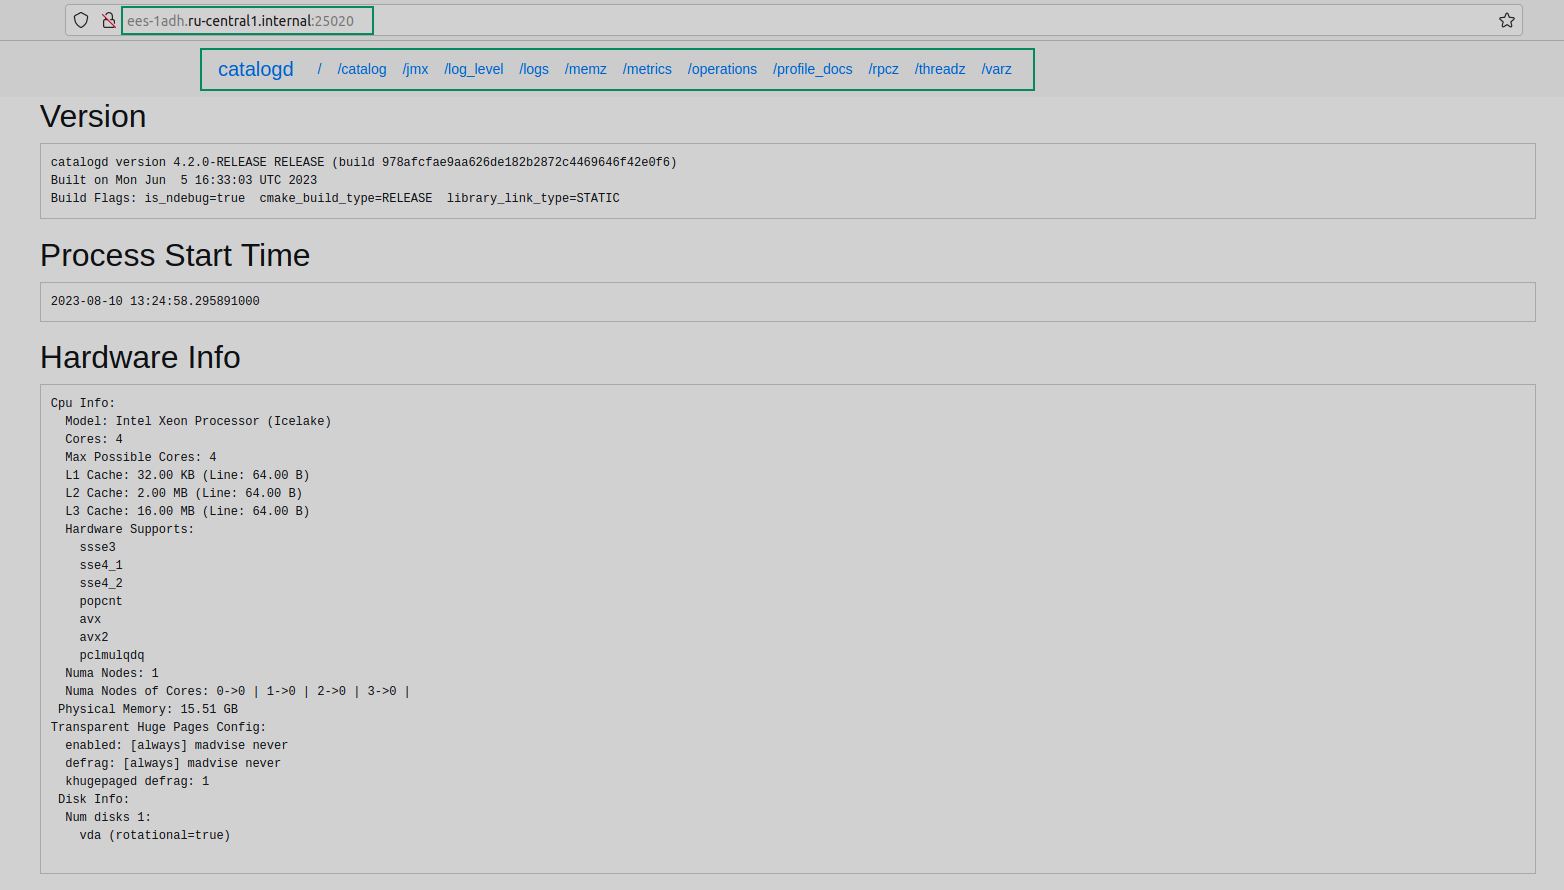
The main catalogd web UI page contains the following information about catalogd:
-
Version — the version of the daemon and information about when Impala was built and what build flags were used.
-
Process start time — the time when the daemon was started.
-
Hardware info — information about the host hardware.
-
OS information — information about the operating system that is installed on the host.
-
Process information — information about the daemon process.
-
CGroup information — information about CGroup settings.
The Catalog page displays a list of databases and associated tables. You can use this page to determine which database includes a particular table, check the spelling of a database or table name, search for the same table names in multiple databases. The main use case in debugging would be to check if the impalad instance knows about a table from a particular database.
In addition to impalad catalog page, the page contains lists of tables with the highest memory requirements, the highest number of metadata operations, the most numbers of files, and with the longest metadata loading time.
This page displays monitoring information about various JVM subsystems in the JSON format, for example, memory pools, thread management, runtime, and others.
This page displays the current Java and backend log levels and allows you to change the log levels dynamically without restarting the daemon.
This page shows the latest entries of the catalogd.INFO
log file, including the info, warning, and error logs. You can see the details of the most recent operations to determine whether the operations succeeded or encountered errors.
This page allows you to avoid searching log files in the file system.
This page displays the summary and detailed information about memory usage by the catalogd daemon.
The page displays the current set of metrics, counters, and flags representing various aspects of the daemon internal operations.
The page displays information about catalogd operations.
The page lists counters of the PROFILE statement.
The page displays information about the duration of RPC communications of the current daemon with other Impala daemons.
The page displays information about the threads used by the current daemon and shows which categories they are grouped into.
The page shows the configuration settings that are used when this daemon communicates with other Hadoop components such as HDFS and YARN. The settings are collected from configuration files.
The page contains metrics in the Prometheus format. Prometheus can consume this data for monitoring and alerting.
The menu does not contain the /metrics_prometheus option. To display this page, add /metrics_prometheus to the HTTP address in the browser.