Flink UI overview
Flink Dashboard is a built-in monitoring interface for Flink applications. You can monitor your running, completed, and stopped Flink jobs on the dashboard. You reach the Flink UI via ADCM using the main page of the Flink service.
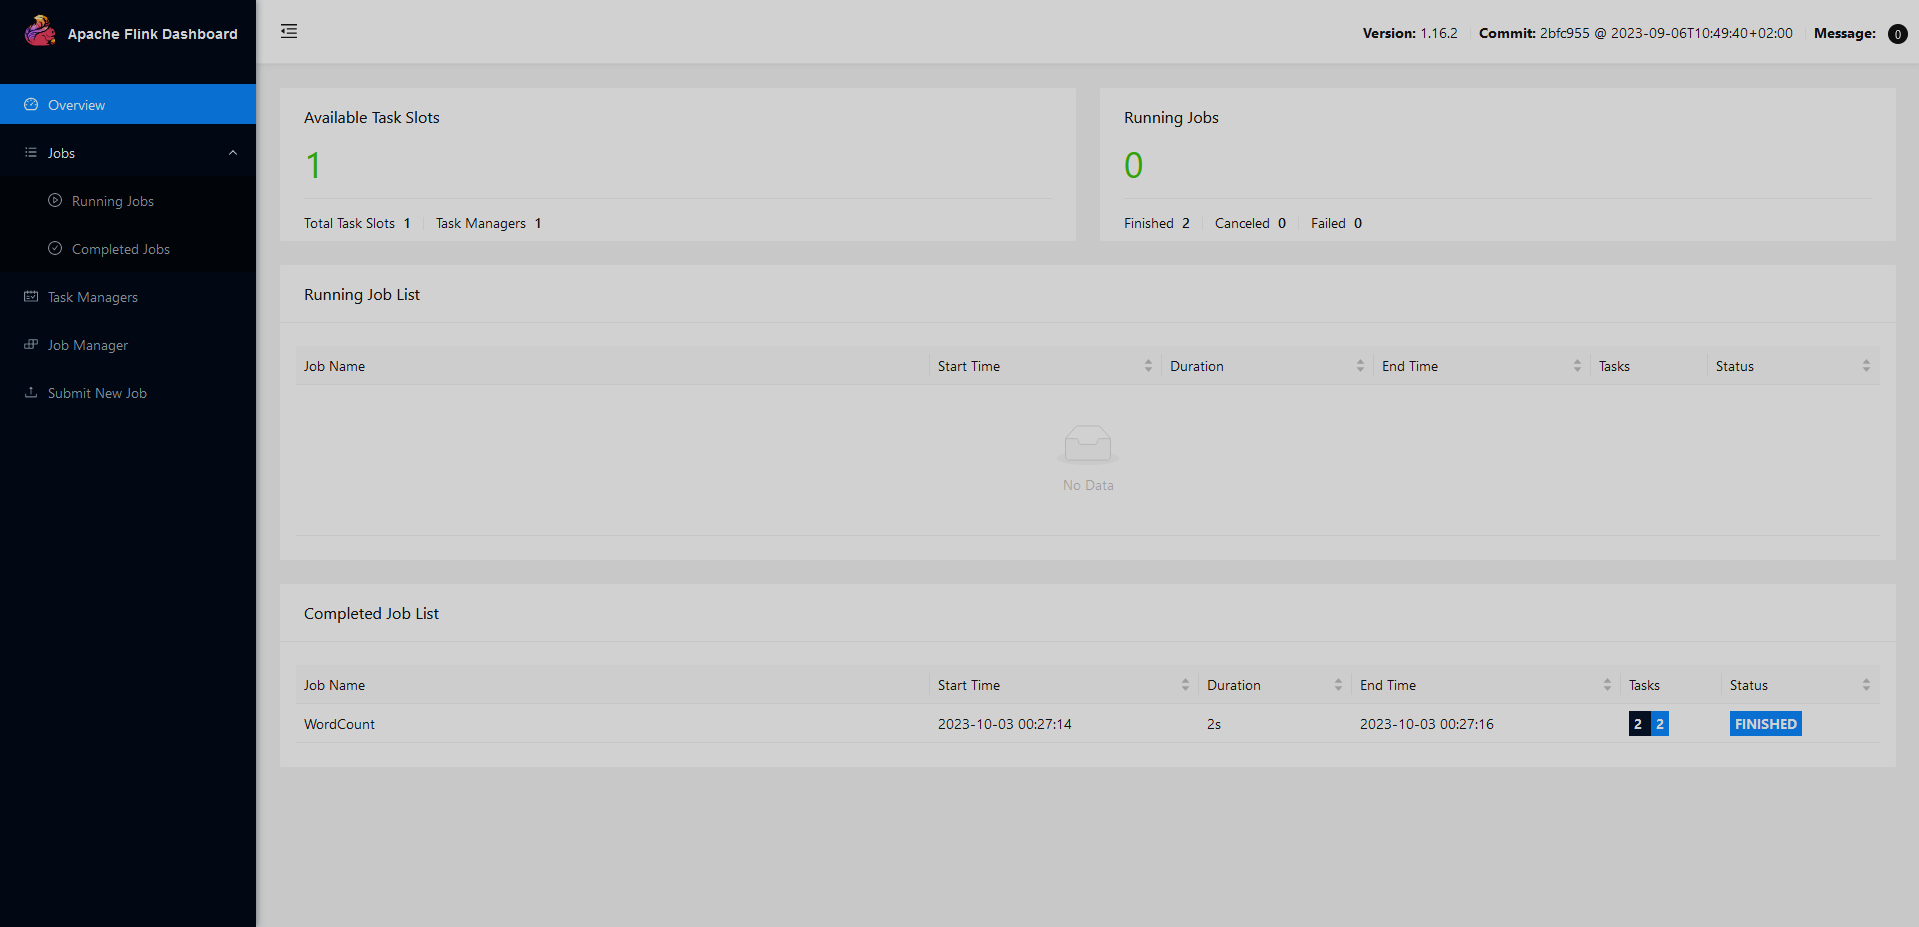
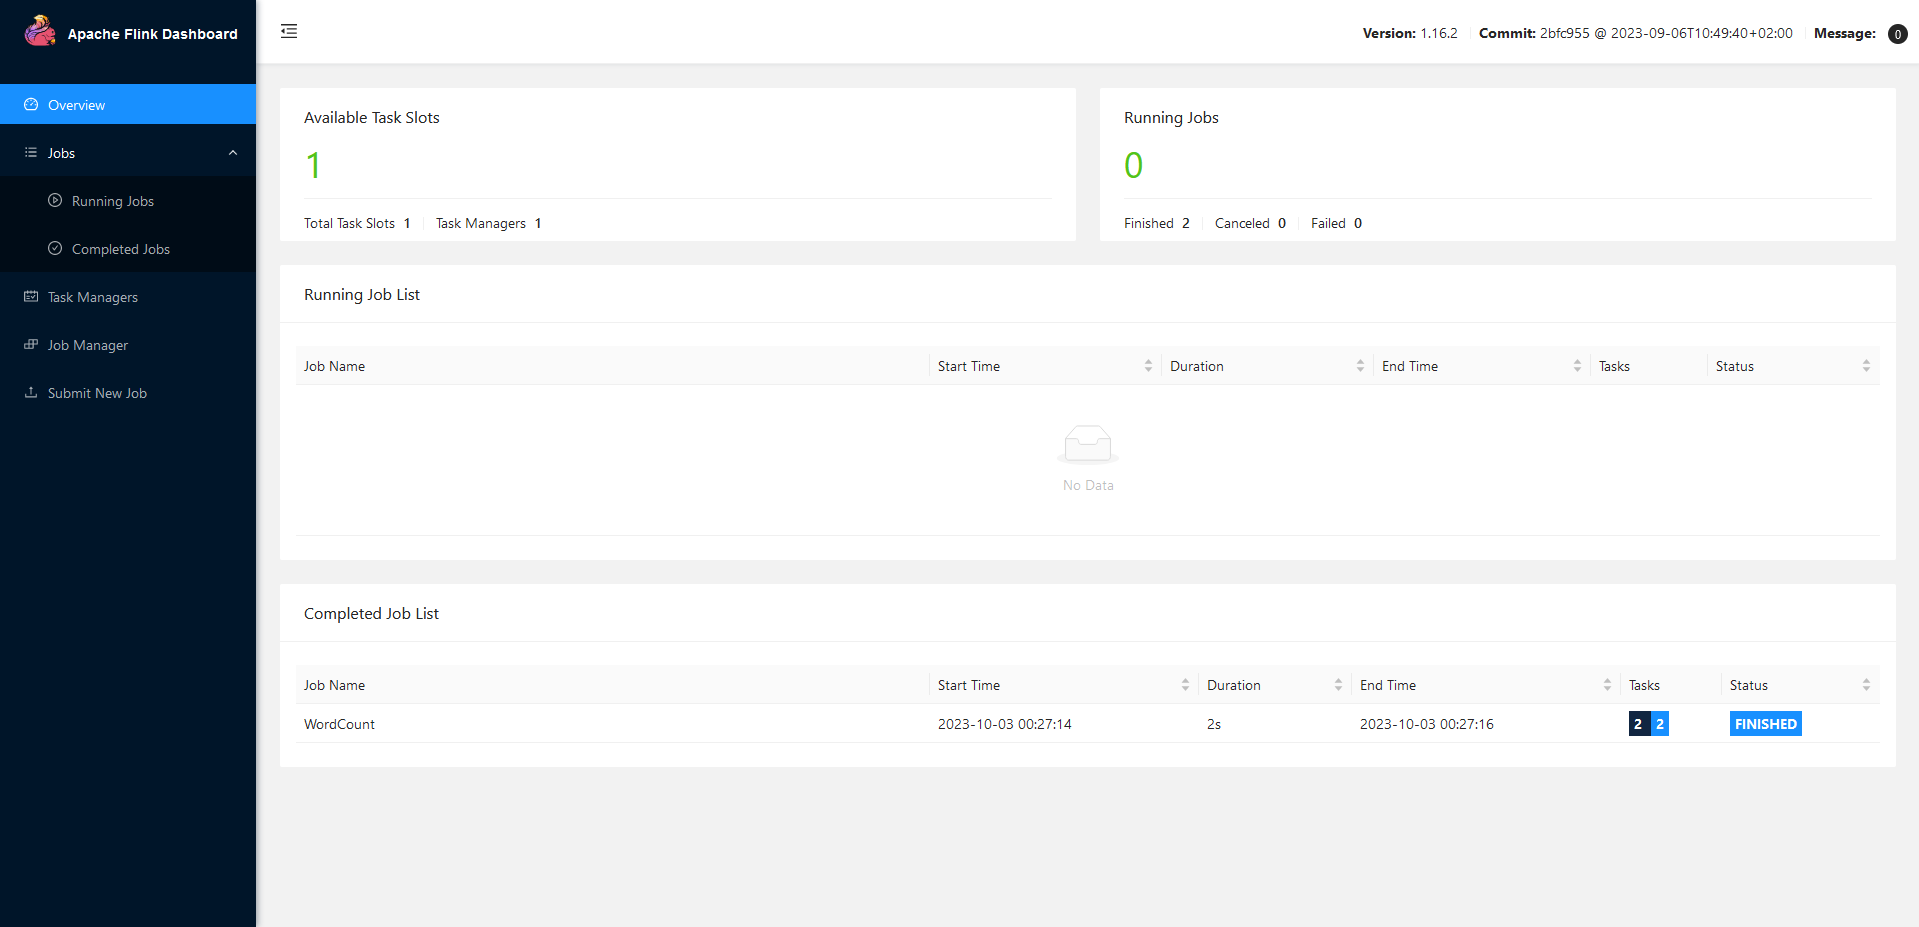
The Flink UI acts as a single point for monitoring all the jobs running on a YARN cluster. It shows all the running, failed, and finished jobs. The URL to the Flink UI looks as follows: http://FQDN:8081. The Flink UI is shown below.
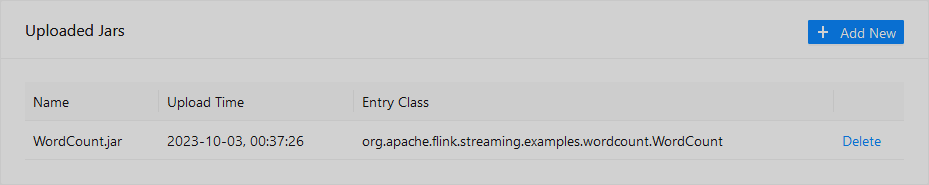
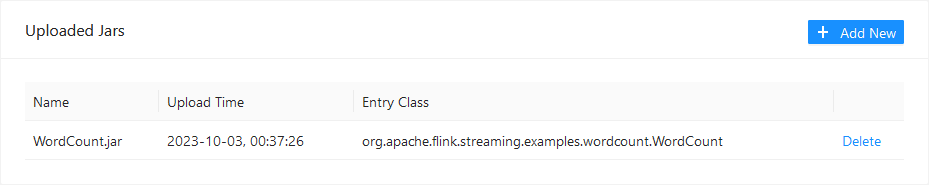
You can add a jar file on the Submit new Job page.
After uploading the jar file you can run it with parameters.
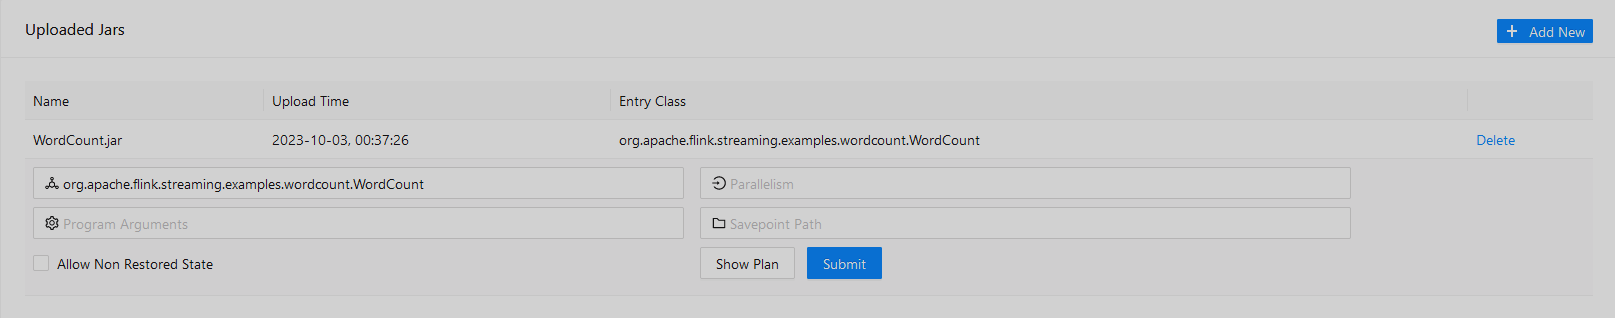
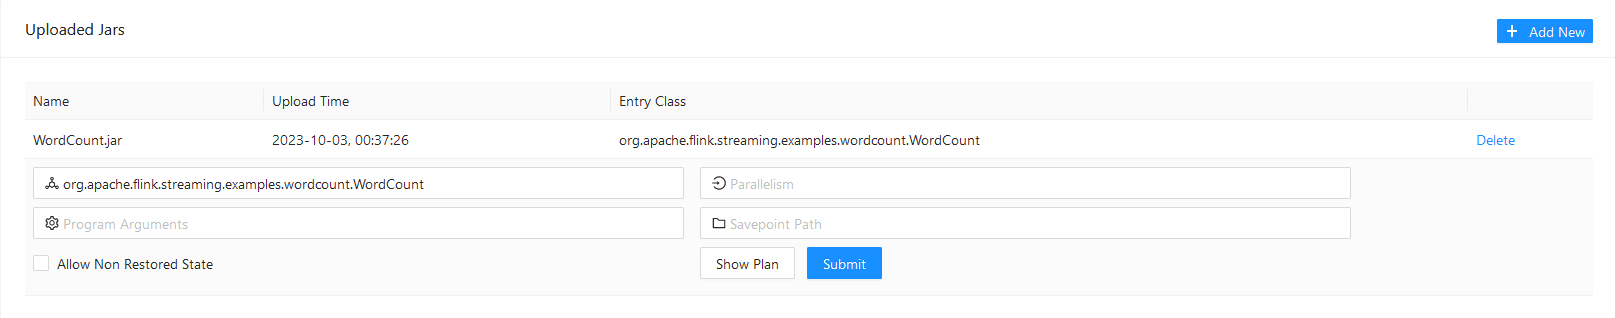
You can specify the parameters and submit the job. When job is completed, you will see all the details on the Completed jobs page.
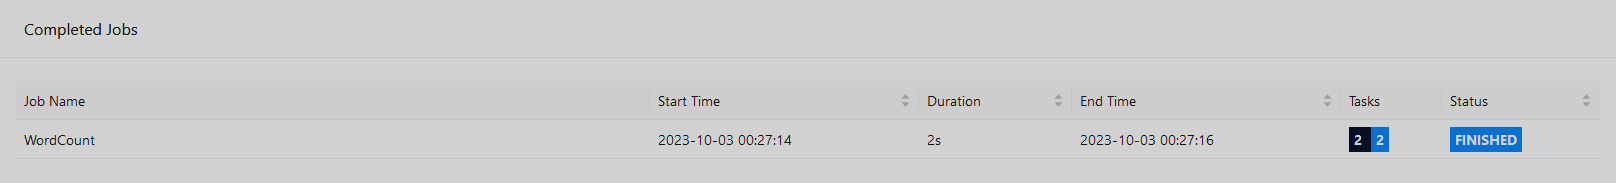
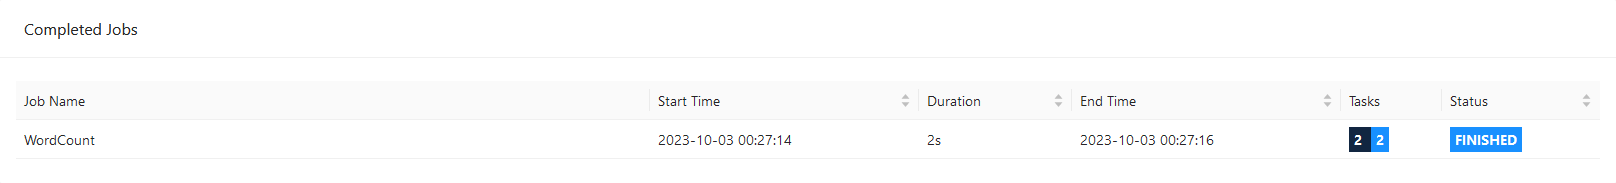
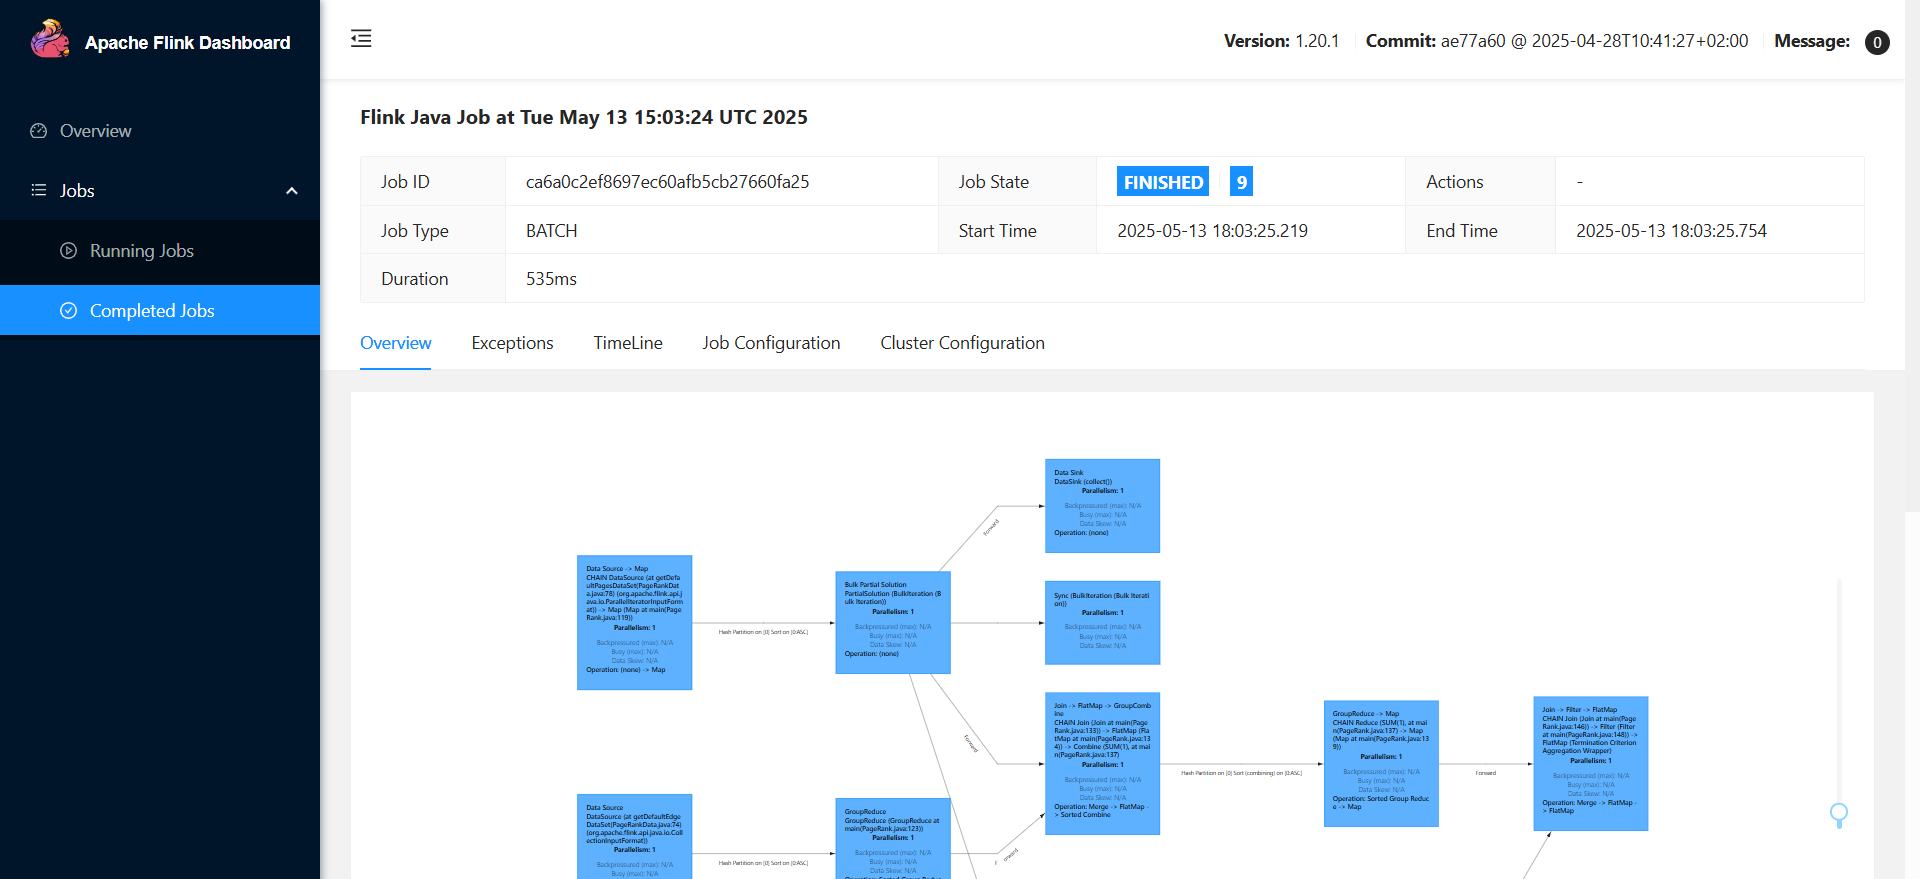
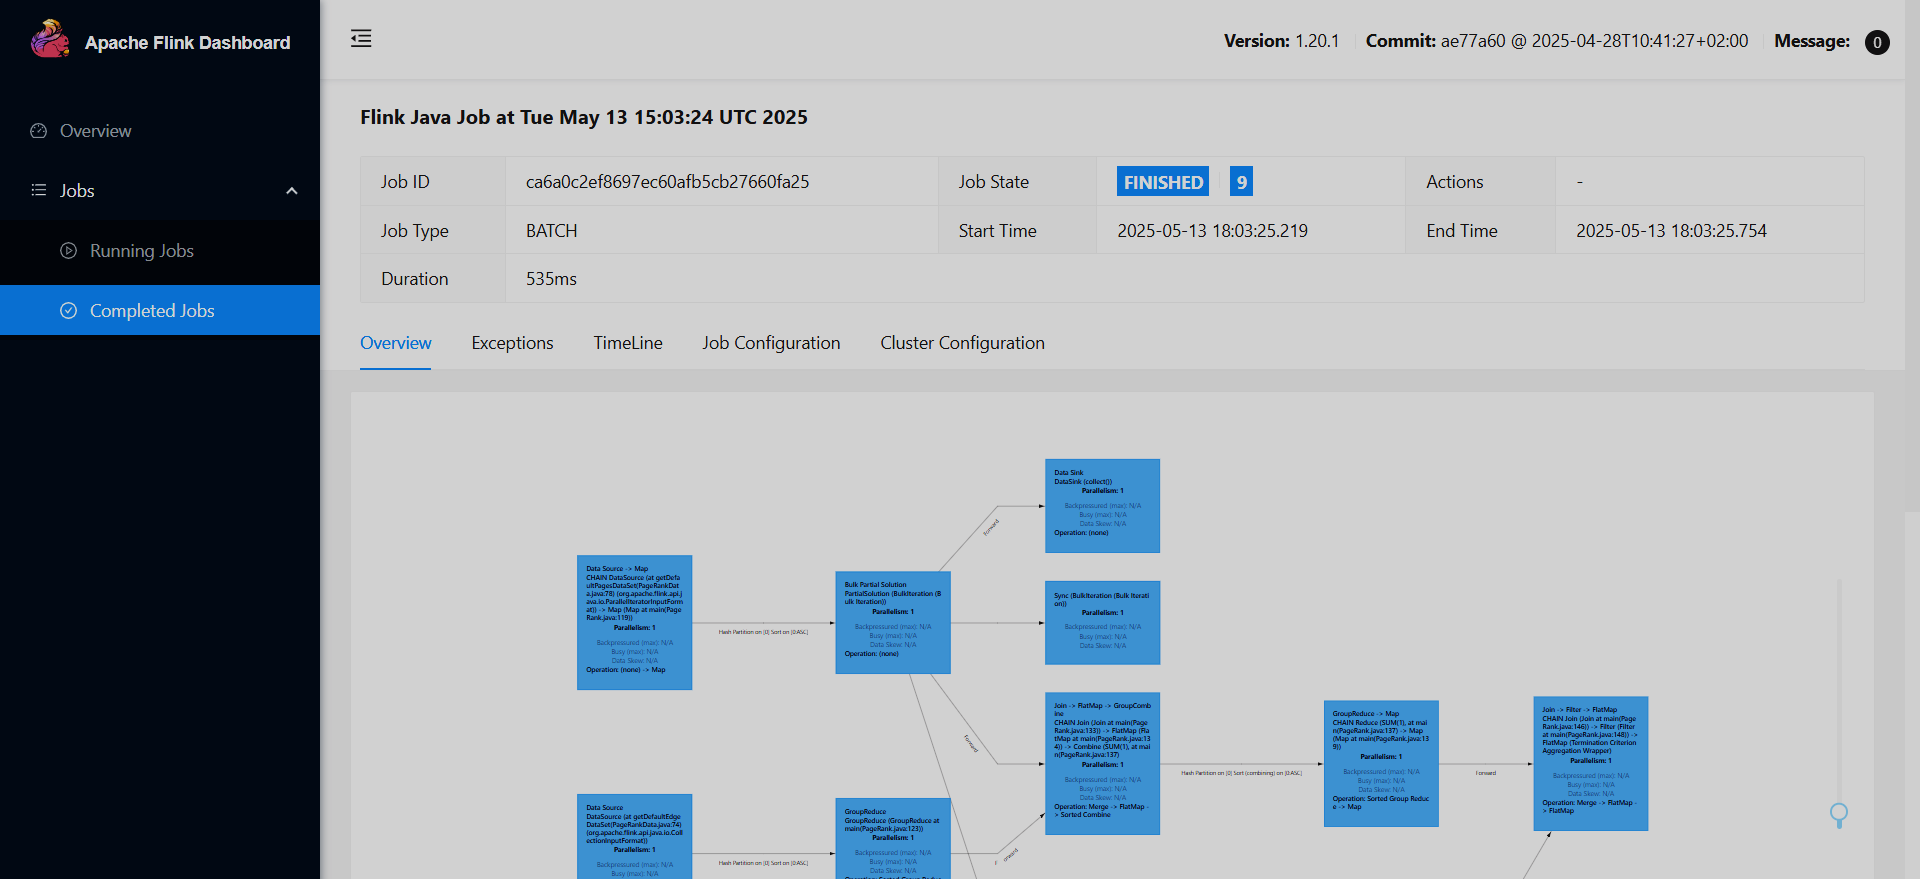
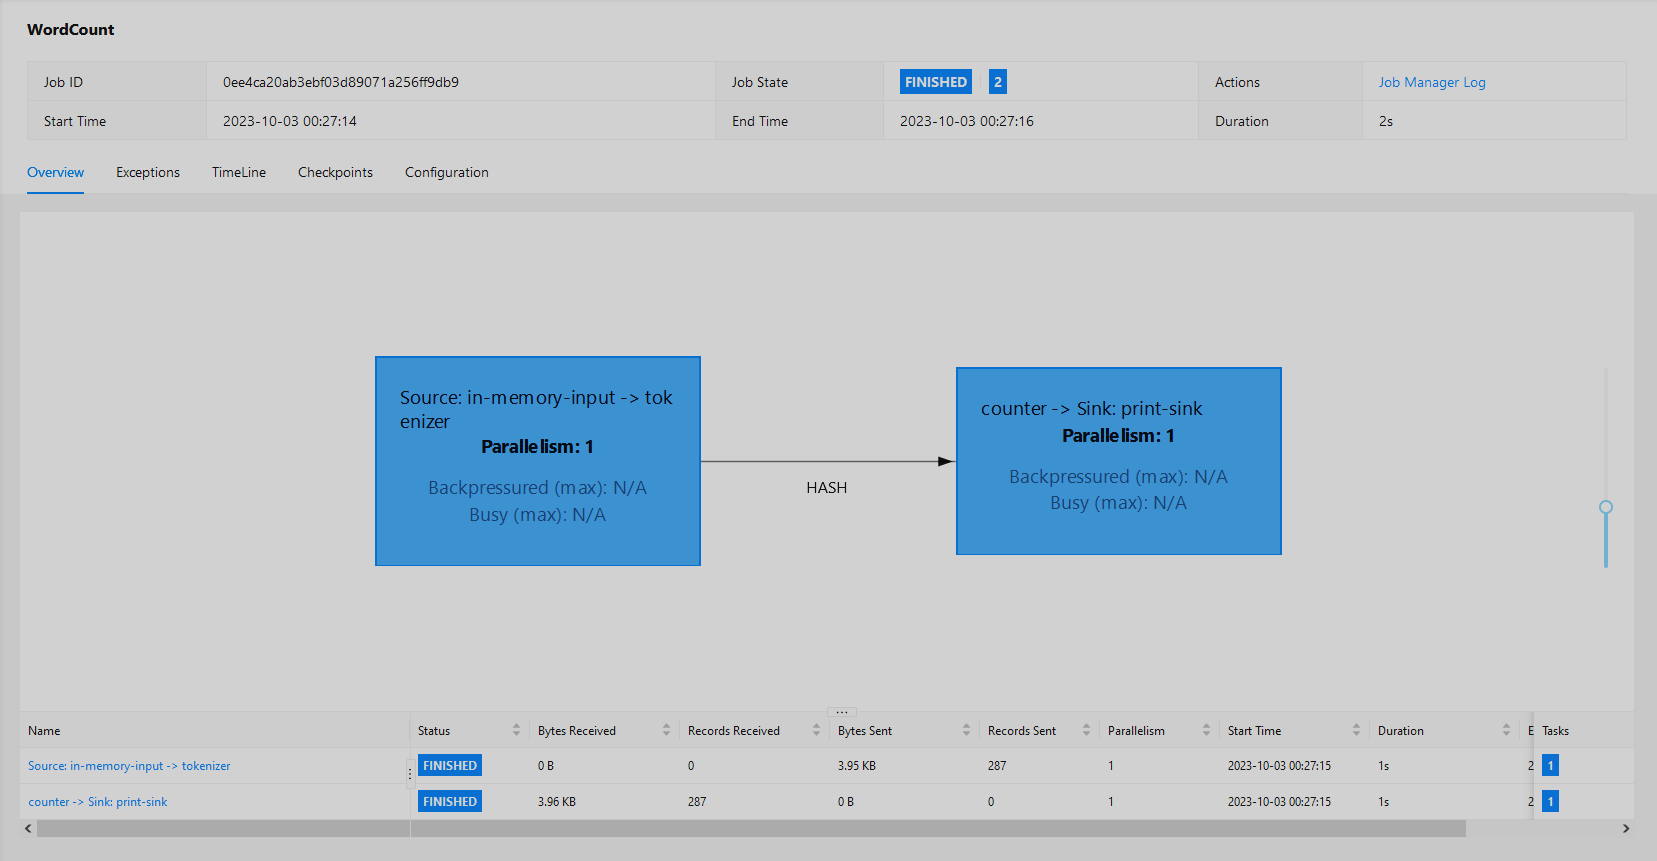
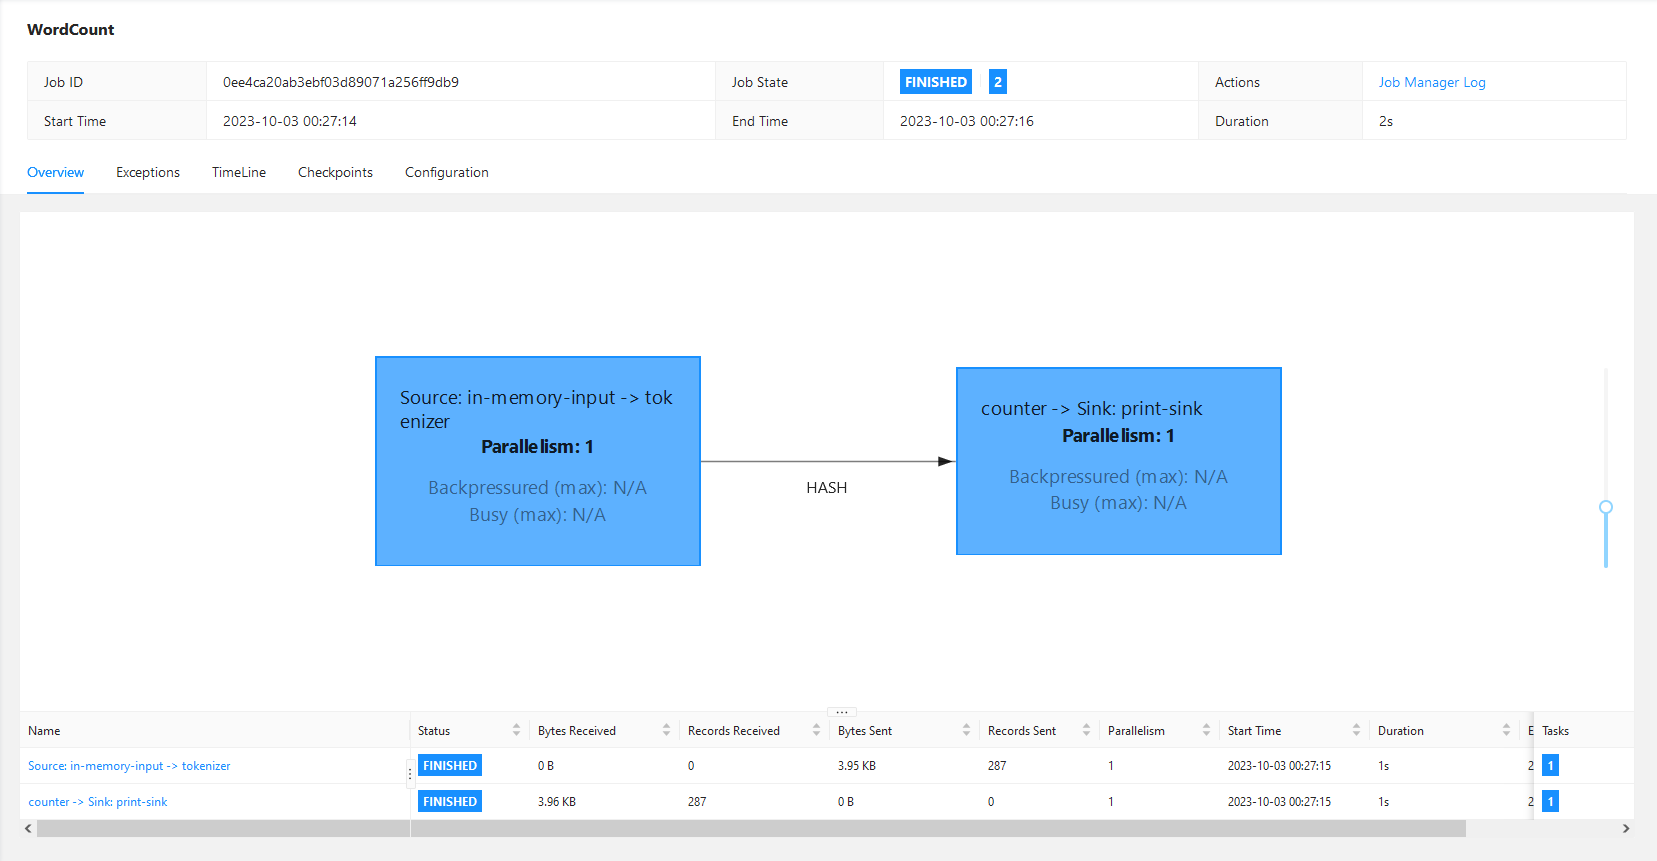
If you click on Completed Jobs, you get the detailed jobs overview.
Flink History Server web UI
The Flink History Server component provides a web interface, where you can view statistics about completed Flink jobs. The up-to-date URL of the Flink History Server UI can be found in ADCM (Clusters → <clusterName> → Services → Flink → Info).
Flink History Server web UI is shown below.