Сreate a note using Spark
This article shows how to create and run Spark notes in Zeppelin. By default, the Zeppelin service uses the Spark3 service core as a backend for executing Spark notes. If Spark3 and Zeppelin are installed in ADH, Zeppelin runs Spark jobs on a YARN-managed ADH cluster without any configuration.
Spark interpreters
Zeppelin comes with a built-in spark interpreter group that includes a set of interpreters for working with specific languages like Scala, Python, and R.
These interpreters are listed in the table below.
| Interpreter | Class | Description |
|---|---|---|
%spark |
SparkInterpreter |
Provides a Scala environment for running Spark programs |
%spark.sql |
SparkSQLInterpreter |
Allows running ANSI SQL queries on Spark DataFrame/DataSet objects |
%spark.pyspark |
PySparkInterpreter |
Provides a Python environment |
%spark.ipyspark |
IPySparkInterpreter |
Provides an IPython environment |
%spark.r |
SparkRInterpreter |
Provides a vanilla R environment with SparkR support |
%spark.ir |
SparkIRInterpreter |
Provides an R environment with SparkR support based on Jupyter IRKernel |
%spark.shiny |
SparkShinyInterpreter |
Used to create R shiny apps with SparkR support |
Shared context objects
This article assumes that the spark interpreter is used in the default shared binding mode, i.e. the interpreter is instantiated globally in the shared mode.
This means that Zeppelin creates a single JVM process with a single interpreter group to serve all Spark notes.
As a result, variables declared in one note can be directly accessed in other notes, assuming the notes are of the same interpreter type (for example, both notes are %spark.pyspark).
For Scala, Python, and R environments, Zeppelin automatically creates SparkContext, SQLContext, SparkSession and ZeppelinContext objects and exposes them as sc, sqlContext, spark, and z variables respectively.
Being shared variables, the same instance of these objects can be accessed by different Spark notes.
Test data
In this article, a dummy dataset people.csv is used for testing Spark examples. Before running the examples, the dataset should be loaded to HDFS. For this, use the following commands:
$ hdfs dfs -mkdir /user/zeppelin/test_data
$ hdfs dfs -chown zeppelin:hadoop /user/zeppelin/test_data
$ hdfs dfs -put people.csv /user/zeppelin/test_data/people.csv
Create and run a Spark note
-
In the Zeppelin web UI, click the Create new note list item or click the main menu item Notebook → Create new note.
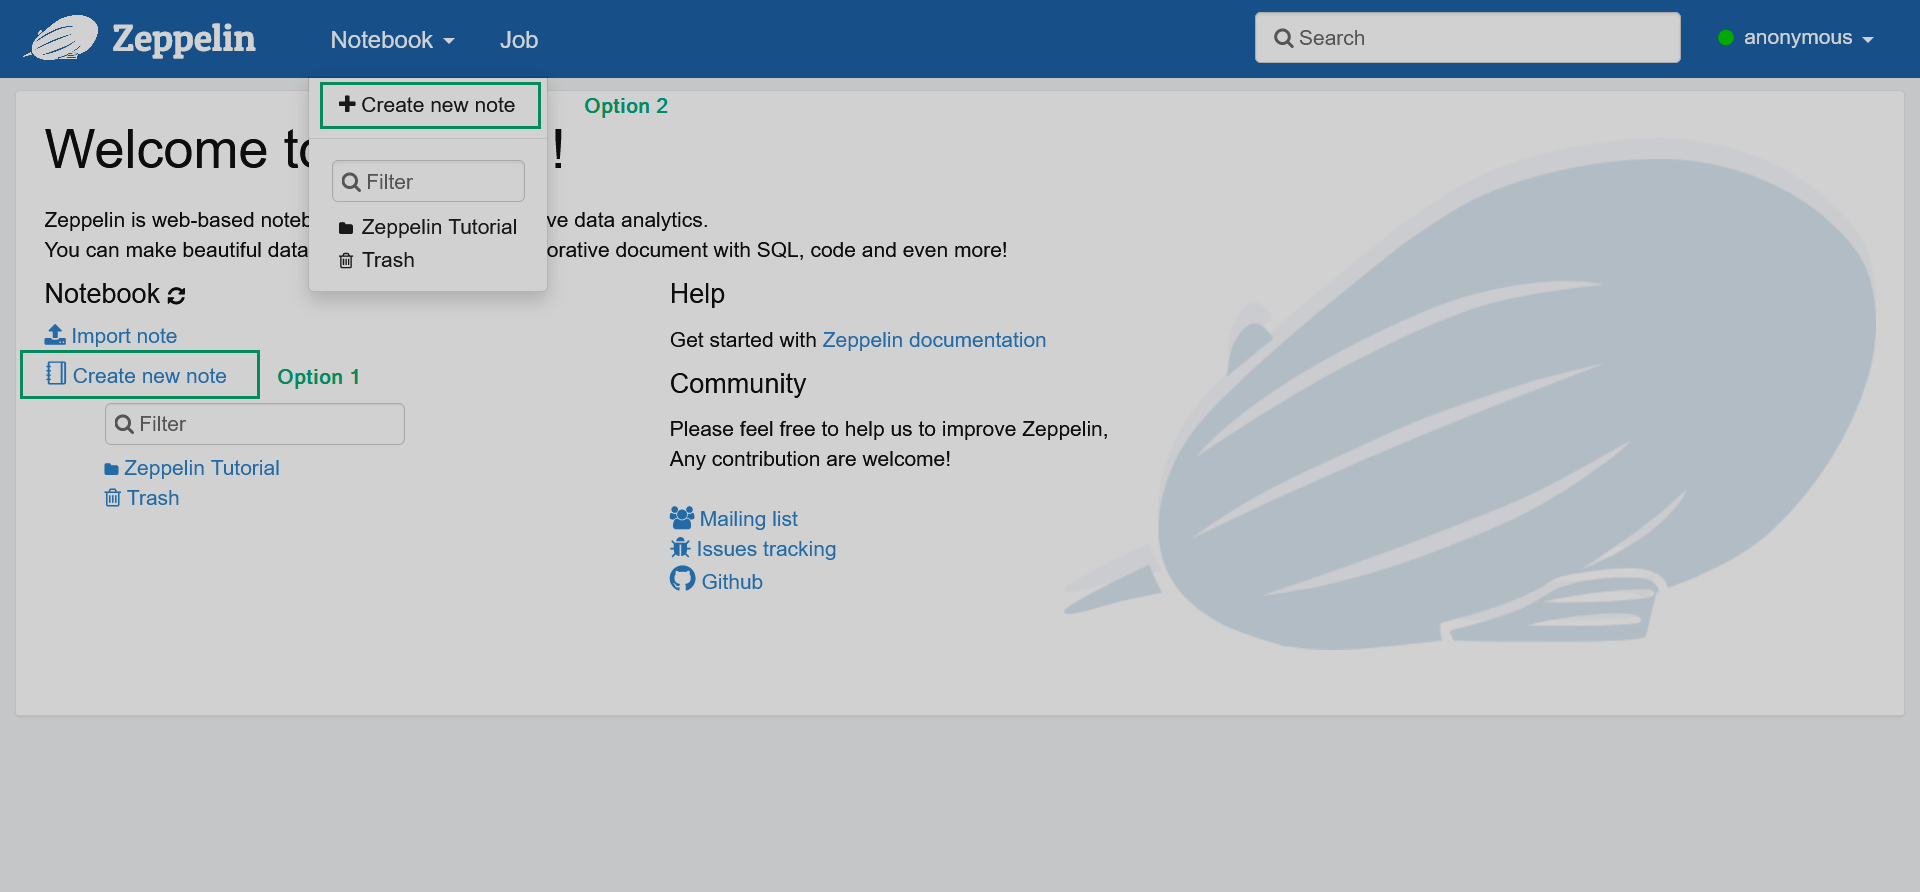 Adding a new note
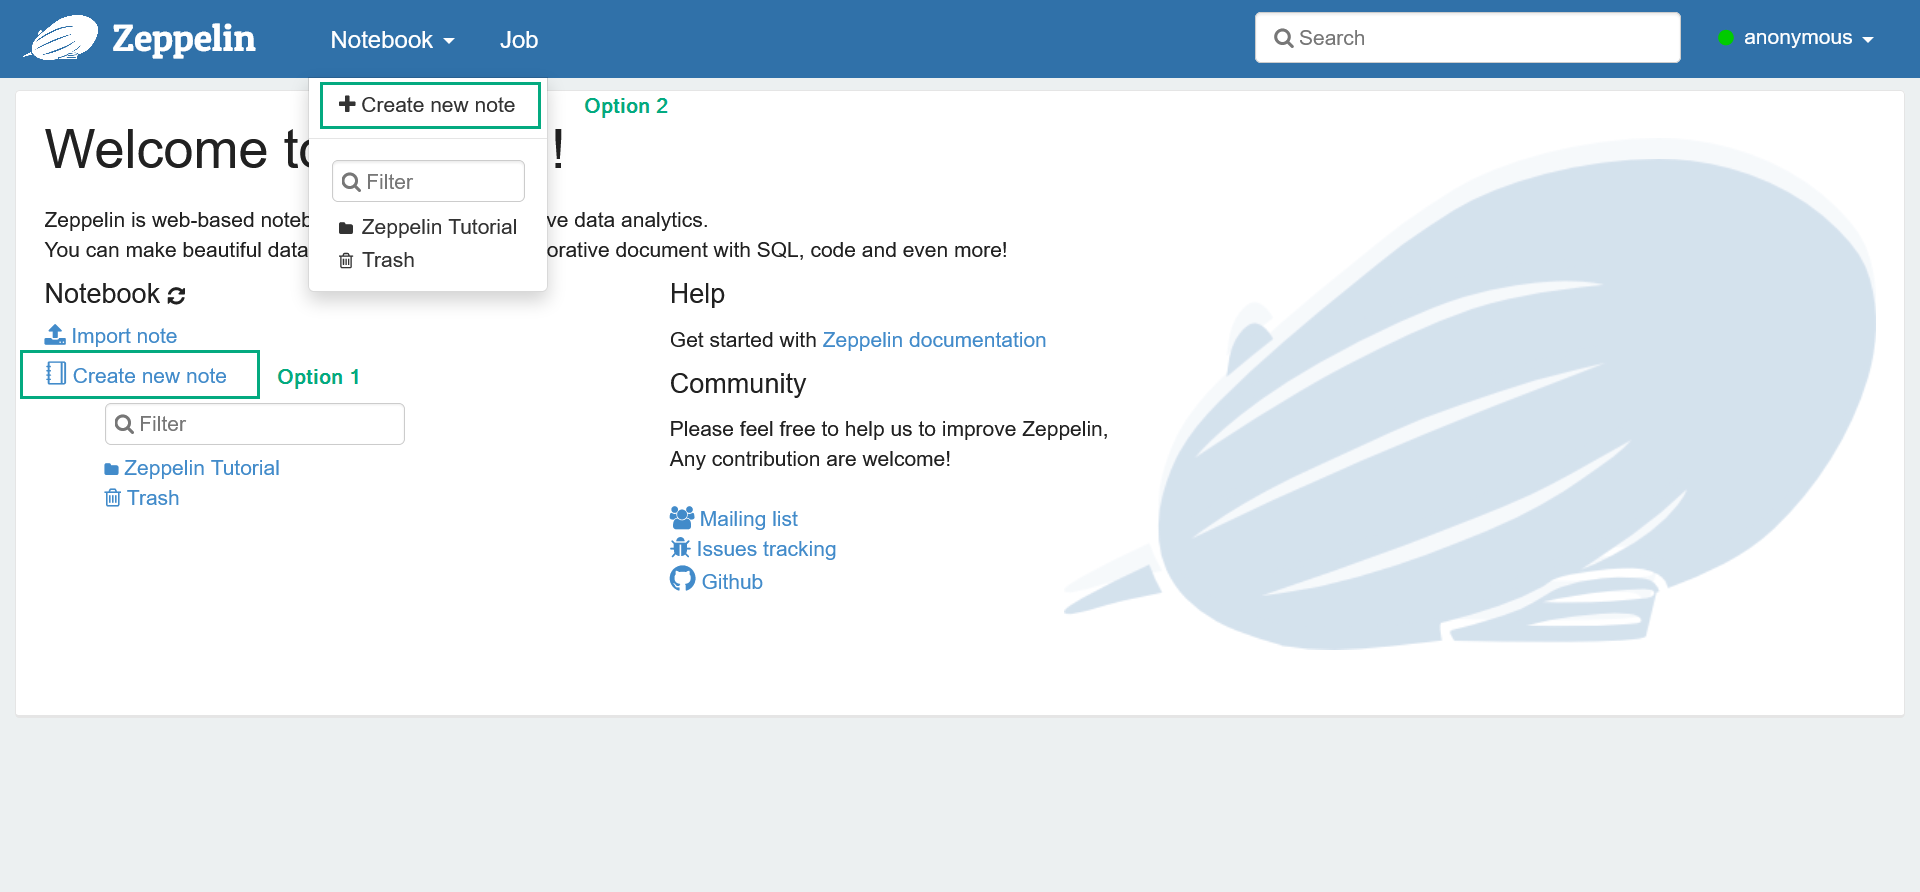 Adding a new note
 -
In the opened dialog, enter the note name and select the default interpreter that will be used in cases when the interpreter type is not specified explicitly. Notice that you can create different folders for your notes. Then, click Create.
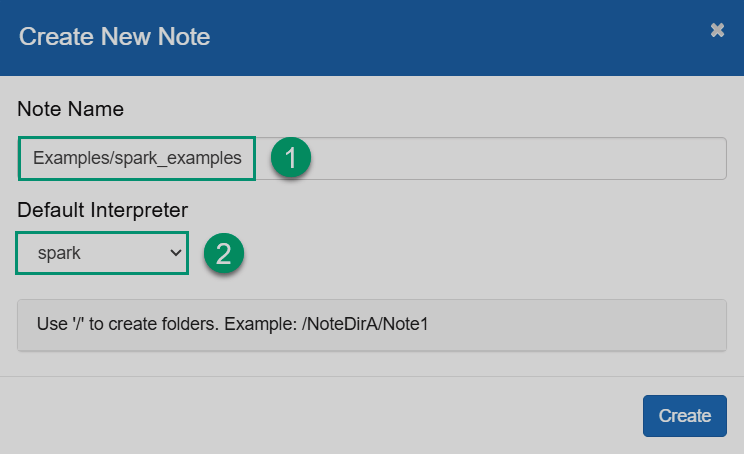 Create a new note
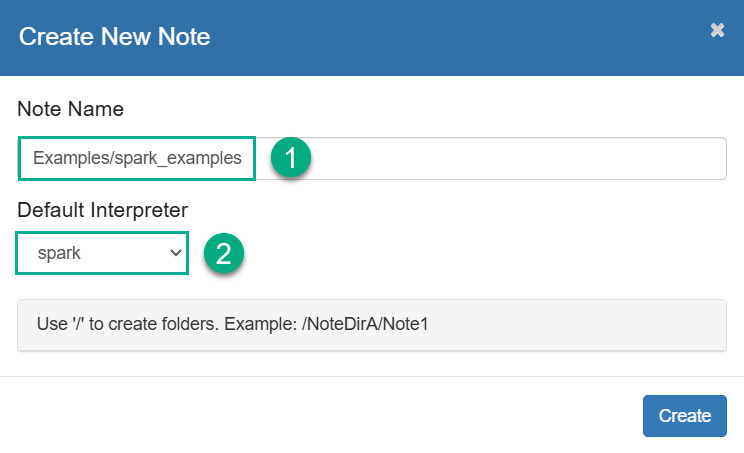 Create a new note
 -
Enter the Spark code in the paragraphs of your note and run the paragraph.
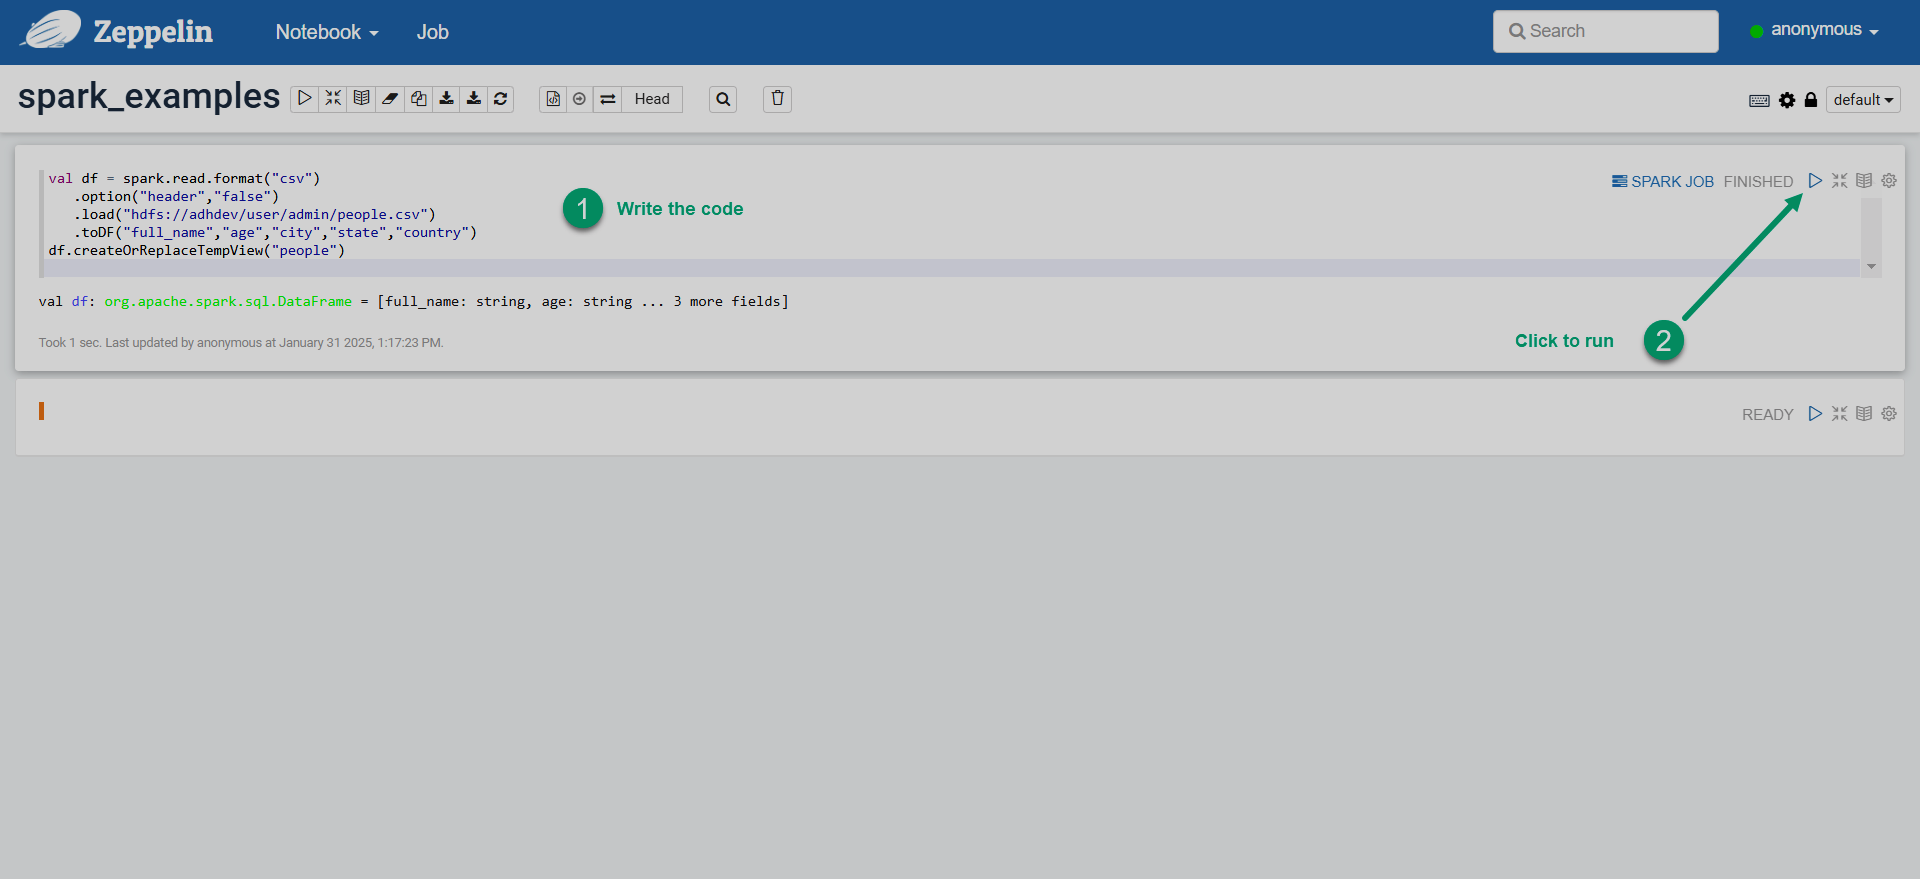 Run Spark code in Zeppelin
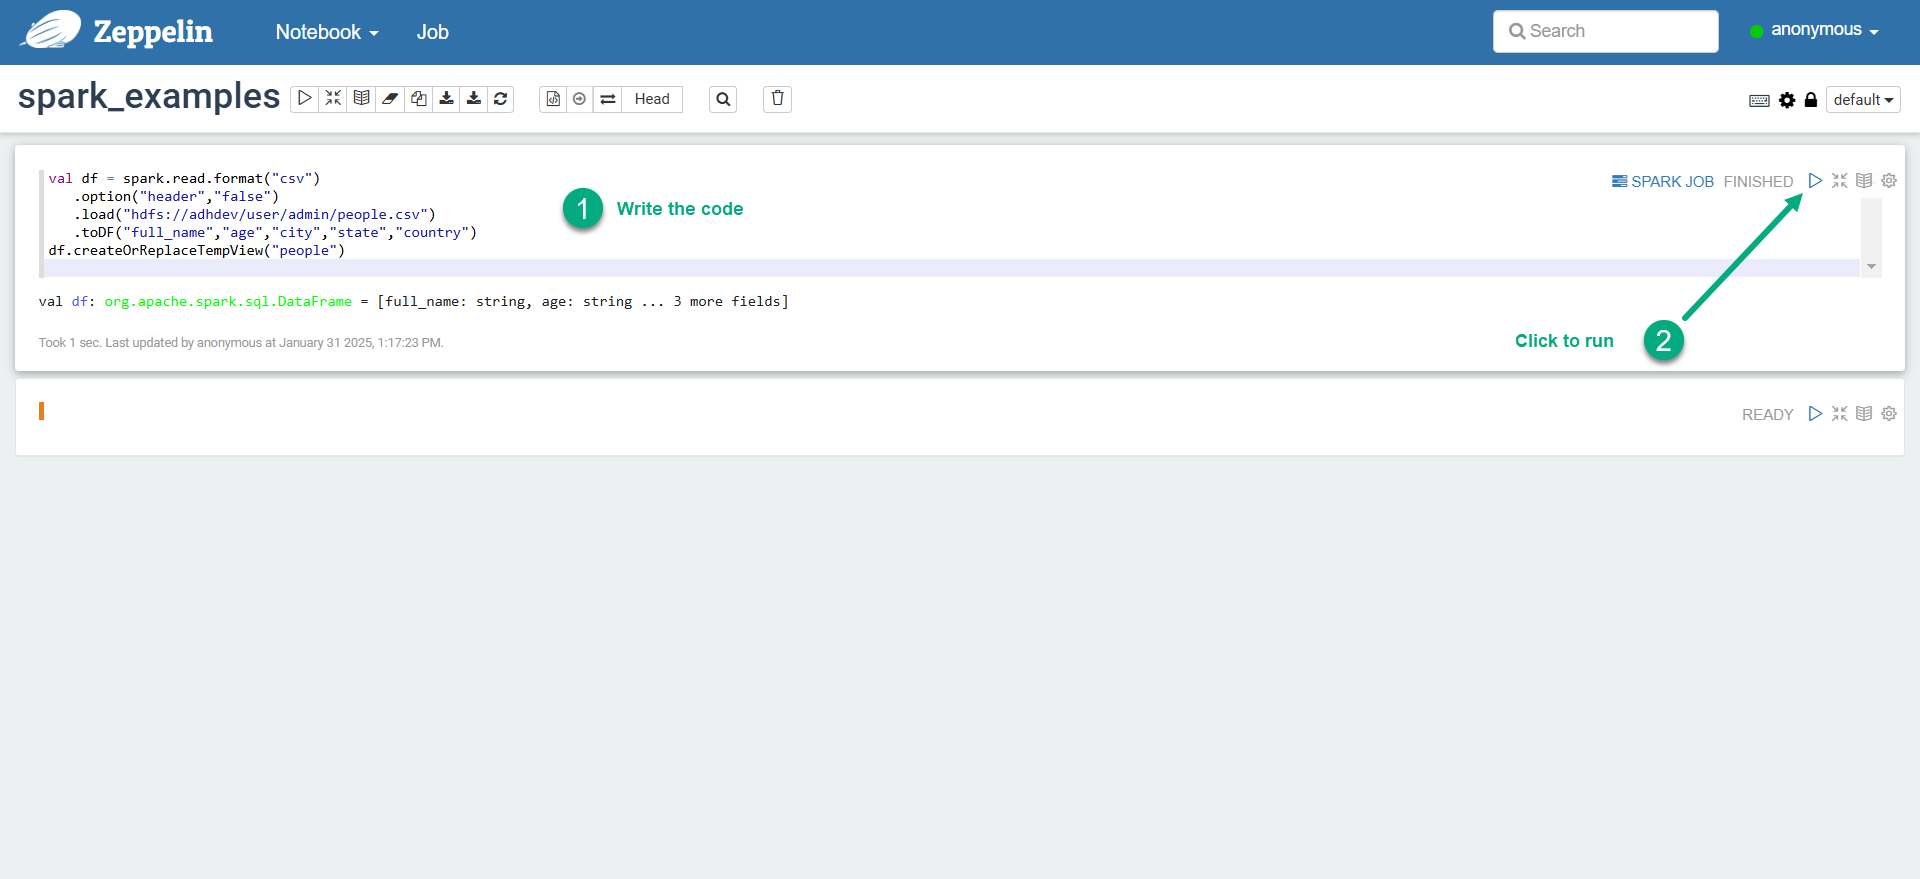 Run Spark code in Zeppelin
The examples of Spark code in Scala, PySpark, and SparkSQL are provided below. For more Spark examples, explore the Spark tutorial notes available in Zeppelin (Notebook → Spark Tutorial).
Scala
To run a Spark note in Scala, specify the %spark interpreter on the first line of the paragraph.
Although technically the %spark definition can be omitted (since it is the default interpreter in a group), it is still recommended to declare interpreters explicitly for each paragraph of a note.
%spark (1)
val df_people = spark.read.format("csv") (2)
   .option("header","false")
   .load("hdfs://adhdev/user/zeppelin/test_data/people.csv")
   .toDF("full_name","age","city","state","country")
df_people.printSchema()

case class SW_movie(id:Int, name:String, episode:Int, year:Int)

val df_sw_movies = spark.createDataFrame(Seq (3)
    (
        SW_movie(1, "Revenge of the Sith", 3, 2005),
        SW_movie(2, "Attack of the Clones", 2, 2002),
        SW_movie(3, "The Phantom Menace", 1, 1999),
        SW_movie(4, "A New Hope", 4, 1977),
        SW_movie(5, "Return of the Jedi", 6, 1983),
        SW_movie(6, "The Empire Strikes Back", 5, 1980)
    )
)
df_sw_movies.printSchema()
val df_sw_movies_comments = df_sw_movies.withColumn("rank", lit(0.0)) (4)
df_sw_movies_comments.printSchema()
df_sw_movies_comments.drop("rank") (5)

val sorted_by_year = rdd.map(mv => (6)
    (mv._1,mv._2,mv._3)
  ).sortBy(_._3).toDF("name", "episode", "year")
sorted_by_year.show()

sorted_by_year.write (7)
  .mode("overwrite")
.json("/user/zeppelin/test_data/star_wars_movies")| 1 | Specifies an explicit interpreter for running Spark code in Scala. |
| 2 | Creates a DataFrame by reading the test dataset file in HDFS. |
| 3 | Creates a DataFrame from a tuple of Сase class objects. |
| 4 | Adds a static column to the DataFrame. |
| 5 | Creates a DataFrame with data sorted by a custom column. |
| 6 | Drops a DataFrame column. |
| 7 | Writes the DataFrame to HDFS as JSON. |
PySpark
To run PySpark notes, declare the %spark.pyspark interpreter on the first line of the paragraph.
%spark.pyspark (1)
df = spark.createDataFrame([ (2)
    (1, "Ivan", 20, "Russia"),
    (2, "Yao", 23, "China"),
    (3, "Ann", 28, "Russia"),
    (4, "John", 20, "USA")
]).toDF("id", "name", "age", "country")
df.printSchema()
df.show()

from pyspark.sql.types import StructType
peopleSchema = StructType() \
    .add("full_name", "string") \
    .add("age", "integer") \
    .add("city", "string") \
    .add("state", "string") \
    .add("country", "string")
df_people = spark.read.csv("hdfs://adhdev/user/zeppelin/test_data/people.csv", schema=peopleSchema) (3)
df_people.printSchema();

df_name_city = df_people.select("full_name", "city") (4)
df_name_city.show(10)

import pyspark.sql.functions as f
df_name_uppered = df_people.withColumn("full_name_upper", f.upper(df_people["full_name"])) (5)
df_name_uppered.printSchema()

df_people_stateless = df_people.drop("state"); (6)
df_people_stateless.printSchema();

df = df_people.filter( (7)
    (df_people["age"] >= 20) & (df_people["city"] == "Houston")
)
df.show()

from pyspark.sql.functions import udf
from pyspark.sql.types import BooleanType
@udf(returnType=BooleanType()) (8)
def udf_older_than(e):
    if e > 60:
        return True;
    else:
        return False
df_people_older_than60 = df_people.filter(udf_older_than(df_people["age"]))
df_people_older_than60.show()| 1 | Specifies an explicit interpreter for running PySpark code. |
| 2 | Creates a DataFrame from a list of Python tuples. |
| 3 | Creates a DataFrame from the sample dataset in HDFS. |
| 4 | Creates a DataFrame by selecting a subset of columns. |
| 5 | Adds a new column to the DataFrame with string values upper-cased using pyspark.sql.functions. |
| 6 | Drops a column from the DataFrame. |
| 7 | Applies a combination of filter conditions. |
| 8 | Defines a UDF, which is later used for filtering. |
SparkSQL
In Scala/PySpark environments, you can run SQL queries against a DataFrame by using spark.sql().
For example:
%spark.pyspark (1)

from pyspark.sql.types import StructType

peopleSchema = StructType() \
    .add("full_name", "string") \
    .add("age", "integer") \
    .add("city", "string") \
    .add("state", "string") \
    .add("country", "string")
df_people = spark.read.csv("hdfs://adhdev/user/zeppelin/test_data/people.csv", schema=peopleSchema)
df_people.createOrReplaceTempView("people") (2)

df_people30 = spark.sql("select full_name, age from people where age=30") (3)
df_people30.show()| 1 | Defines the interpreter for handling PySpark code. |
| 2 | Registers a temporary view based on a DataFrame. This is a mandatory step for using SparkSQL queries. |
| 3 | Runs SQL on the temporary view. The query results are stored in a new DataFrame. |
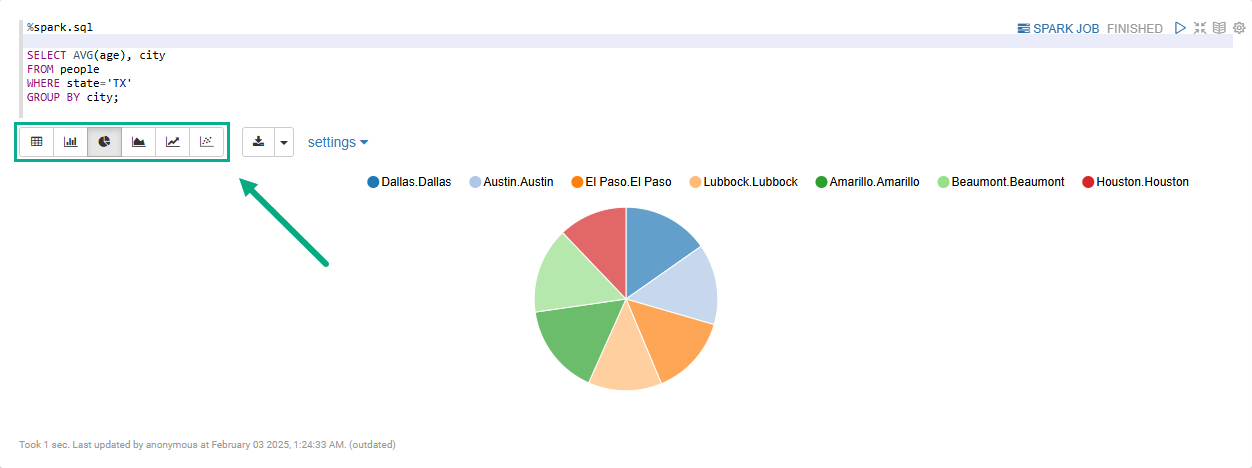
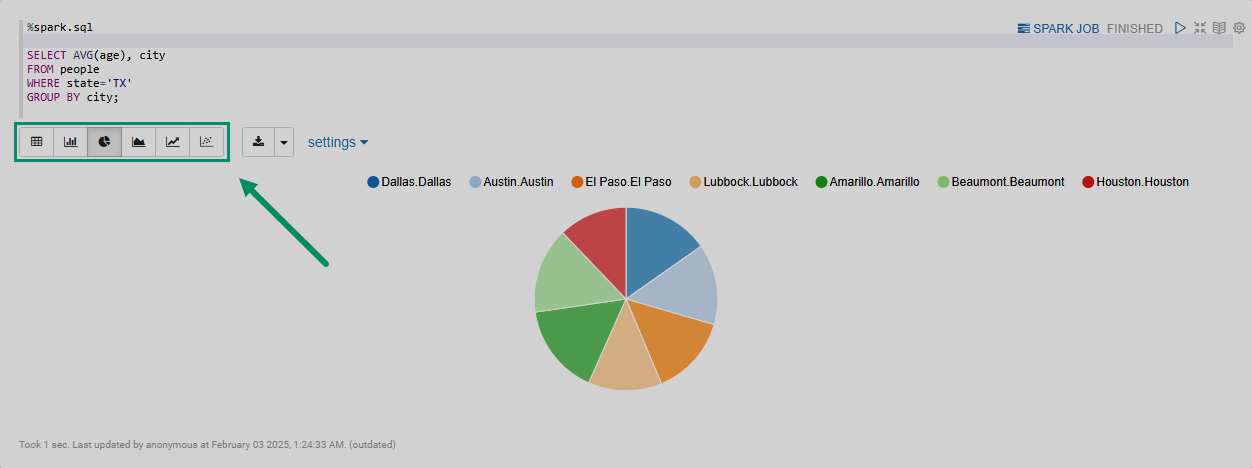
By specifying the %spark.sql interpreter on the first line of the paragraph, you can visualize the queries to a Spark DataFrame using built-in widgets (pie charts, graphs, tables, etc.).
For example:
%spark.sql

SELECT AVG(age), city
FROM people (1)
WHERE state='TX'
GROUP BY city;| 1 | Before running the query, the people object must be registered as a temporary view. |
When you run a %spark.sql paragraph, the result set is displayed in the form of a table.
You can switch between several widgets to visualize the results on a pie chart, line graph, etc., as shown in the image.