

HiveServer2 UI overview
HiveServer2 provides a web interface where you can monitor Hive configuration, logging, metrics, and active session information. The up-to-date link to the web UI can be found in ADCM (Clusters → <clusterName> → Services → Hive → Info). The HiveServer2 web UI has the following view.
By default, the HiveServer2 UI is available on the 10002 port number.
To change the port number:
-
In ADCM, go to Clusters → <clusterName> → Services → Hive → Primary configuration, and then enable Show advanced.
-
In the Custom hive-site.xml section, add the new property
hive.server2.webui.port=<port>. -
Save the configuration and restart your Hive service. The UI will be available on the specified port after the restart.
HiveServer2 UI includes the following pages:
Home
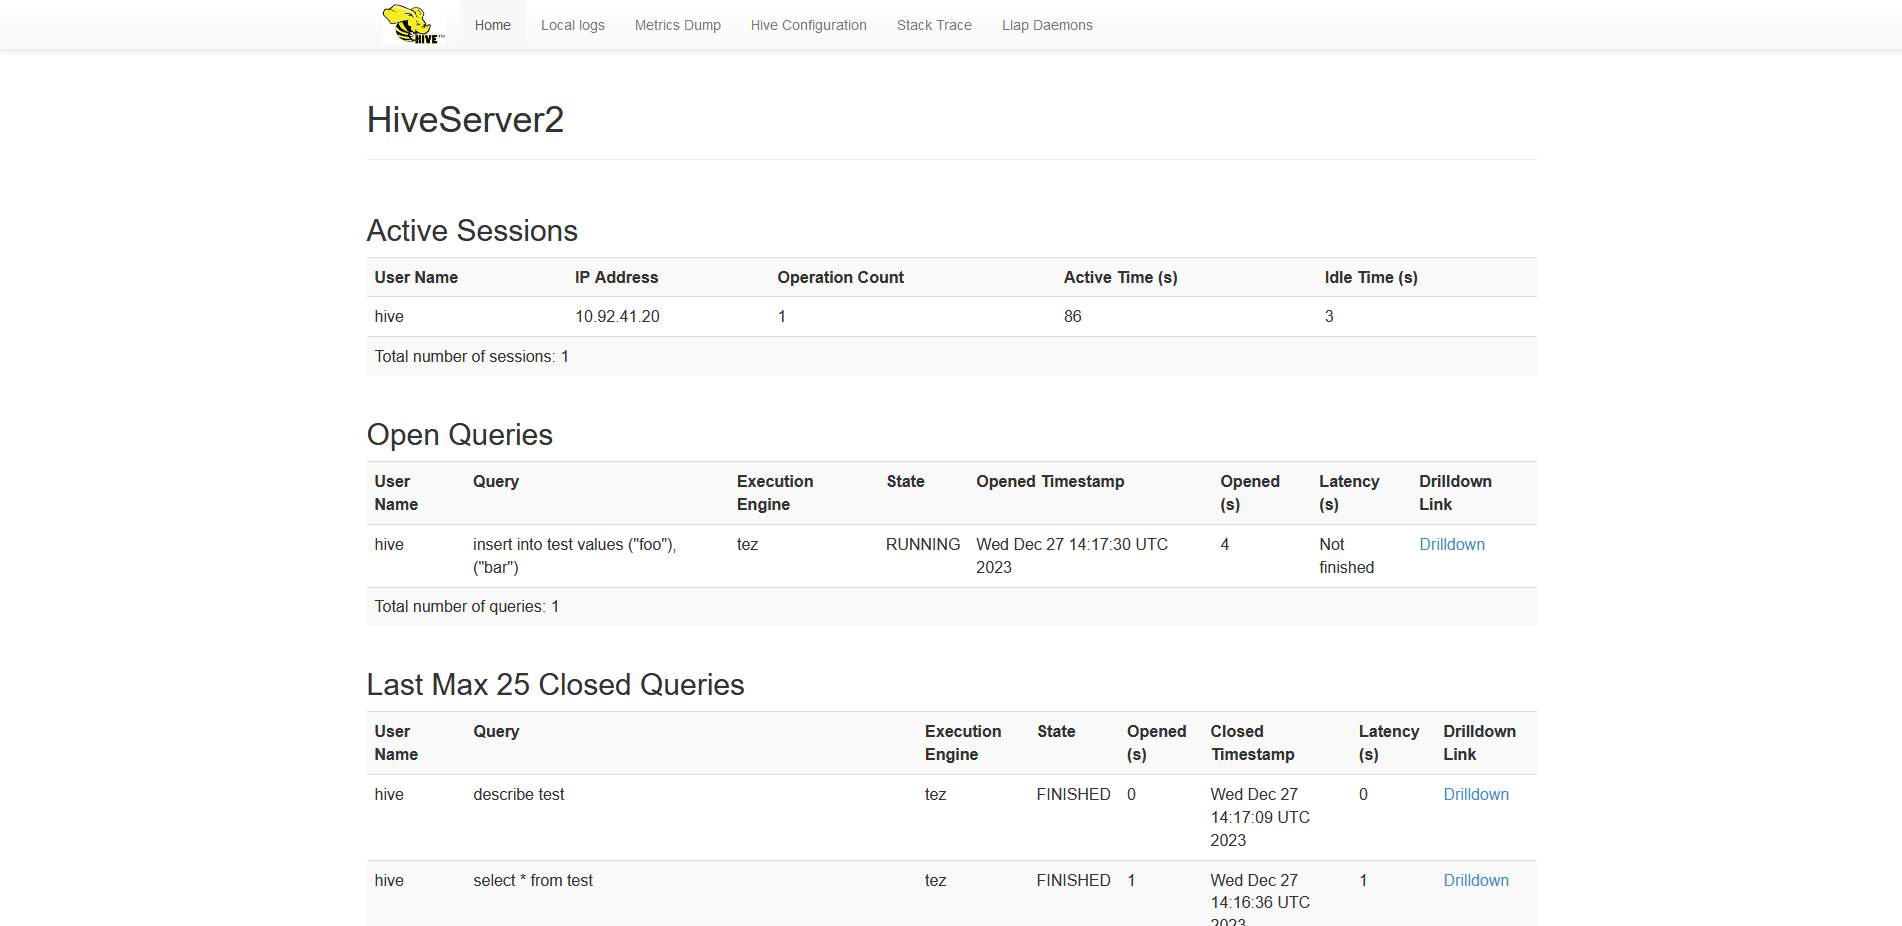
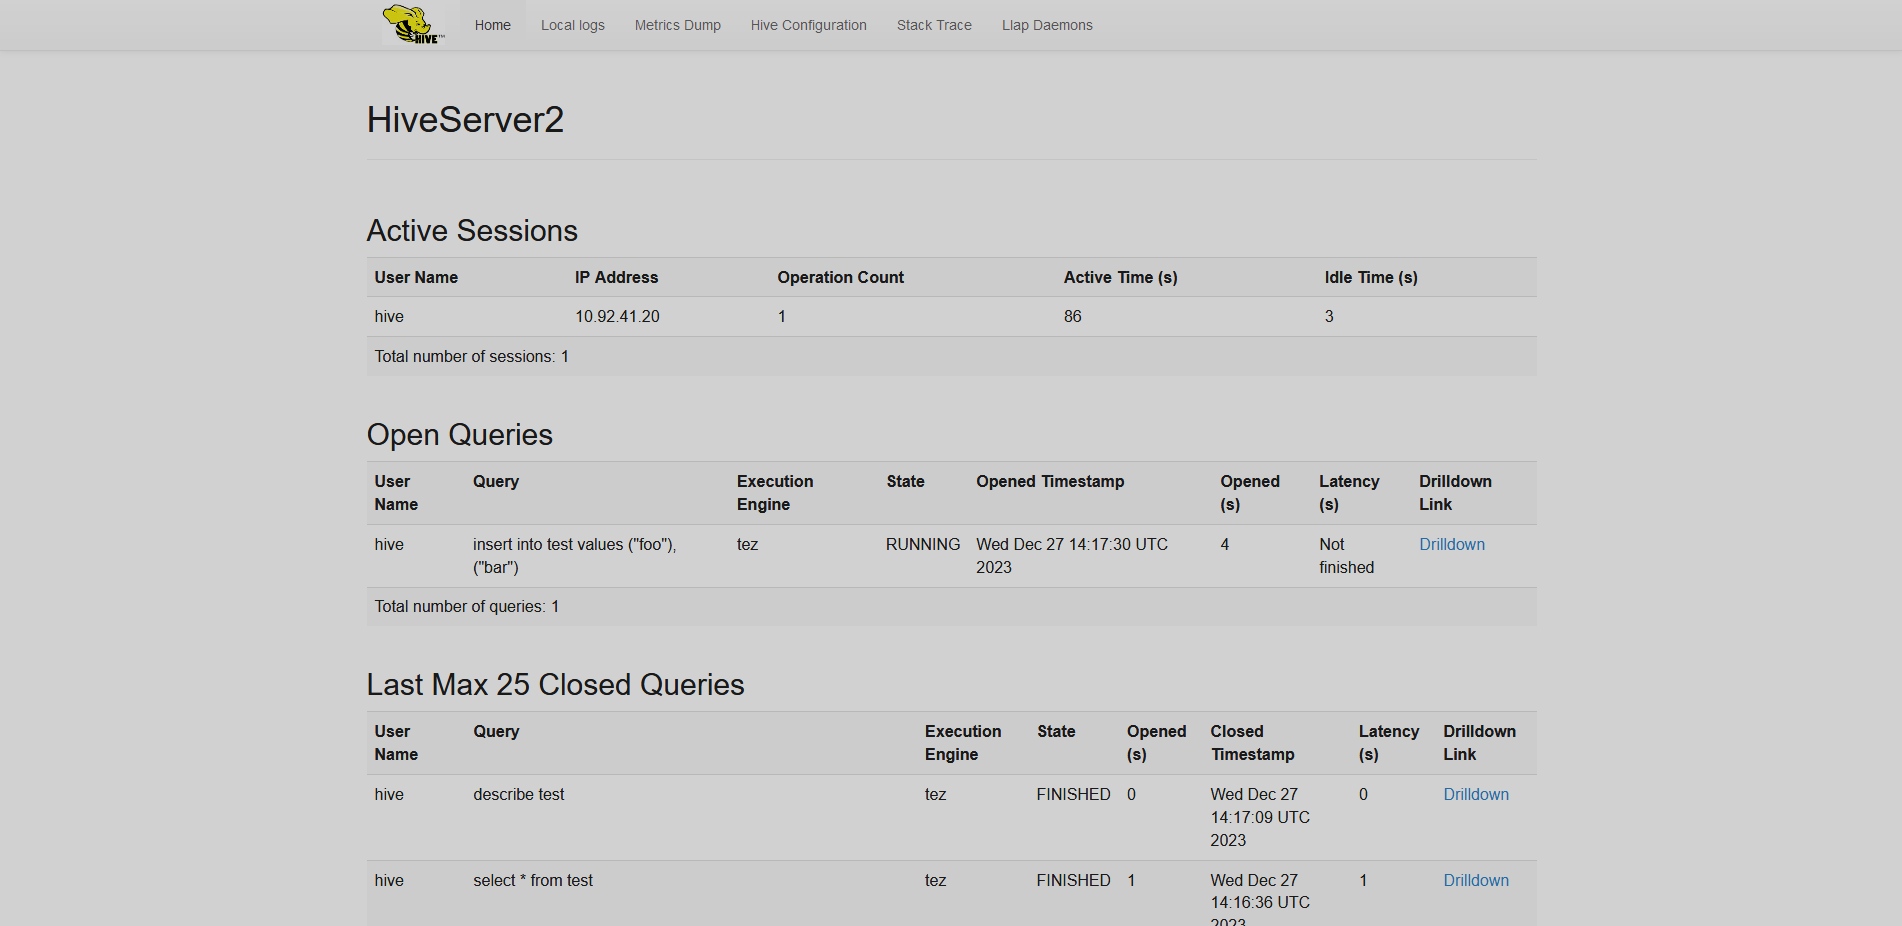
The HiveServer2 Home page has the following view.
This page has the following information:
-
active sessions;
-
queries currently processed by Hive;
-
recent queries submitted to HiveServer2;
-
Hive attributes, such as version, build number, uptime, etc.
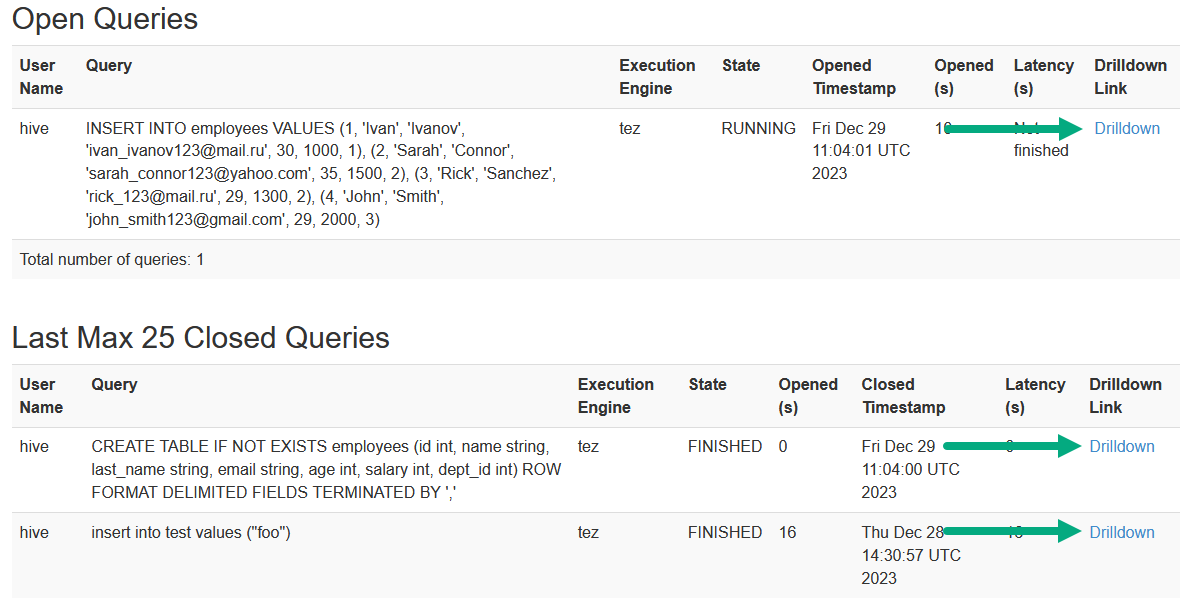
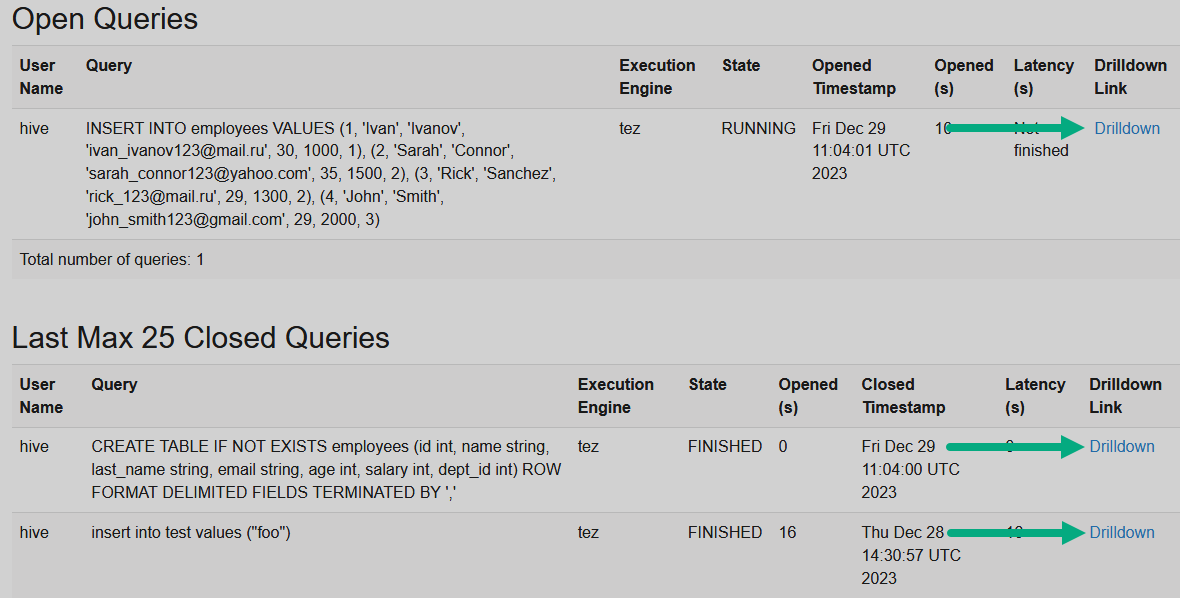
To view detailed information about running and completed Hive queries, use the Drilldown link for the corresponding query as shown below.
The Query Information page has the following view.
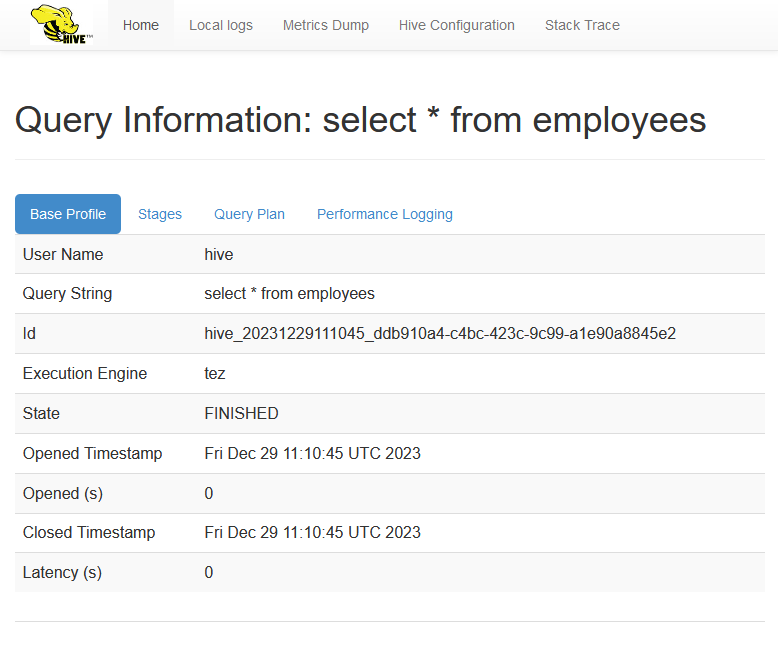
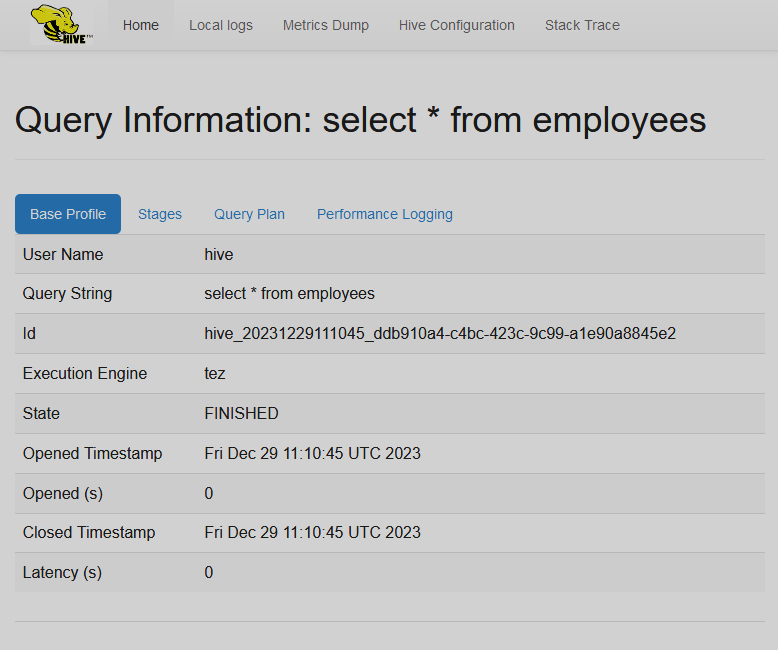
The detailed query information is presented on the tabs:
-
Base Profile. Displays generic information about a Hive query, like ID, state, execution time, etc.
-
Stages. Displays Map/Reduce stages of the query.
-
Query Plan. Displays the query execution plan (
EXPLAIN <query>output). -
Performance Logging. Lists performance metrics from several Hive loggers.
Hive Configuration
This page lists all the configuration settings from hive-site.xml plus effective Hadoop properties.
Llap Daemons
Displays existing LLAP daemons (if any).