

View a Hive job via TEZ
Each job that you run in Hive appears on the Tez UI. Complete the following steps on the Tez UI:
-
Open the Tez UI. You can find the link to the interface on the TEZ overview page.
-
Launch the Hive shell on the host with the Hive HiveServer2 component. More details on using the Hive shell are available on the Work with Hive tables page.
-
Create a table using the Hive shell:
CREATE TABLE customers ( customer_id int NOT NULL, customer_name char(50) NOT NULL, address char(50), city char(50), state char(25), zip_code char(10) ); -
Insert data into the created table:
INSERT INTO TABLE customers VALUES (1,'John Smith','Holliwood blvd','Los Angeles','CA','435267'), (2,'Alice Brown','42 st','New York','NY','876234'), (3,'Maria Jensen','Paris drv','Chicago','IL','293752'); -
Use Tez UI during the data insertion to monitor this process.
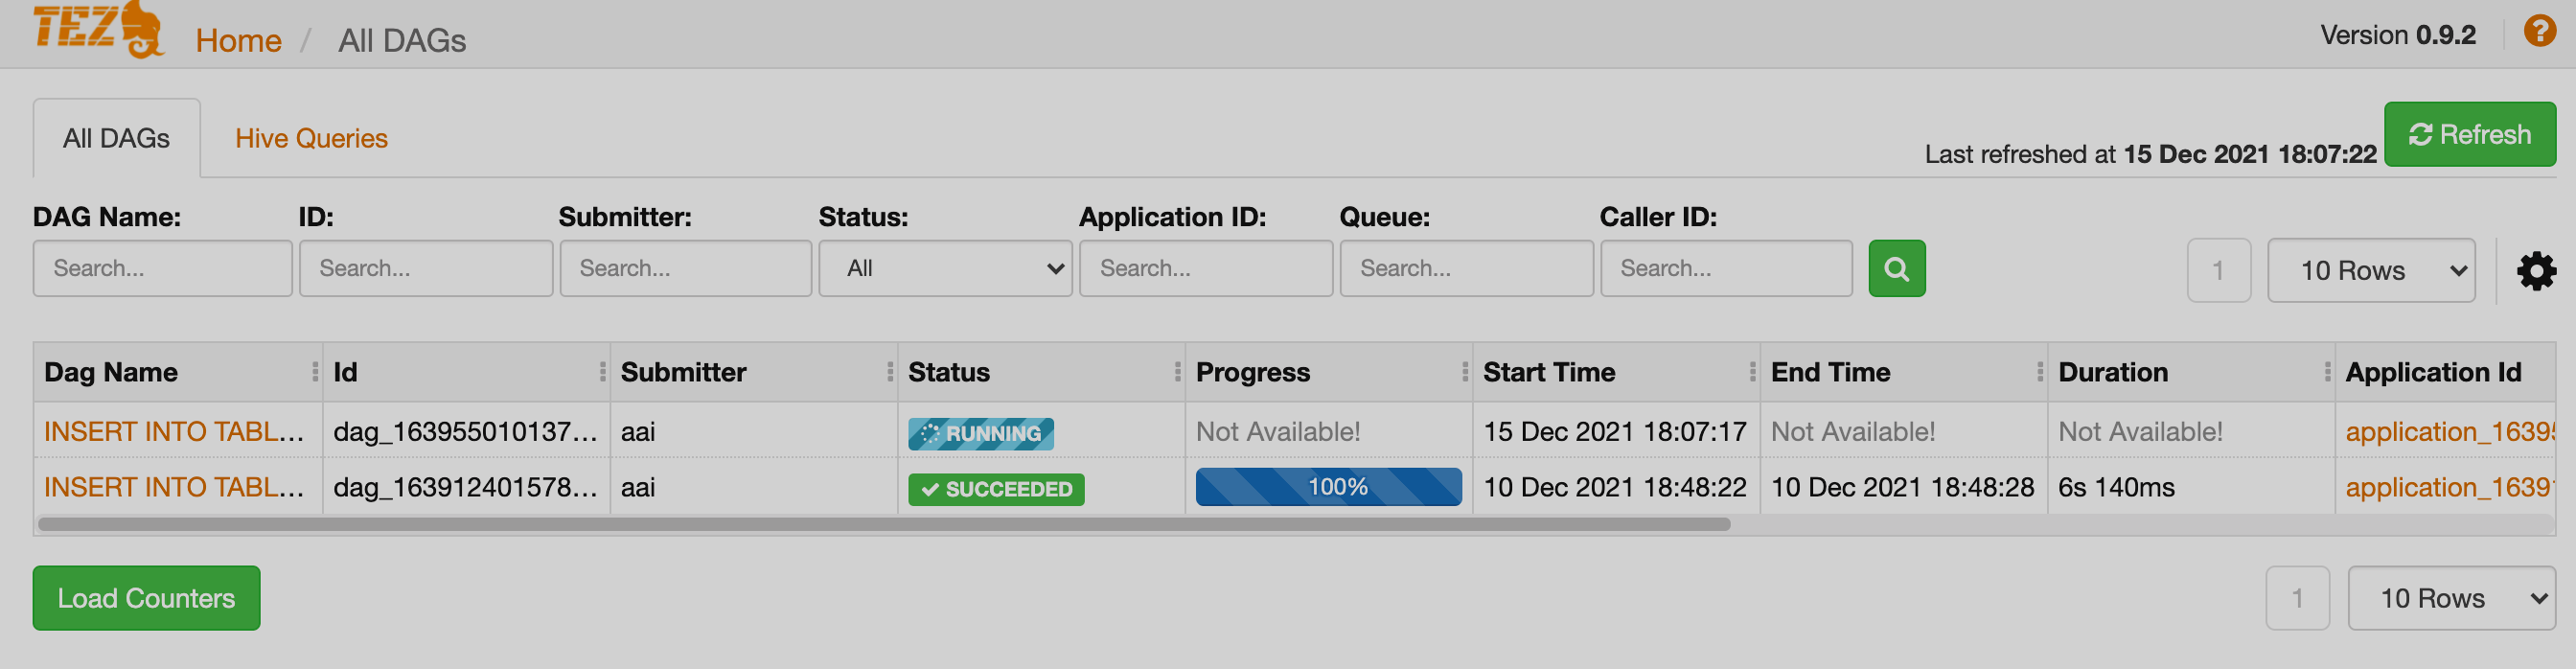 Adding data to Tez
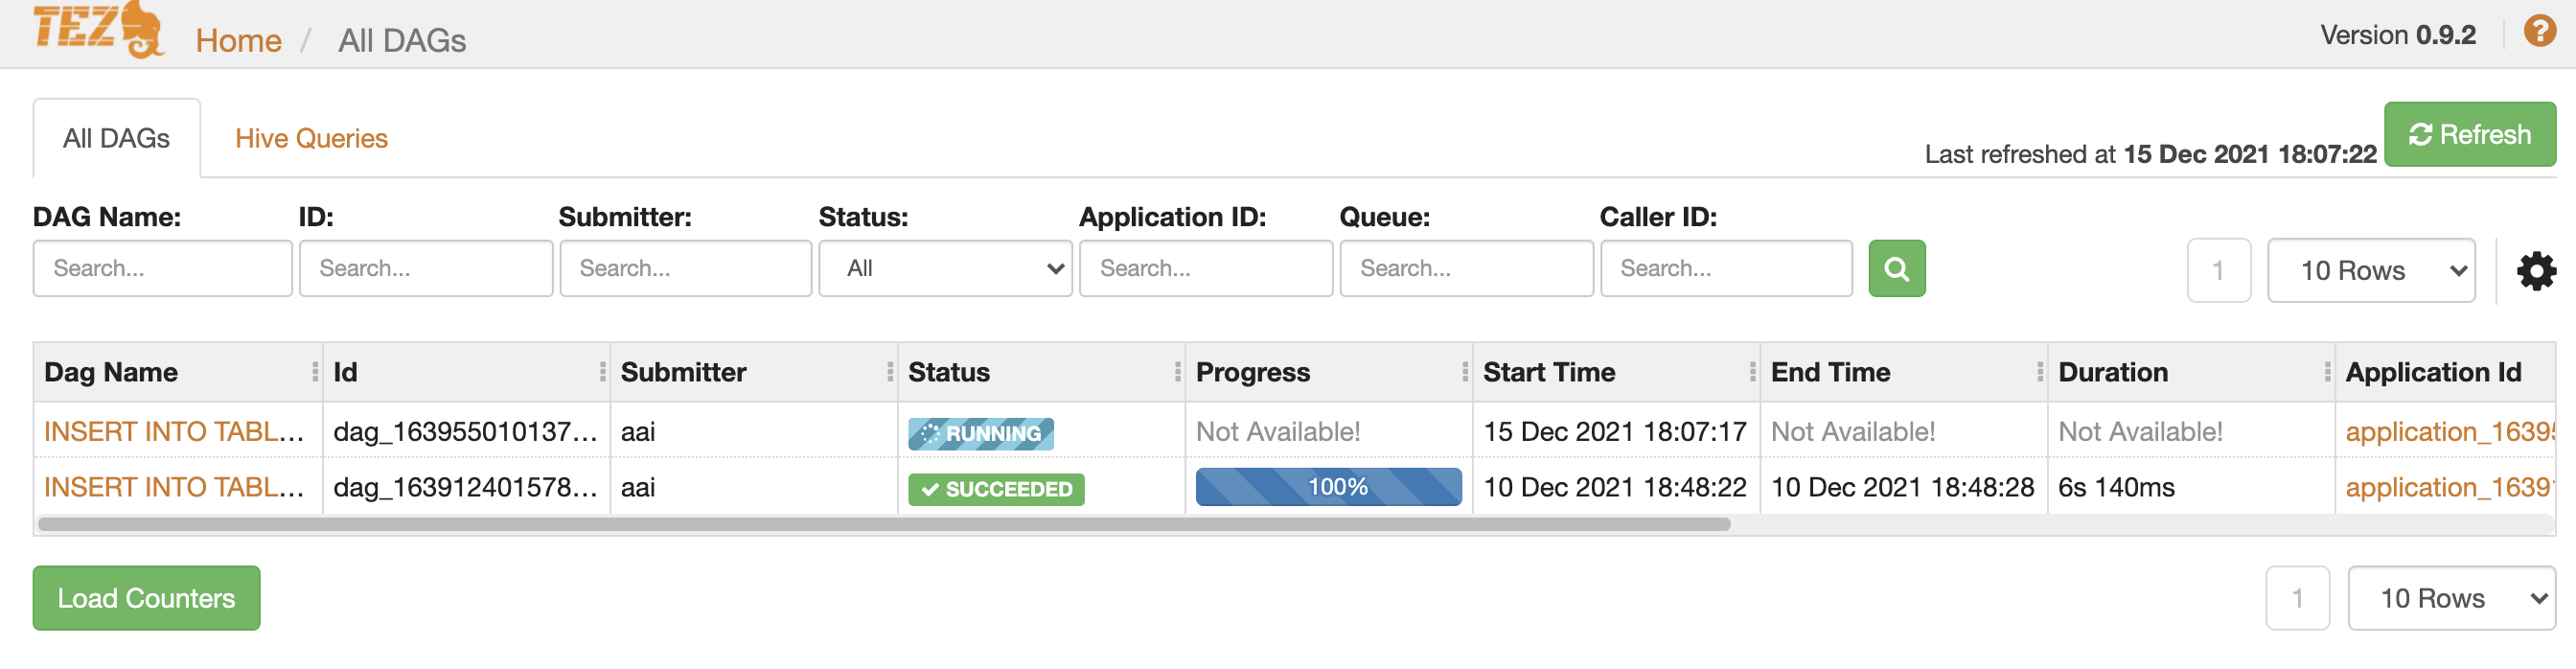 Adding data to Tez
You can further check the inserted data with the following query:
SELECT *
FROM customers
WHERE state = 'CA'
ORDER BY customer_id ASC;
The output looks like the one below.
Query ID = aai_20211215195428_e60e1dc5-f6f3-4c5e-896a-6e56407845c1
Total jobs = 1
Launching Job 1 out of 1
Status: Running (Executing on YARN cluster with App id application_1639550101374_0007)

----------------------------------------------------------------------------------------------
        VERTICES      MODE        STATUS  TOTAL  COMPLETED  RUNNING  PENDING  FAILED  KILLED
----------------------------------------------------------------------------------------------
Map 1 .......... container     SUCCEEDED      1          1        0        0       0       0
Reducer 2 ...... container     SUCCEEDED      1          1        0        0       0       0
----------------------------------------------------------------------------------------------
VERTICES: 02/02  [==========================>>] 100%  ELAPSED TIME: 5,38 s
----------------------------------------------------------------------------------------------
OK
1	John Smith                                        	Holliwood blvd                                    	Los Angeles                                       	CA                       	435267
4	Peter Stormik                                     	International blv                                 	San Francisco                                     	CA                       	231987
5	Daniel Morrowetz                                  	Bond rd                                           	Elk Grove                                         	CA                       	390817
Time taken: 6.447 seconds, Fetched: 3 row(s)
The
SELECTjob appears in the Tez UI similarly toINSERT. -
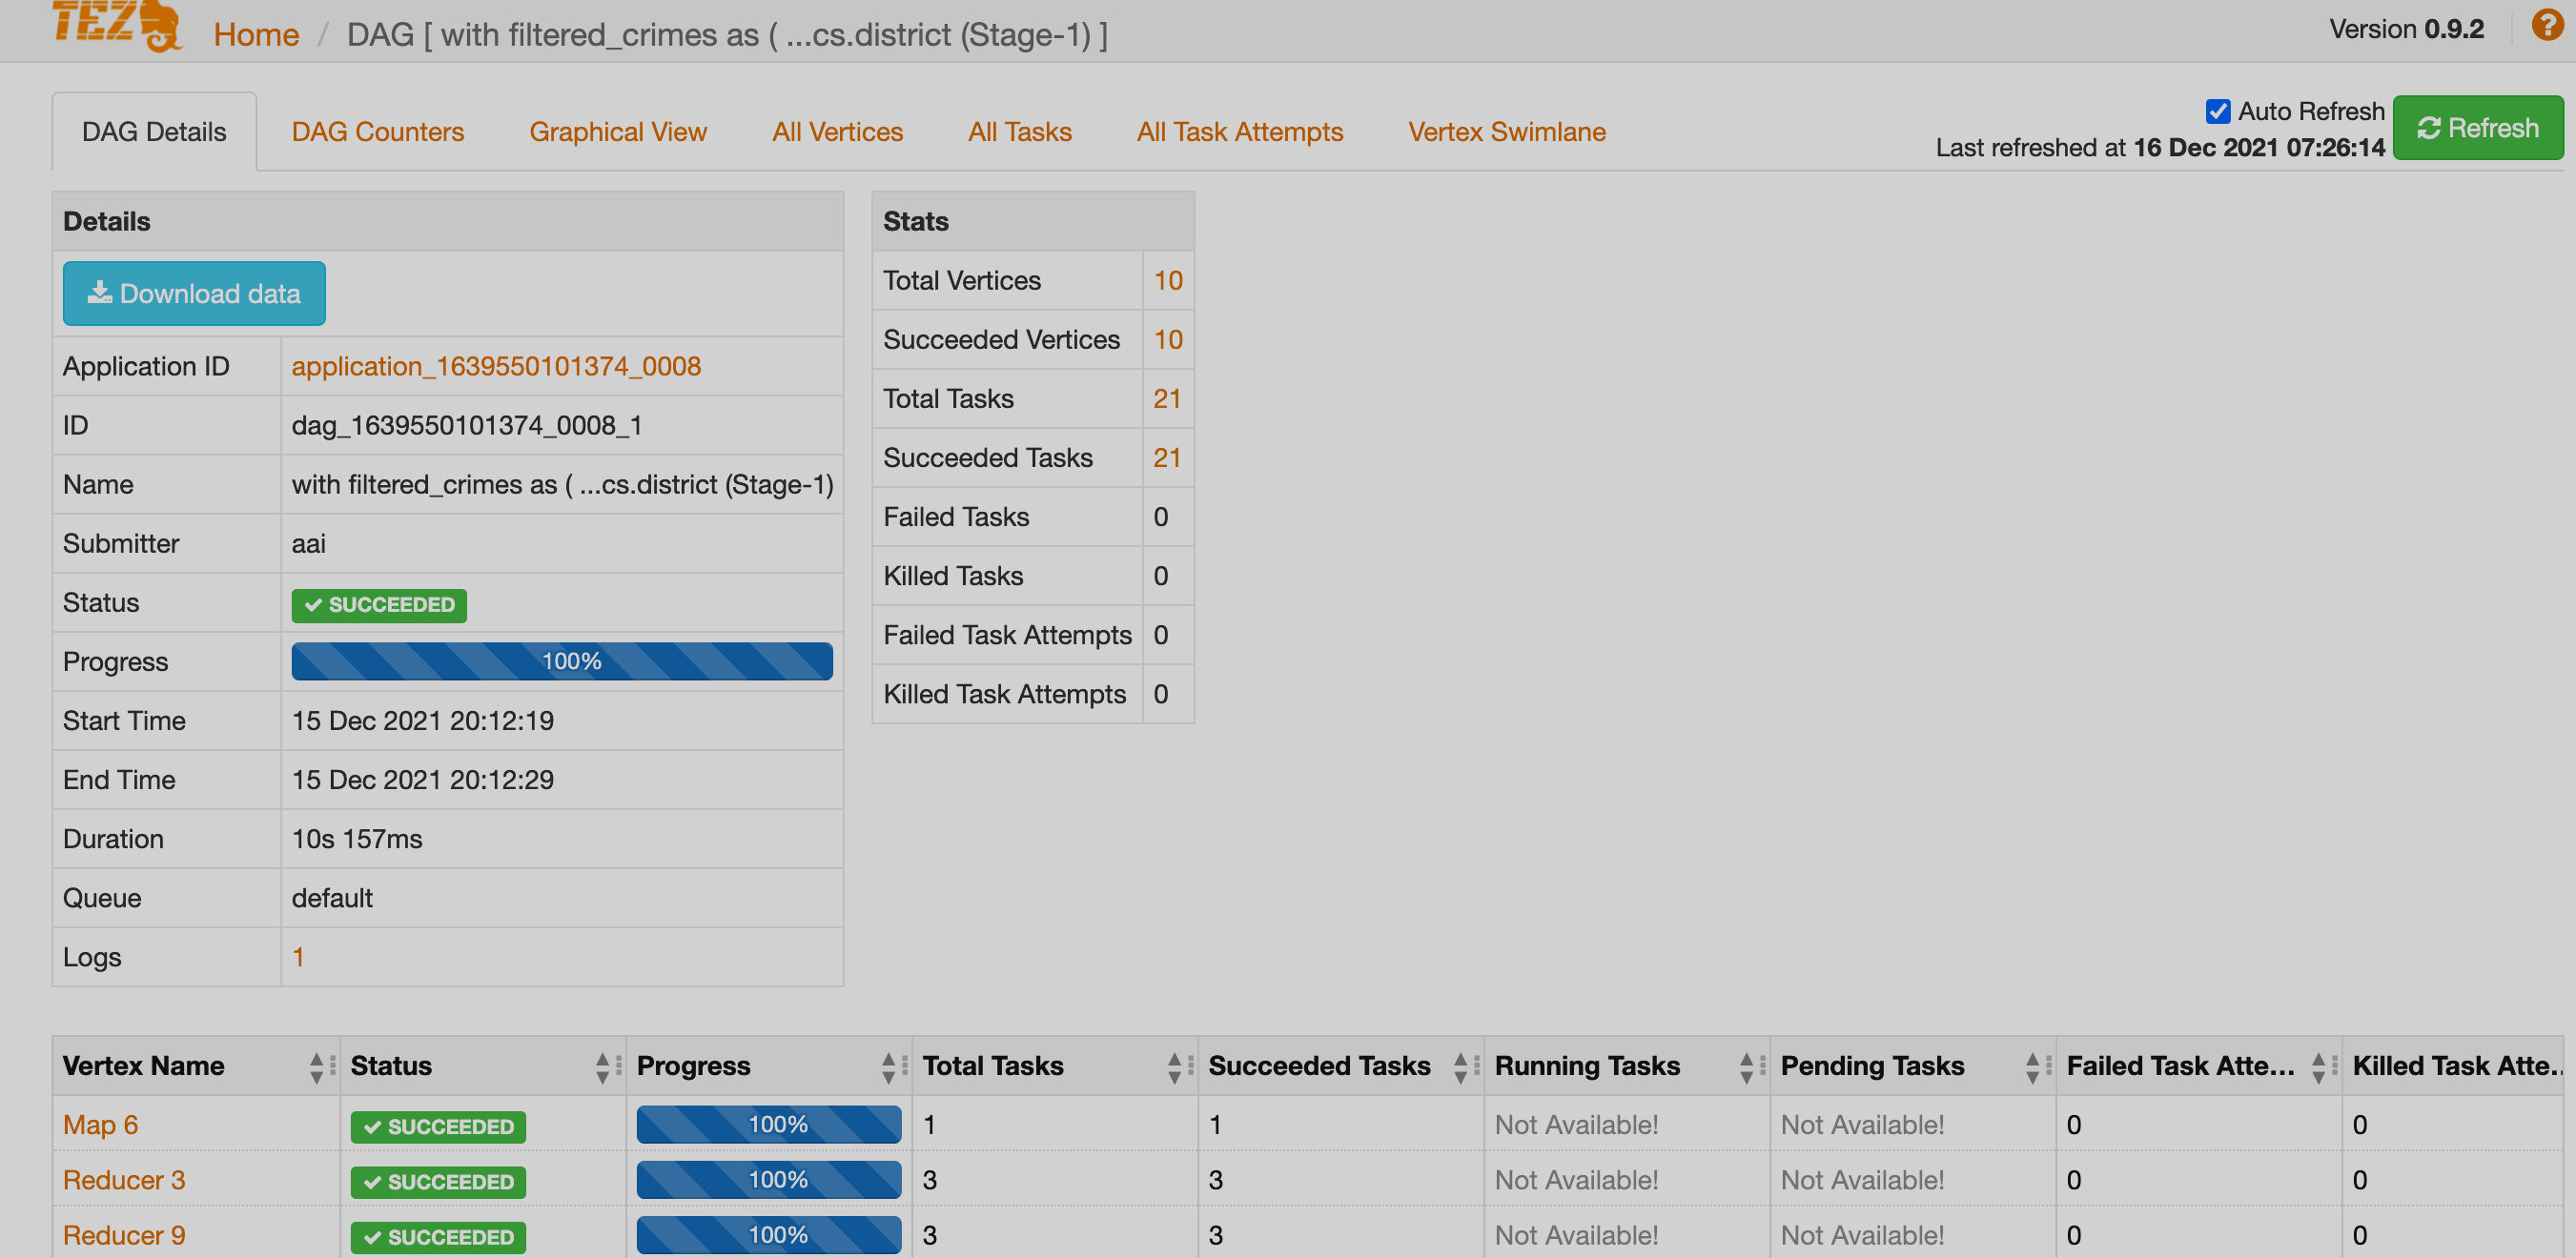
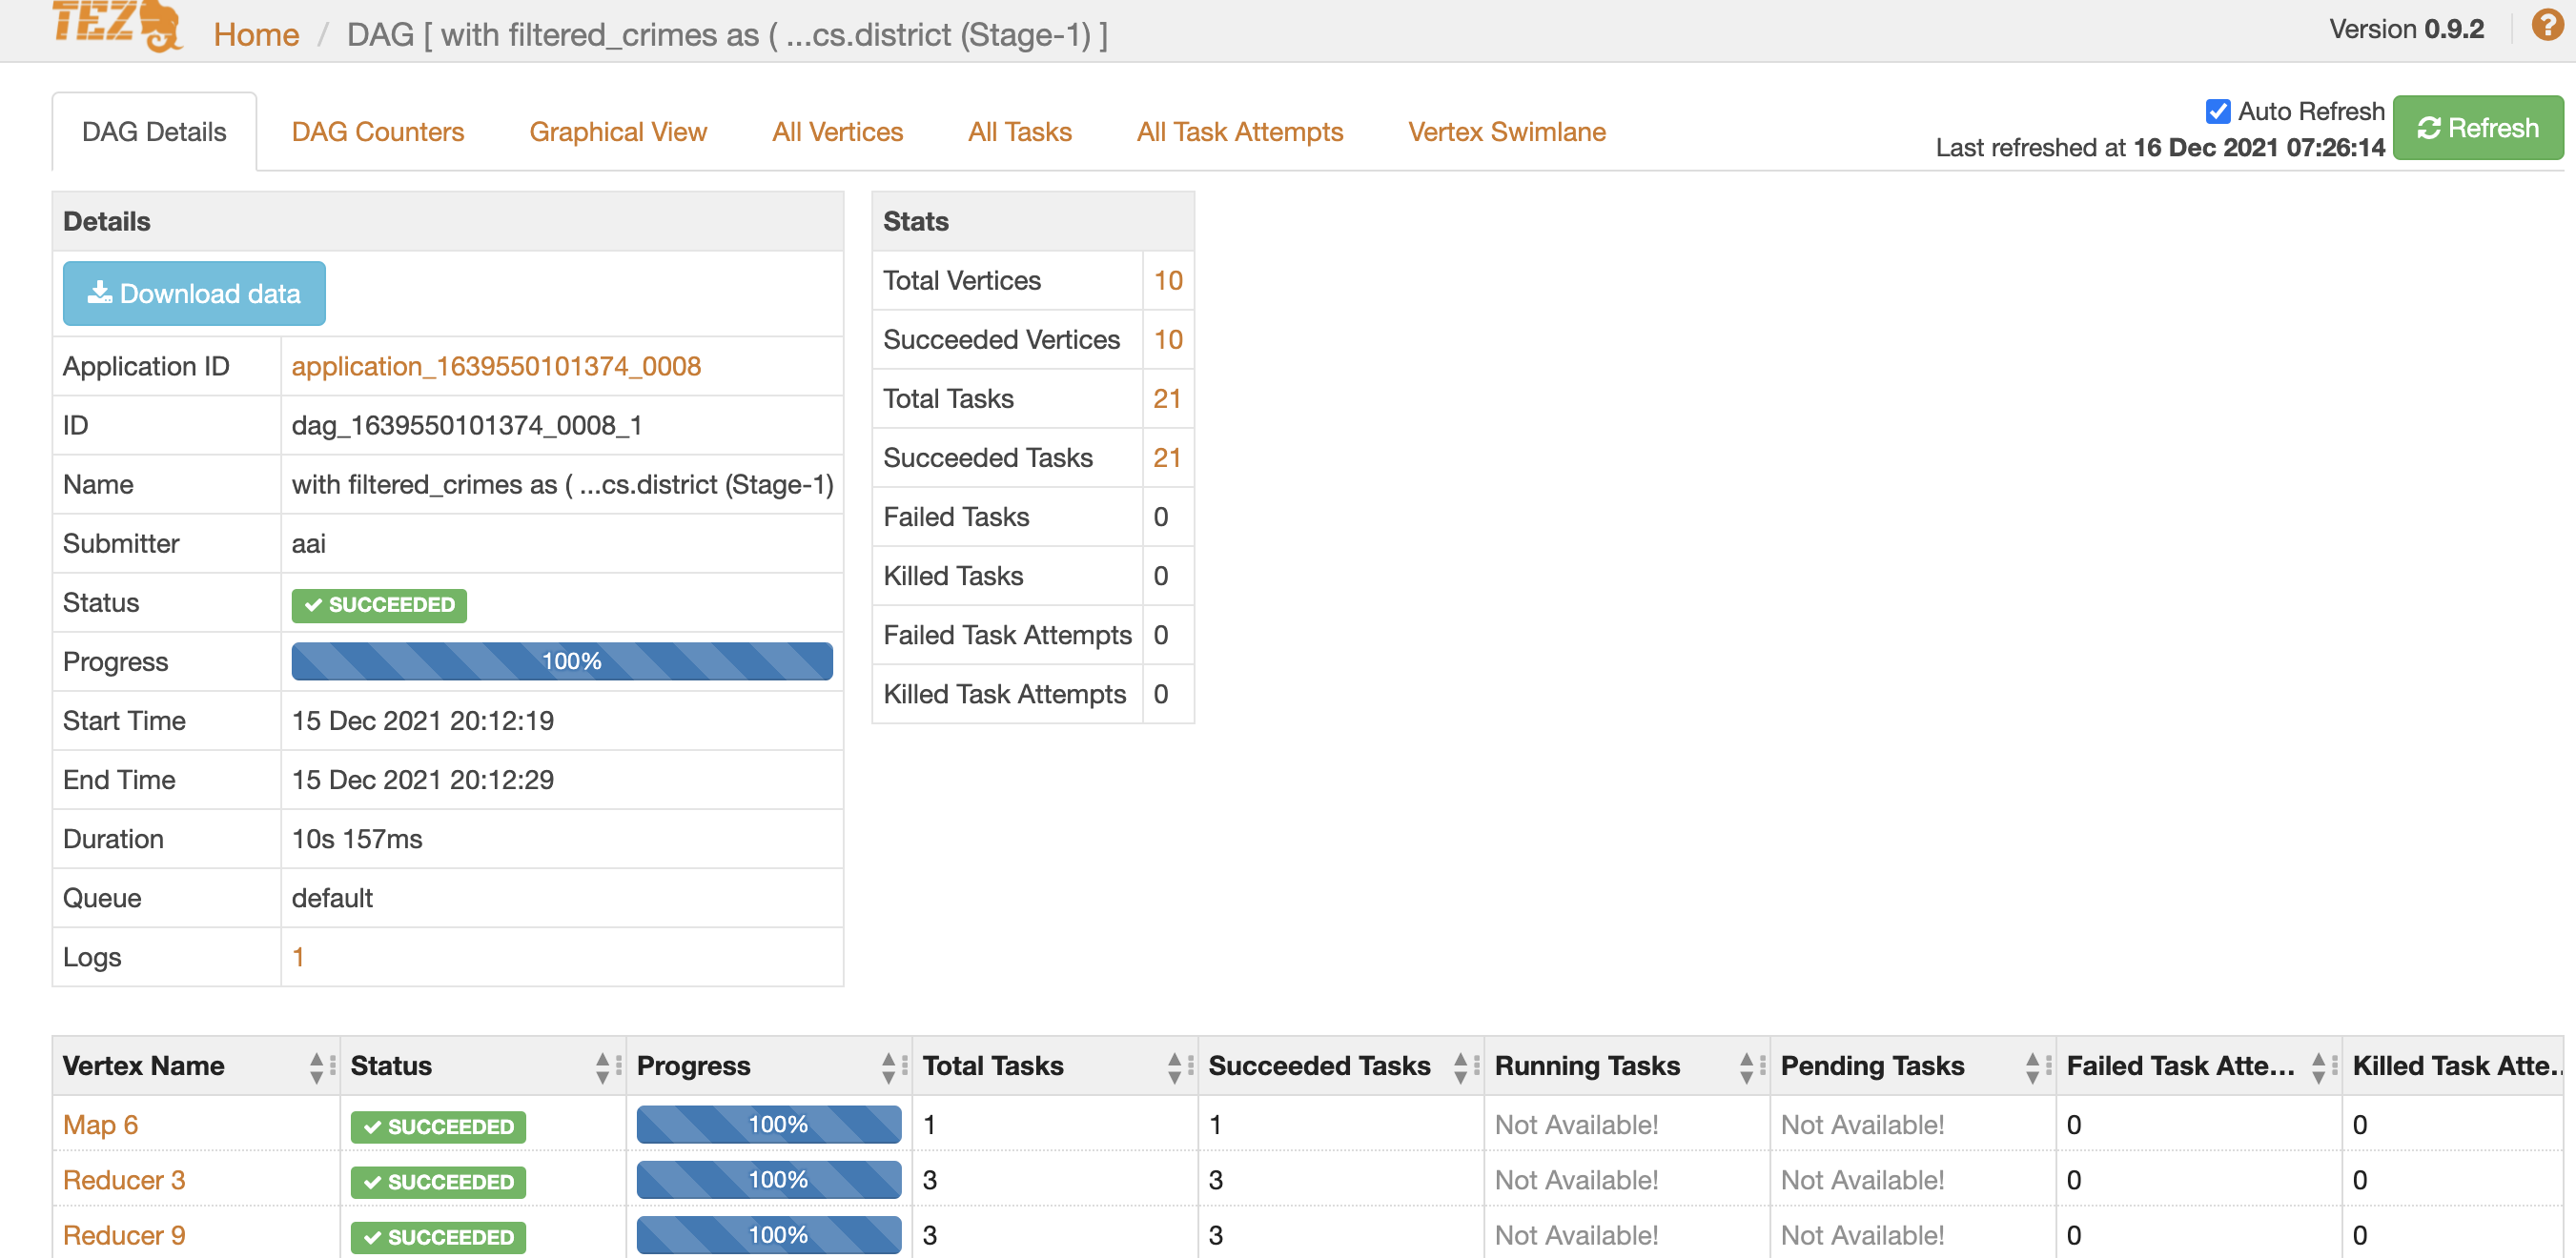
Run the Hive computation example to get the data about this computation on Tez UI. On the job completion, you can see the full statistics on the jobs page.
Job statistics
DAG Details
You can see all detailed information about the generated DAG. The Query Details tab provides information such as:
-
Hive query ID;
-
user who executed the query;
-
start and end time;
-
total time needed to execute the query;
-
tables that were read and written;
-
application ID;
-
DAG IDs;
-
session ID;
-
thread ID;
-
queue against which the query was run.
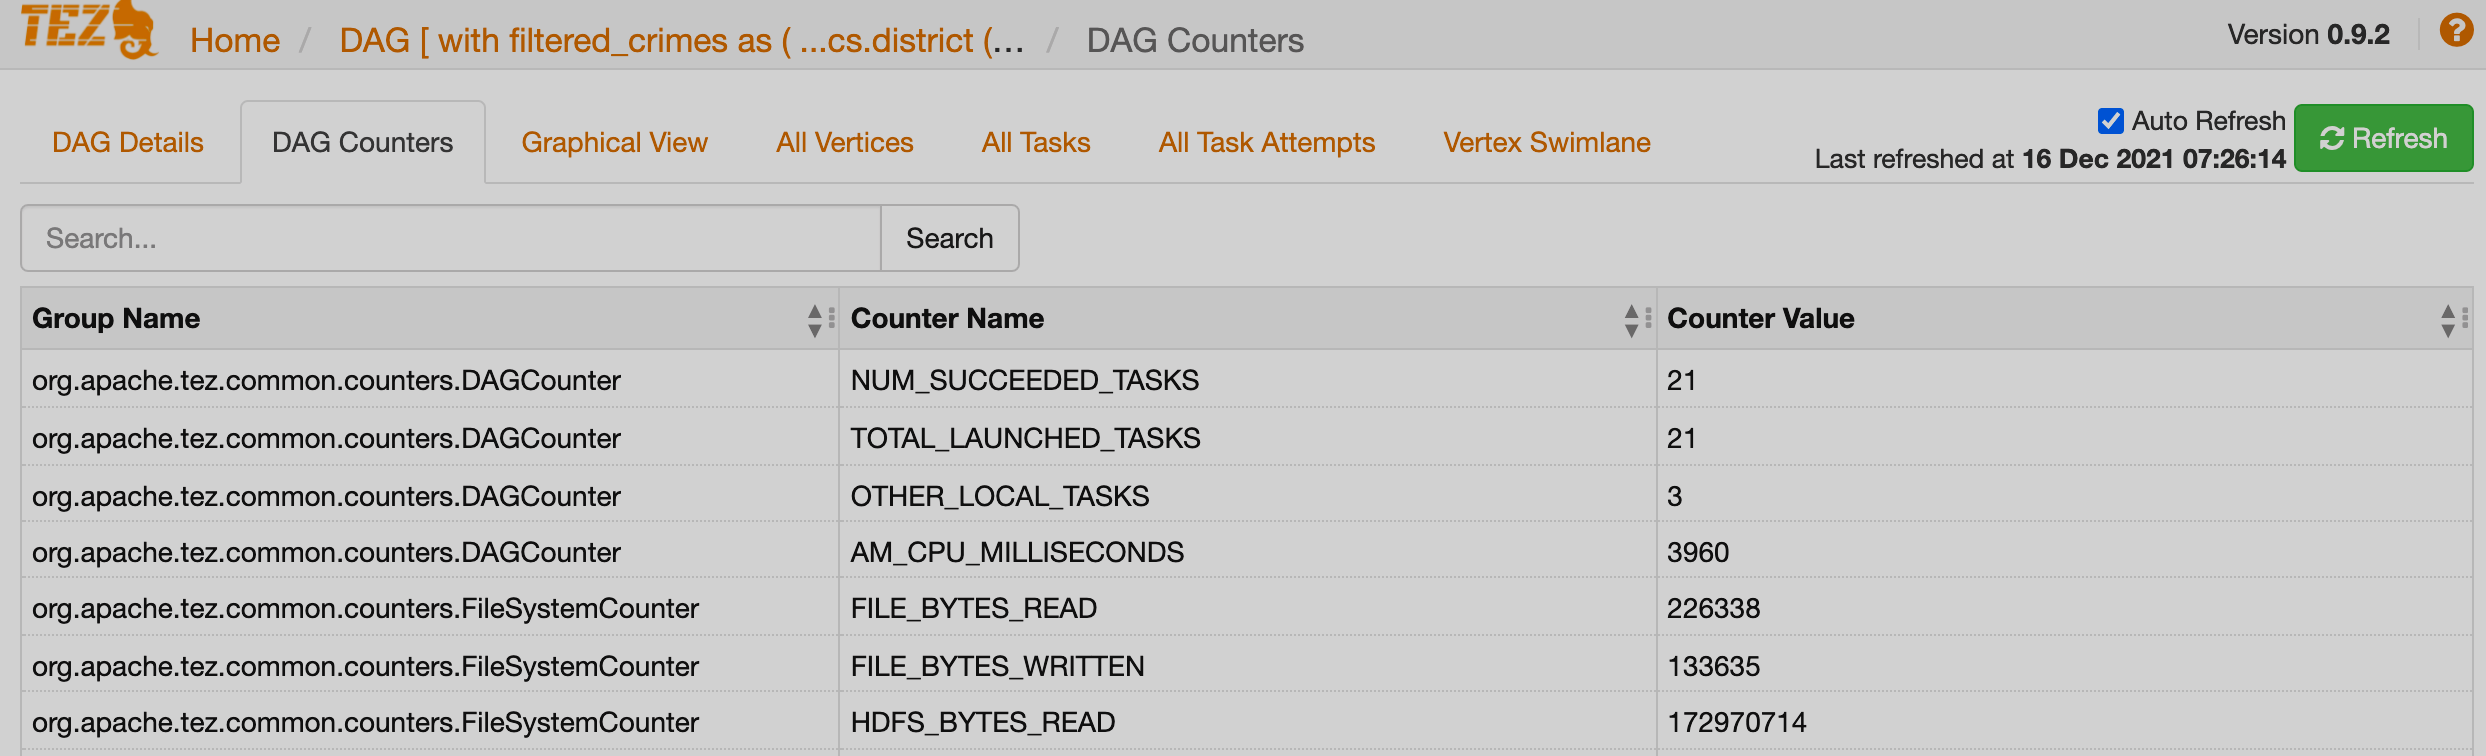
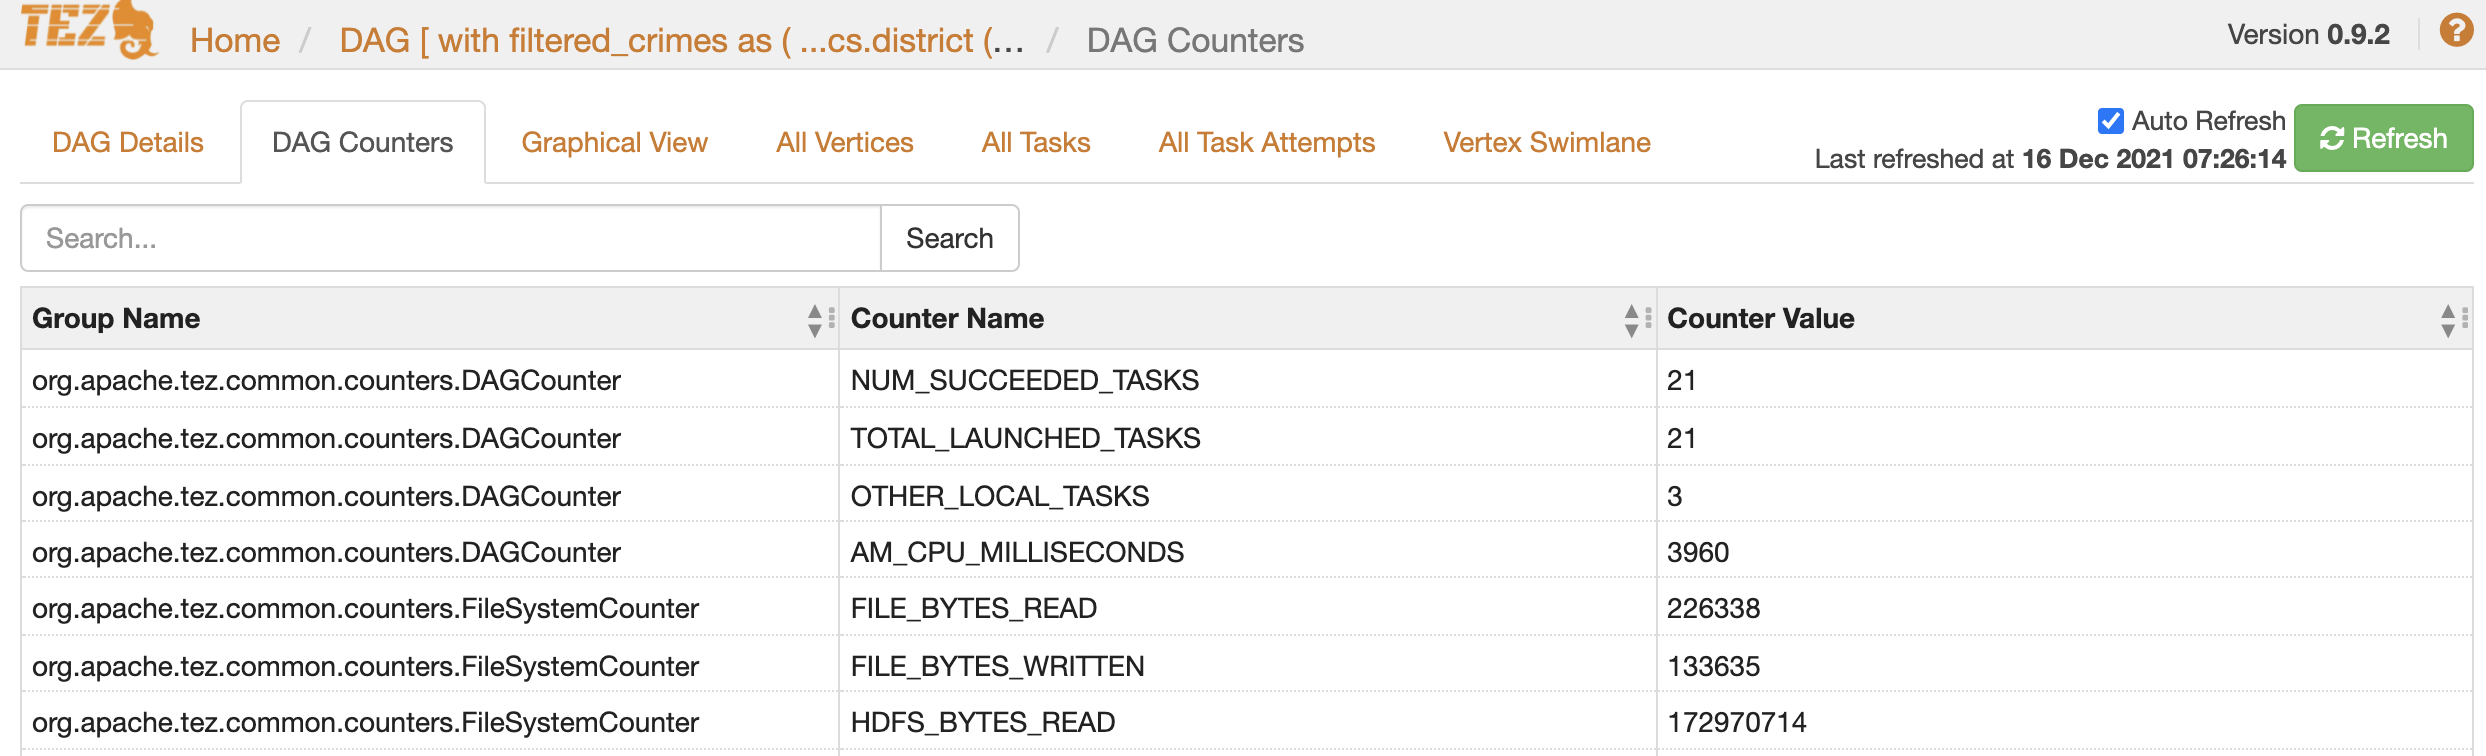
DAG Counters
DAG counters provide a way to measure the progress or the number of operations that occur within a generated DAG. Counters are used to gather statistics for quality control purposes or for problem diagnosis.
DAG counters provide the following details:
-
Group name;
-
Counter name;
-
Counter value.
Graphical View
The DAG Graphical View tab displays the DAG that is generated by Hive in the form of a flowchart.
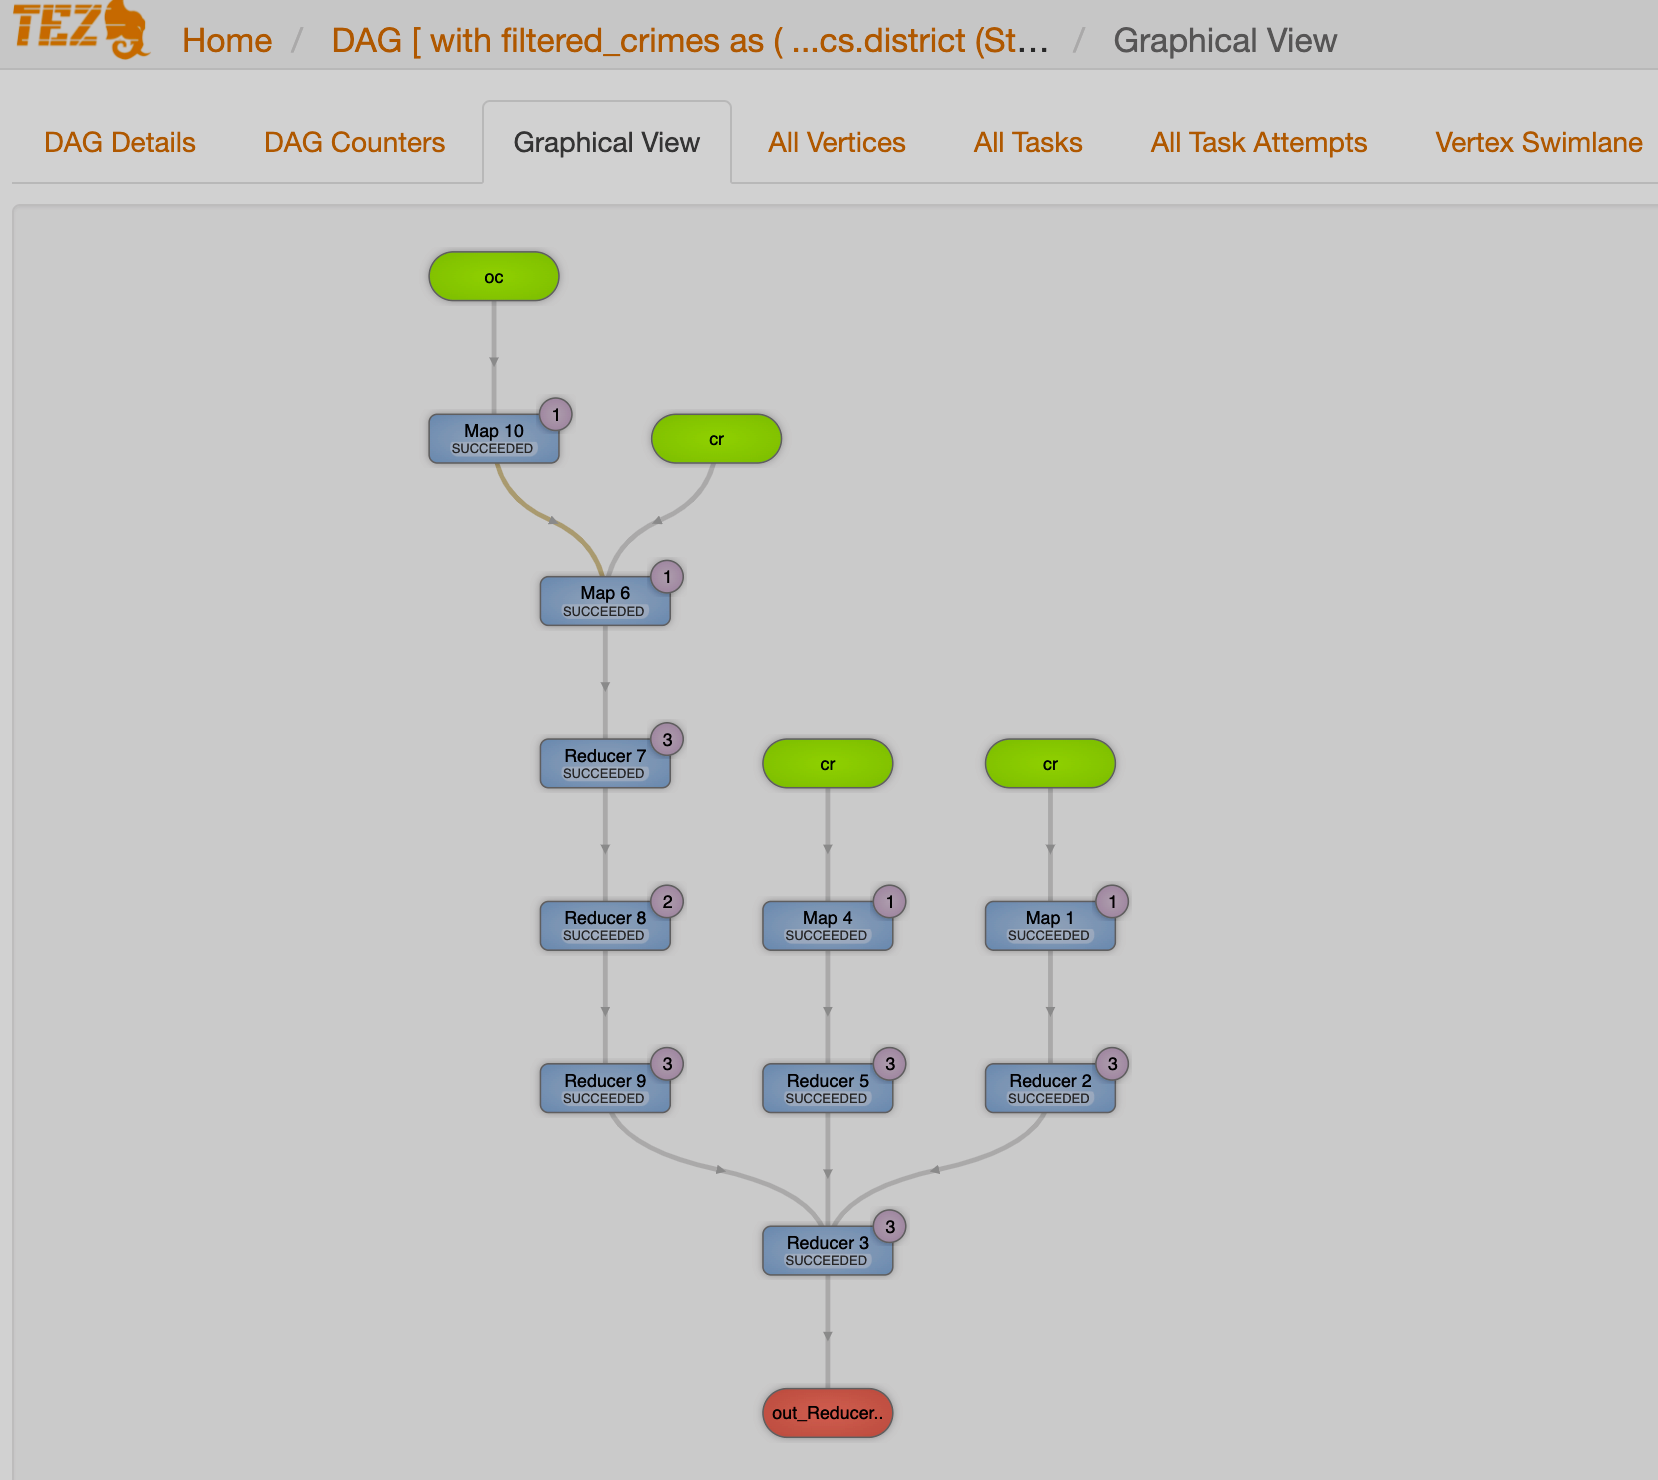
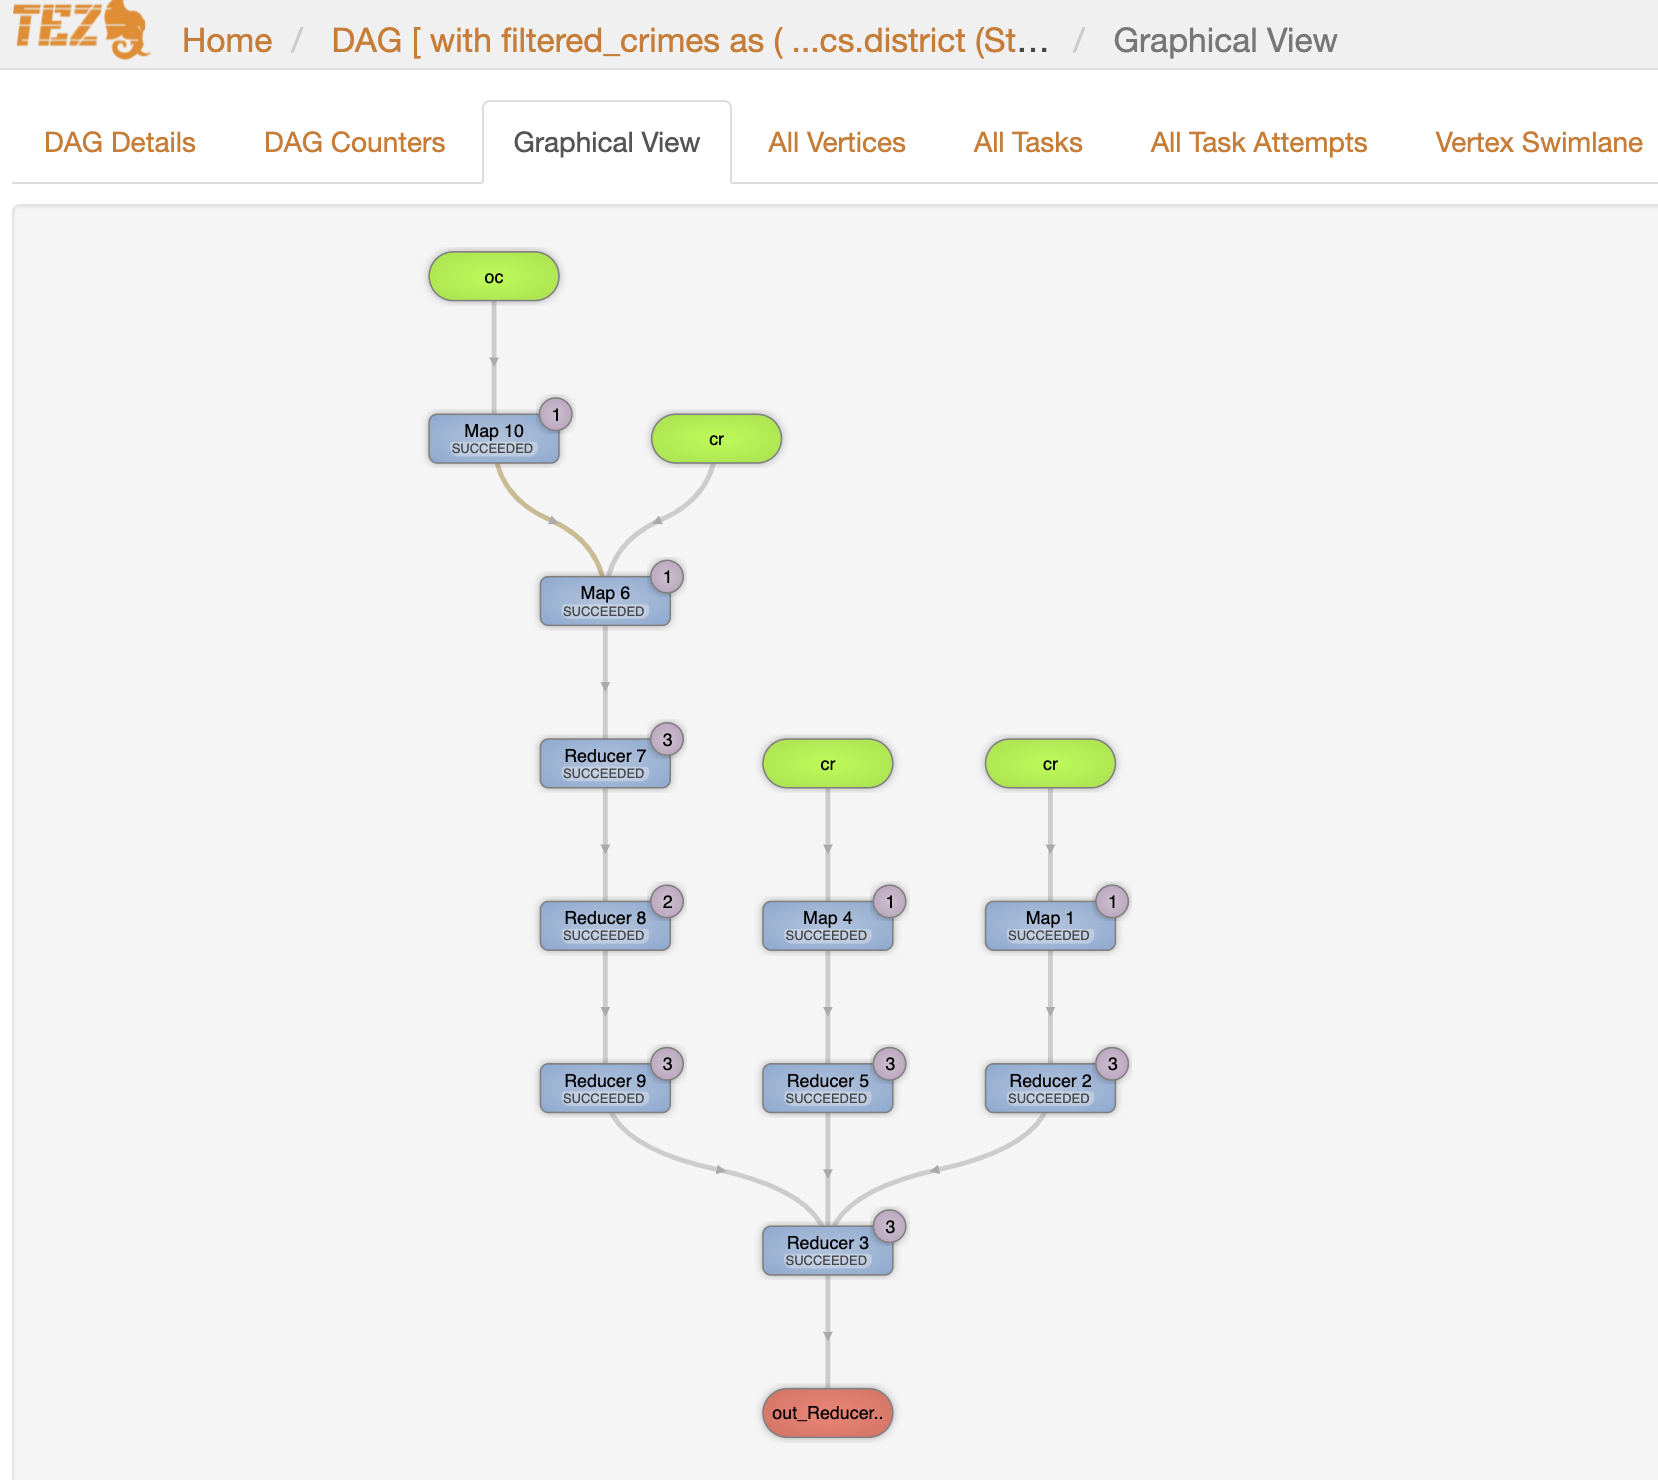
Here, the inputs to vertices Map 10, Map 6, Map 4, and Map 1 are the tables displayed in green boxes.
Next, Map 6 depends on the result set generated by Map 10.
Map 6 then passes its result as an input to Reducer 7.
When the Reducer 7 finishes its execution, the results are passed onto Reducer 8 and then to Reducer 9.
Reducer 3 is the last vertex in the DAG flow.
After `Reducer 3`_ successfully completes its execution, the query output is written to a file in HDFS.
There are a few options to change the layout of the DAG flow. You can hide the input and the output nodes to view only the task vertices by clicking the Toggle source/sink visibility icon. You can switch between the horizontal and vertical orientation by clicking the Toggle orientation icon.
When you hover an element, you get the full information about vertex details, status and progress, duration, and tasks number.
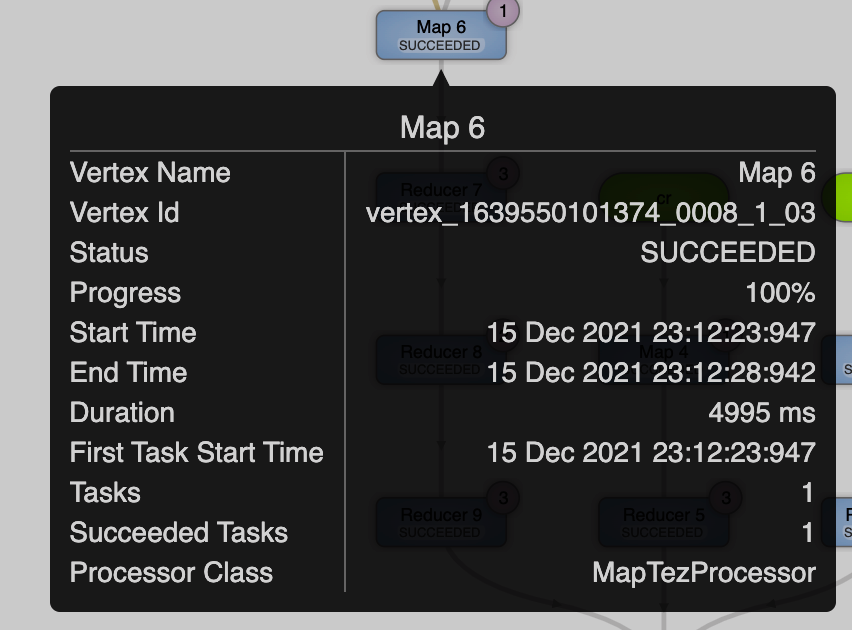
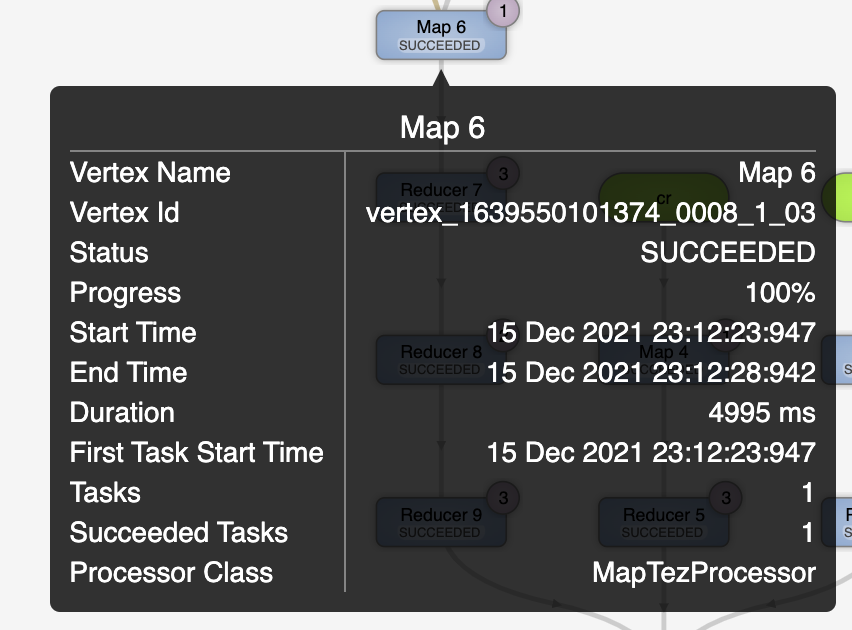
If you click on an element, you get the full statistics about this vertex on several tabs.
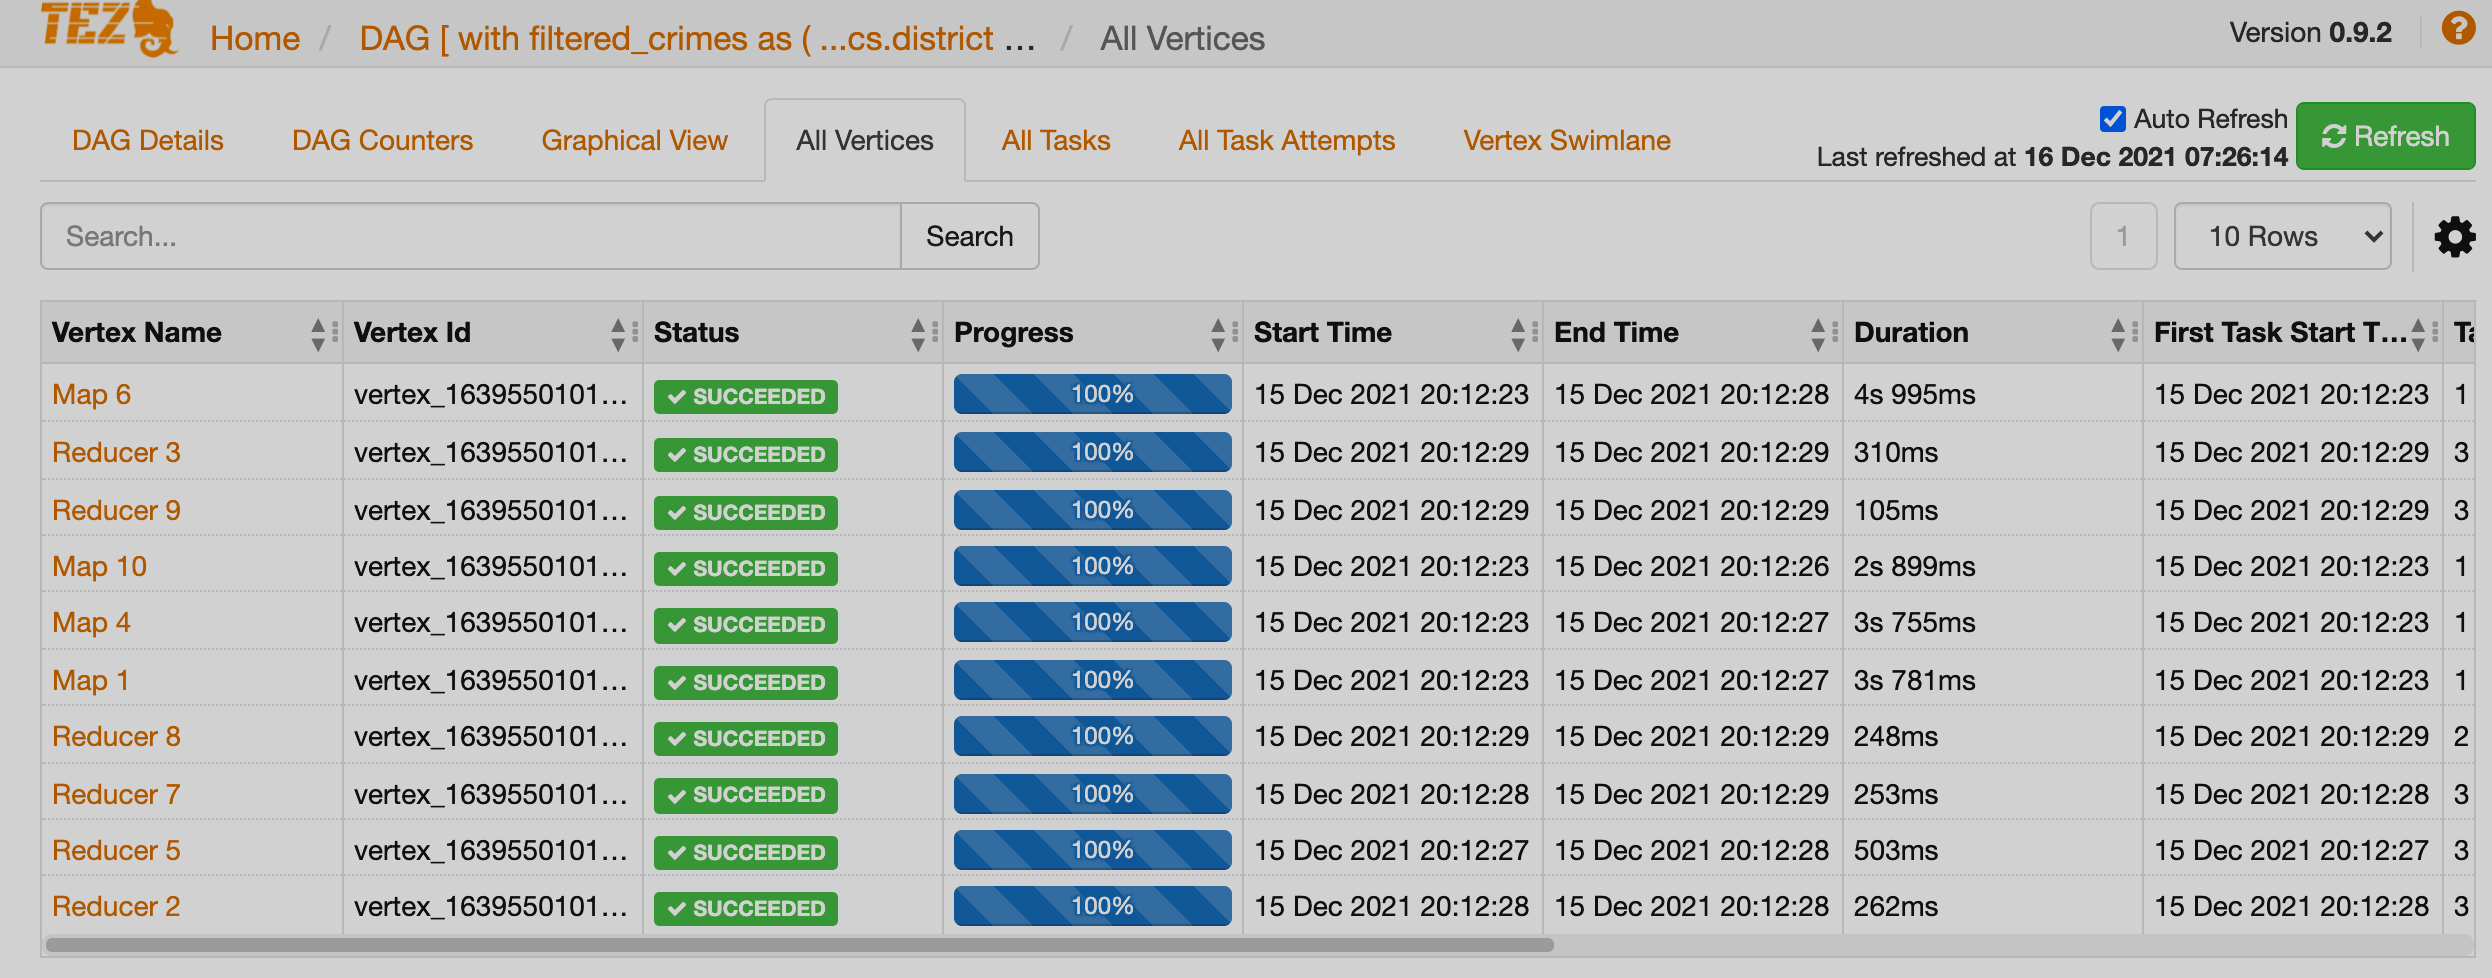
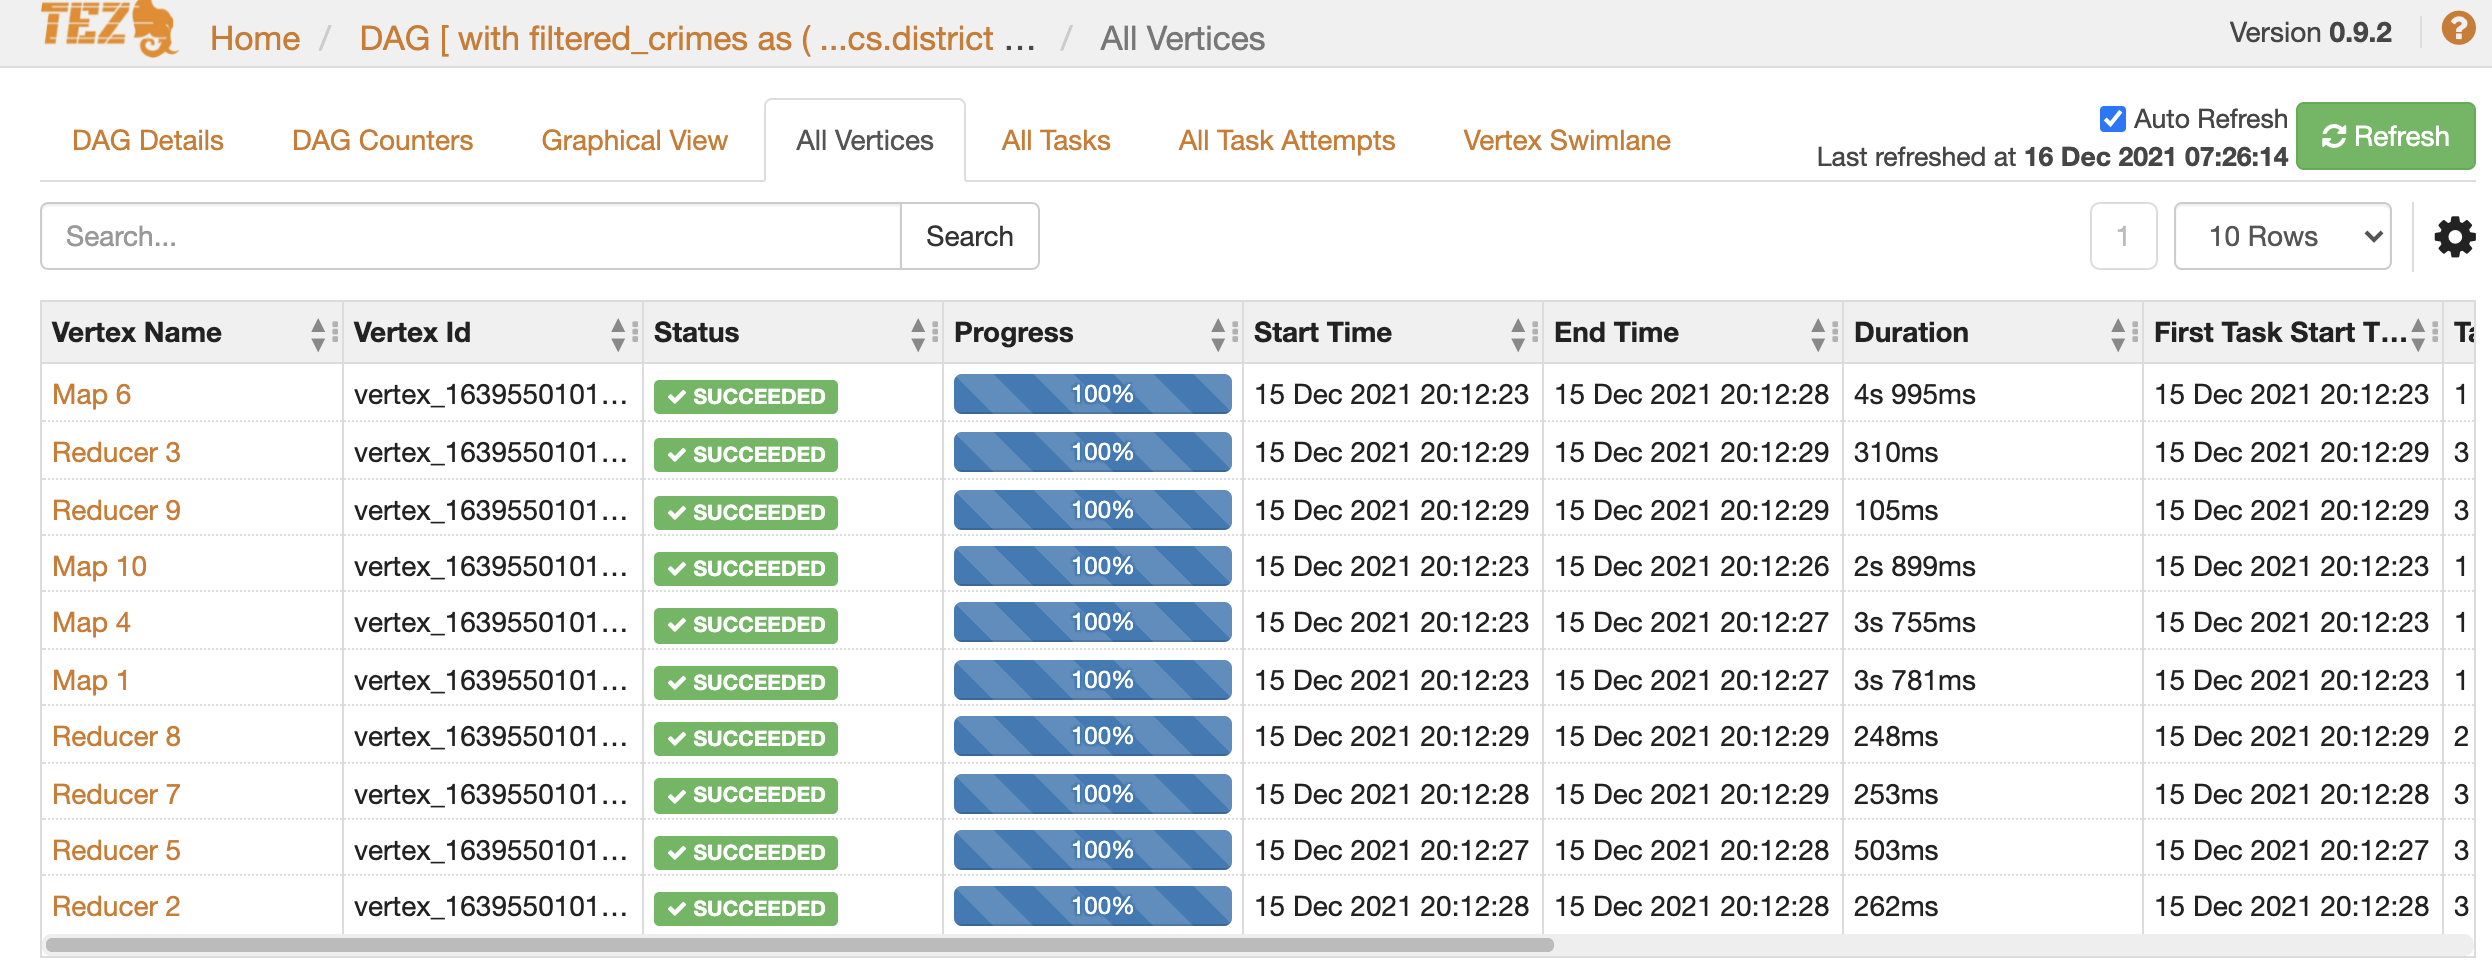
All Vertices
On this tab, you can see a table that shows full information about Maps and Reducers. Each Vertex name is a link that directs you to the detailed information on Maps and Reducers.
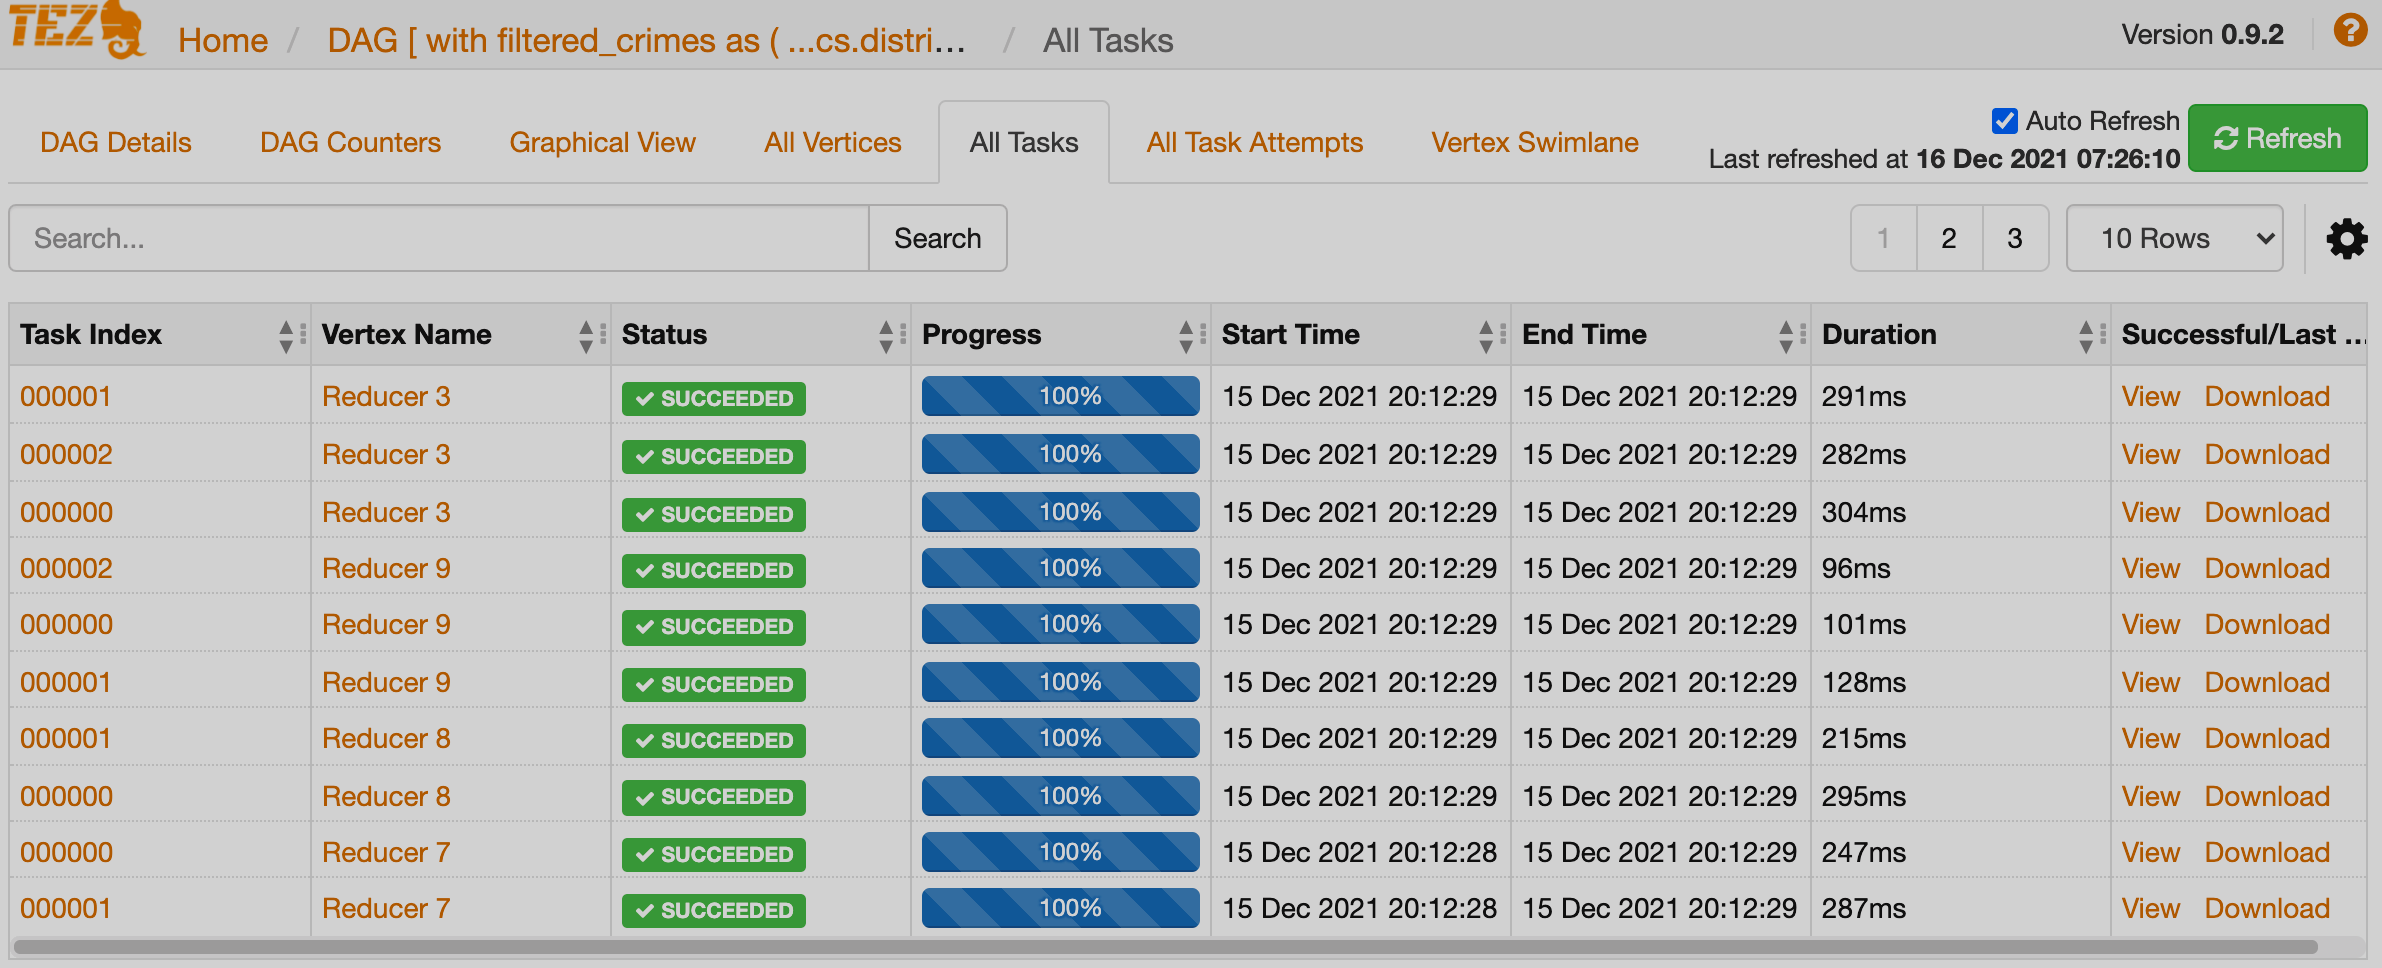
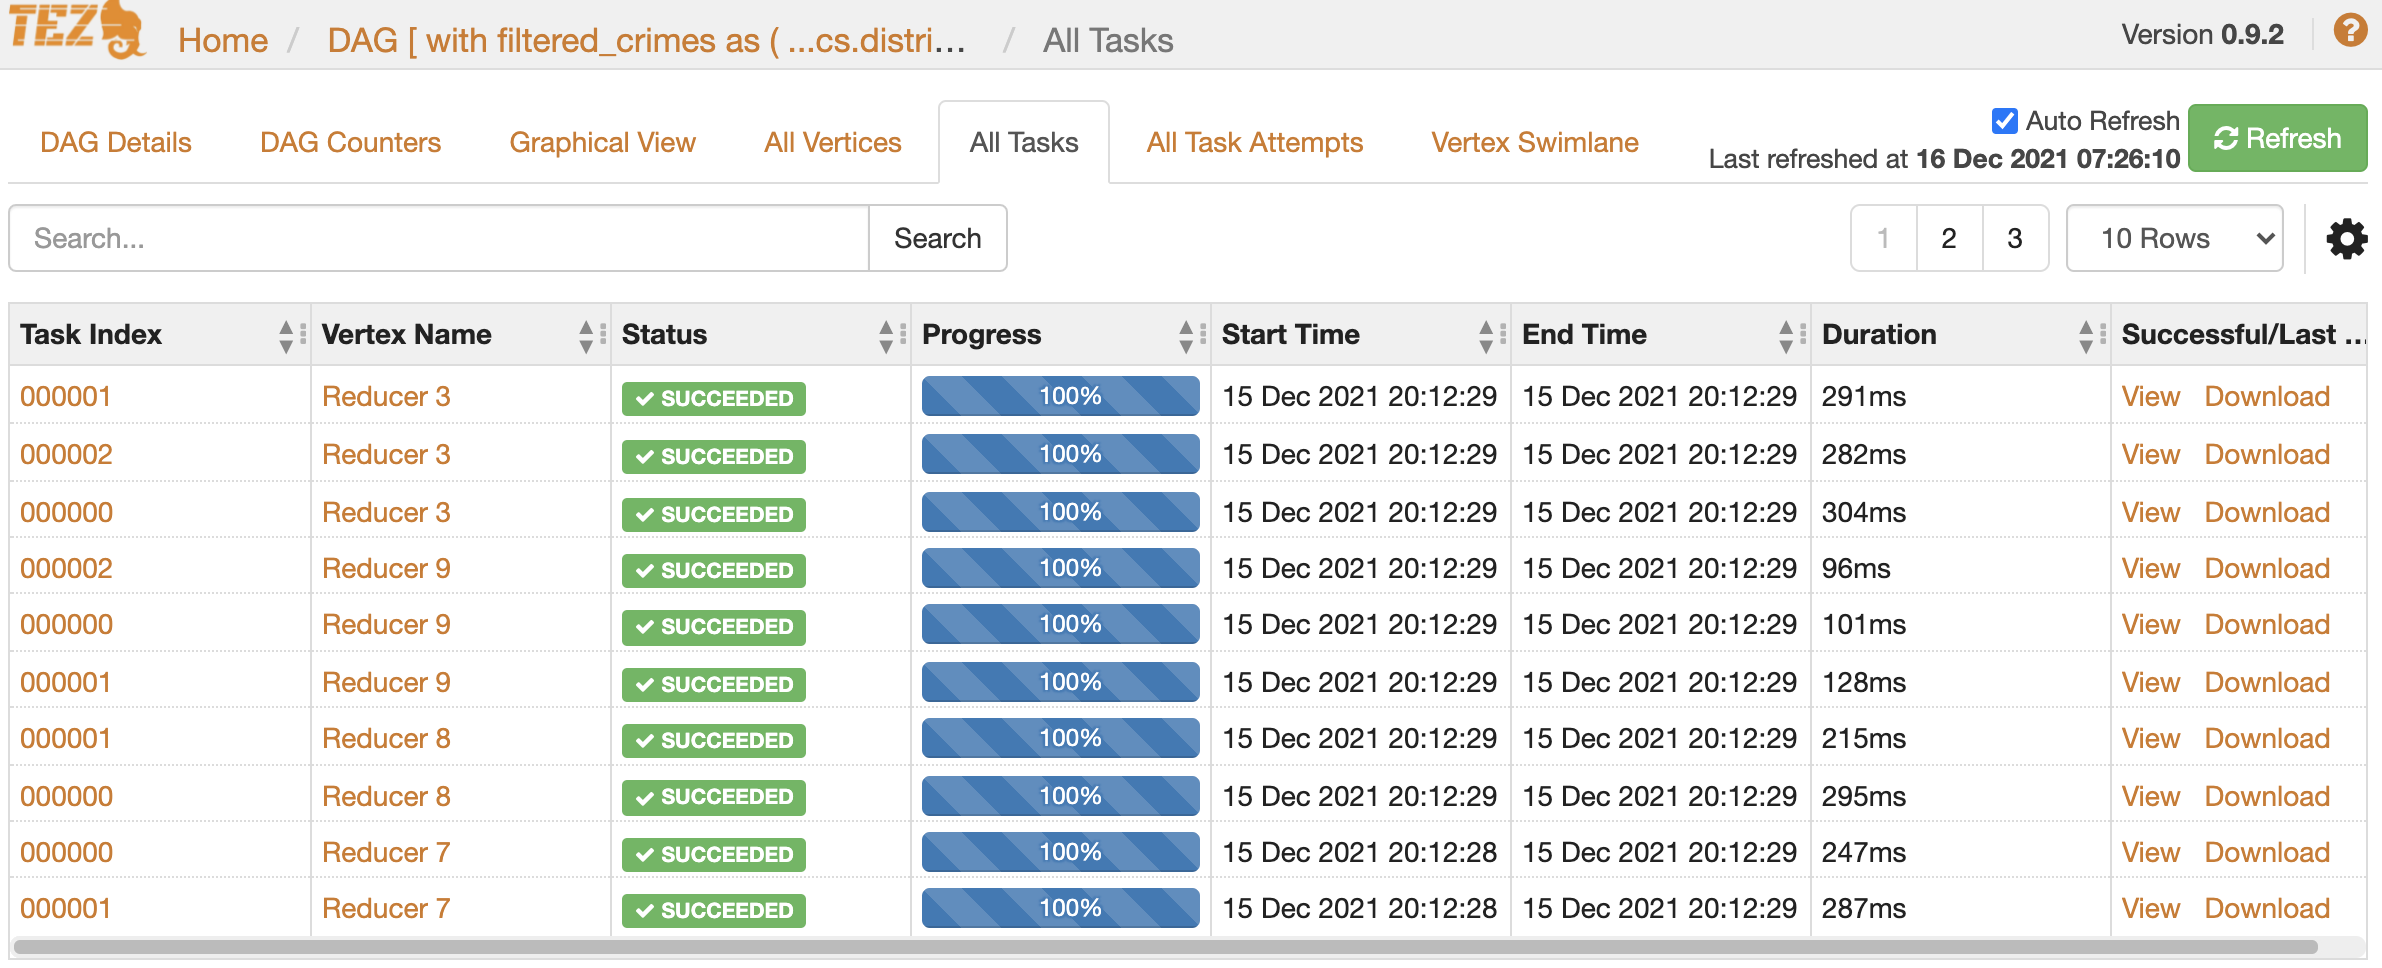
All Tasks
This tab shows the detailed statistics about Reducer tasks. Using the links, you can view the detailed information about any task or Reducer.
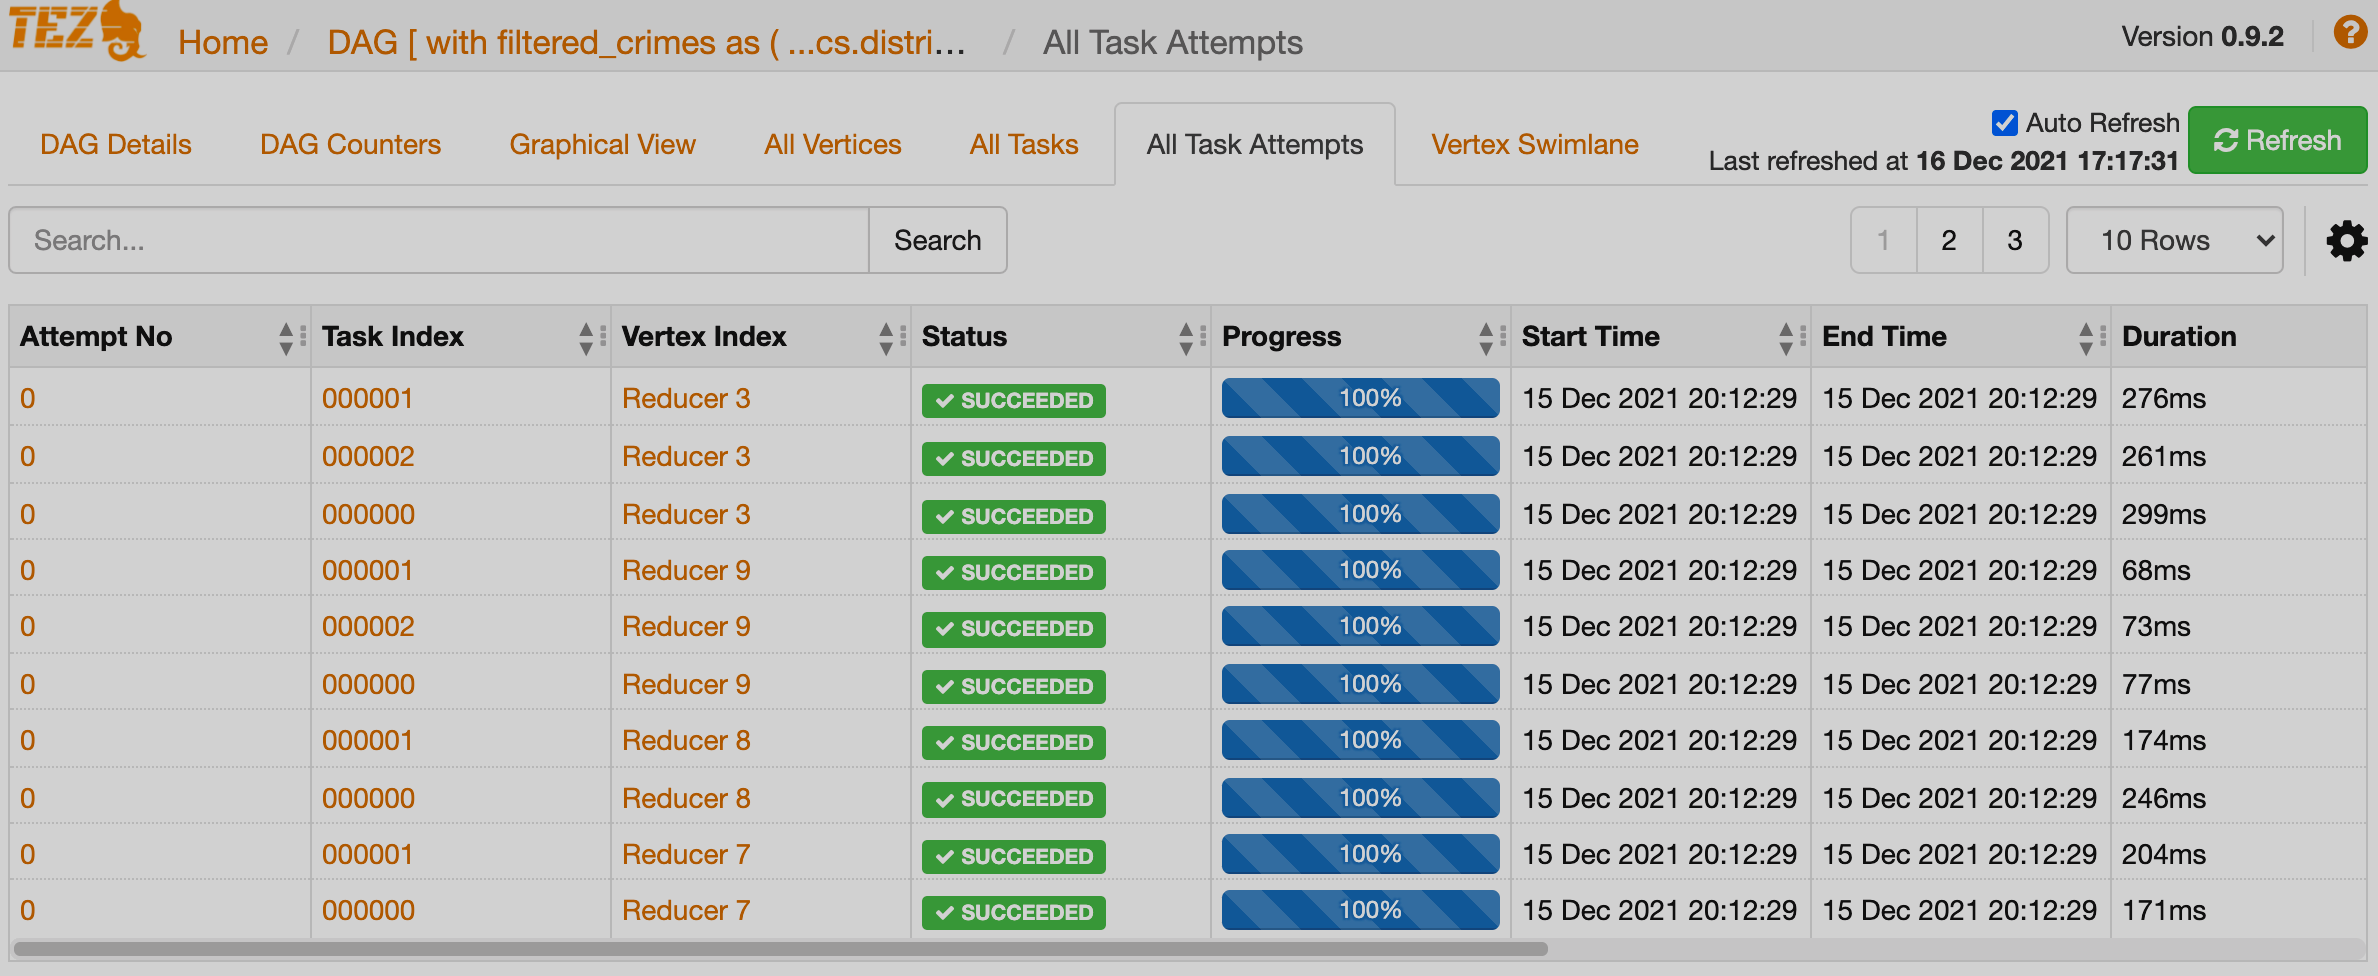
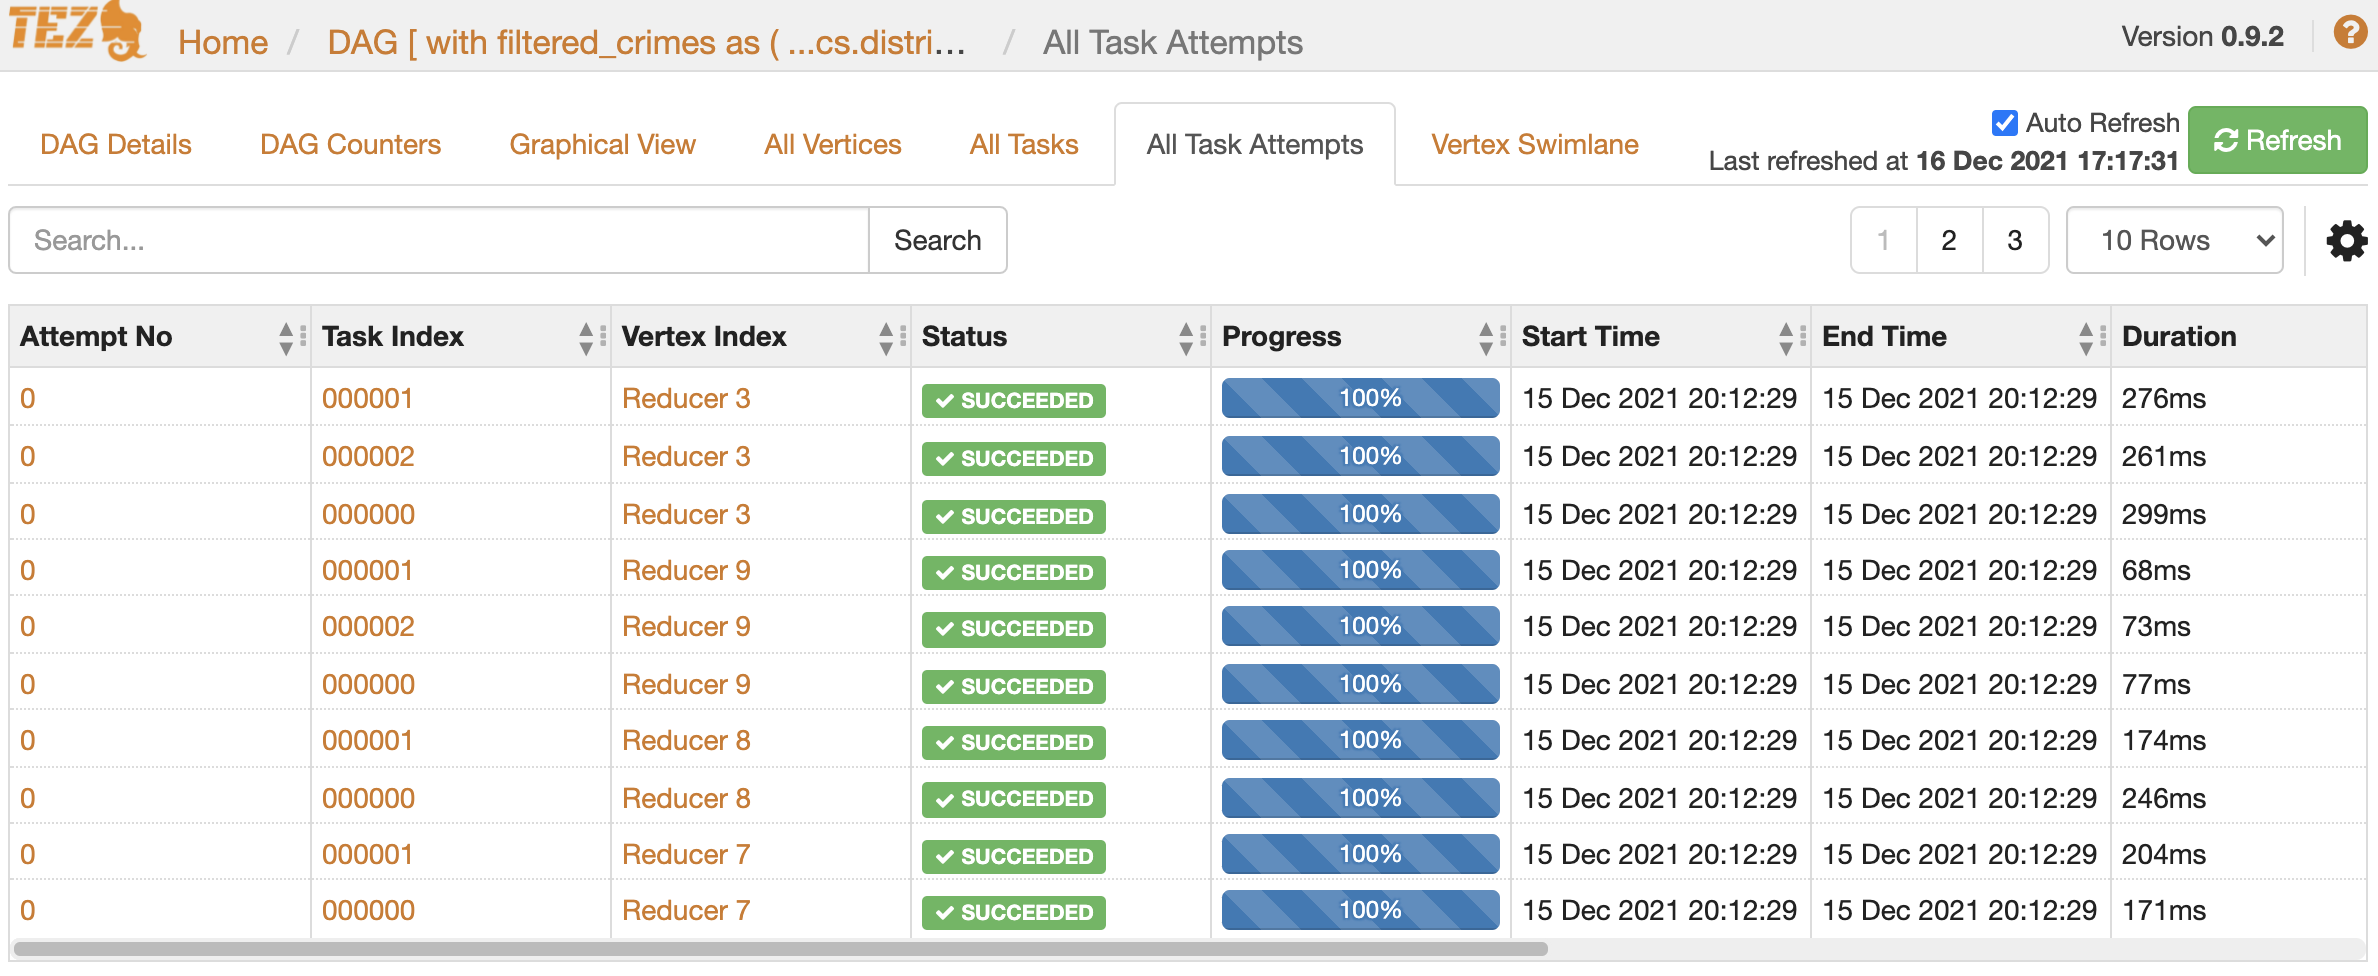
All Tasks Attempts
This tab shows the detailed statistics about all Reducer tasks attempts. Using the links, you can view the full information about any attempt, task or reducer.
Vertex Swimlane
This tab shows the DAG of the vertices against time. Each mapping and reducing task is a vertex.
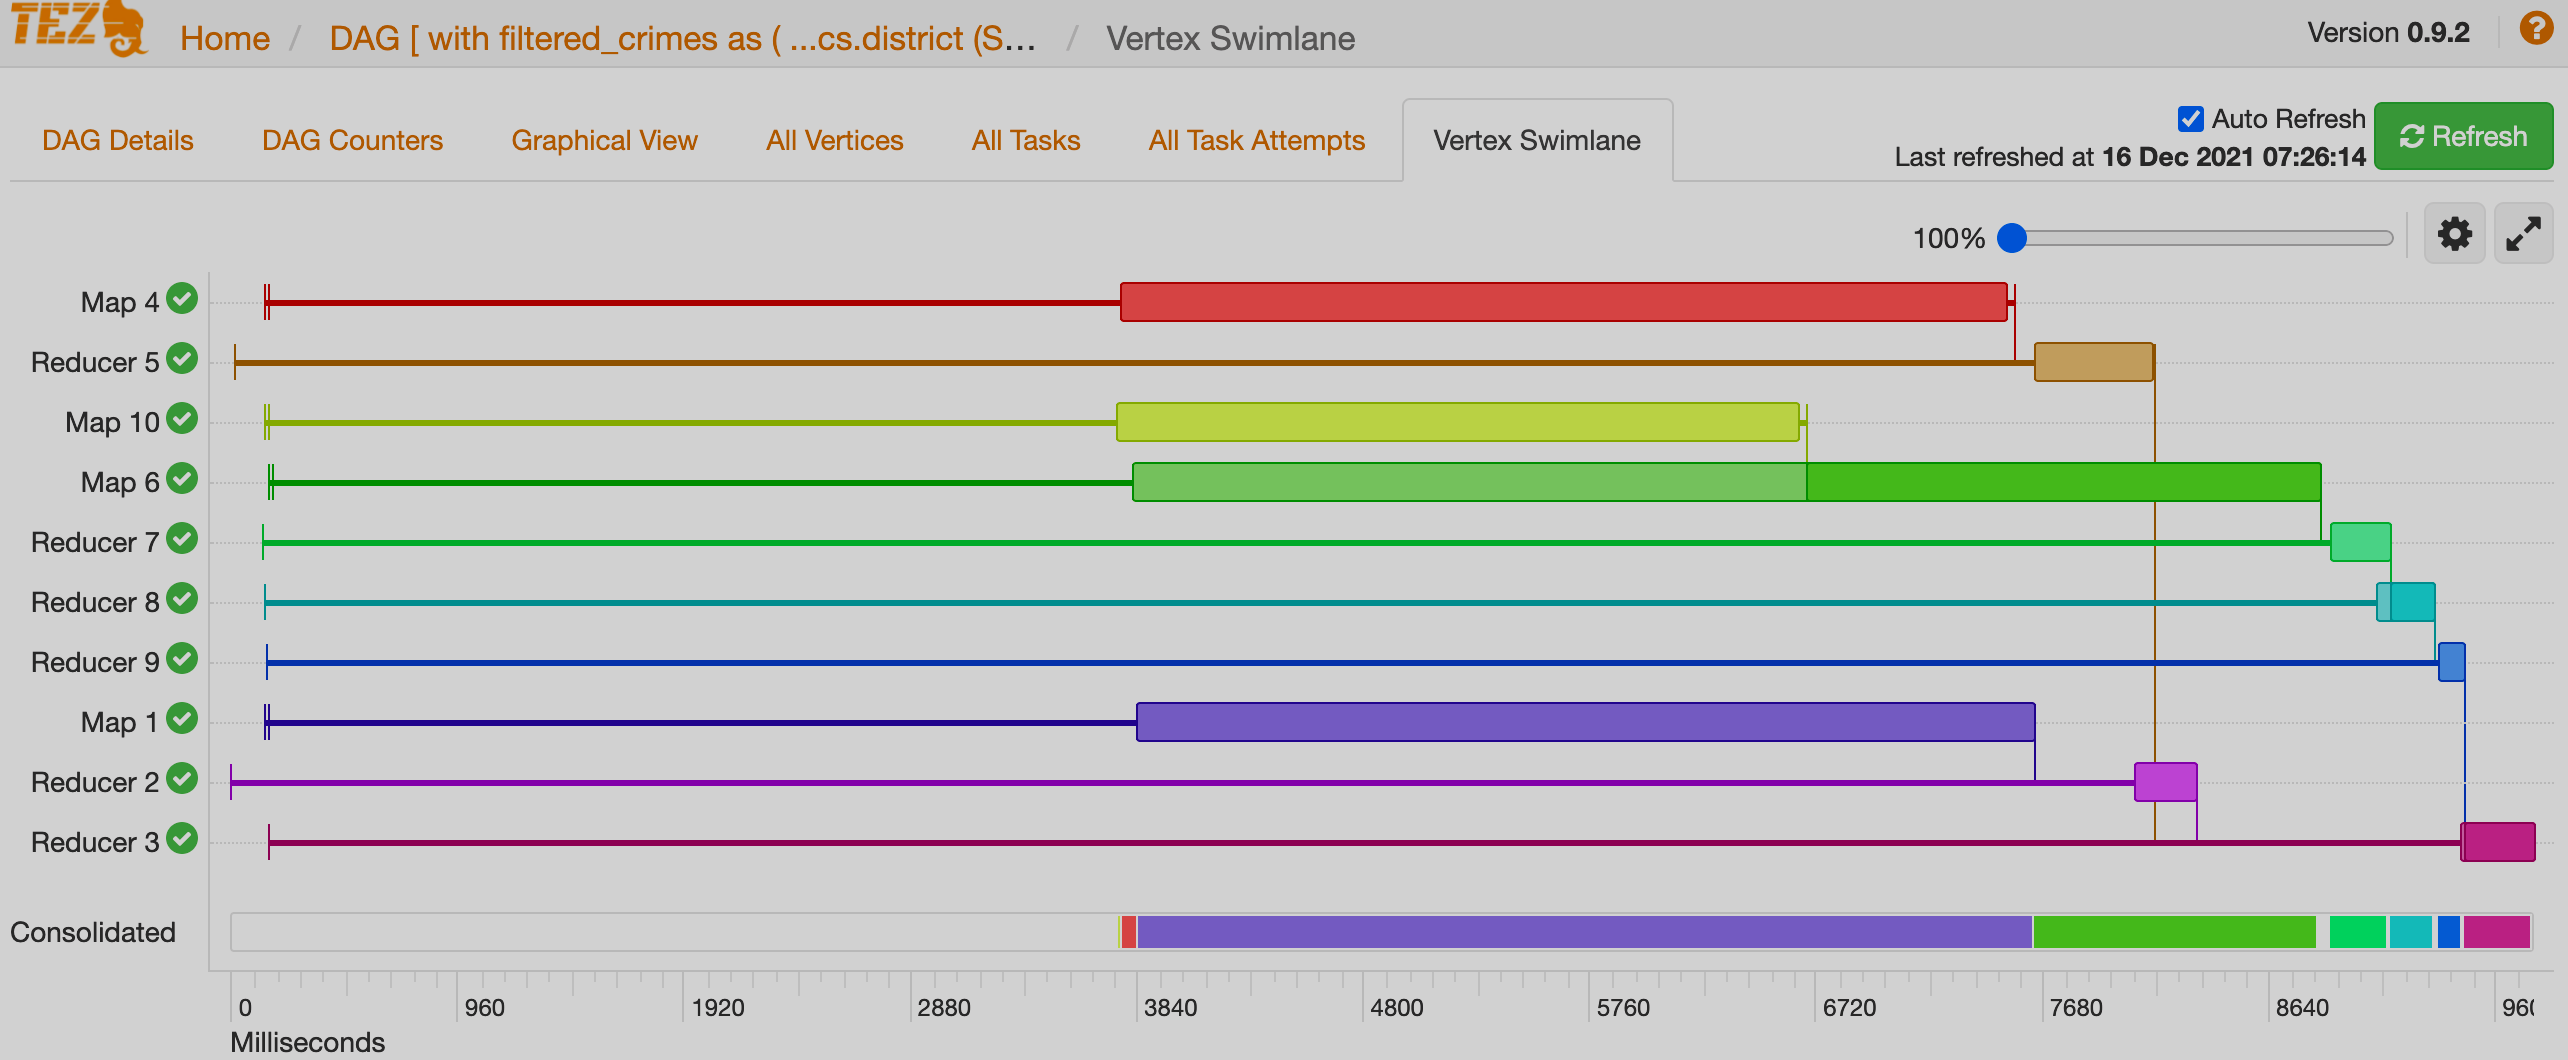
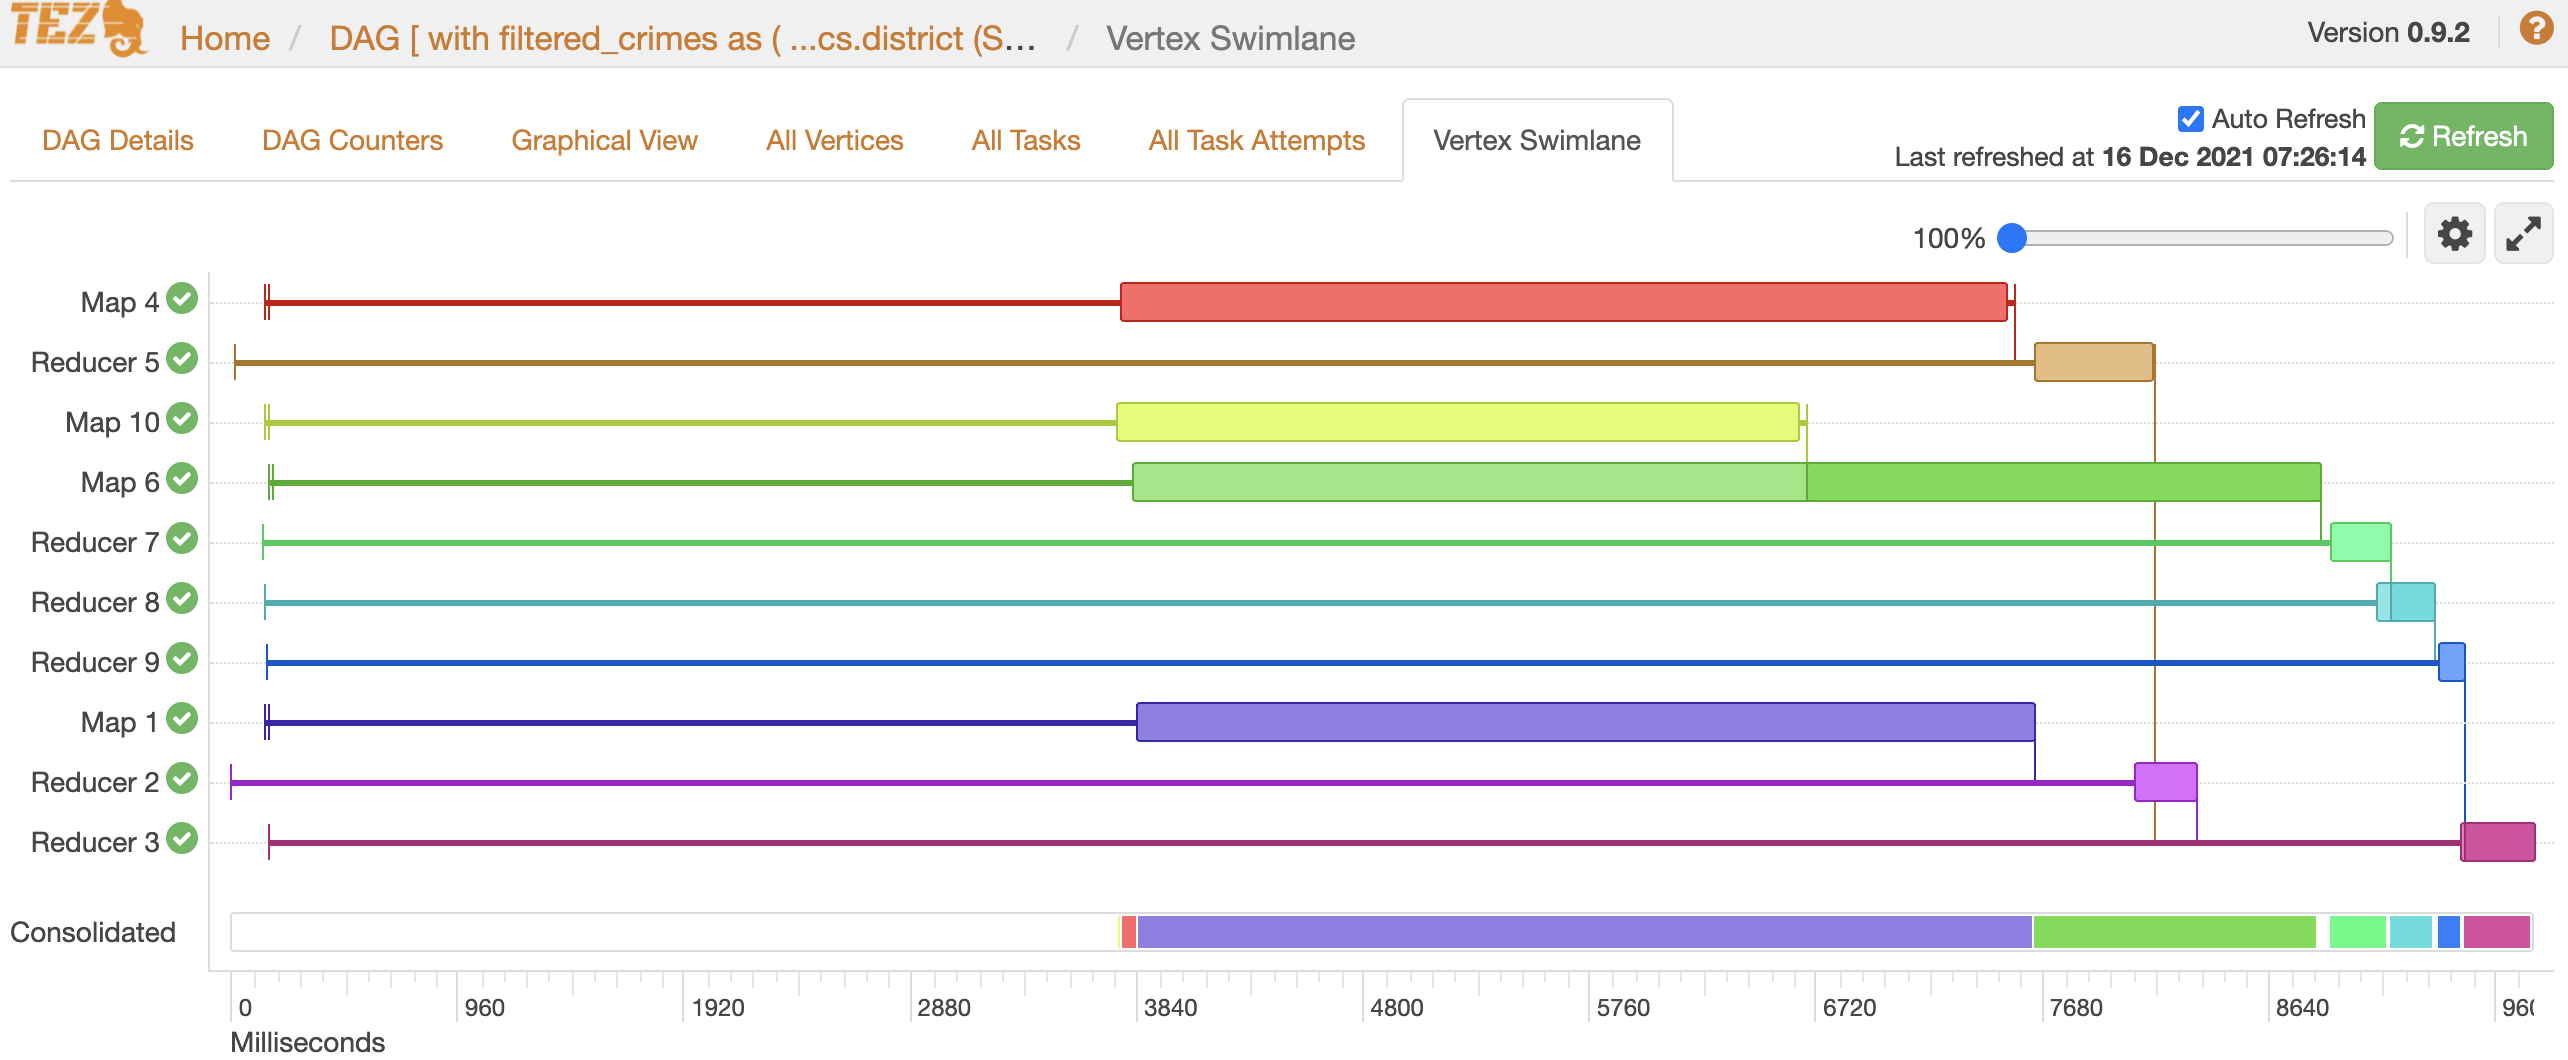
Each horizontal line of the swimlane represents the total time taken by the vertex to complete. The vertical lines indicate the time when:
-
the vertex was initialized;
-
the vertex was started;
-
the time when the first task was started;
-
the time when the last task was completed;
-
the time when the vertex finished its execution.
When you hover the vertical line, the bubble displays the stage of the vertex execution and provides a timestamp.
To know more about a particular vertex, hover the mouse anywhere at the horizontal line.
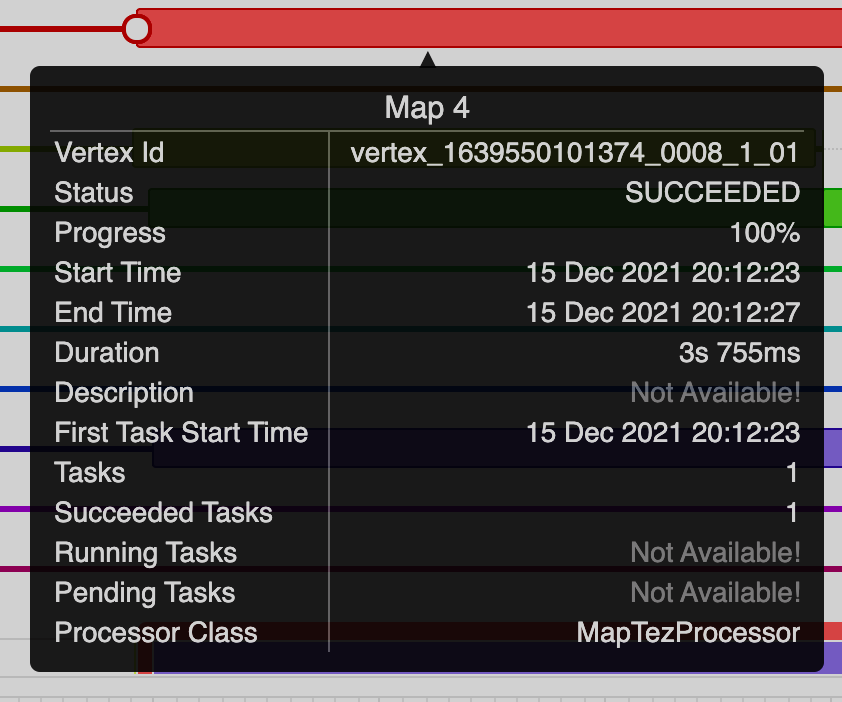
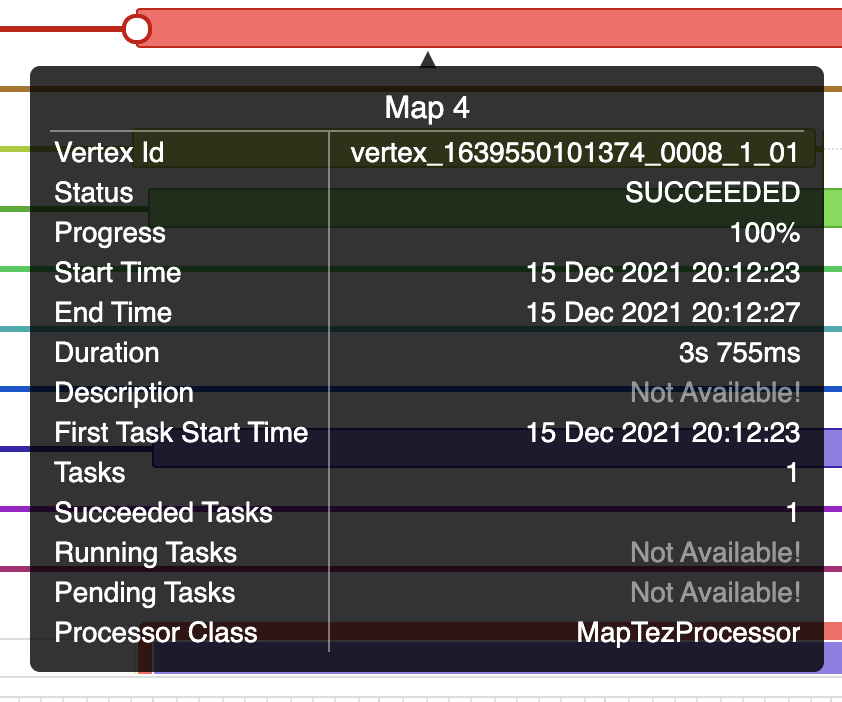
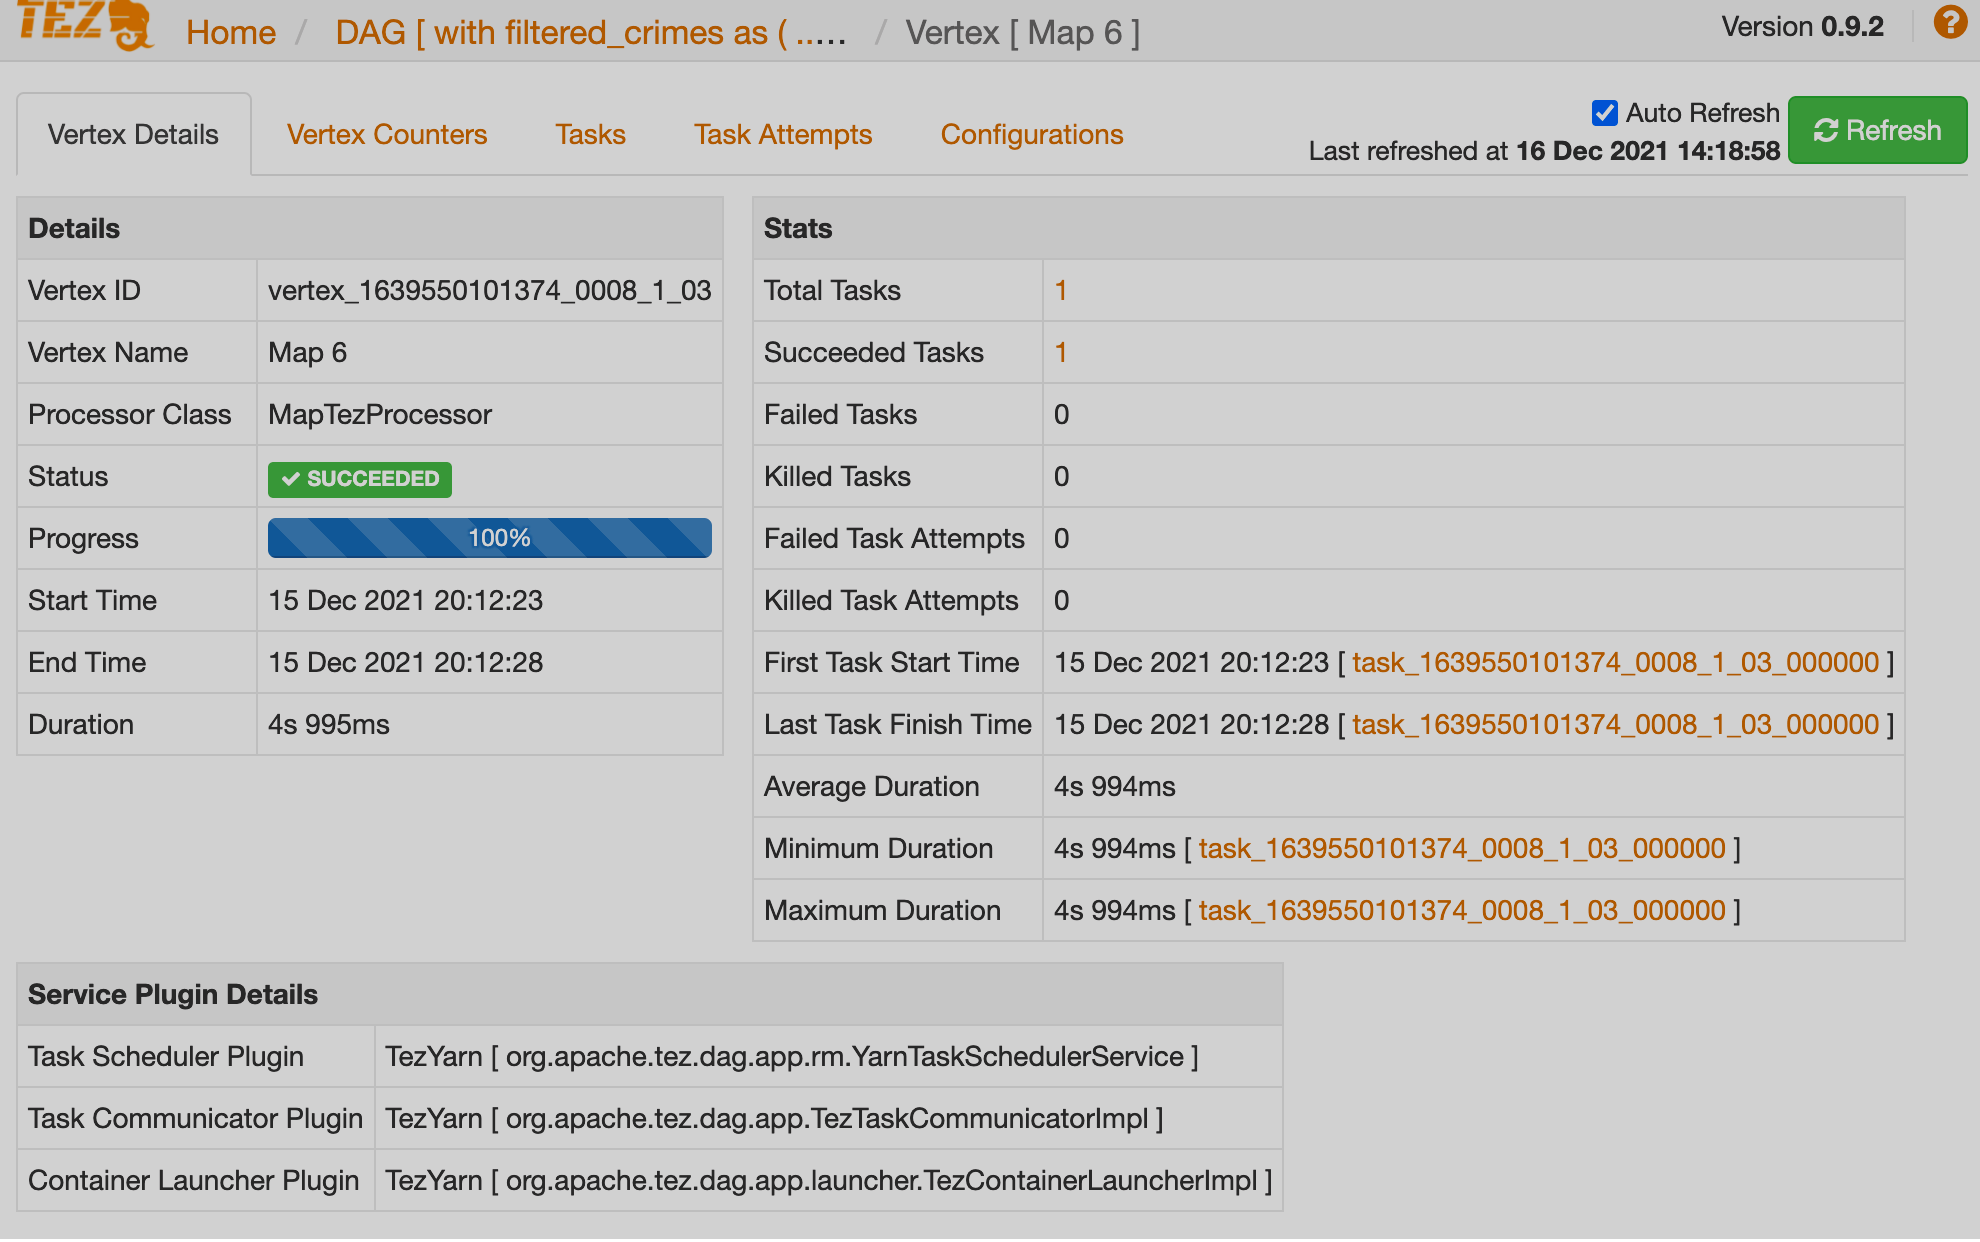
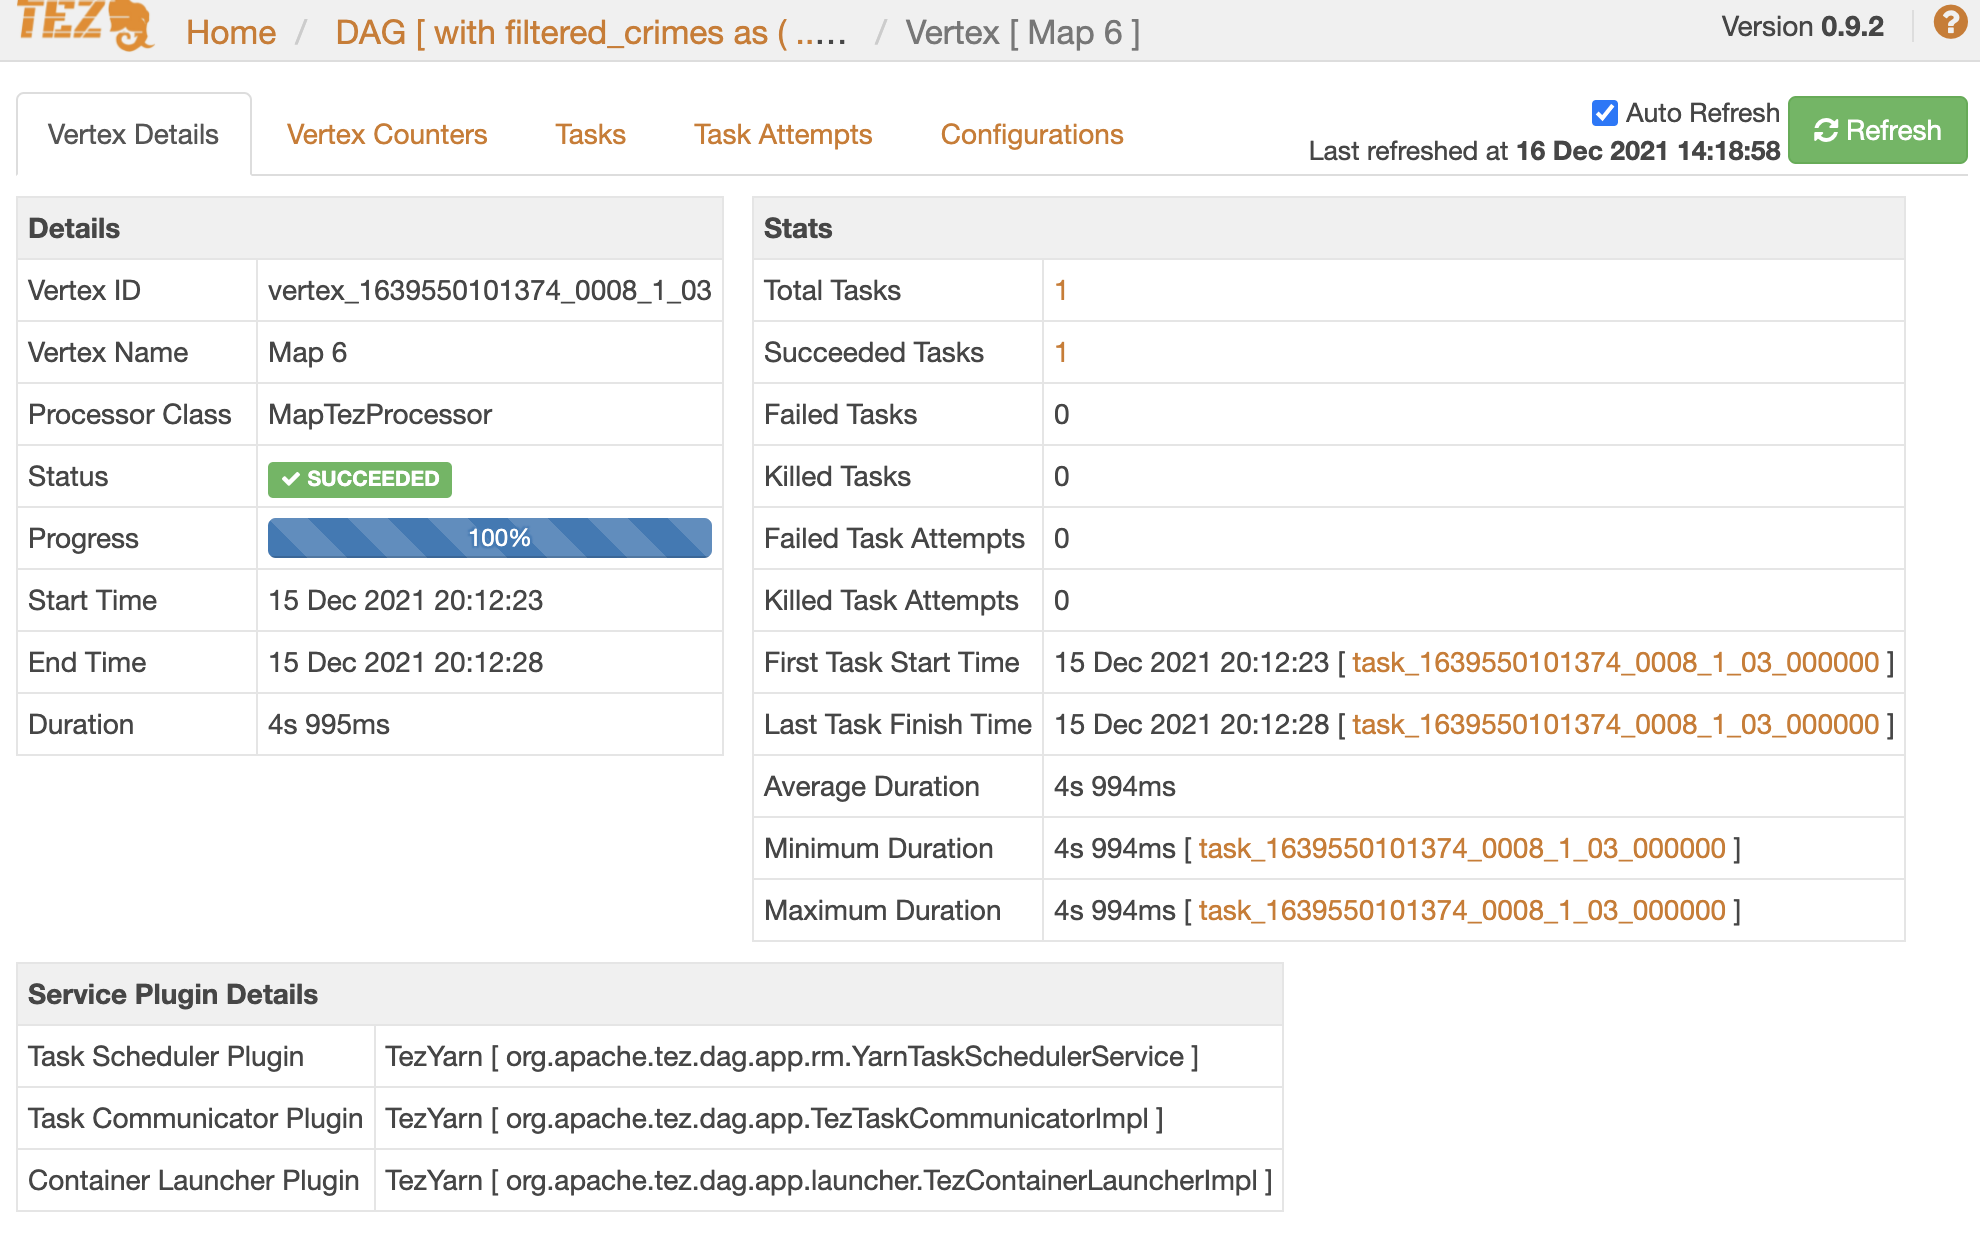
The following details can help you to view the time taken by a particular task and debug the query:
-
Vertex ID — a unique identifier for a particular vertex.
-
Status — indicates the query status.
-
Progress — the progress of the vertex, usually for long-running queries.
-
Start time — indicates when a particular vertex started.
-
End time — indicates when a particular vertex ended.
-
Duration (in milliseconds) — the total time taken by the vertex to complete its execution.
-
Description — the description of the vertex.
-
First task start time — when the first task within that vertex started its execution.
-
Tasks — the total number of the tasks executed in a particular vertex.
-
Succeeded tasks — the number of the tasks that were executed successfully within that vertex.
-
Running tasks — the tasks that are still running.
-
Pending tasks — the tasks that have not yet started their execution.
-
Processor class — the Hive processor for Tez that forms the vertices in Tez and processes the data.
The vertical lines that connect the two vertices indicate the dependency of a vertex on another vertex.
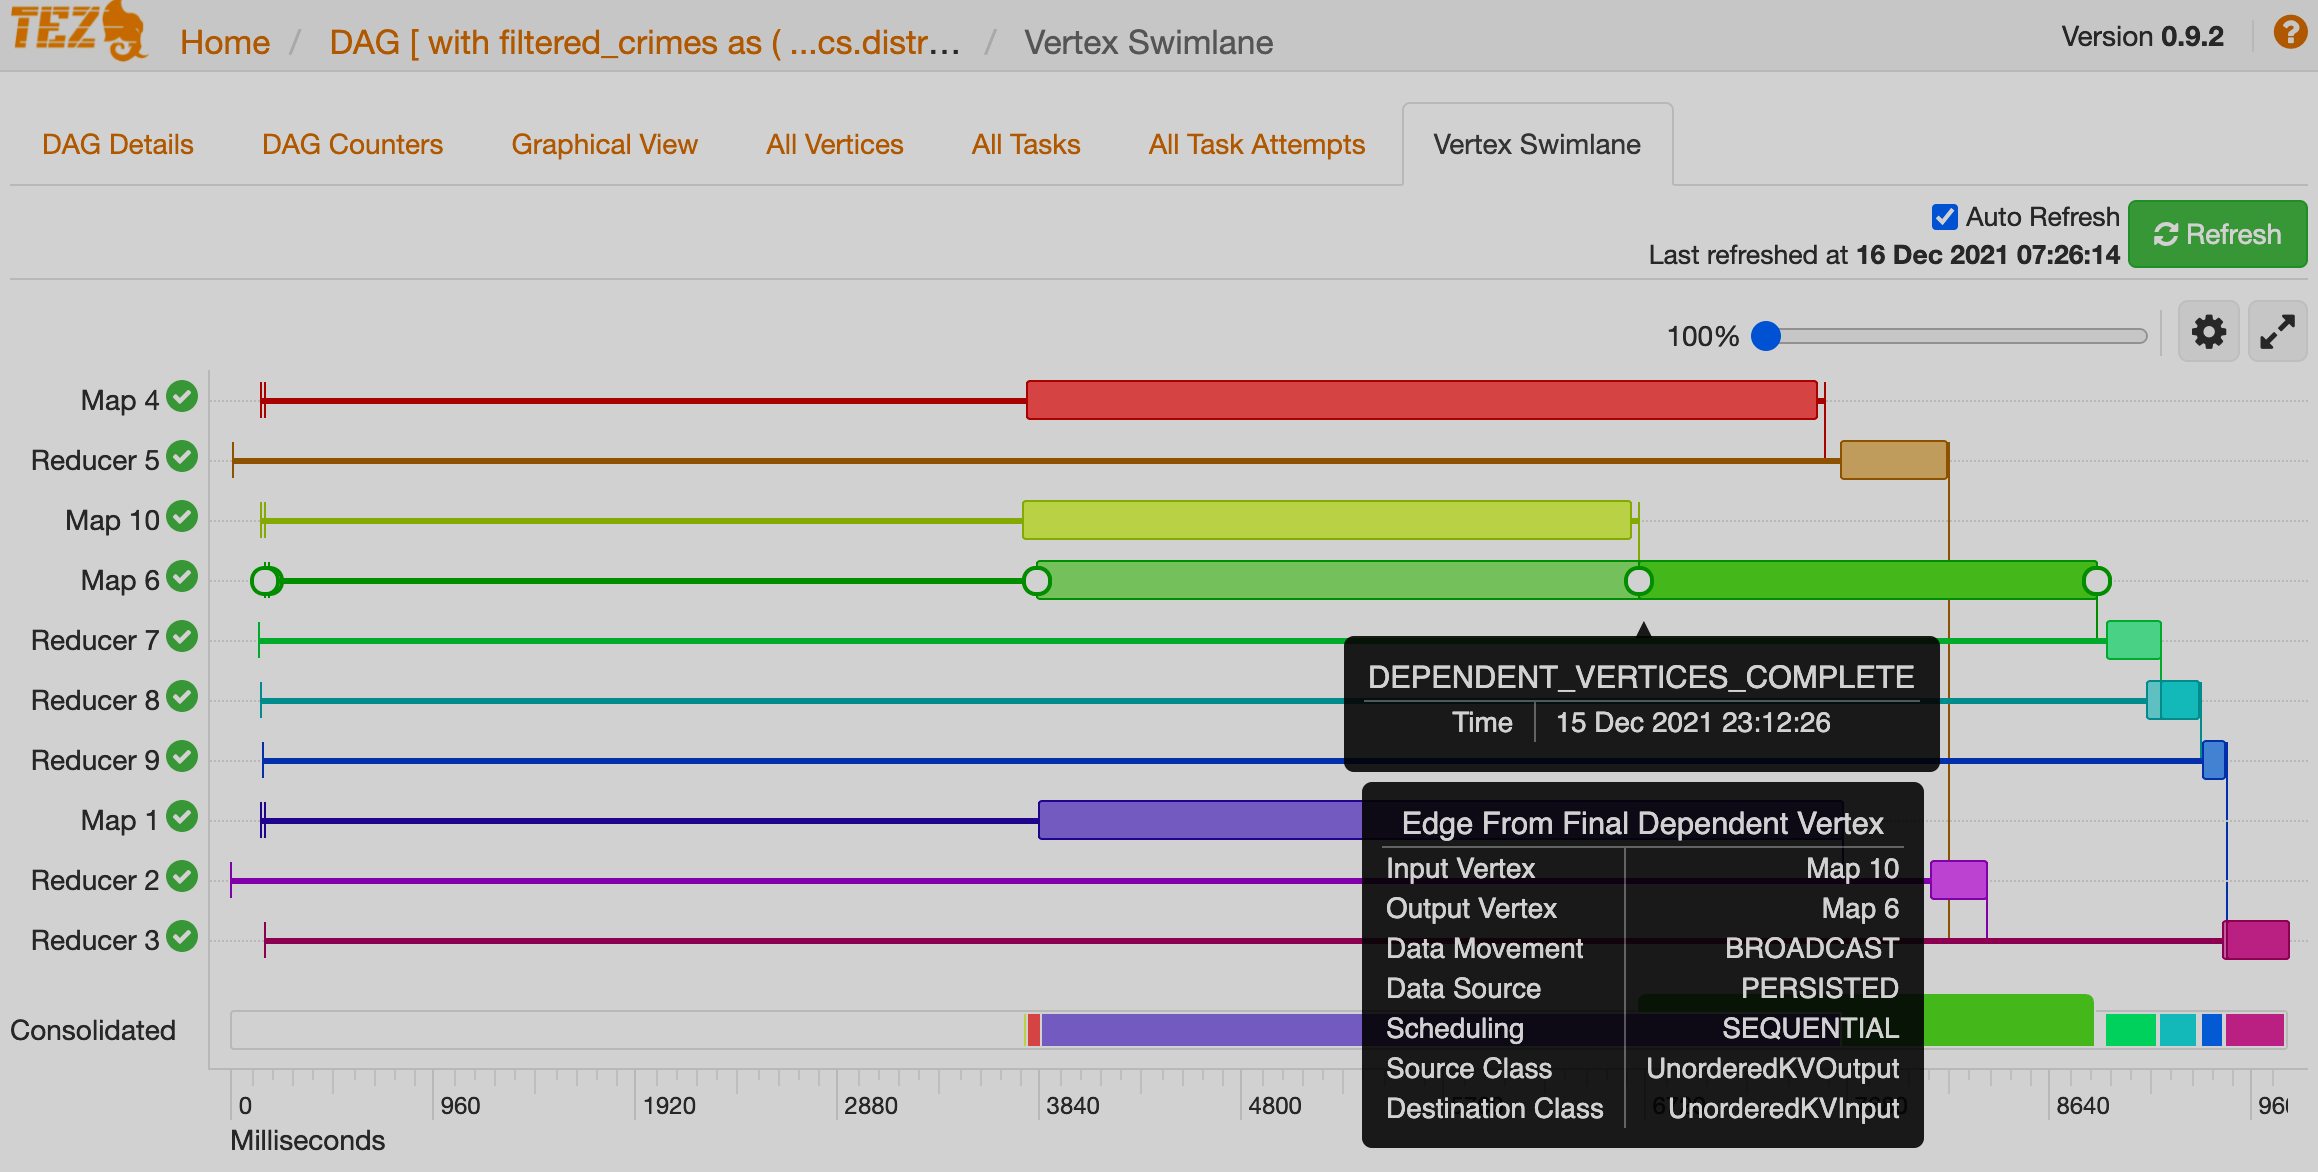
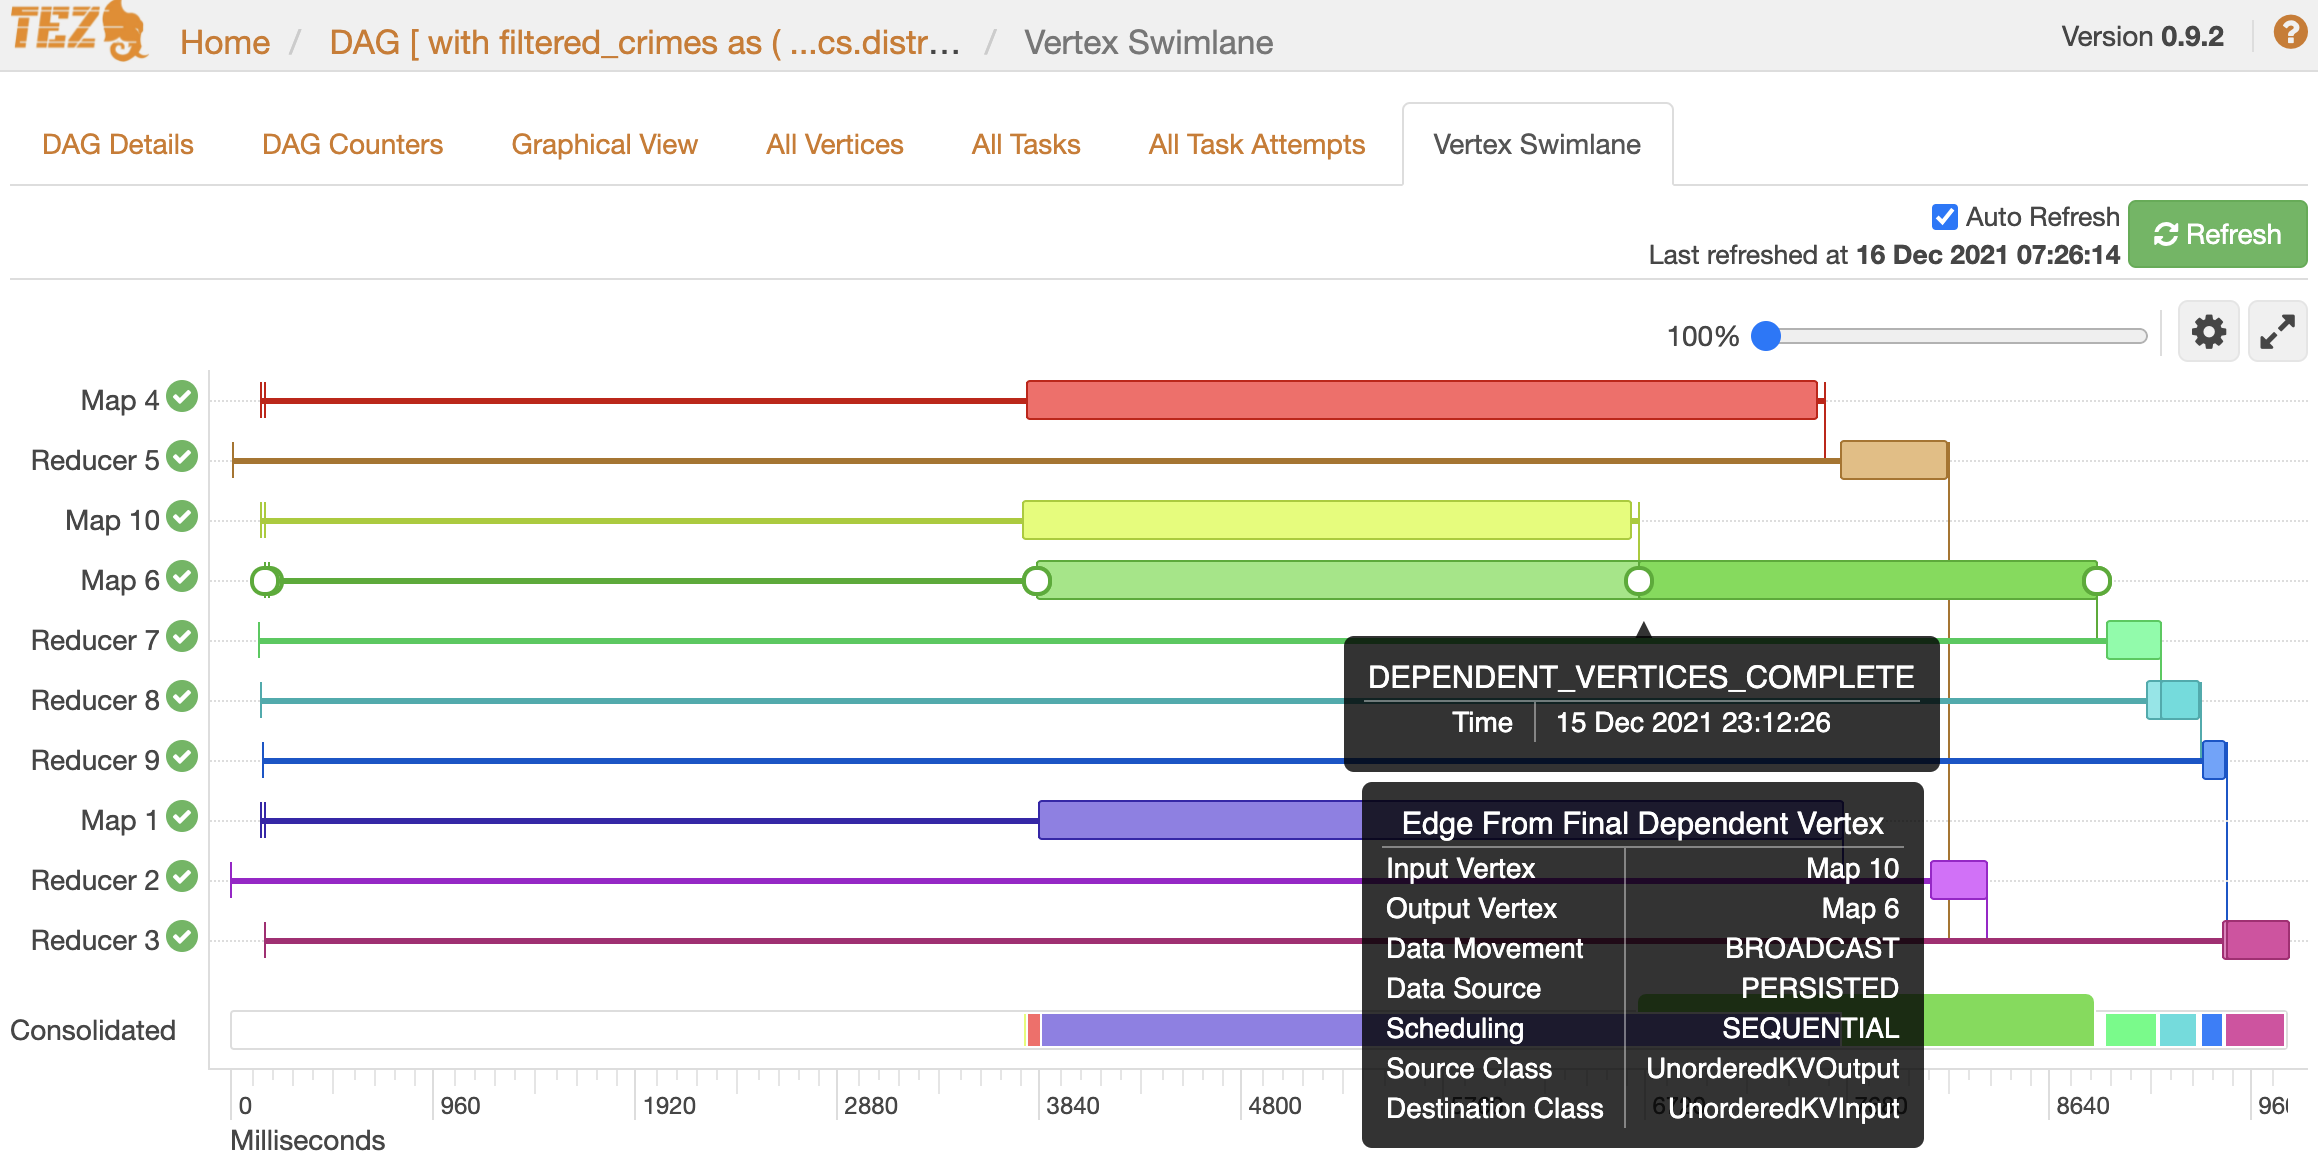
In this example, Map 6 depends on the results of Map 10.
Map 6 will finish its execution only when Map 10 ends its execution successfully.
Similarly, Reducer 8 depends on Reducer 7 to complete its execution.