Create a note using Python
This article shows how to create and run Python notes in Zeppelin.
By default, to execute a Python note, the Zeppelin service uses the Python interpreter available in $PATH.
You can change the Python instance to be used by Zeppelin by using the zeppelin.interpreter property.
For more information, see Specify a Python interpreter.
Specify a Python interpreter
Various operating systems come with different Python versions available in $PATH.
An OS may be bundled with Python 2.x, Python 3, or may not include Python at all, so you might want to configure Zeppelin to use a custom Python version.
For this, follow the steps:
-
Select the Interpreter item in the account menu placed in the top right corner of the Zeppelin home page.
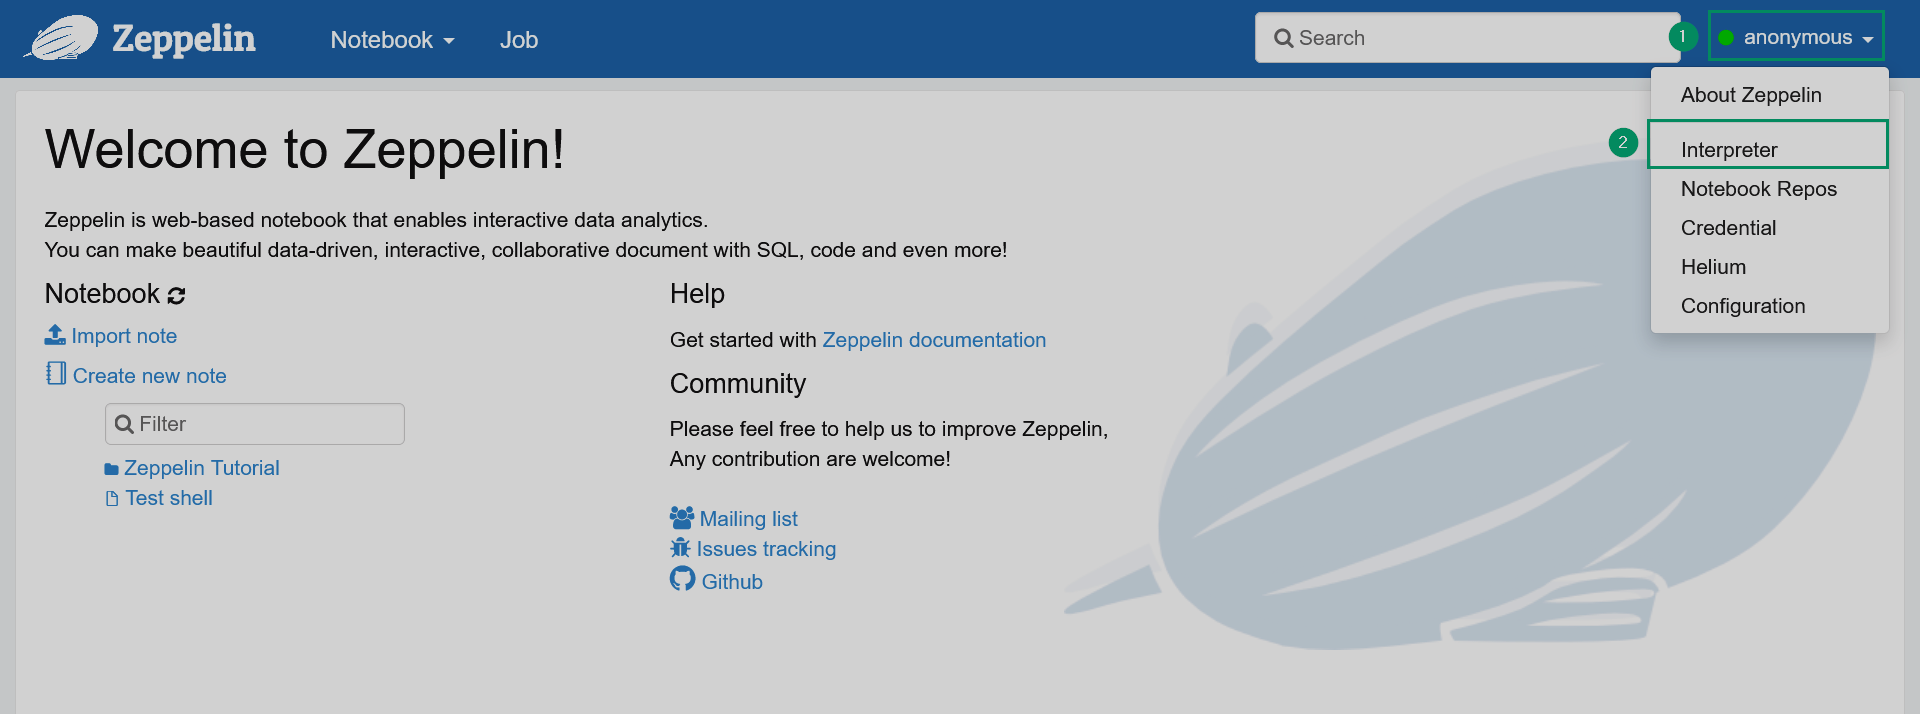 Switching to the list of interpreters
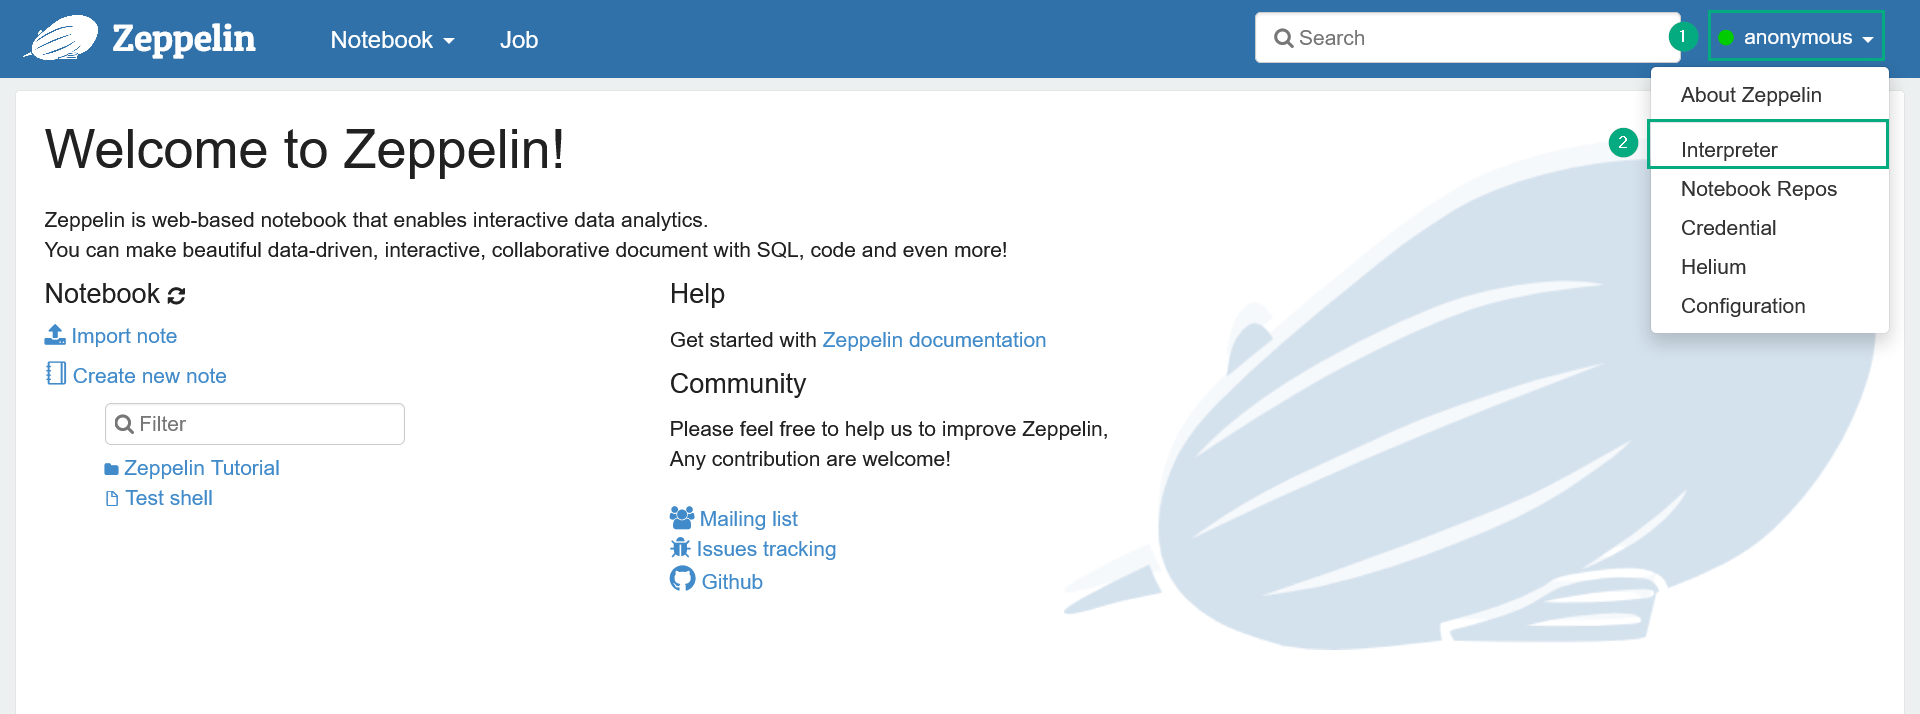 Switching to the list of interpreters
 -
Find the
pythoninterpreter and click Edit. -
Set the
zeppelin.pythonproperty to point to the desired Python binary.TIPThe Python interpreter distributed with ADH can be found in /opt/<python_env>. -
Save and restart the interpreter configuration.
-
Run a test note to ensure that Zeppelin uses the new Python instance:
%python

import sys
print(f"""Current note has been executed using:
    Python location: {sys.executable}
    Python version: {sys.version_info[0]}
    """)
Sample output:
Current note has been executed using:
    Python location: /opt/python3.10/bin/python3
    Python version: 3
Zeppelin interpreters for Python
Zeppelin comes with a built-in python interpreter group that includes a set of interpreters listed in the table below.
All the listed interpreters support Python 2 and Python 3.
| Interpreter | Class | Description |
|---|---|---|
%python |
PythonInterpreter |
A vanilla Python interpreter with basic dependencies. Requires only Python environment installed. Uses IPython features if the prerequisites are met |
%python.ipython |
IPythonInterpreter |
Provides a fancier Python environment based on IPython. It is the recommended interpreter for using Python in Zeppelin |
%python.sql |
PythonInterpreterPandasSql |
Provides SQL capabilities for querying Pandas DataFrames via |
Shared variables
This article assumes that Zeppelin’s python interpreter is used in the default shared binding mode, i.e. the interpreter is instantiated globally in the shared mode.
This means that Zeppelin creates a single JVM process with a single interpreter group to serve all Python notes.
As a result, variables declared in one note can be directly accessed in other notes.
Variable sharing also works between %python and %python.ipython notes.
Create and run a Python note
-
In the Zeppelin web UI, click the Create new note list item or click the main menu item Notebook → Create new note.
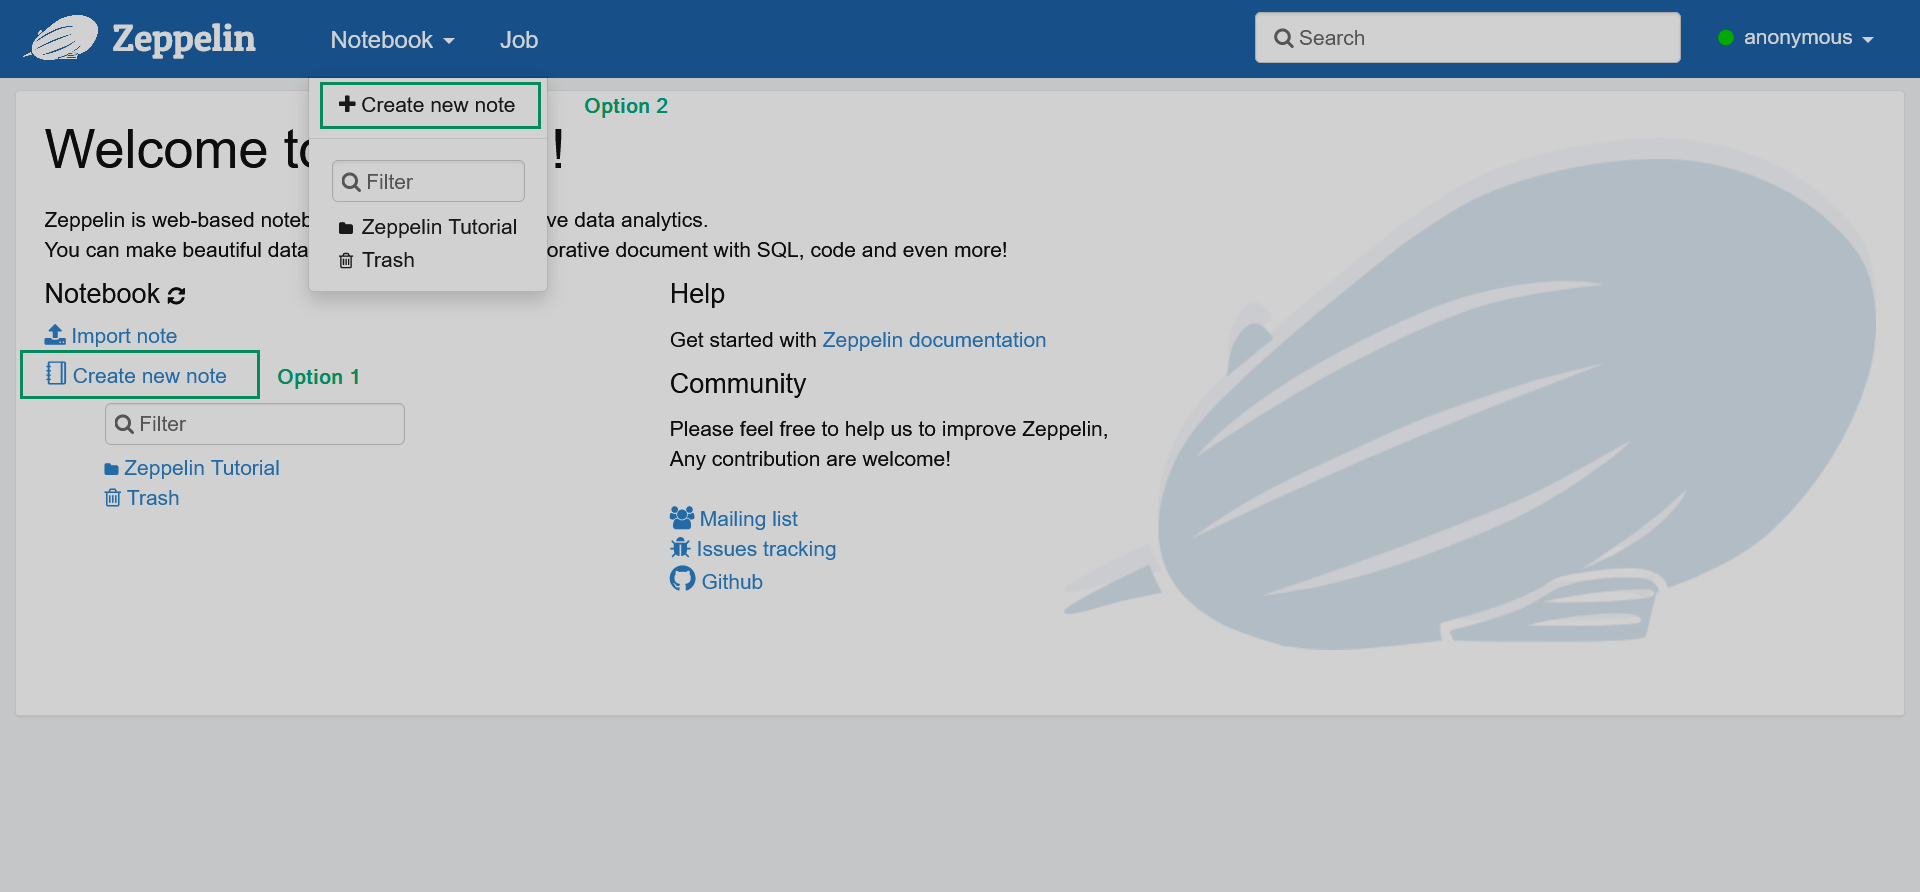 Adding a new note
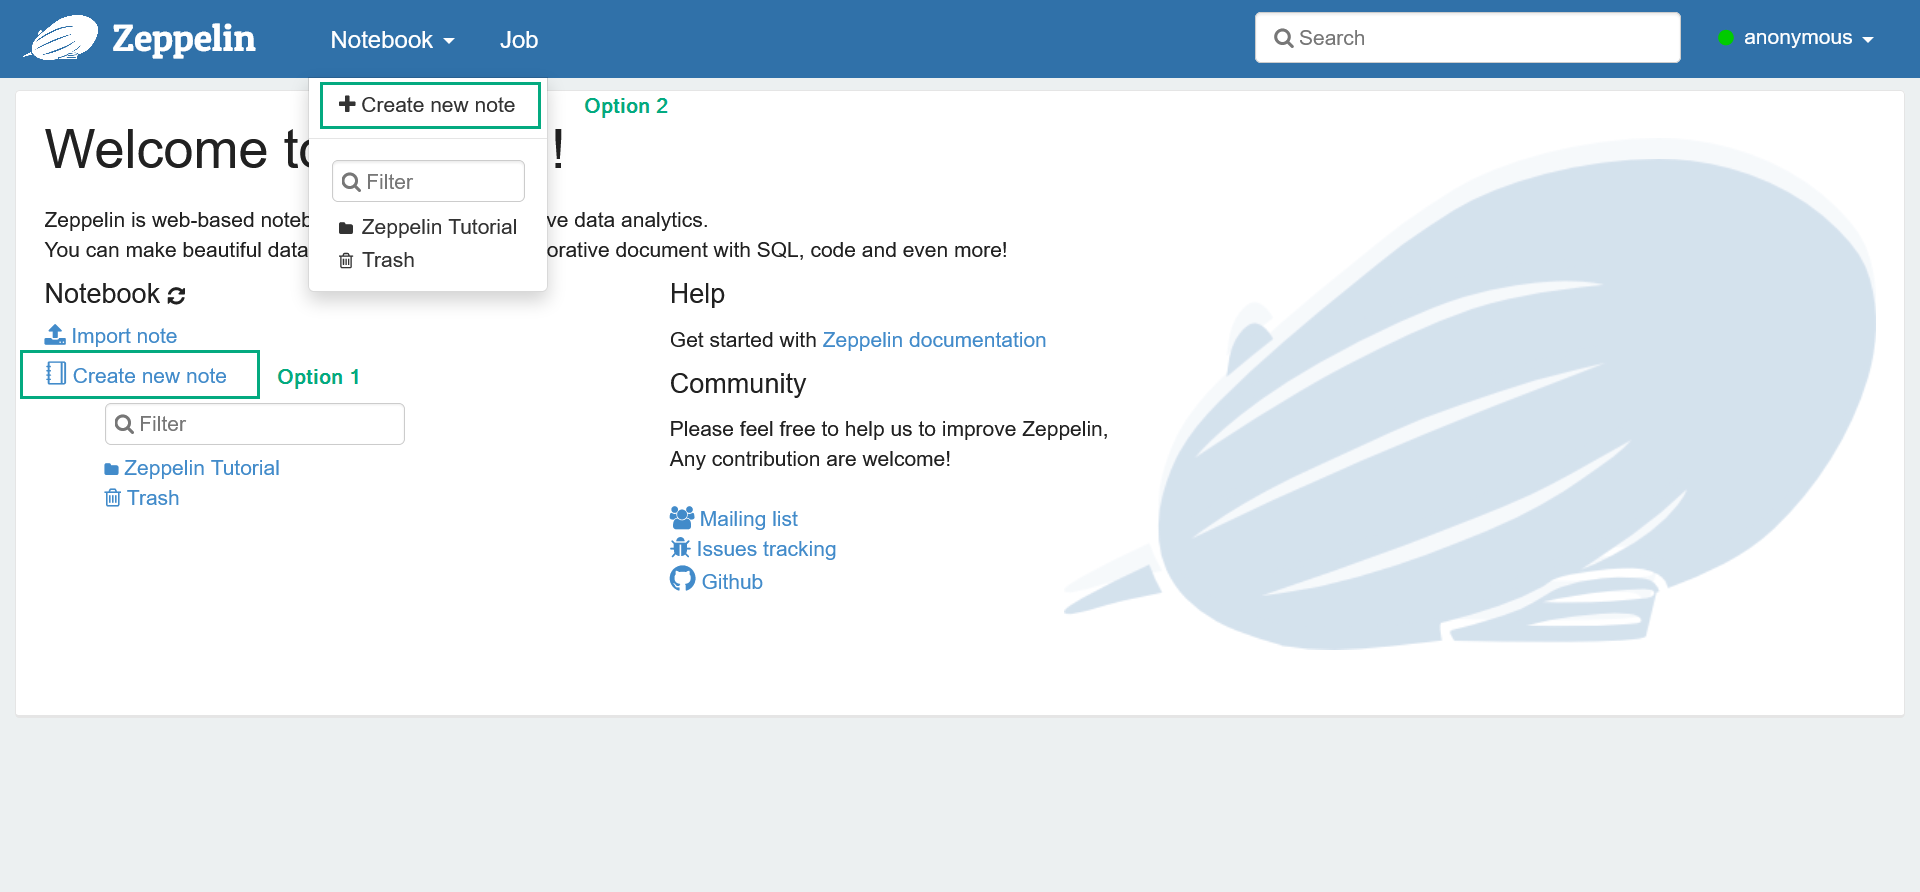 Adding a new note
 -
In the opened dialog, enter the note name and select the default interpreter that will be used in cases when the interpreter type is not specified explicitly. Notice that you can create different folders for your notes. Then, click Create.
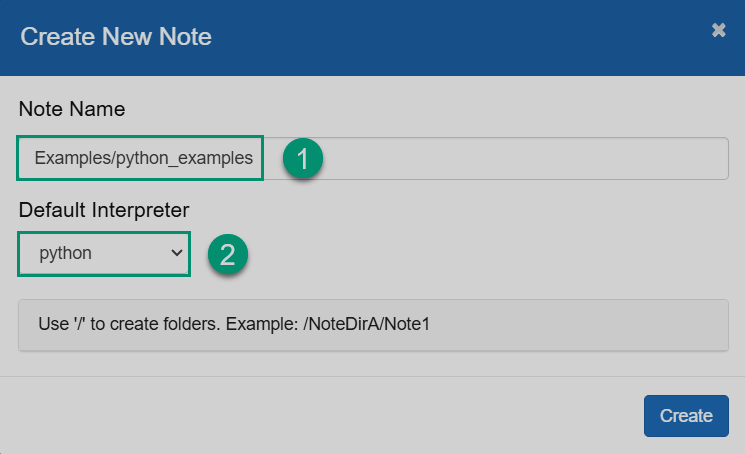 Create a new note
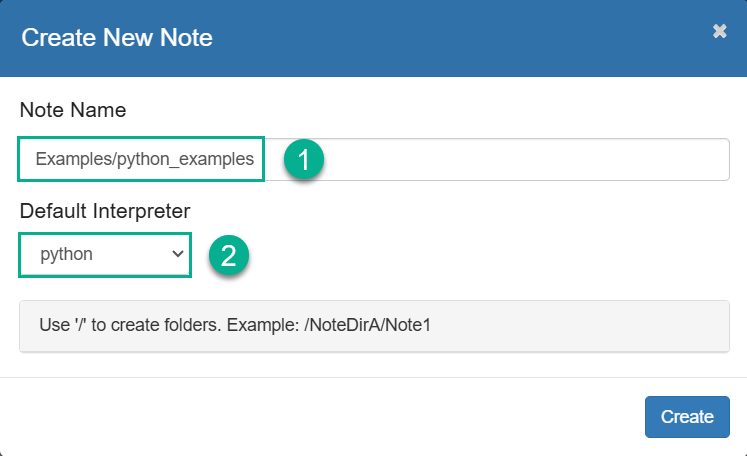 Create a new note
 -
Enter the Python code in a new paragraph and run the paragraph.
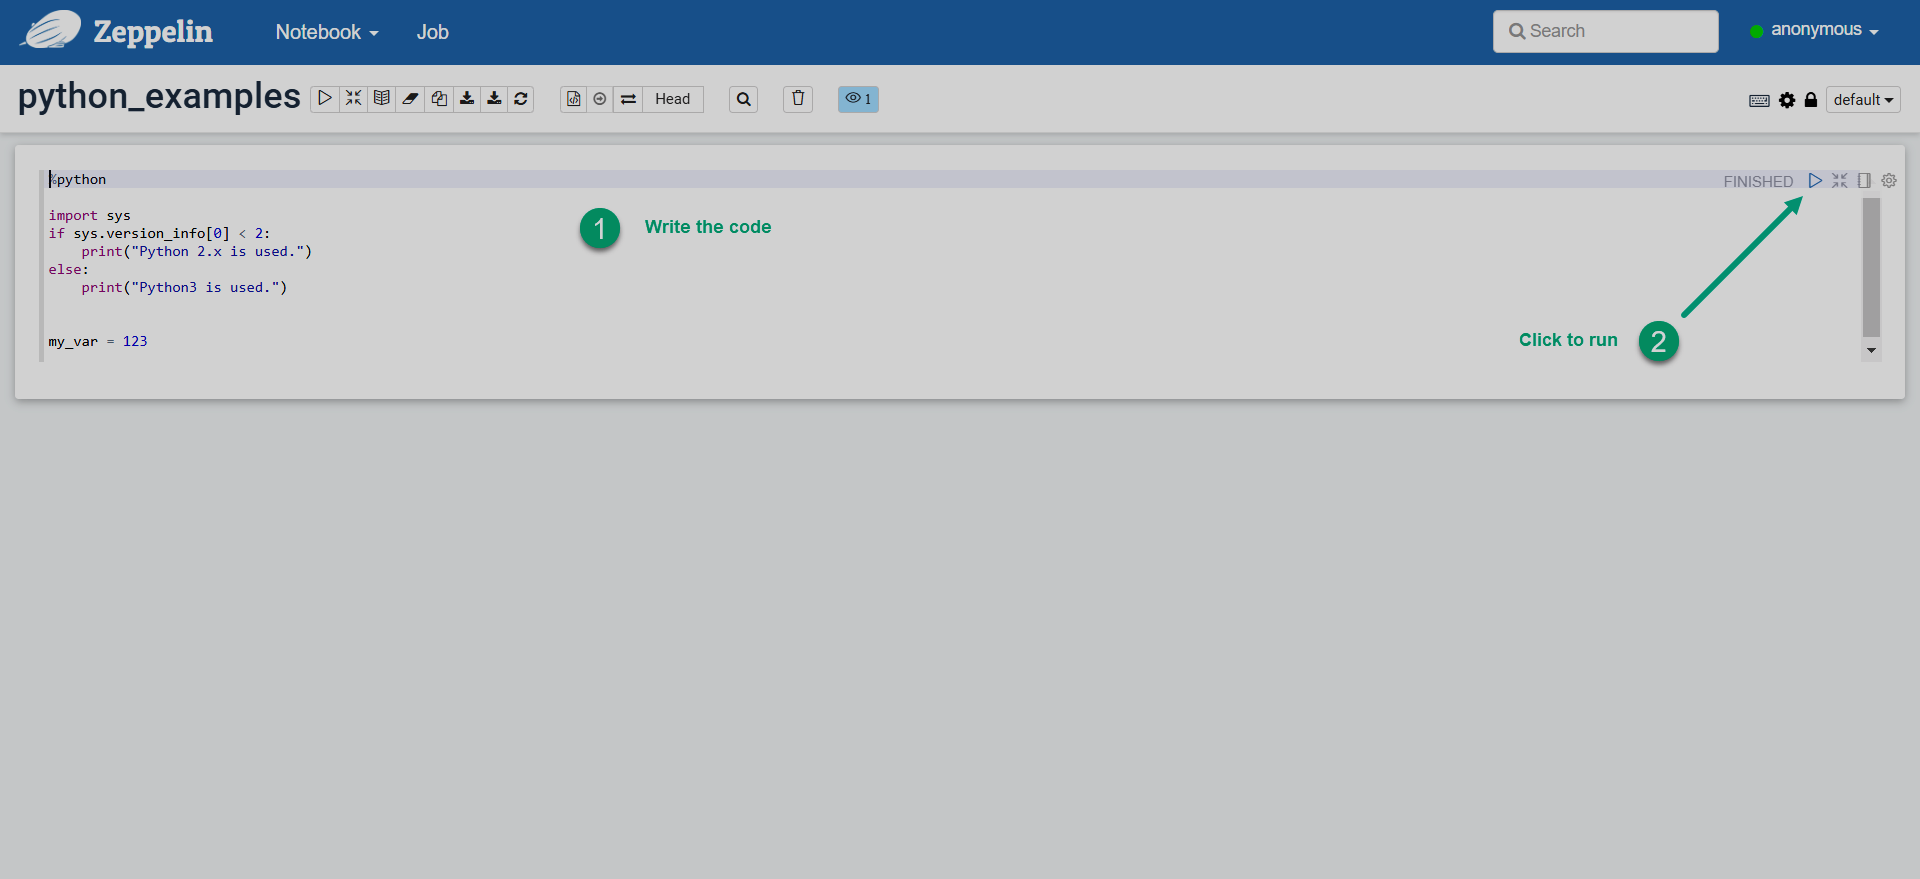 Run Python code in Zeppelin
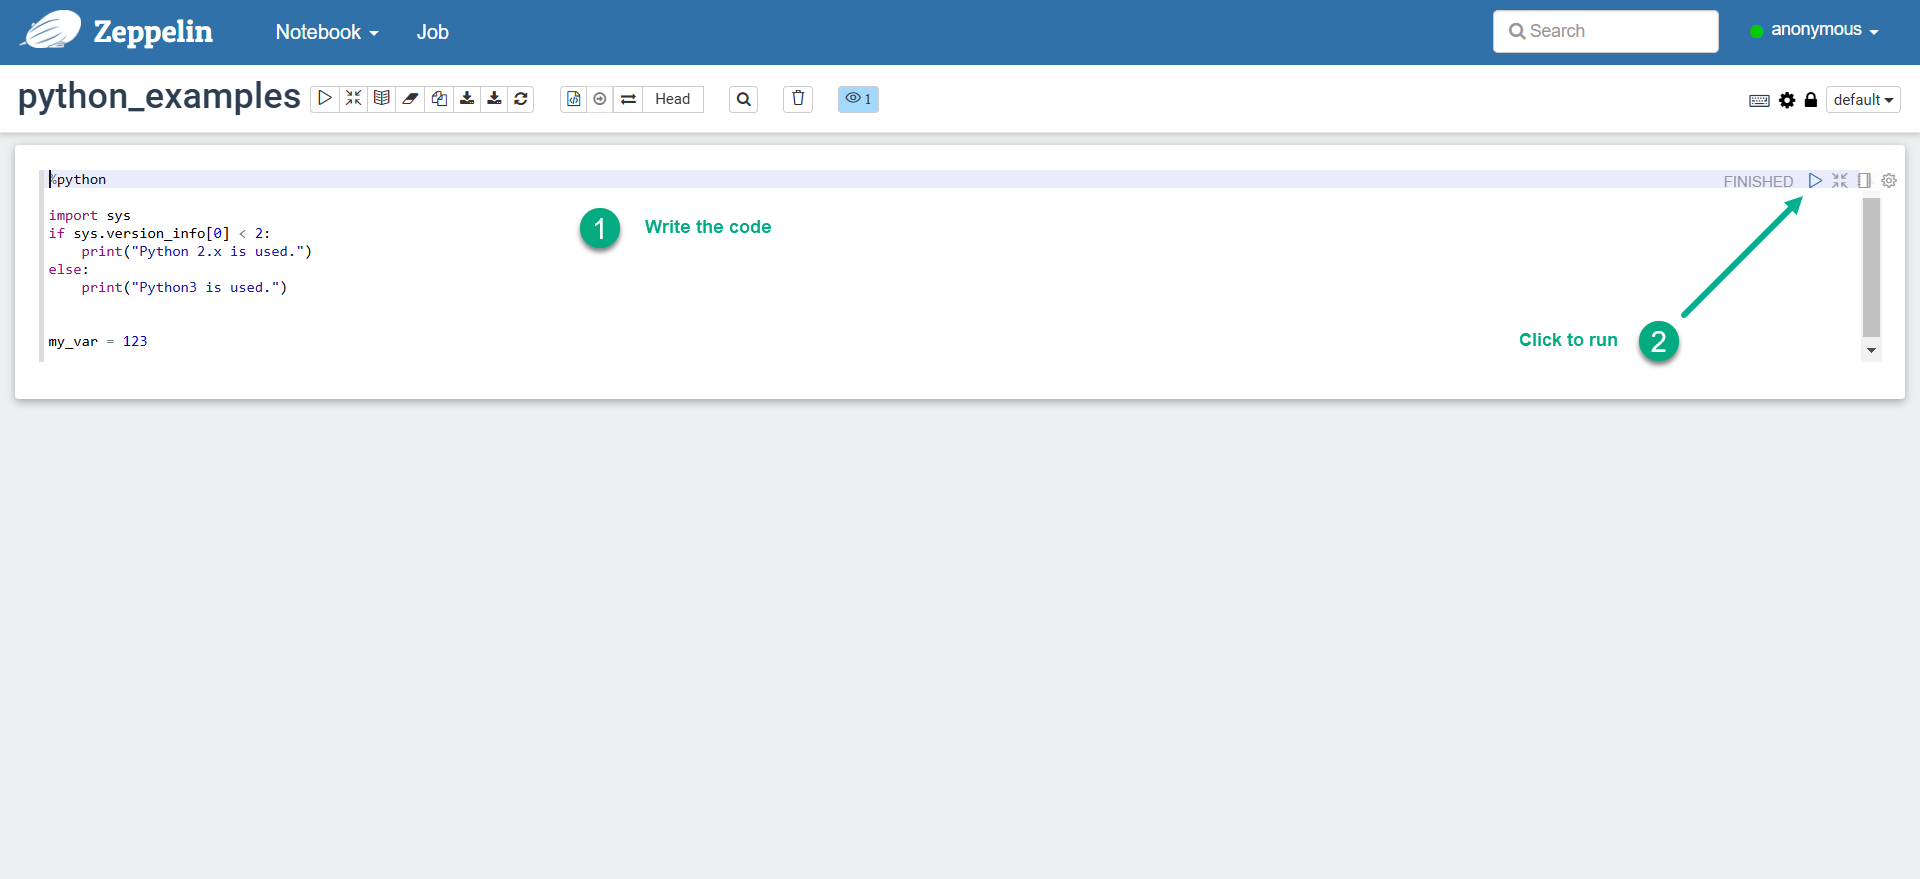 Run Python code in Zeppelin
The examples of Python notes are provided below. All the notes are available in the .zpln archive, which you can import to Zeppelin (Zeppelin → Import Note). For more examples, explore the Zeppelin tutorial (Notebook → Python Tutorial).
Python (%python)
To use the vanilla Python interpreter for running a Zeppelin note, specify %python on the first line of the paragraph.
Use %python if you need a simple Python execution environment with no extra dependencies.
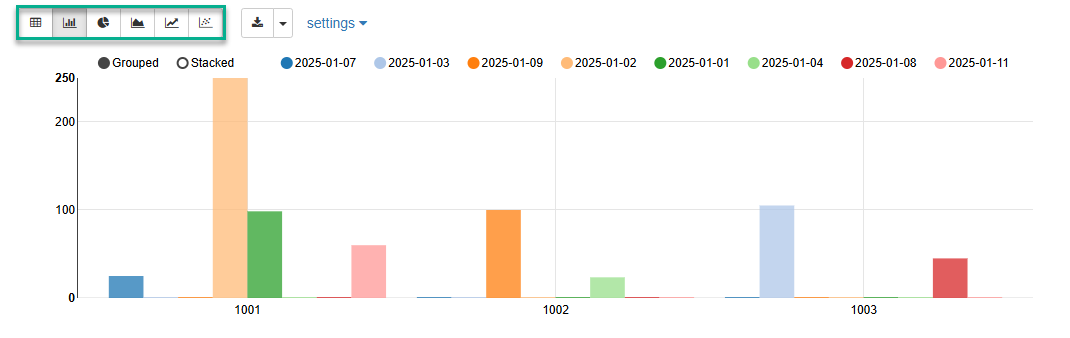
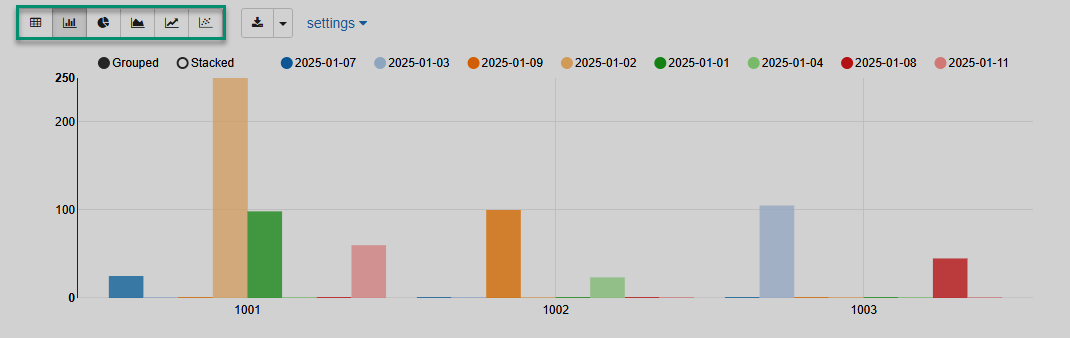
The following sample note shows basic Pandas DataFrame usage with Zeppelin built-in visualization.
%python (1)
import pandas as pd (2)

txn_data = {'acc_id': [1001,1003,1002,1001,1001,1002,1003,1001,1003],
        'txn_value': [25.00, 30.00, 100.00, 250.00, 98.50, 23.50, 45.00, 60.00, 75.15],
        'txn_date': ['2025-01-07', '2025-01-03', '2025-01-09', '2025-01-02', '2025-01-01', '2025-01-04', '2025-01-08', '2025-01-11', '2025-01-03']}
df = pd.DataFrame(txn_data) (3)
z.show(df) (4)| 1 | Specifies the vanilla Python interpreter. |
| 2 | Before running the note, imported modules must be installed via pip install <module_name>. |
| 3 | Creates a Pandas DataFrame. |
| 4 | Renders the DataFrame using built-in Zeppelin widgets. For more visualization examples, see IPython examples below. |
The note execution results are shown below.
IPython (%python.ipython)
IPython (%python.ipython) is a Jupyter-like, IPython-based interpreter that provides a rich environment for interactive computing, such as:
-
Better tab completion, syntax and output highlighting.
-
Built-in magic functions like
%timeit,%matplotlib inline, etc. -
Advanced visualization via third-party libraries like Seaborn, Plotly, Bokeh, etc.
To use the %python.ipython interpreter, install the following modules to the Python instance used by Zeppelin:
-
jupyter-client -
ipython -
ipykernel -
grpcio -
protobufNOTEDepending on the Python version used by Zeppelin, one may observe conflicts while installing the latestprotobufpackage. A workaround for this is downgrading or installing an olderprotobufversion. For example, as of Python 3.10 used in this article,protobuf3.19.6 has been verified to work properly.
To use IPython features, specify %python.ipython on the first line of the paragraph.
Example:
%python.ipython (1)

import pandas as pd

data = {
    'full_name': ['Sarah Connor',
        'Kirk Hammett',
        'Ivan Ivanov'],
    'age': [25, 30, 35],
    'dep': ['it', 'sales', 'hr']}
df = pd.DataFrame(data) (2)
print(" Describe DF:".center(50, "*"))
print(df.describe())
print(" DF types: ".center(50, "*"))
print(df.dtypes)
print(" Filter DF: ".center(50, "*"))
df1 = df[df['age'] > 30]
print(df1)
print(" Add column to DF: ".center(50, "*"))
df['salary'] = [100000, 200000, 300000]
print(df)
print(" Magic functions: ".center(50, "*"))
range? (3)
%timeit range(100) (4)| 1 | Explicitly specifies the IPython interpreter. |
| 2 | Creates a Pandas DataFrame with further operations on it. |
| 3 | IPython’s magic function that displays the method’s help. |
| 4 | IPython’s magic function for benchmarking the method execution. |
****************** Describe DF:*******************
        age
count   3.0
mean   30.0
std     5.0
min    25.0
25%    27.5
50%    30.0
75%    32.5
max    35.0
******************* DF types: ********************
full_name    object
age           int64
dep          object
dtype: object
******************* Filter DF: *******************
     full_name  age dep
2  Ivan Ivanov   35  hr
*************** Add column to DF: ****************
      full_name  age    dep  salary
0  Sarah Connor   25     it  100000
1  Kirk Hammett   30  sales  200000
2   Ivan Ivanov   35     hr  300000
**************** Magic functions: ****************
108 ns ± 0.816 ns per loop (mean ± std. dev. of 7 runs, 10,000,000 loops each)
Init signature: range(self, /, *args, **kwargs)
Docstring:
range(stop) -> range object
range(start, stop[, step]) -> range object

Return an object that produces a sequence of integers from start (inclusive)
to stop (exclusive) by step.  range(i, j) produces i, i+1, i+2, ..., j-1.
start defaults to 0, and stop is omitted!  range(4) produces 0, 1, 2, 3.
These are exactly the valid indices for a list of 4 elements.
When step is given, it specifies the increment (or decrement).
Type:           type
Subclasses:
Below are examples of visualizing data in Zeppelin using various Python libraries.
To run the sample note below, install Matplotlib to the Python instance used by Zeppelin. For example:
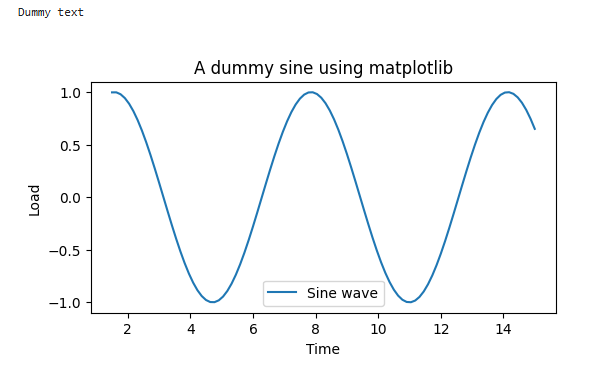
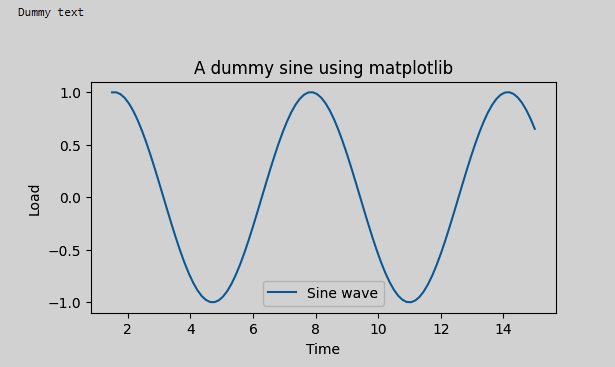
$ /opt/python3.10/bin/python3 -m pip install matplotlibSample note:
%python.ipython (1)

import sys
import numpy as np (2)
import matplotlib.pyplot as plt

print("Dummy text")

plt.figure(figsize=(6, 3))
x = np.linspace(1.5, 15, 100)
y = np.sin(x)
plt.plot(x, y, label="Sine wave")
plt.xlabel("Time")
plt.ylabel("Load")
plt.title("A dummy sine using matplotlib")
plt.legend()
plt.show() (3)| 1 | Explicitly specifies the IPython interpreter. |
| 2 | Before running the note, imported modules must be installed via pip install <module_name>. |
| 3 | Renders a plot using the matplotlib library. |
The resulting plot is below.
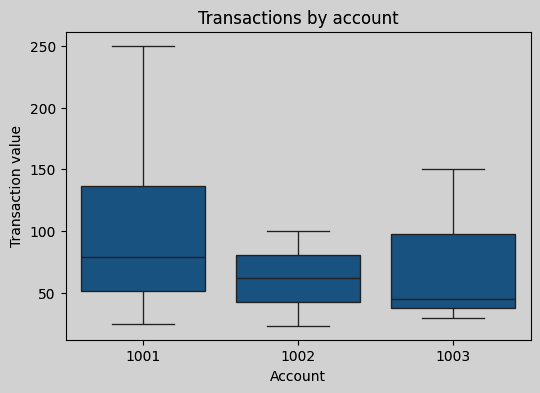
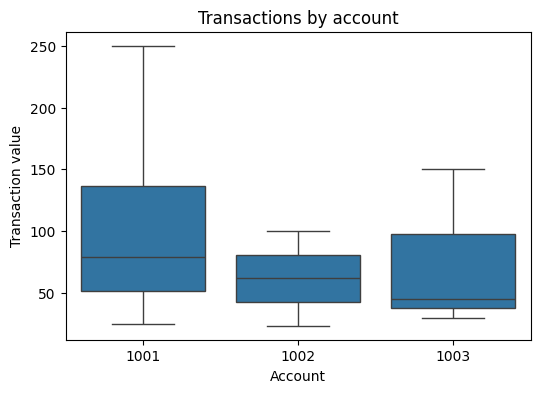
To run the sample note below, install Seaborn to the Python instance used by Zeppelin. For example:
$ /opt/python3.10/bin/python3 -m pip install seabornSample note:
%python.ipython (1)
%matplotlib inline (2)

import seaborn as sns (3)
import matplotlib.pyplot as plt
import pandas as pd

txn_data = {'acc_id': [1001,1003,1002,1001,1001,1002,1003,1001,1003],
        'txn_value': [25.00, 30.00, 100.00, 250.00, 98.50, 23.50, 45.00, 60.00, 150.15],
        'txn_date': ['2025-01-07', '2025-01-03', '2025-01-09', '2025-01-02', '2025-01-01', '2025-01-04', '2025-01-08', '2025-01-11', '2025-01-03']}
df = pd.DataFrame(txn_data)
plt.figure(figsize=(6, 4))
sns.boxplot(y='txn_value', x='acc_id', data=df) (4)
plt.title("Transactions by account")
plt.xlabel("Account")
plt.ylabel("Transaction value")
plt.show()| 1 | Explicitly specifies the IPython interpreter. |
| 2 | IPython’s magic command that ensures that the rendered plot is displayed directly inline within the notebook. |
| 3 | Before running the note, imported modules must be installed via pip install <module_name>. |
| 4 | Generates a plot using the seaborn library. |
The resulting plot is shown below.
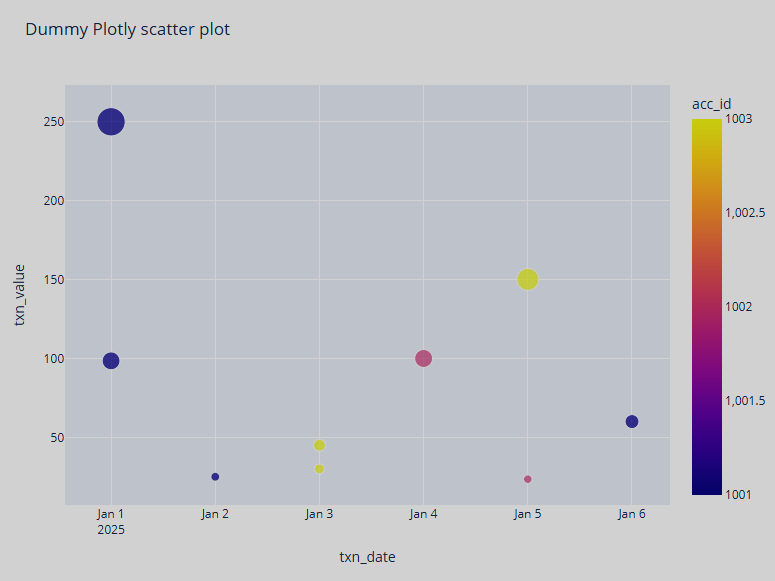
To use Plotly for visualizing data in Zeppelin, install the following modules to the Python instance used by Zeppelin.
$ /opt/python3.10/bin/python3 -m pip install plotly
$ /opt/python3.10/bin/python3 -m pip install nbformat
Sample note:
%python.ipython (1)
%matplotlib inline (2)

import plotly.express as px (3)
import matplotlib.pyplot as plt (3)
import pandas as pd (3)

txn_data = {'acc_id': [1001,1003,1002,1001,1001,1002,1003,1001,1003],
        'txn_value': [25.00, 30.00, 100.00, 250.00, 98.50, 23.50, 45.00, 60.00, 150.15],
        'txn_date': ['2025-01-02', '2025-01-03', '2025-01-04', '2025-01-01', '2025-01-01', '2025-01-05', '2025-01-03', '2025-01-06', '2025-01-05']}
df = pd.DataFrame(txn_data)
fig = px.scatter(df, (4)
                x='txn_date',
                y='txn_value',
                color='acc_id',
                size="txn_value",
                title="Dummy Plotly scatter chart")
fig.update_layout(width=800, height=600)
fig.show()| 1 | Explicitly specifies the IPython interpreter. |
| 2 | IPython’s magic command that ensures that the rendered plot is displayed directly inline within the notebook itself. |
| 3 | Before running the note, imported modules must be installed via pip install <module_name>. |
| 4 | Renders a plot using the Plotly library. |
The resulting plot is shown below.
SQL over Pandas DataFrames (%python.sql)
By using the %python.sql interpreter, you can use SQL to query Pandas DataFrames and visualize their content.
This interpreter requires installation of the following pip modules:
-
pandas -
pandasql
Example note:
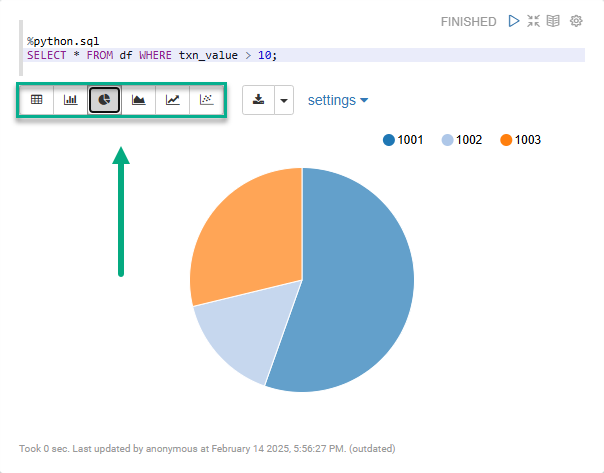
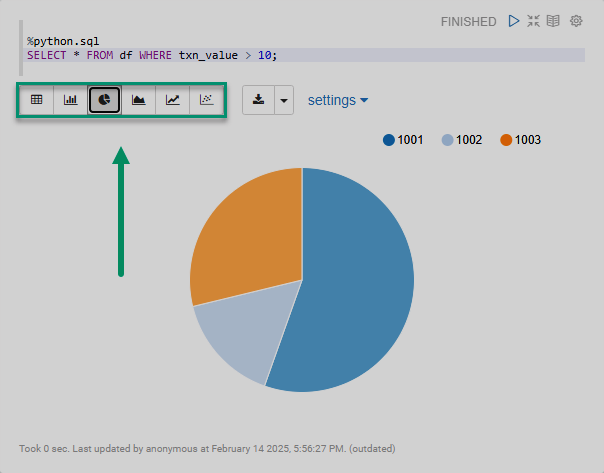
%python.sql (1)
SELECT * FROM df WHERE txn_value > 100; (2)| 1 | Specifies the interpreter for handling SQL over Pandas DataFrames. |
| 2 | The df DataFrame must be created before running the query (in another Zeppelin paragraph). |
Specifying %spark.sql on the first line of a paragraph enables the built-in Zeppelin visualization widgets.
You can switch between several widgets to visualize the results on a pie chart, line graph, etc.