Trino UI overview
The Trino service has a web user interface (UI) that allows you to view and control the execution of the queries ran against the databases located in the Trino cluster.
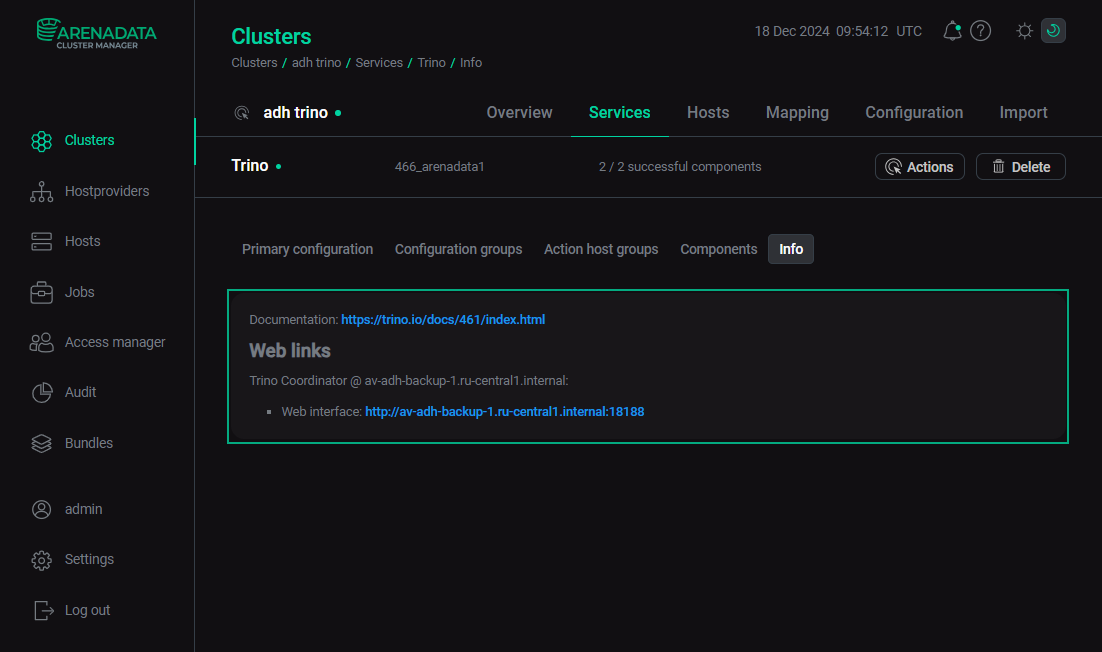
You can find the link to the Trino UI on the Info tab of the Trino service in the ADCM UI.
Cluster overview
The start page of the Trino UI is the Cluster overview page. On the top of it, you can see the following details:
-
Version — version name of the installed Trino distribution.
-
Environment — name of the environment in which the current Trino cluster is working.
-
Uptime — time of the continuous functioning of the Trino Coordinator component.
-
Log out — button that allows you to log out of the UI.
Below that there is a dashboard with a number of gauges.
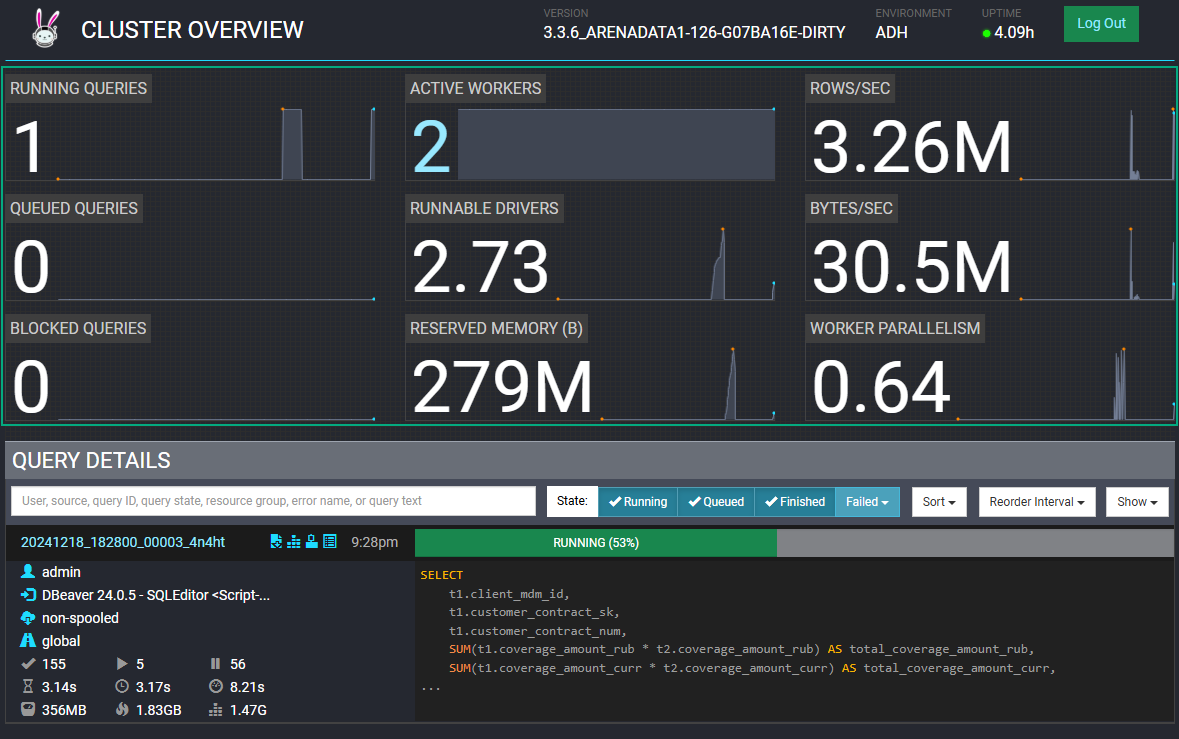
Designation of the gauges:
-
Running queries — number of queries currently underway.
-
Active workers — number of Trino workers engaged in execution of the running queries.
-
Rows/sec — number of table rows being processed per second at the current moment.
-
Queued queries — number of queries waiting in the queue.
-
Runnable drivers — number of runnable drivers at the current moment.
-
Bytes/sec — amount of data being processed per second at the current moment.
-
Blocked queries — number of queries prevented from execution.
-
Reserved memory — amount of Trino Java virtual machine (JVM) memory reserved for the currently running queries.
-
Worker parallelism — measure of effectivenes of using multiple workers at the current moment.
Under the dashboard there is the Query details pane. You can view the statistics on all kind of queries. Also, you can search, filter, and sort the list of queries by various criteria.

In the input field, you can search for queries by the following properties:
-
username that executed the query;
-
source of the query;
-
ID of the query;
-
state of the query;
-
resource group of the query;
-
name of the error with which the query has terminated;
-
text of the query.
To the right of the search field there are the filter and sort controls. To view the running, queued, or successfully finished queries in the list, click the corresponding toggle buttons. The Failed drop-down list combines the toggles for the queries that finished unsuccessfully for different reasons: internal or external error, resources error, or user error. Using the Show drop-down list, you can choose how many queries to display. The Sort drop-down list allows you to sort the list by various parameters. Finally, using the Reorder interval control, you can set the refresh frequency for the list or disable it.
Below that begins the list of queries. Each query entry displays basic details of that query.
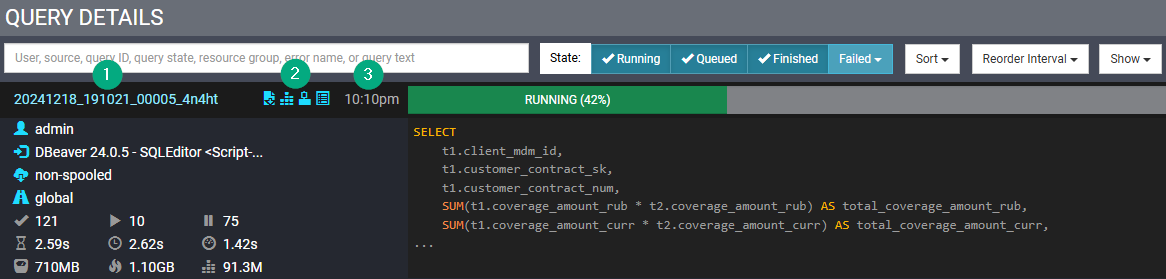
The top left heading contains the following details:
| 1 | Query ID — the ID of the query. Clicking on it will open the Overview tab of the Query details page. |
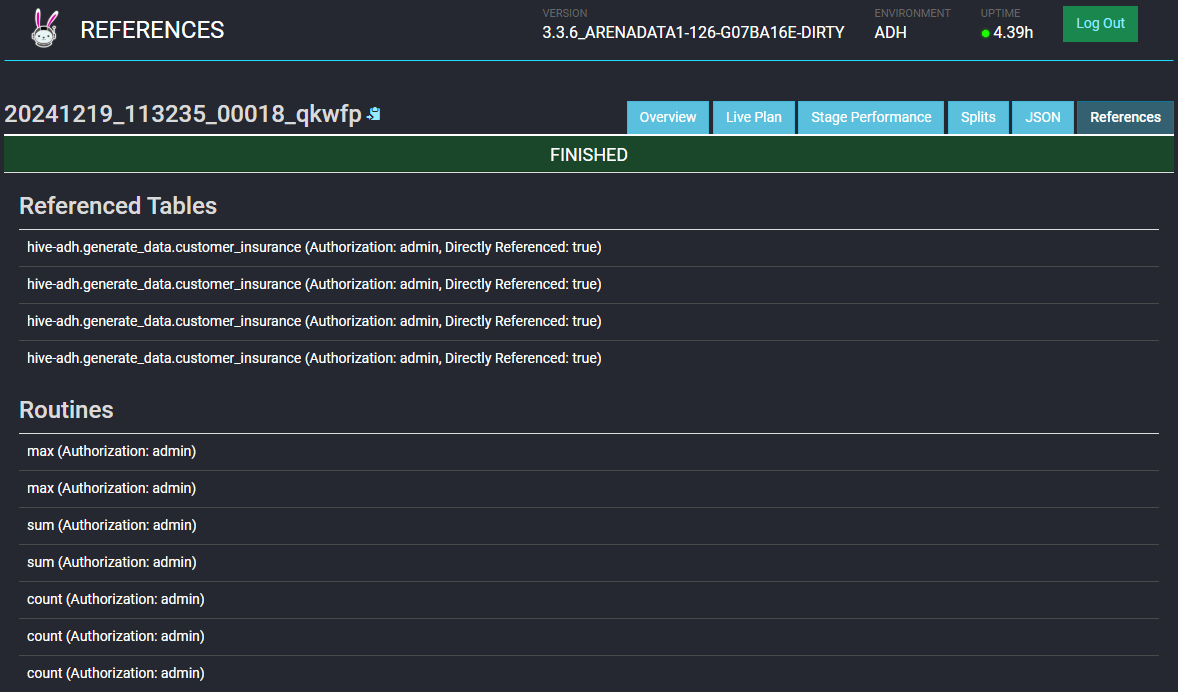
| 2 | Query JSON, Stage performance, Query plan, and References icons — clicking on them is equivalent to clicking on the tabs with the same name on the Query details page. |
| 3 | Submit time — time when the query was submitted for execution. |
Below the heading the following information is compiled:
-
username that executed the query;
-
source of the query;
-
protocol encoding;
-
resource group of the query;
-
numbers of completed, running, and queued splits;
-
wall time spent executing the query excluding the queue time;
-
total query wall time;
-
CPU time spent by the query execution;
-
current total reserved memory;
-
peak total reserved memory;
-
cumulative user memory.
In the right part of the query entry, you can view the query execution progress status or its resolution, depending whether it is still running or already finished. Also, the text of the query (or its beginning) is listed here.
Query details
The Query details page can be opened by clicking the query ID on the Cluster overview page. It contains several tabs described below.
Overview
The Overview tab contains the general details of the query.
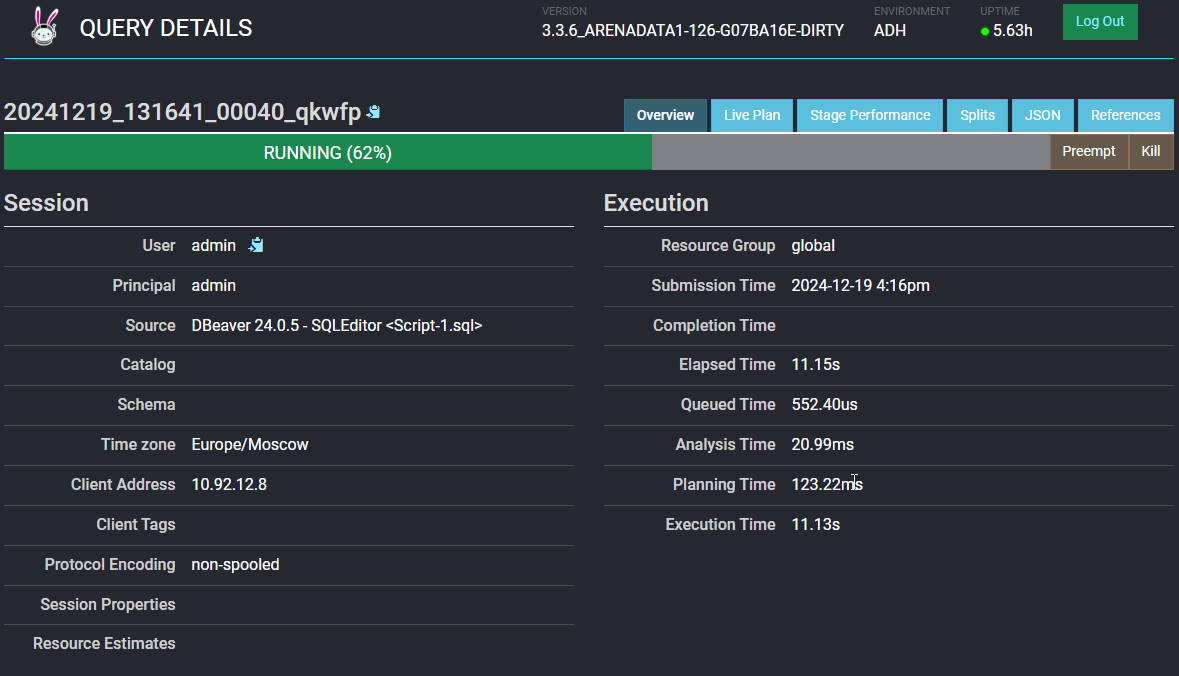
Here you can preempt or kill the query execution if it is still running, and find the detailed information on the following aspects of the query:
-
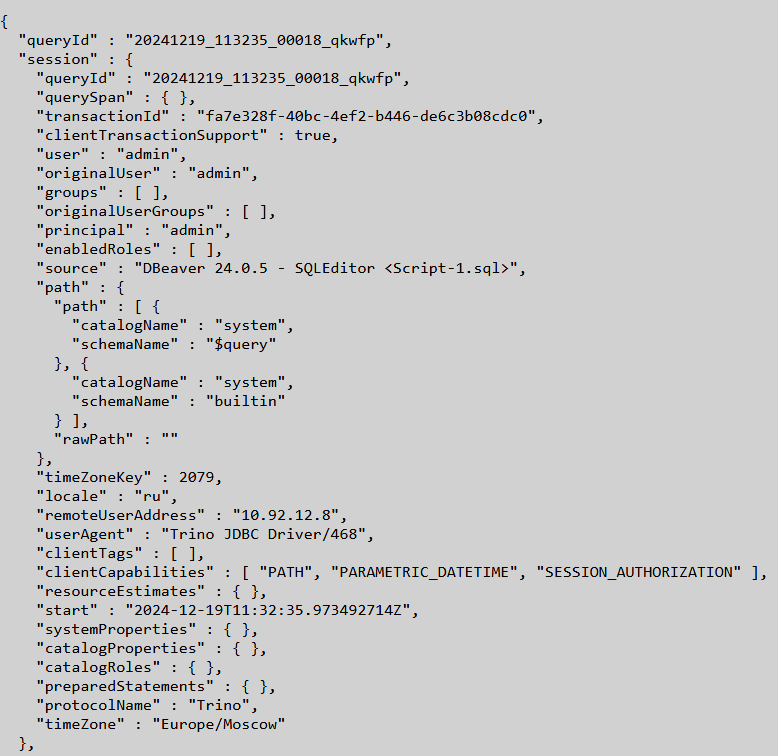
Session — user, source, location, and others.
-
Execution — various timings of the query.
-
Resource utilization summary — statistics of resource usage while running the query.
-
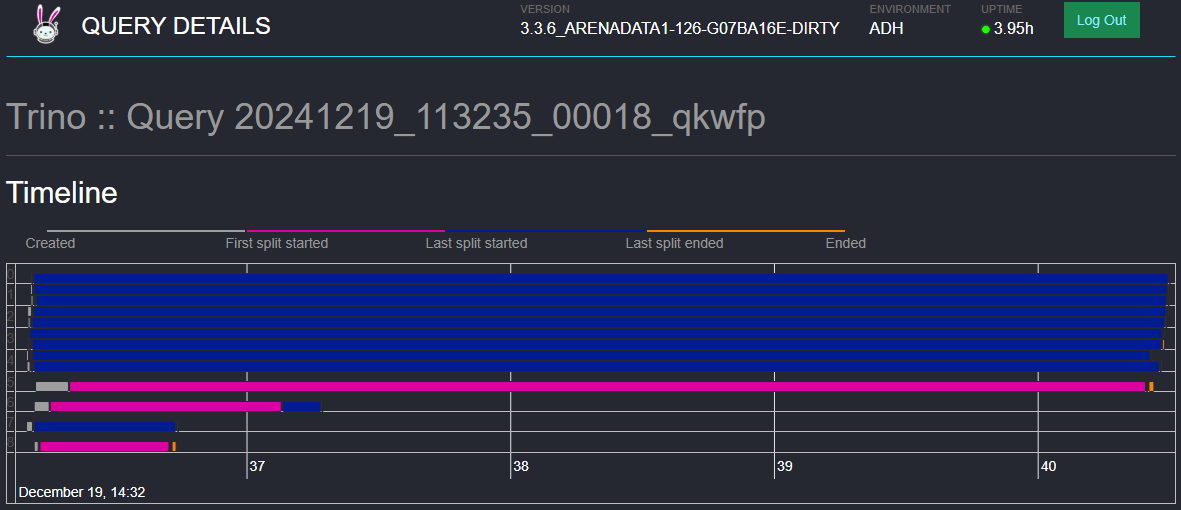
Timeline — statistics of query execution metrics in terms of the timeline.
-
Error information — error type and code, and the listing of the stack trace.
In the bottom of this tab, you also can see the full query text and the list of detailed query execution stages.
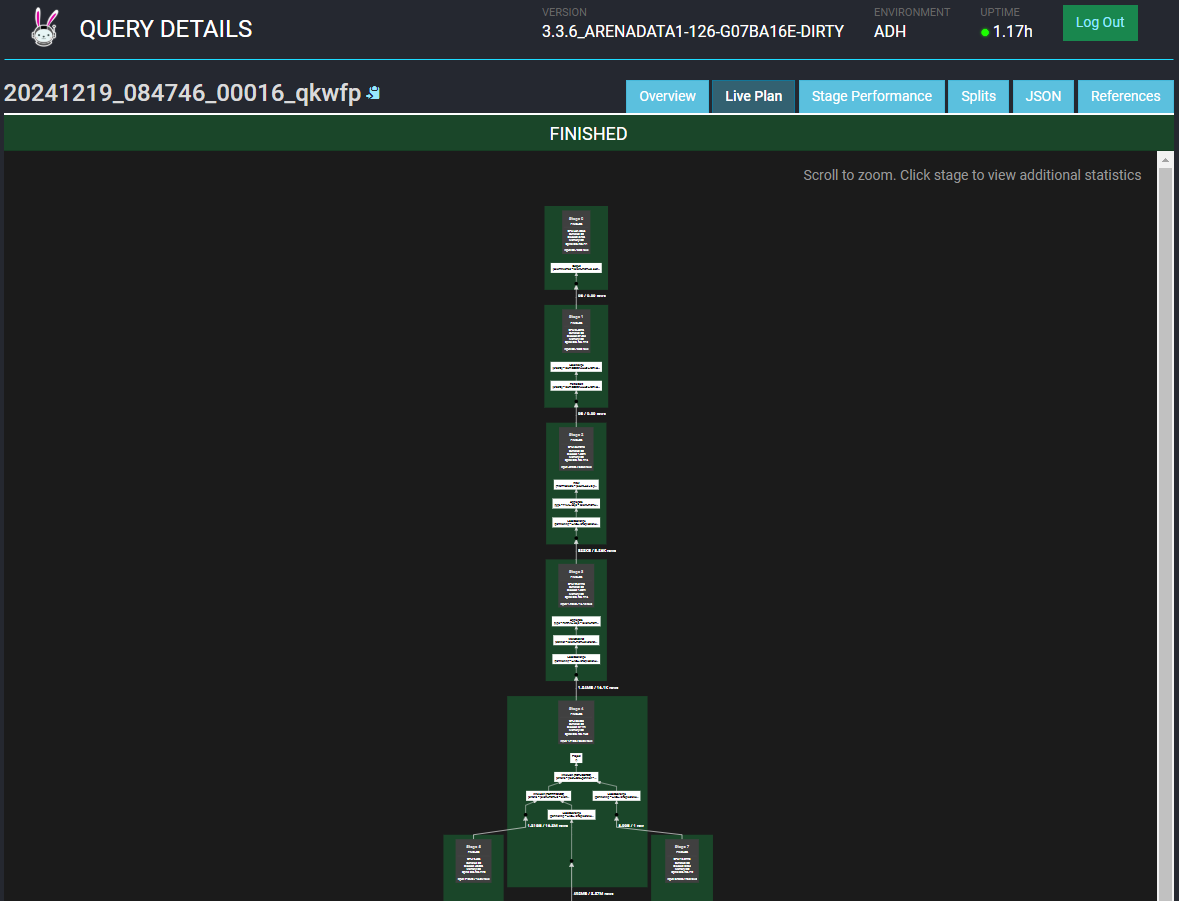
Live plan
On the Live plan tab, you can see the scheme of the query execution by stages with detailed information on each stage: completion status, resource usage, clauses processed, and the direction of further processing of the query. You can zoom in and out by scrolling up and down respectively, and move the scheme by left click dragging. Clicking on a stage in the scheme will take you to the Stage performance tab with that particular stage chosen.
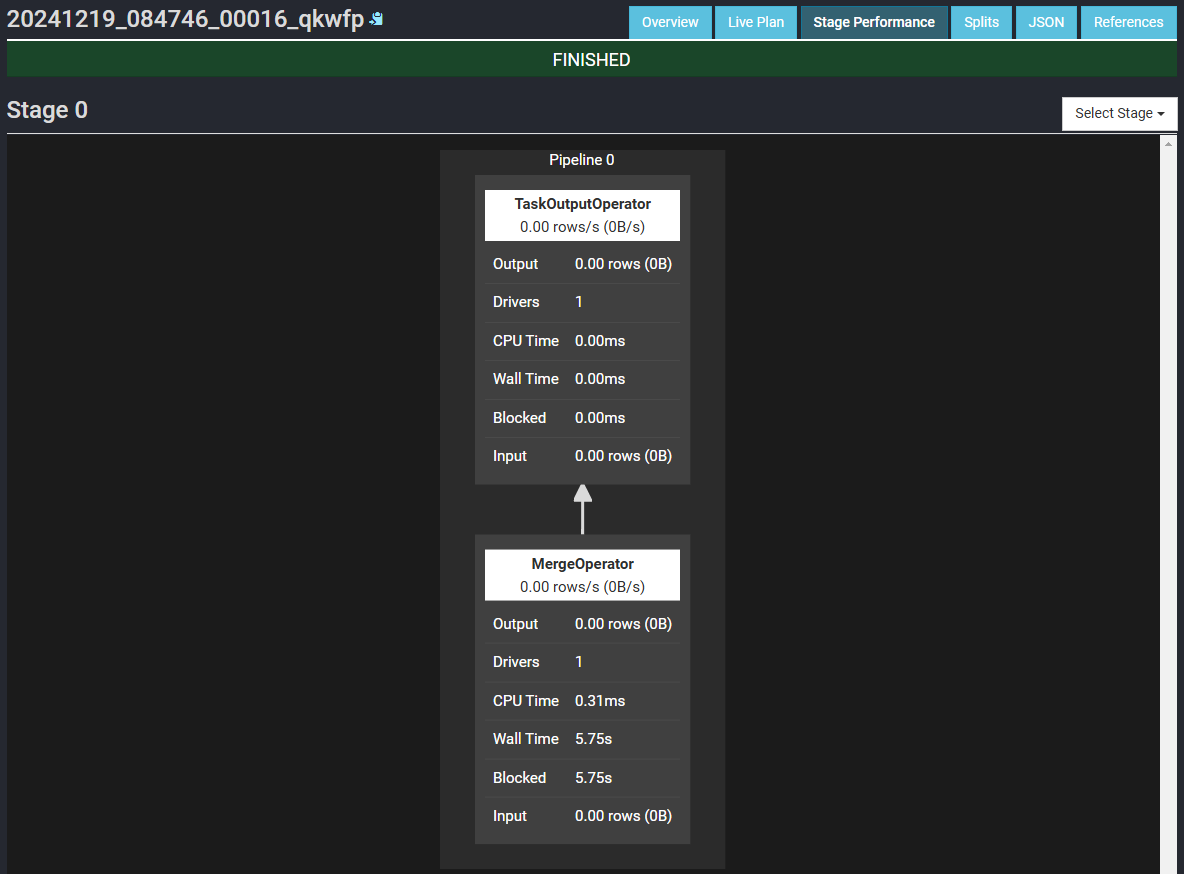
Stage performance
On the Stage performance tab, you can see the futher breakdown of the selected stage of the query execution. You can select the stage to inspect in the top right corner of the screen (the Select stage list).
Splits
On the Splits tab, you can see the splits timelines for each stage of the query execution. Each timeline displays how much time passed since the stage creation till the start of the first split, then till the start of the last split, then till end of the last split, and till the end of the stage. Timelines are color-coded.