

Airflow UI overview
By default, Airflow provides two web-based user interface forms:
-
Airflow Web UI. It allows you to monitor DAGs, work with datasets, change security settings, configure the metadata database options (for example, connections to external sources), and so on.
-
Flower. It is a separate web tool for monitoring and administrating Celery clusters.
| System | URL | Documentation |
|---|---|---|
Airflow Web UI |
http://<Airflow Server IP>:8080 |
|
Flower |
http://<Airflow Server IP>:5555 |
If you have an SSL certificate configured, use https:// instead of http://.
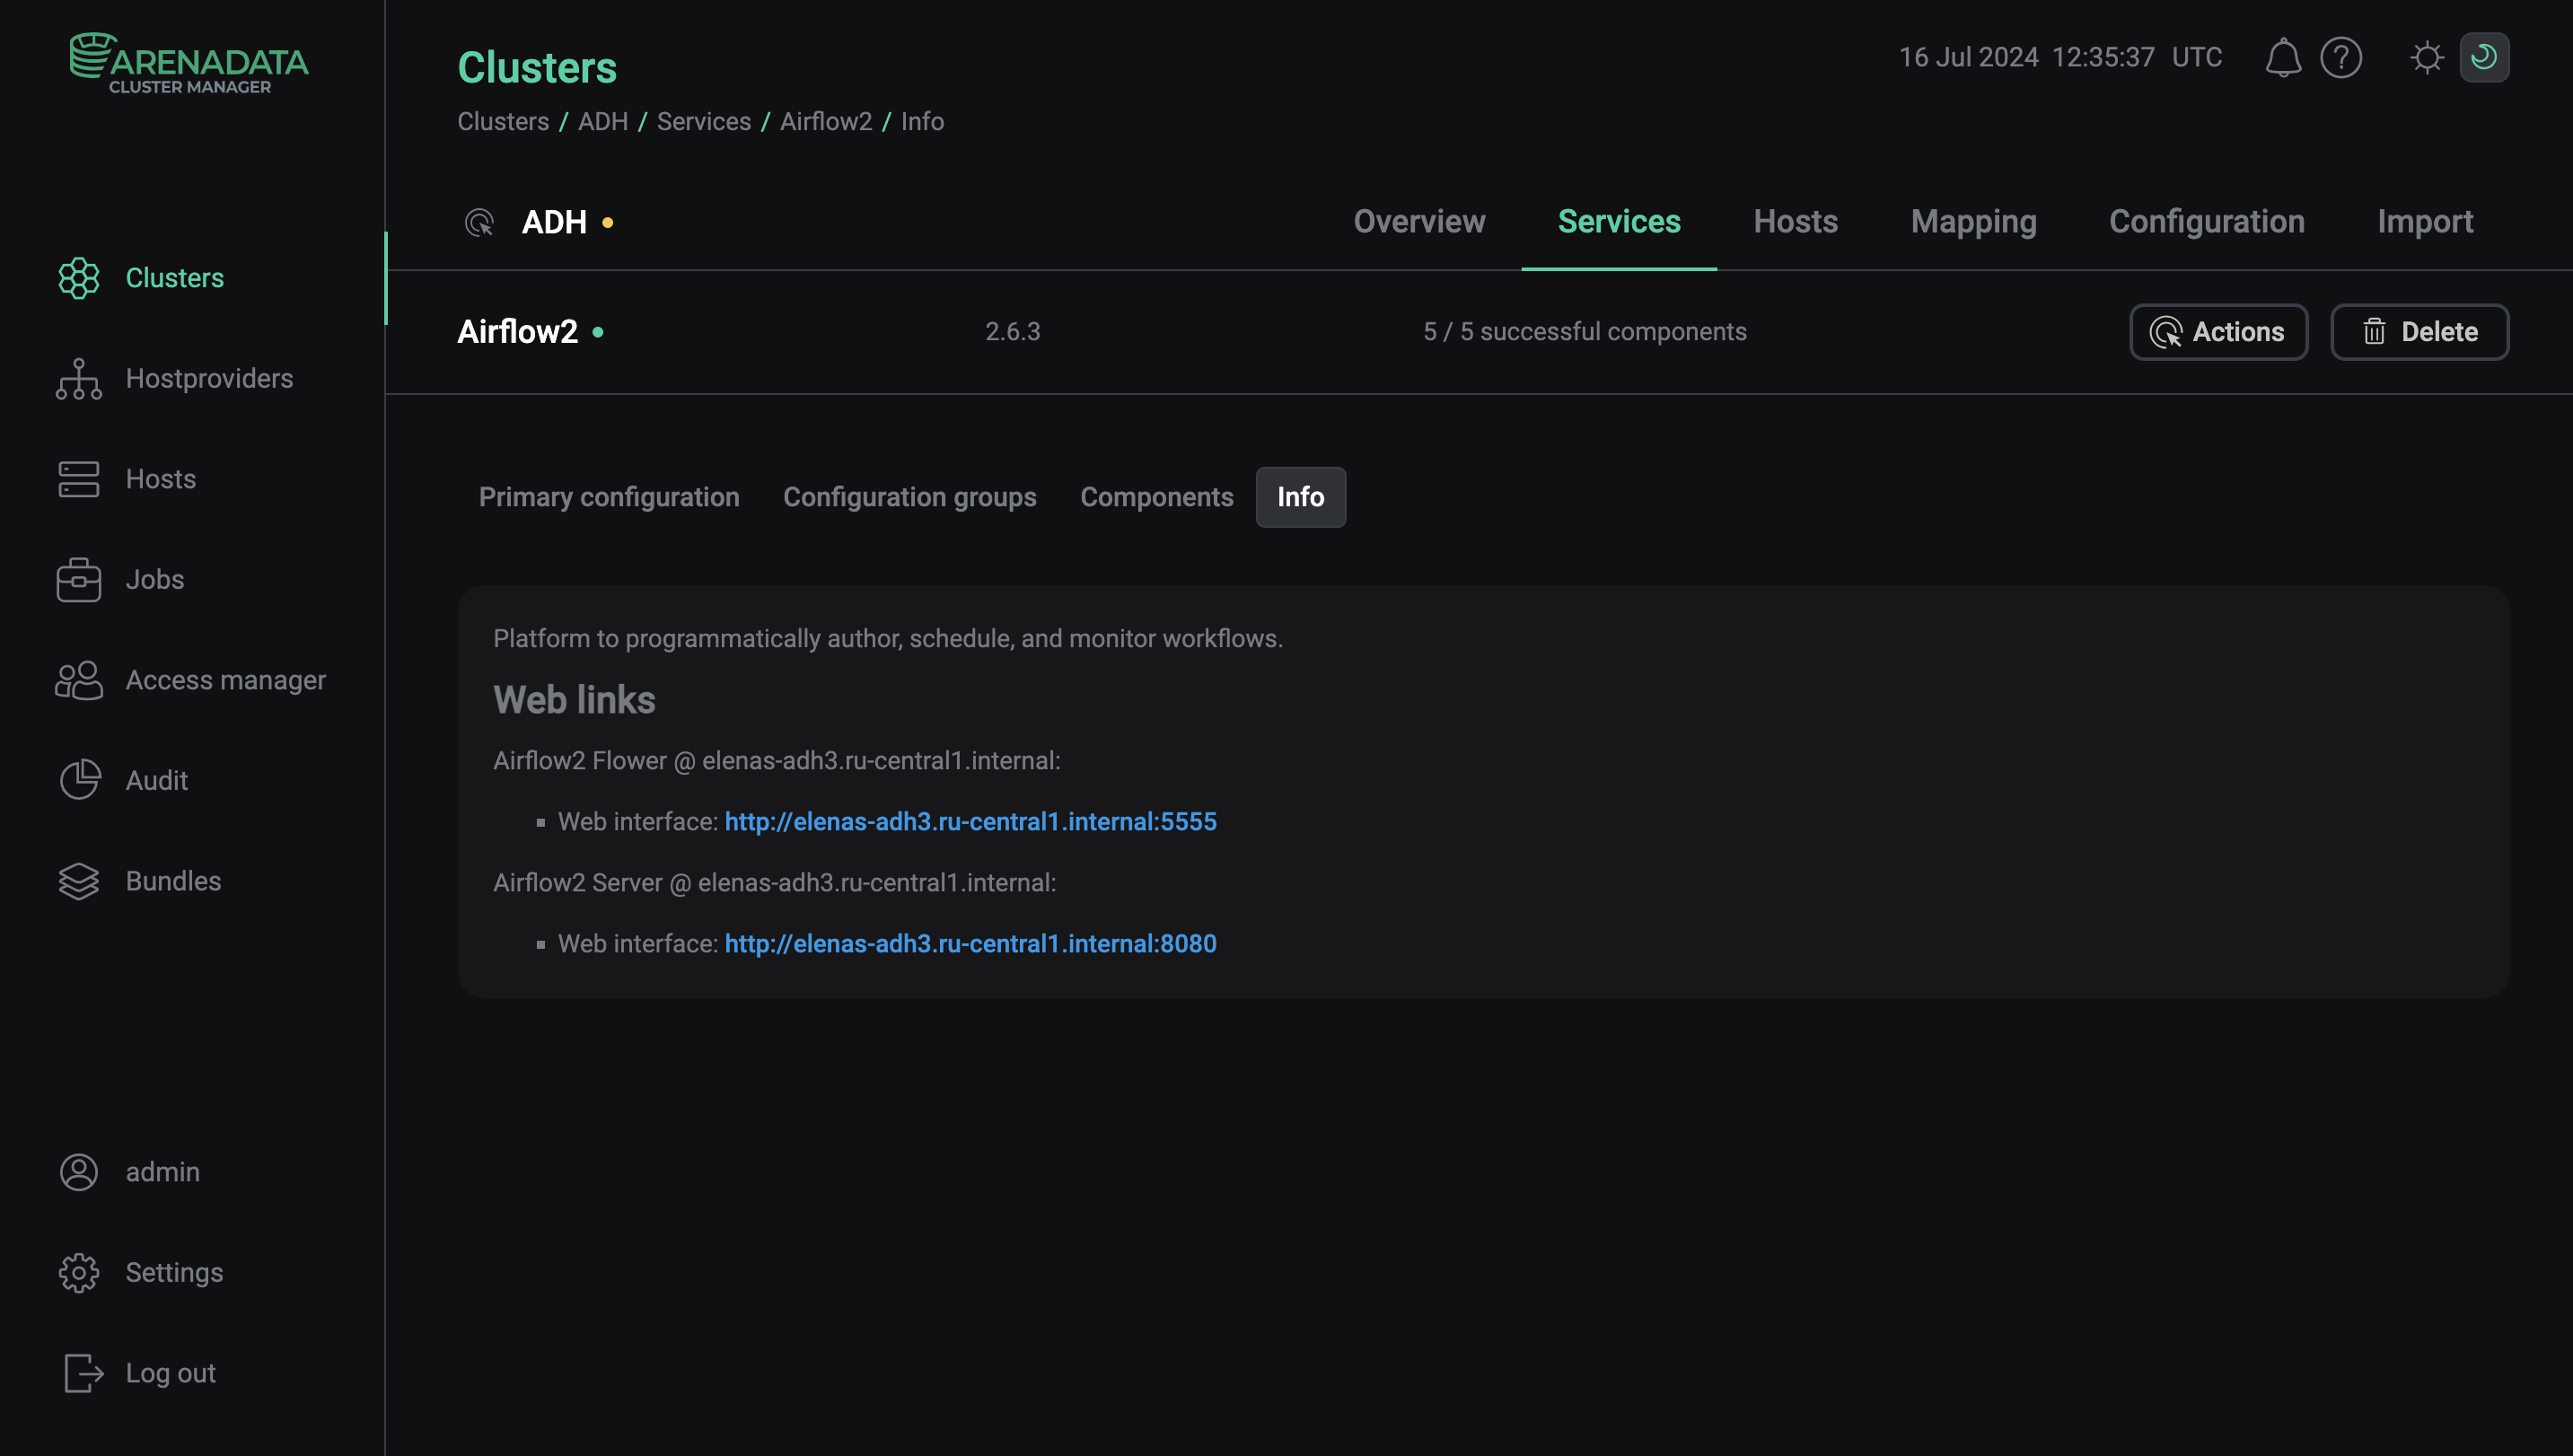
The links to both web interfaces are available on the Info tab, on the service’s page in ADCM.
Airflow UI
DAGs
The DAGs page is the home page of the Airflow UI. It displays a list of data pipelines with information about them, several actions, and shortcuts to useful pages:
-
DAG — the unique DAG identifier name. You can use the toggle button to pause the data pipeline. By clicking on the DAG’s name, you can navigate to that DAG’s page.
-
Owner — the owner of the DAG as defined in the DAG’s code. By clicking on the owner’s name, you can filter DAGs to display only those that belong to that owner.
-
Runs — the statuses of all previous DAG runs: queued, success, running, failed.
-
Schedule — indicates how often a DAG runs. Some DAGs are run manually and some on a schedule.
-
Last Run — the time and date of the latest DAG run. You can click on the date to see more information about that DAG.
-
Next Run — the time and date of the next DAG run. For dataset-triggered DAGs, it shows the number of datasets that have been updated since the last DAG run.
-
Recent Tasks — the statuses of the current or latest DAG runs.
-
Action — using the actions menu, you can trigger a DAG, trigger a DAG with a specific configuration, or delete a DAG. The delete action doesn’t actually delete the DAG, only the related metadata.
-
Links — in the link menu, there are shortcuts to specific tabs on the DAG page.
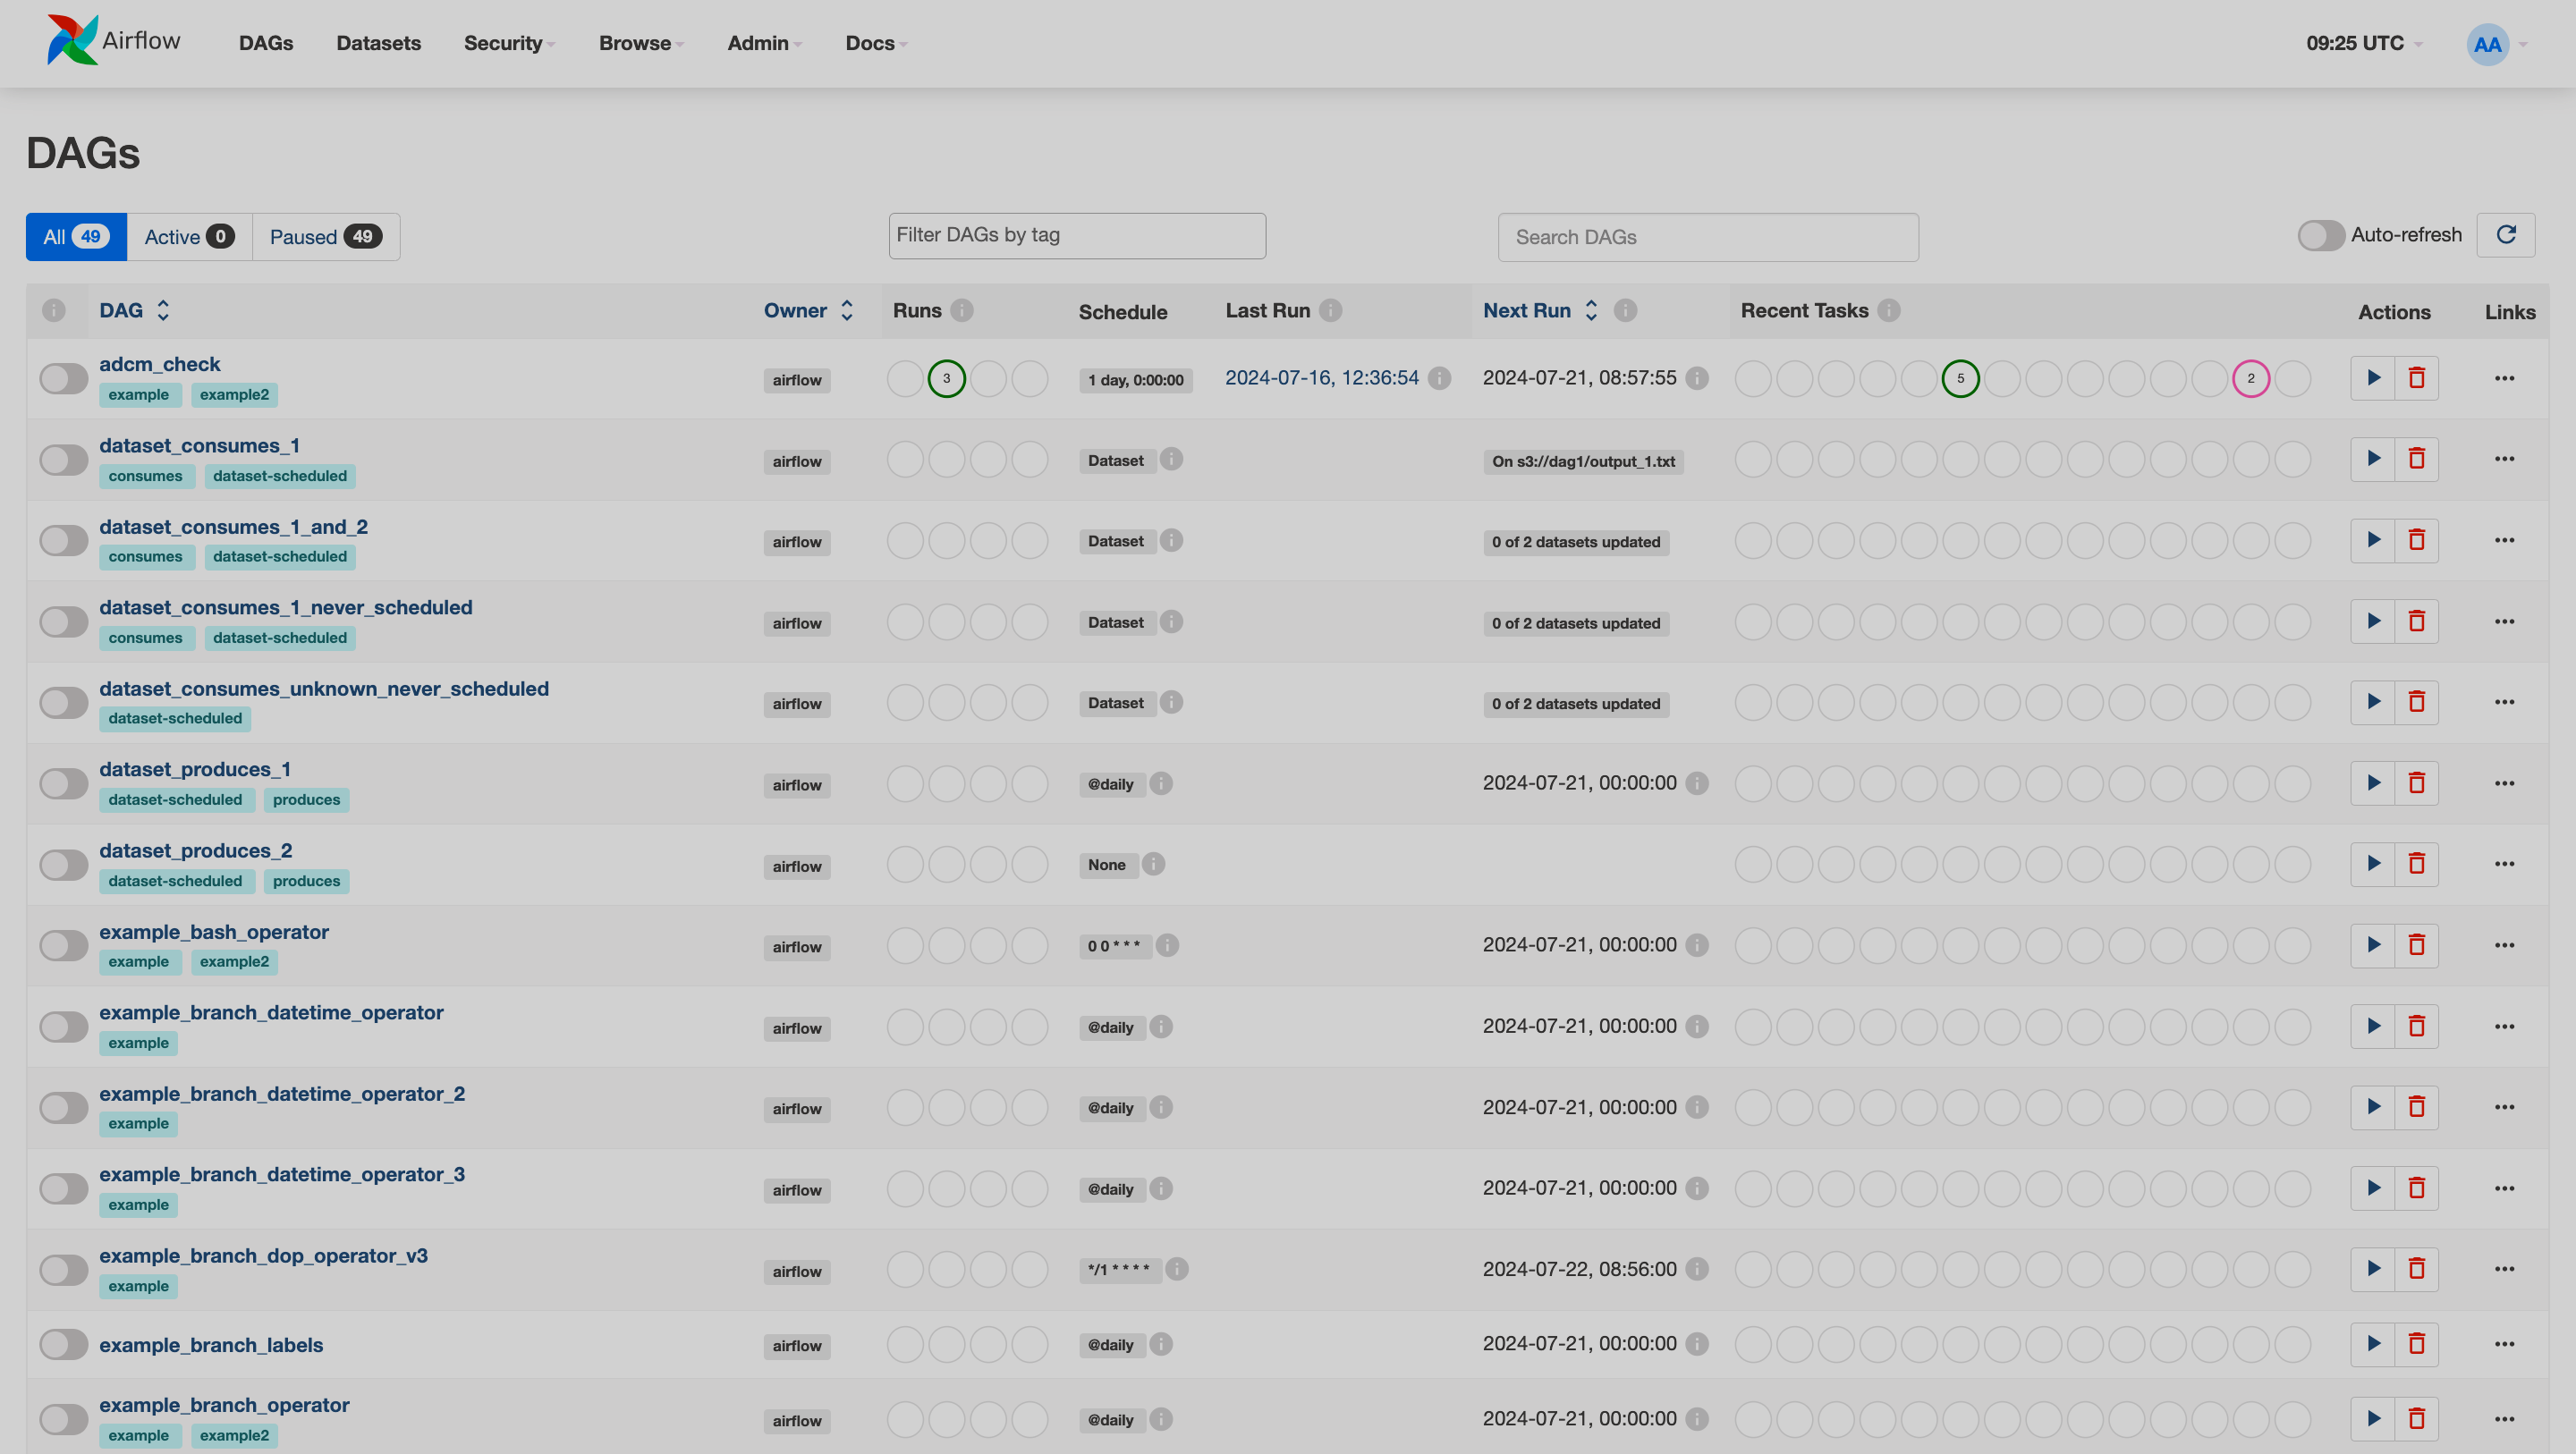
Additionally, you can use search or filter the list of DAGs by a tag.
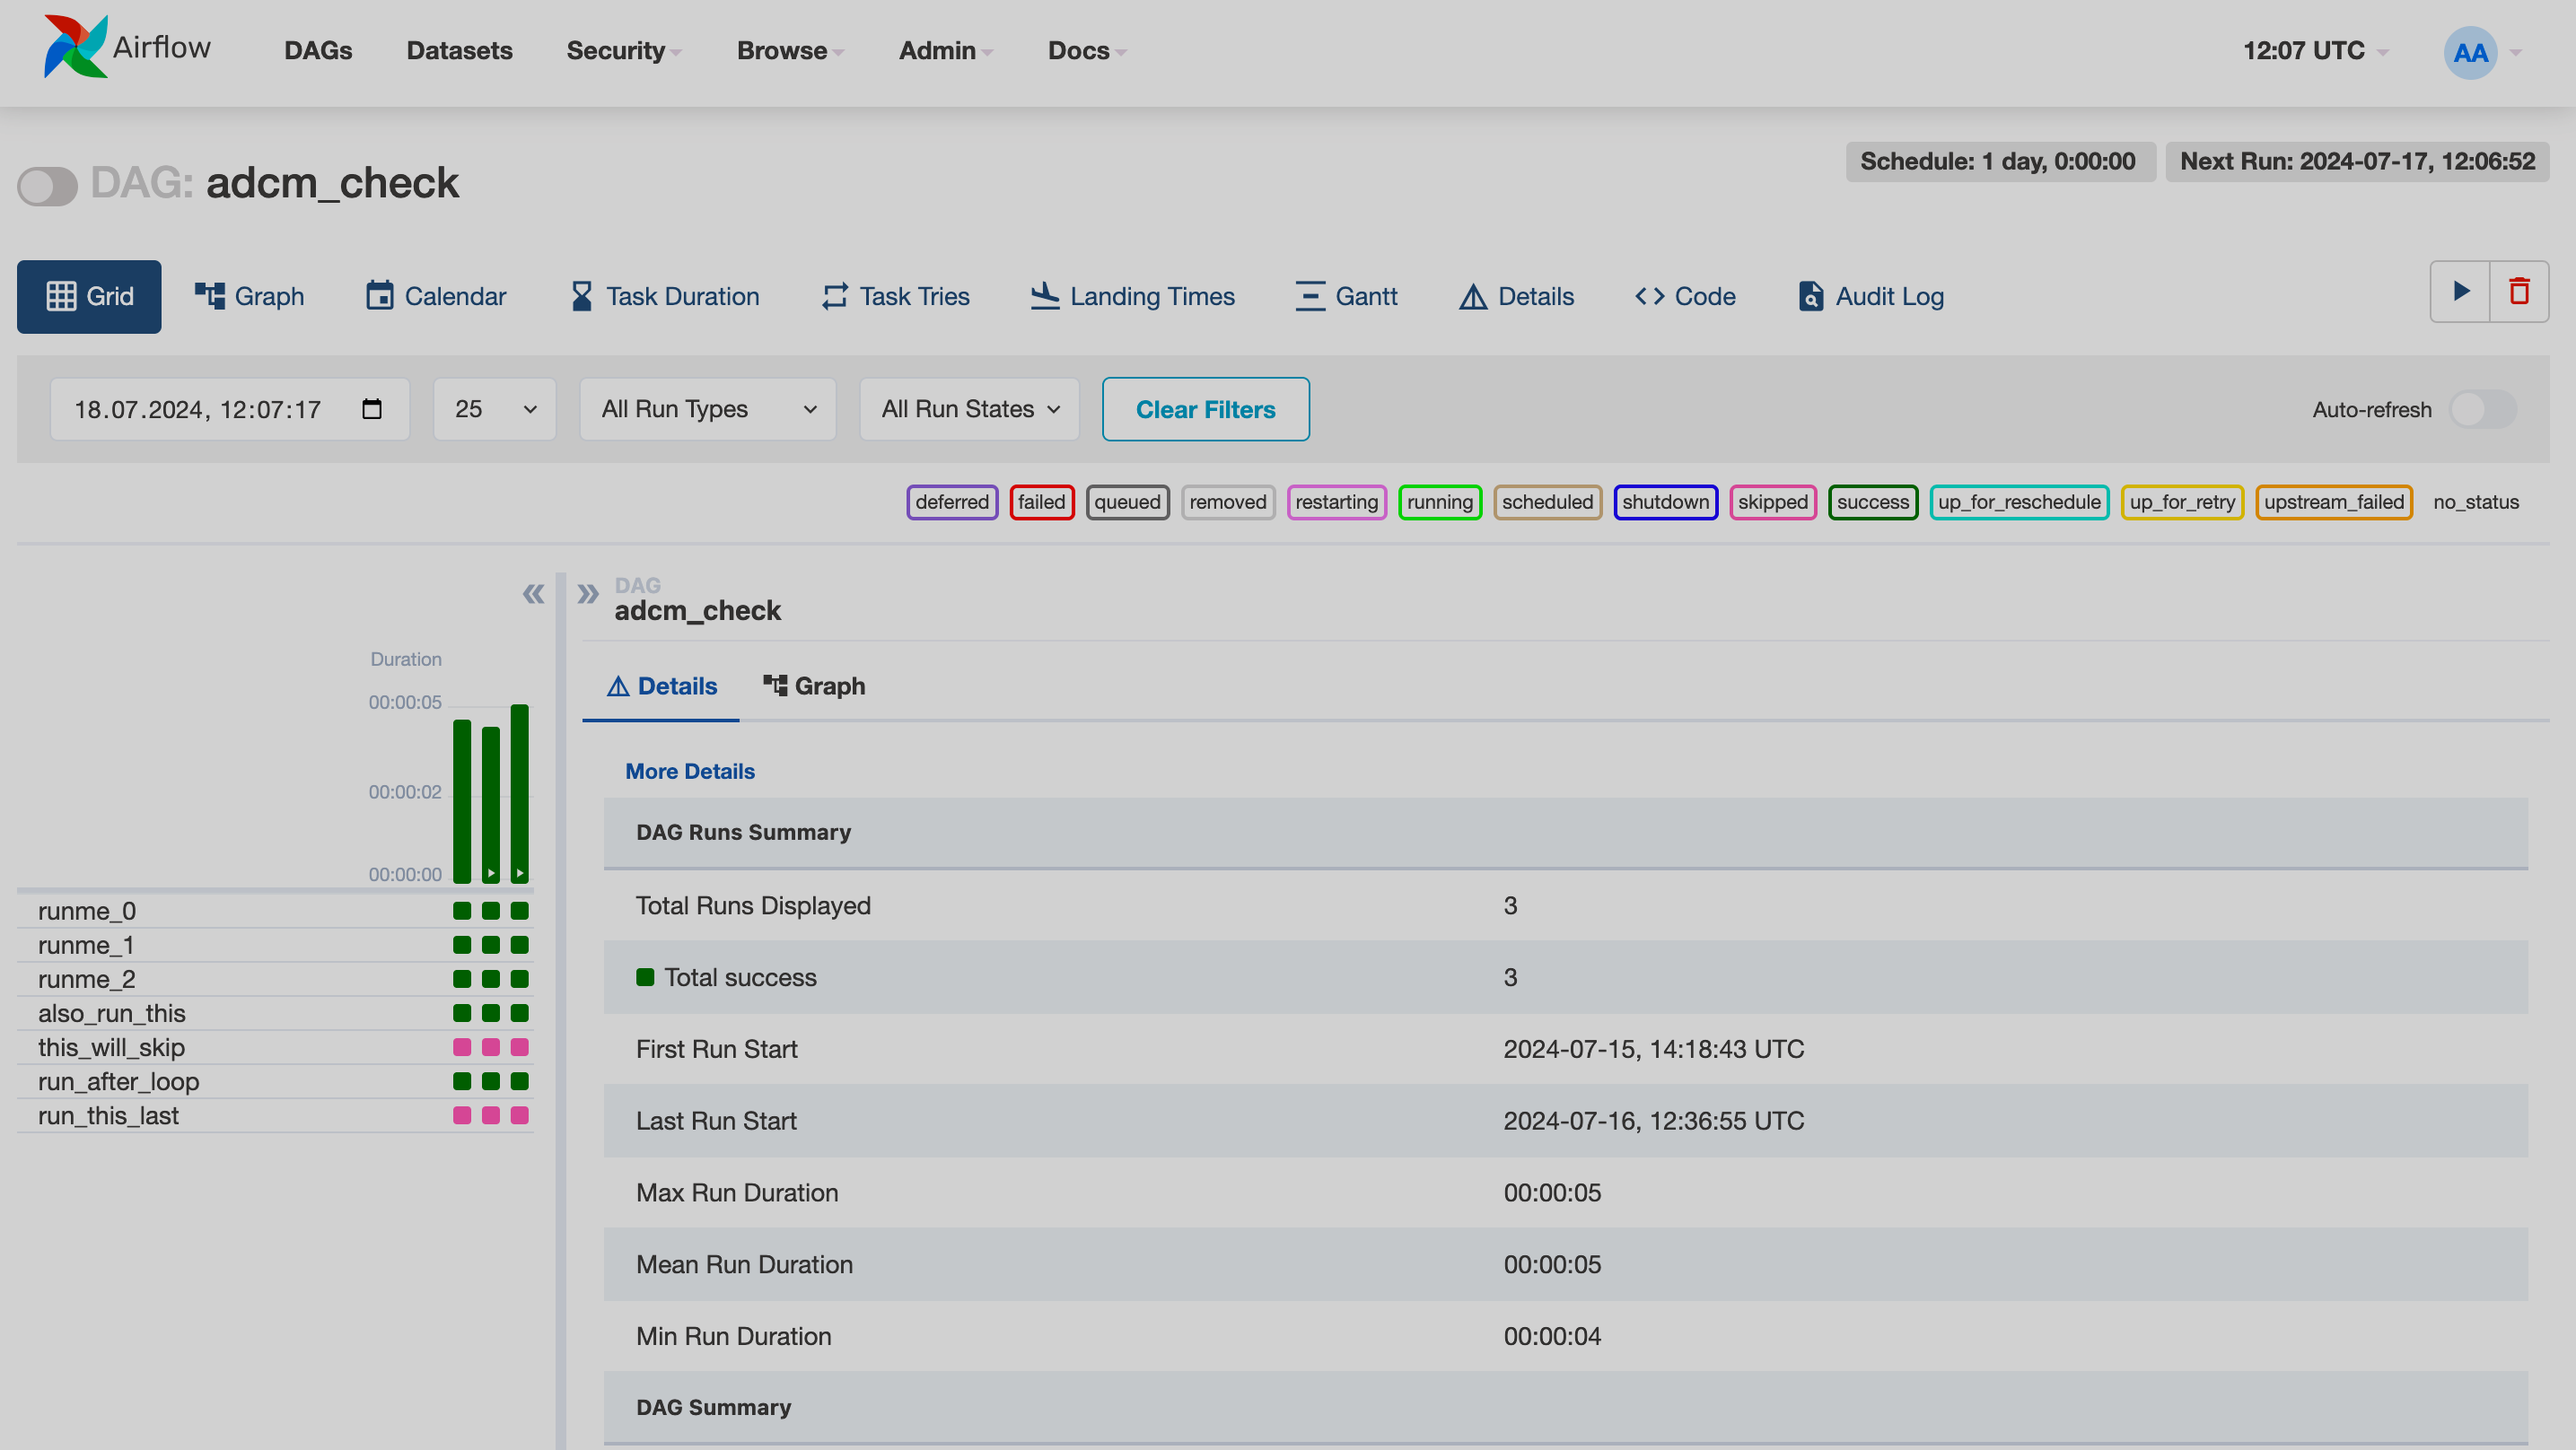
On a DAG page, you can find several representations of the DAG’s information:
-
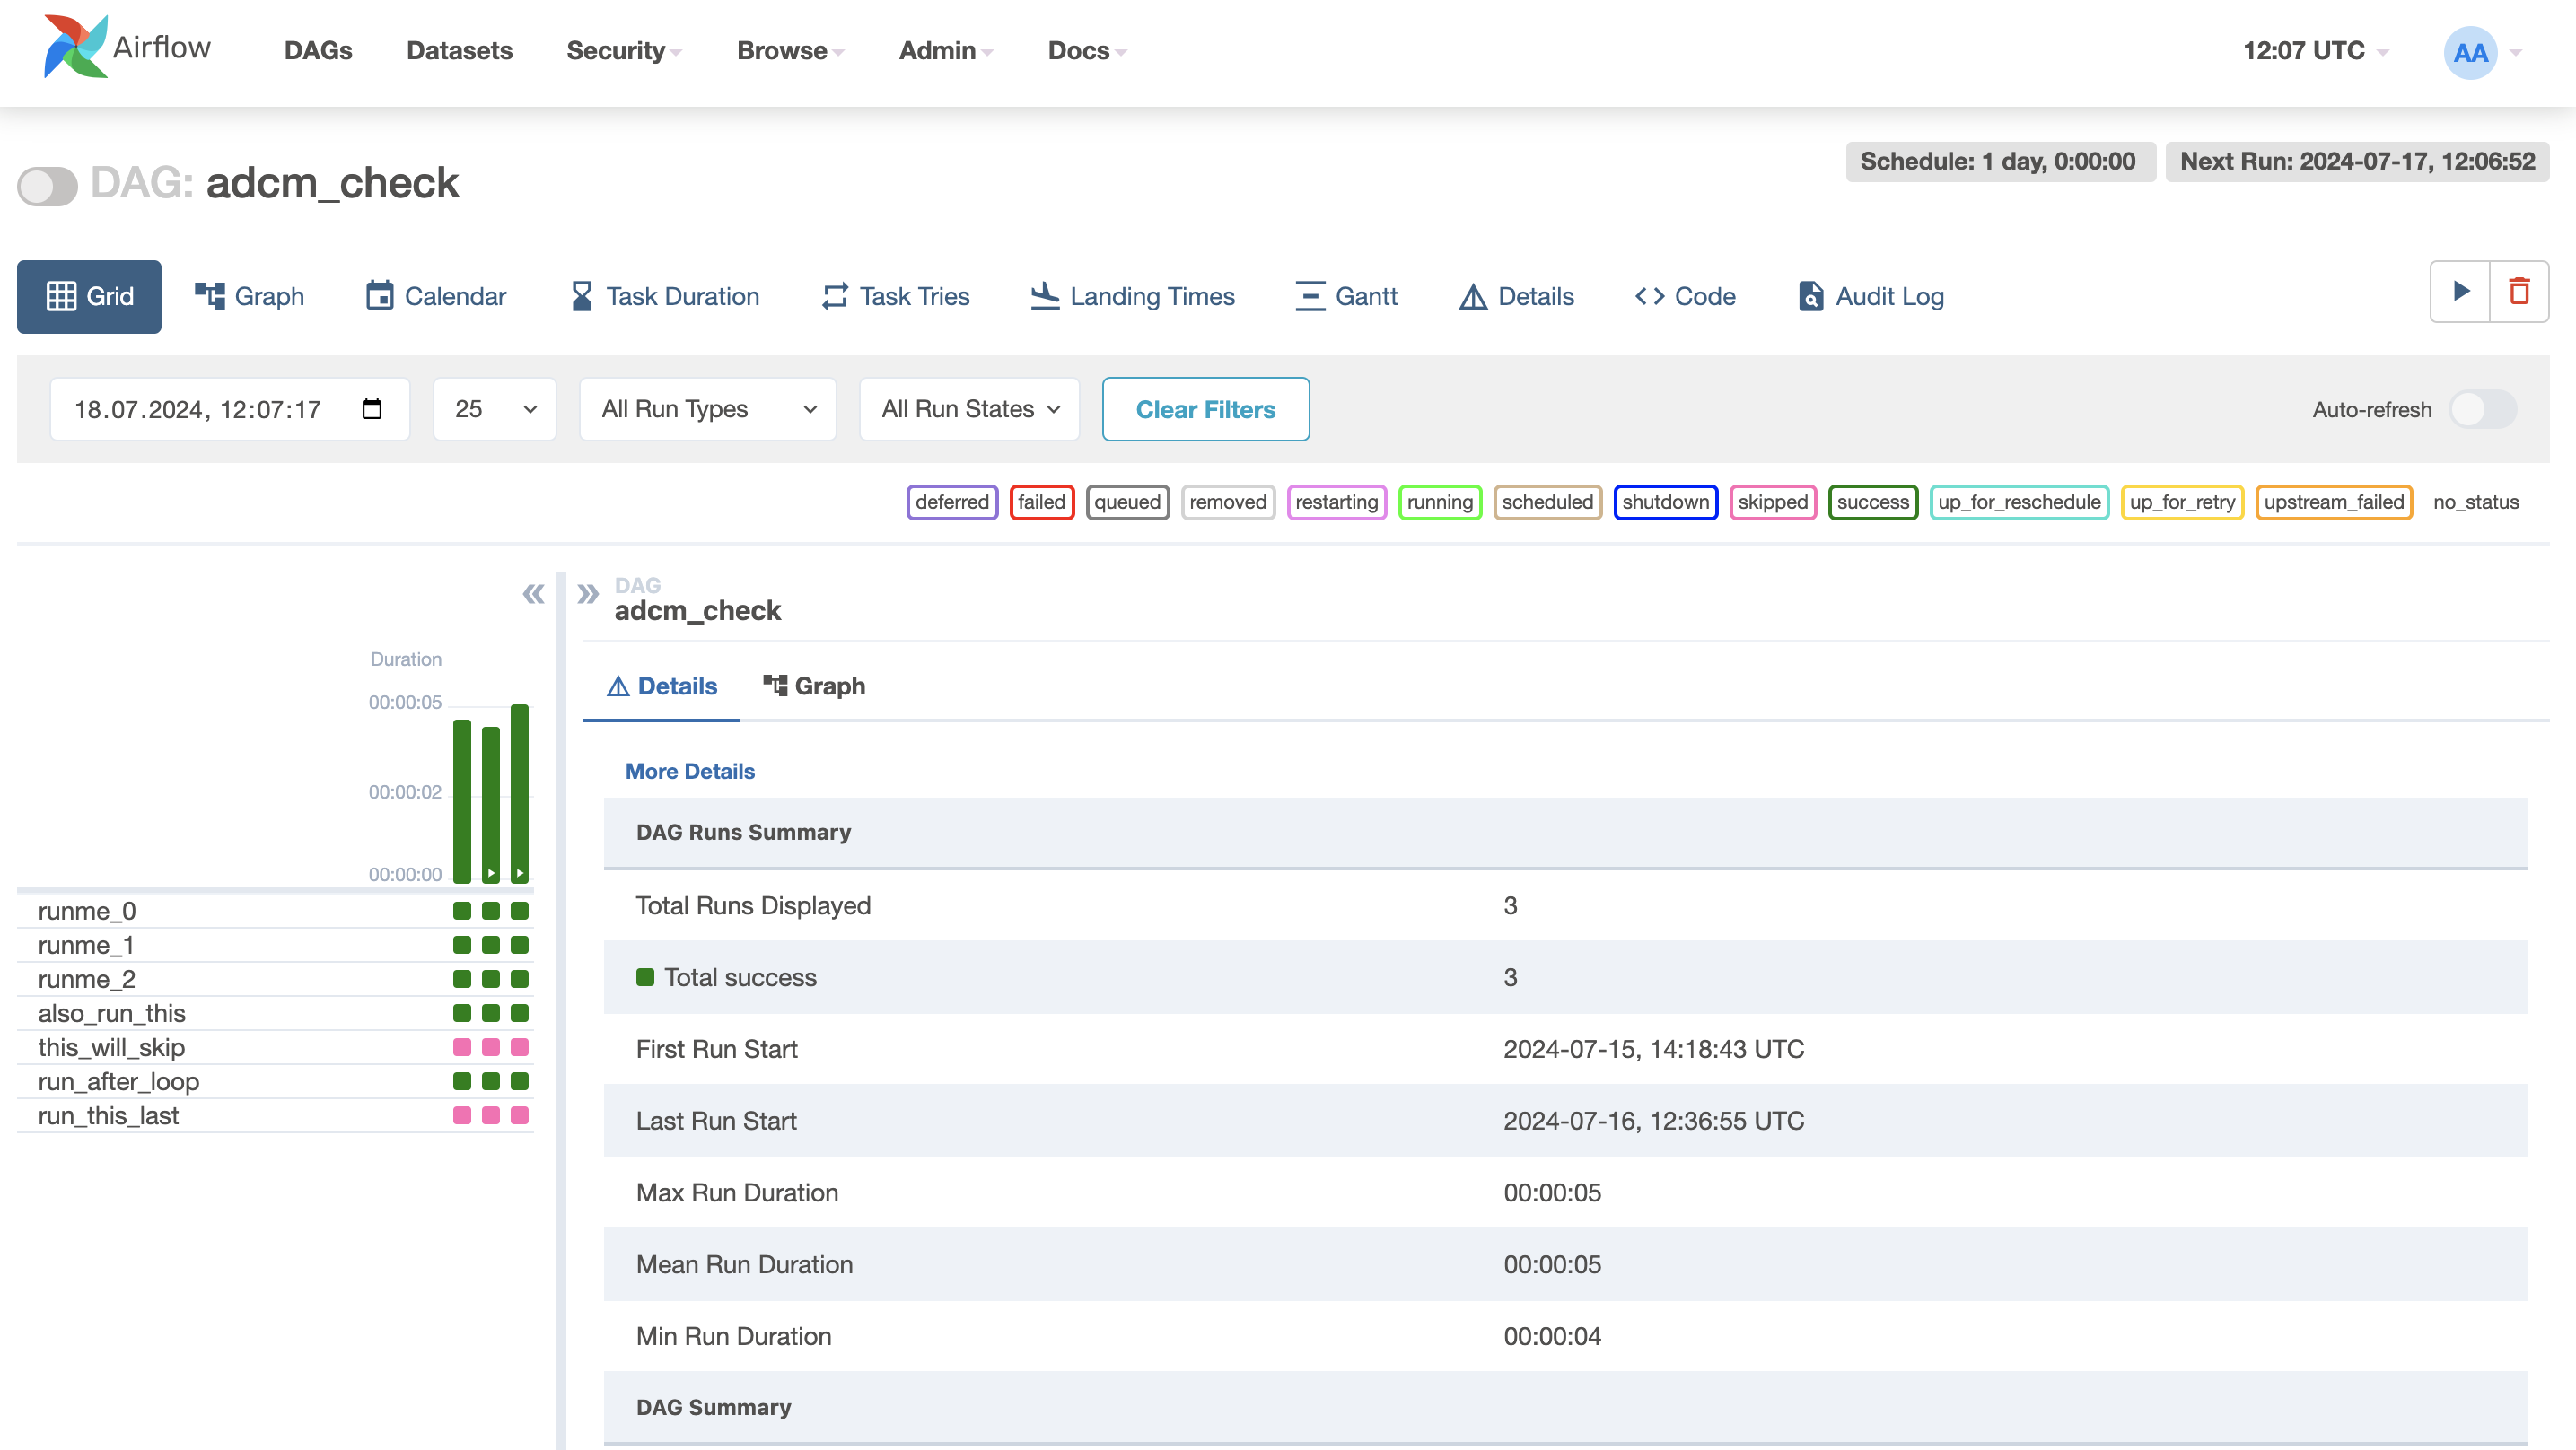
Grid — a chart of DAG runs by duration, task instances, and runs summary. The tasks are represented as squares and the DAGs as bars. To see information for a specific task, click on the corresponding square. There you can find information about Xcoms, logs, and actions related to the task.
-
Graph — a graph of tasks with information about runs.
-
Calendar — a calendar of running and planned DAGs. Each date in the calendar has an indicator of DAG runs' success rate.
-
Task Duration — a graph of the duration for each task.
-
Task Tries — a graph of run attempts for each task.
-
Landing Times — the representation of finish times for each task related to the scheduled finish times.
-
Gantt — the view of planned and actual finish times for tasks.
-
Details — the detailed information on a specific DAG.
-
Code — the DAG’s code.
-
Audit Log — the view displays selected events and operations that have been taken on this DAG. The included and excluded events are set in the Airflow configuration.
Datasets
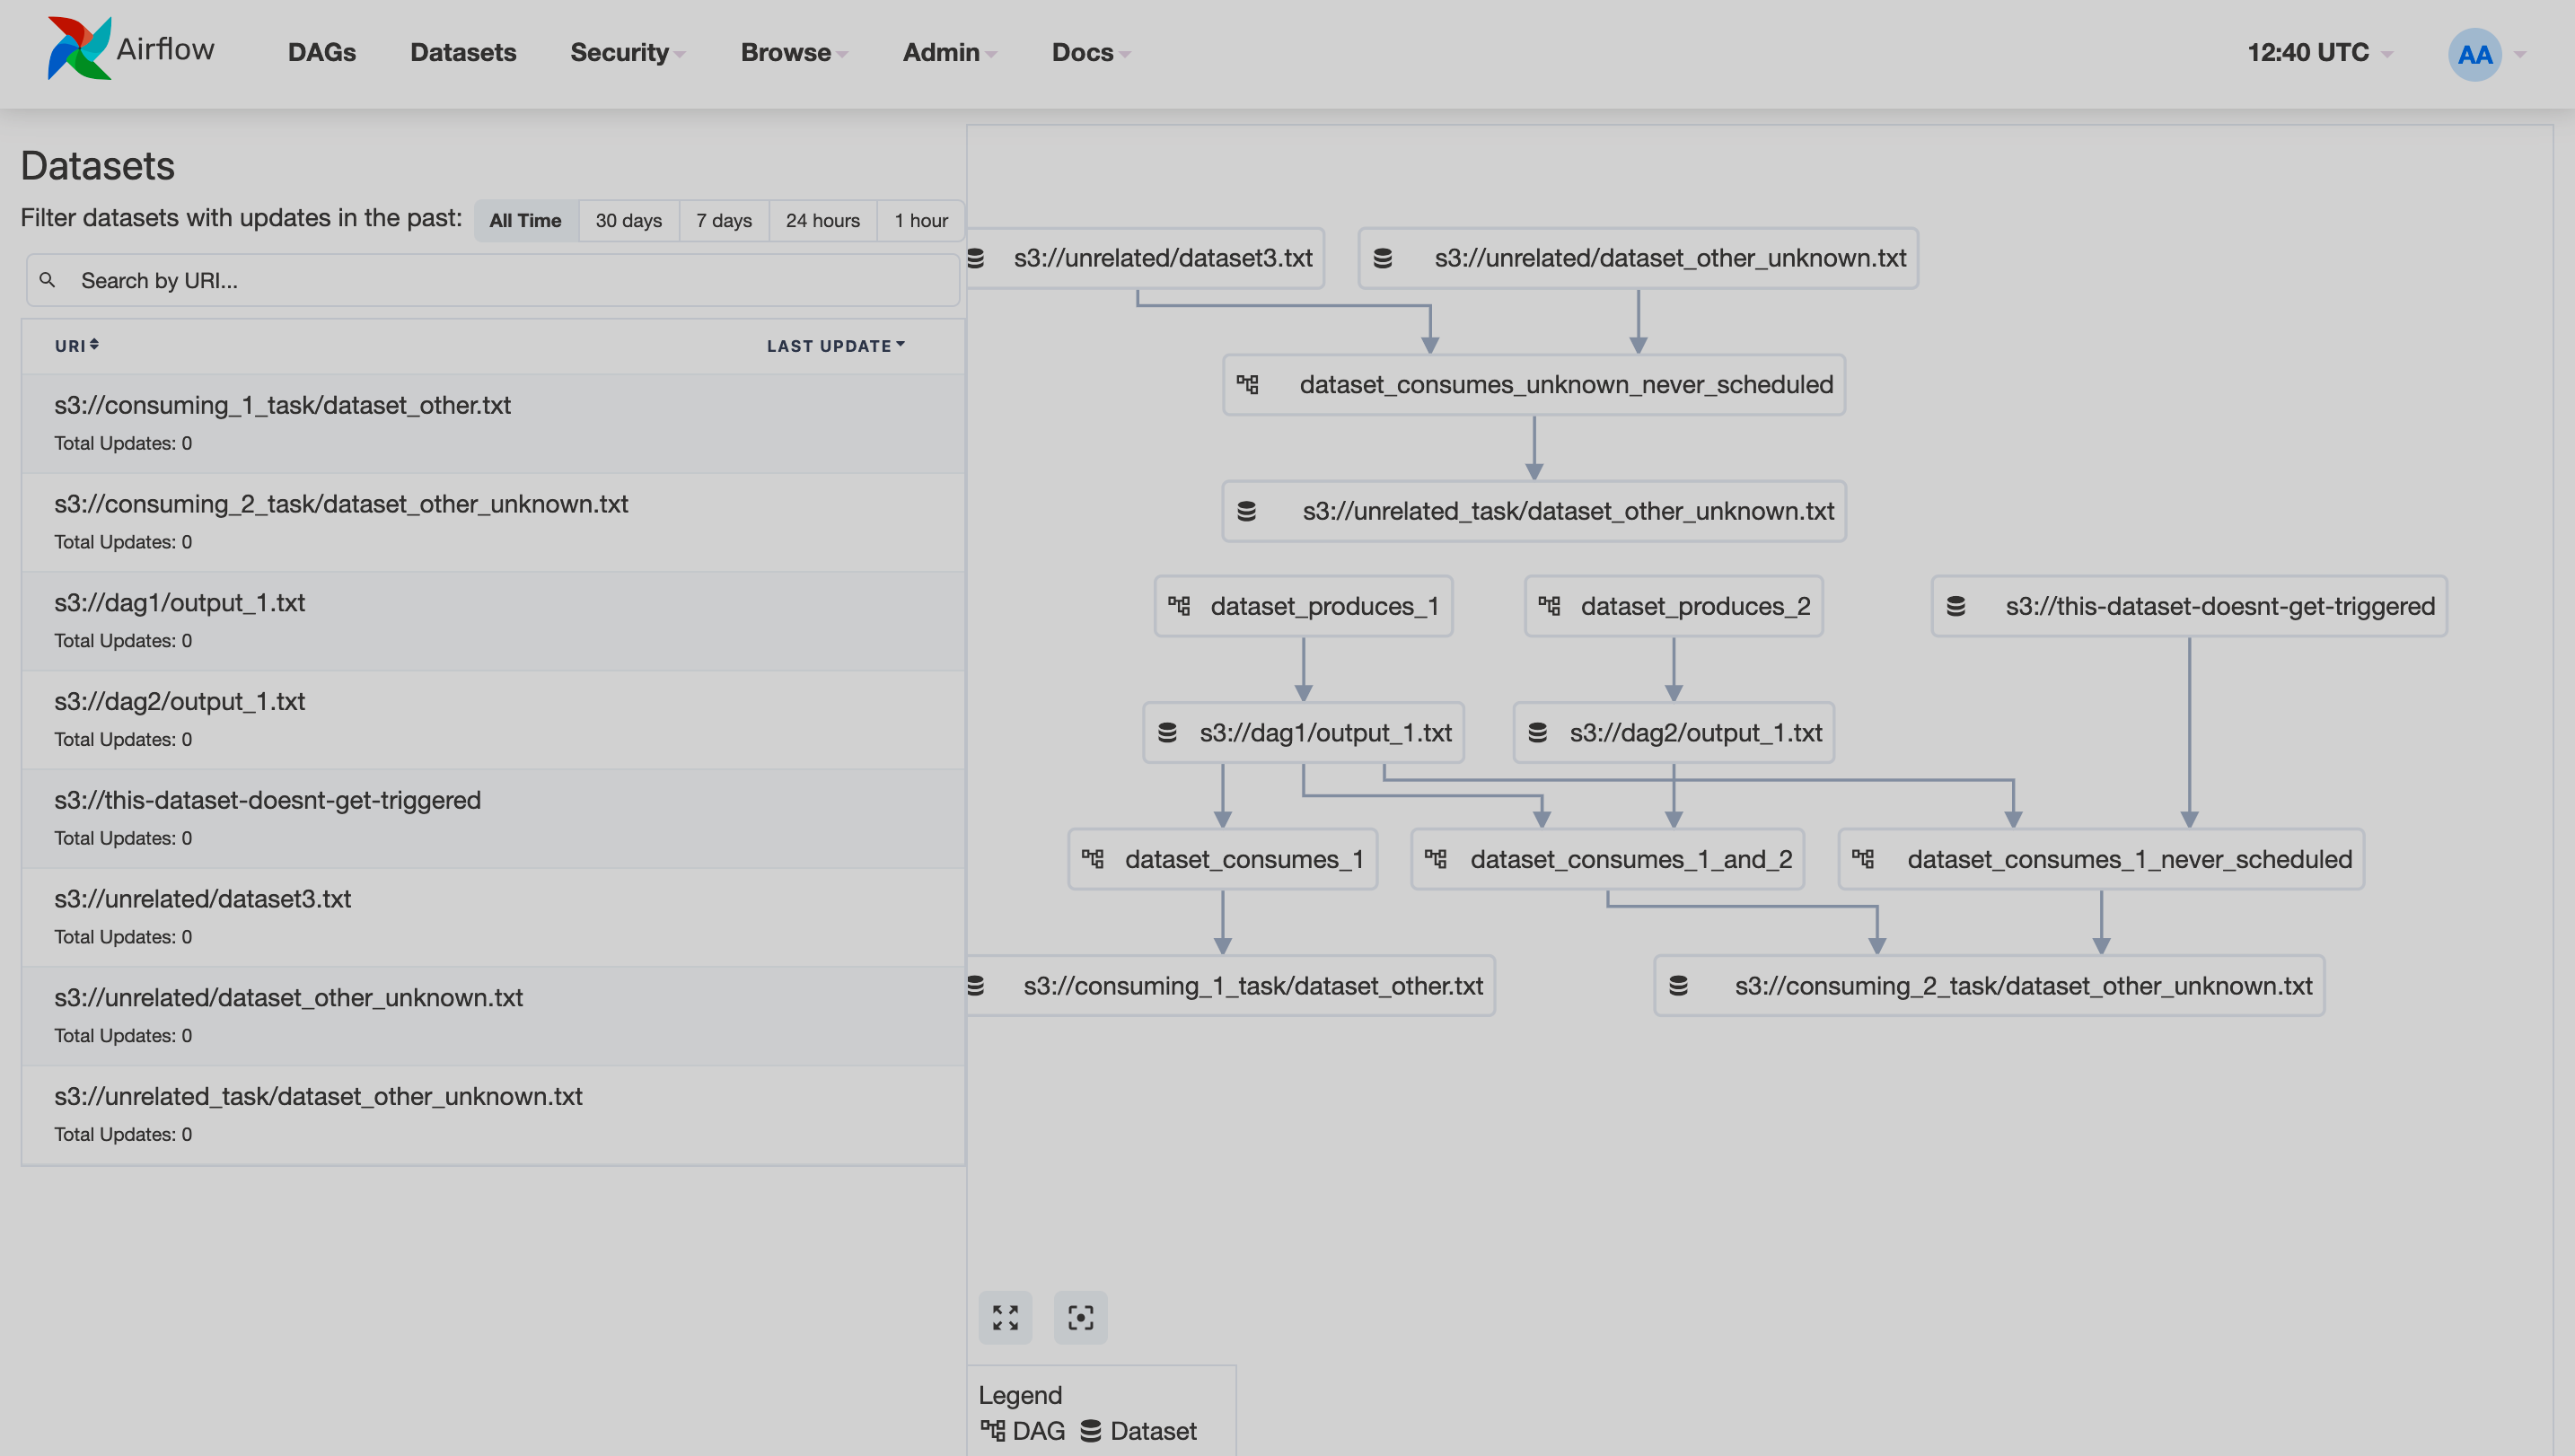
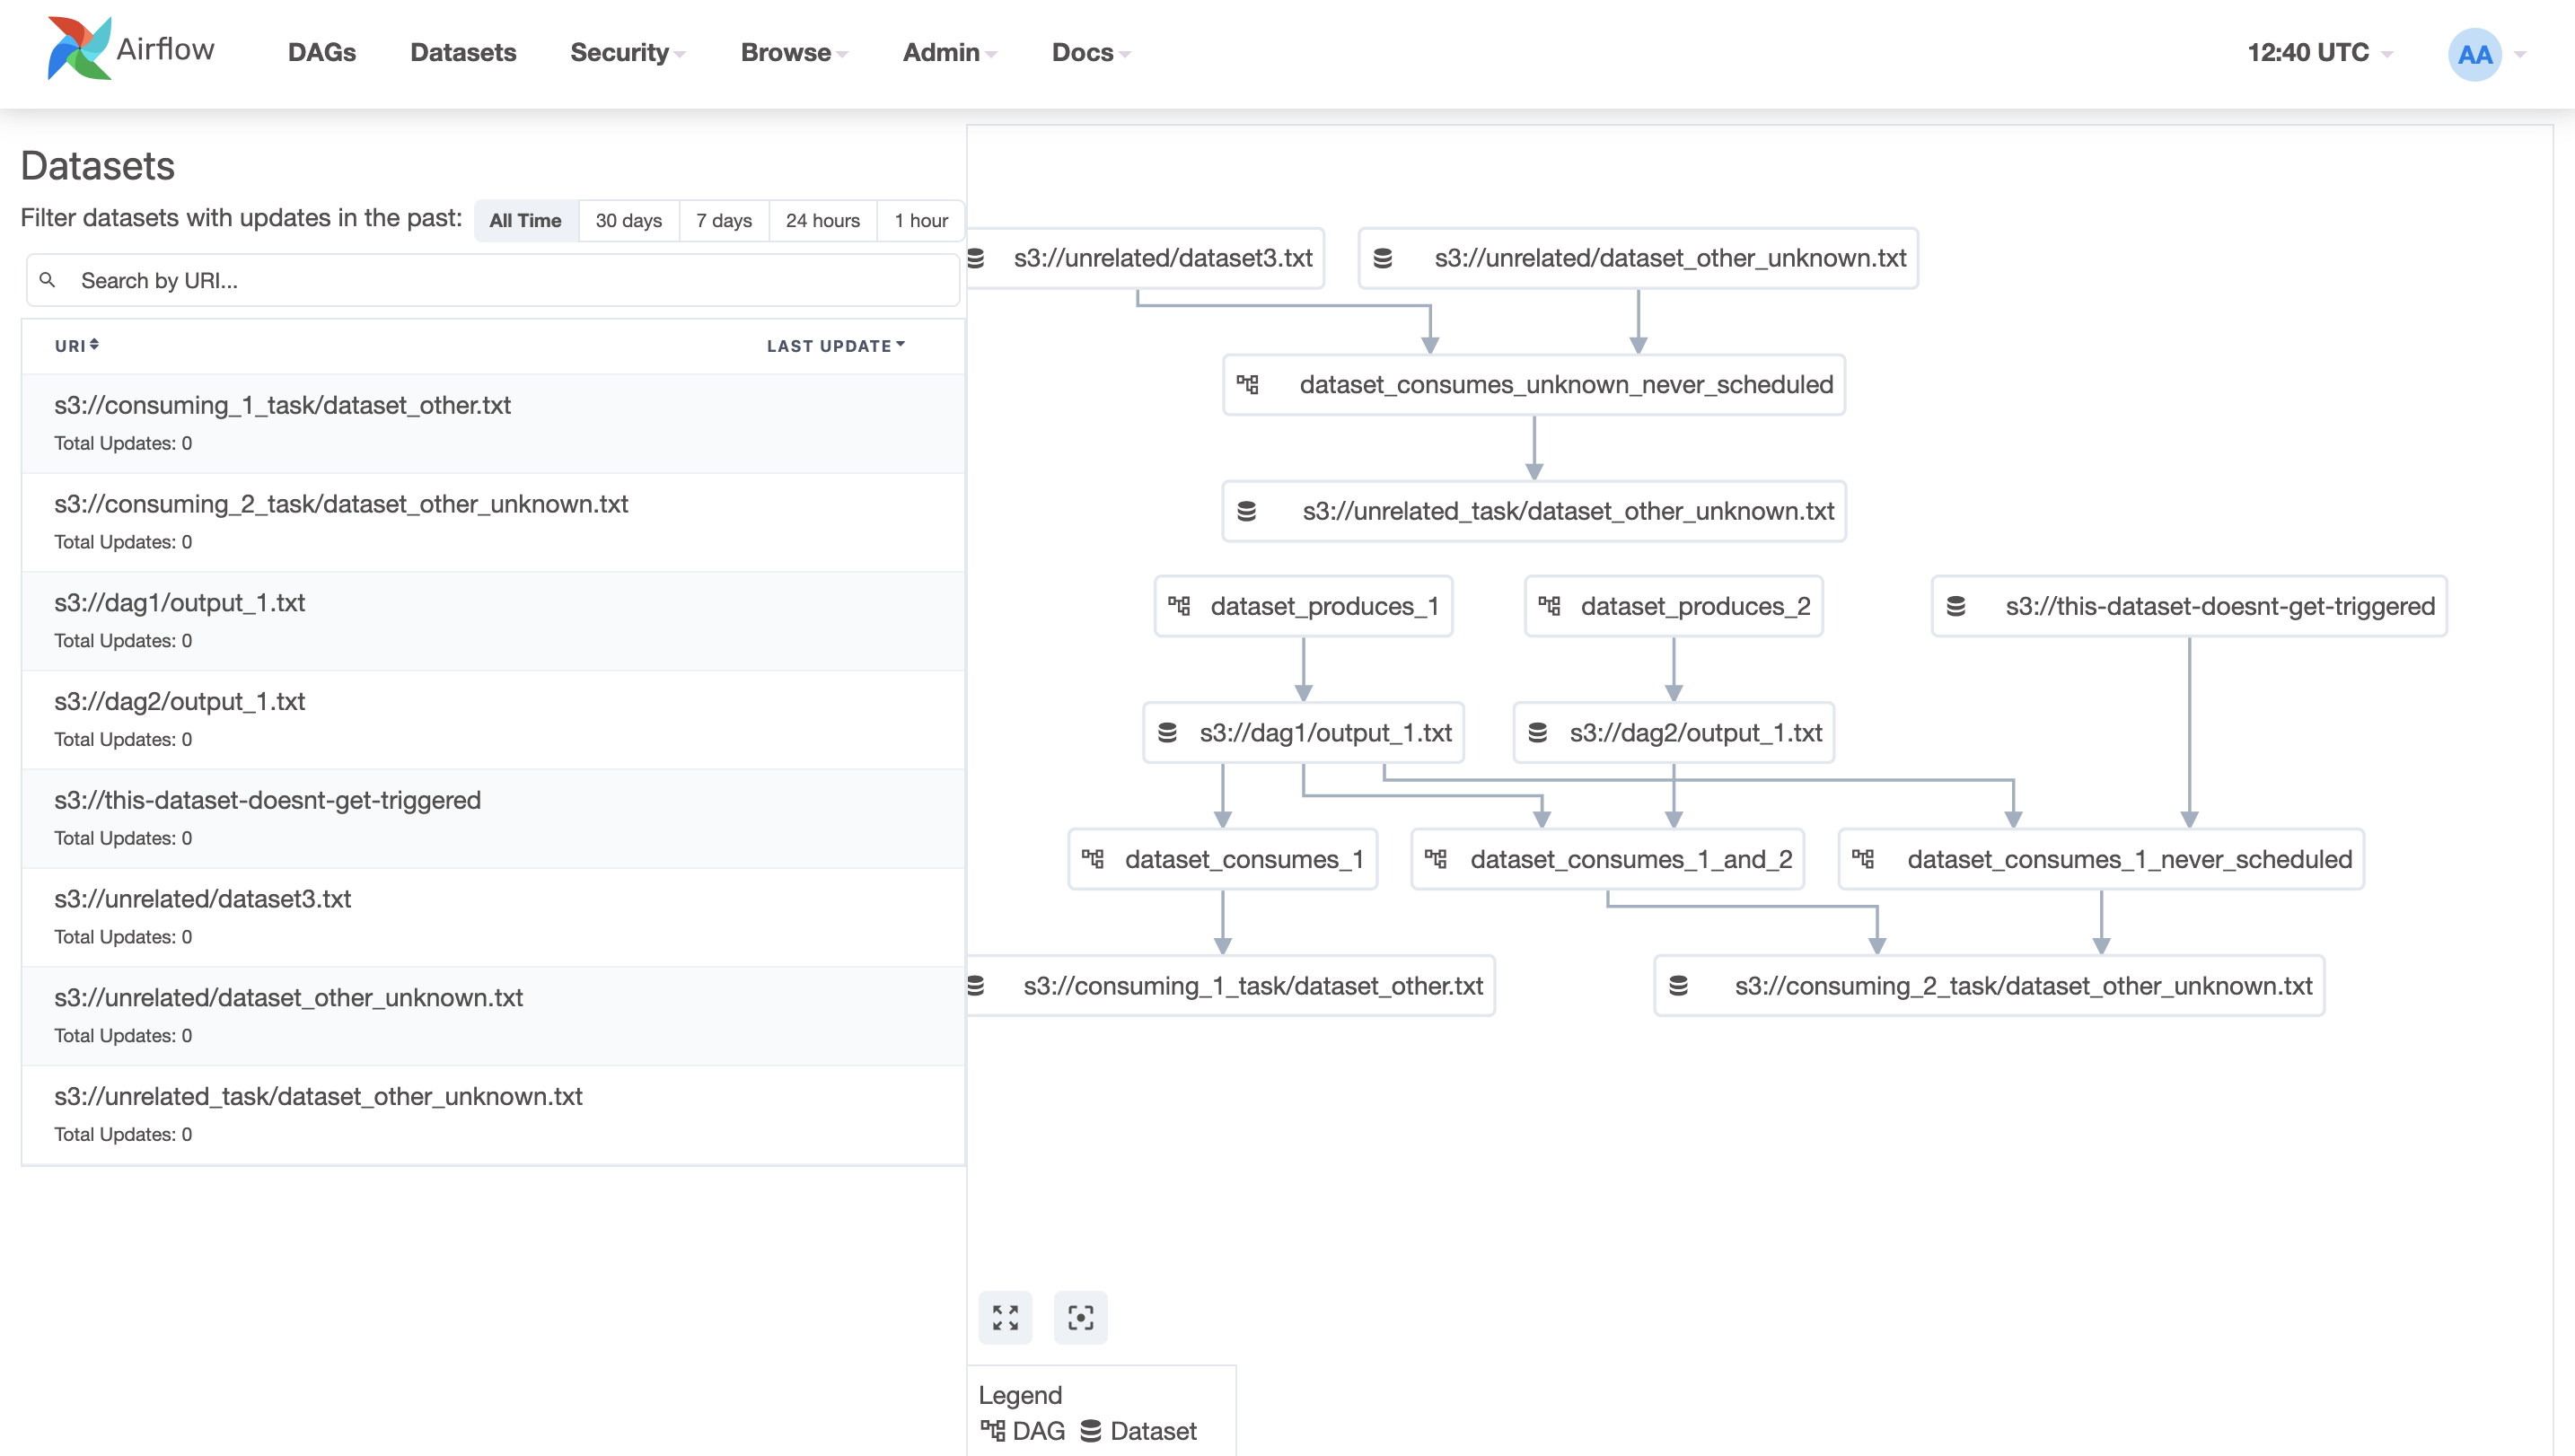
On the Datasets page, you can see the list of existing datasets on the left and the graph representation of relationships between datasets and DAGs on the right. When you click on a dataset in the list or the graph, it will highlight the dataset and its connections.
The page provides the ability to filter the list to display the recent history or search for a particular dataset.
Security
The Security menu provides access to information about users, roles, security settings, and actions.
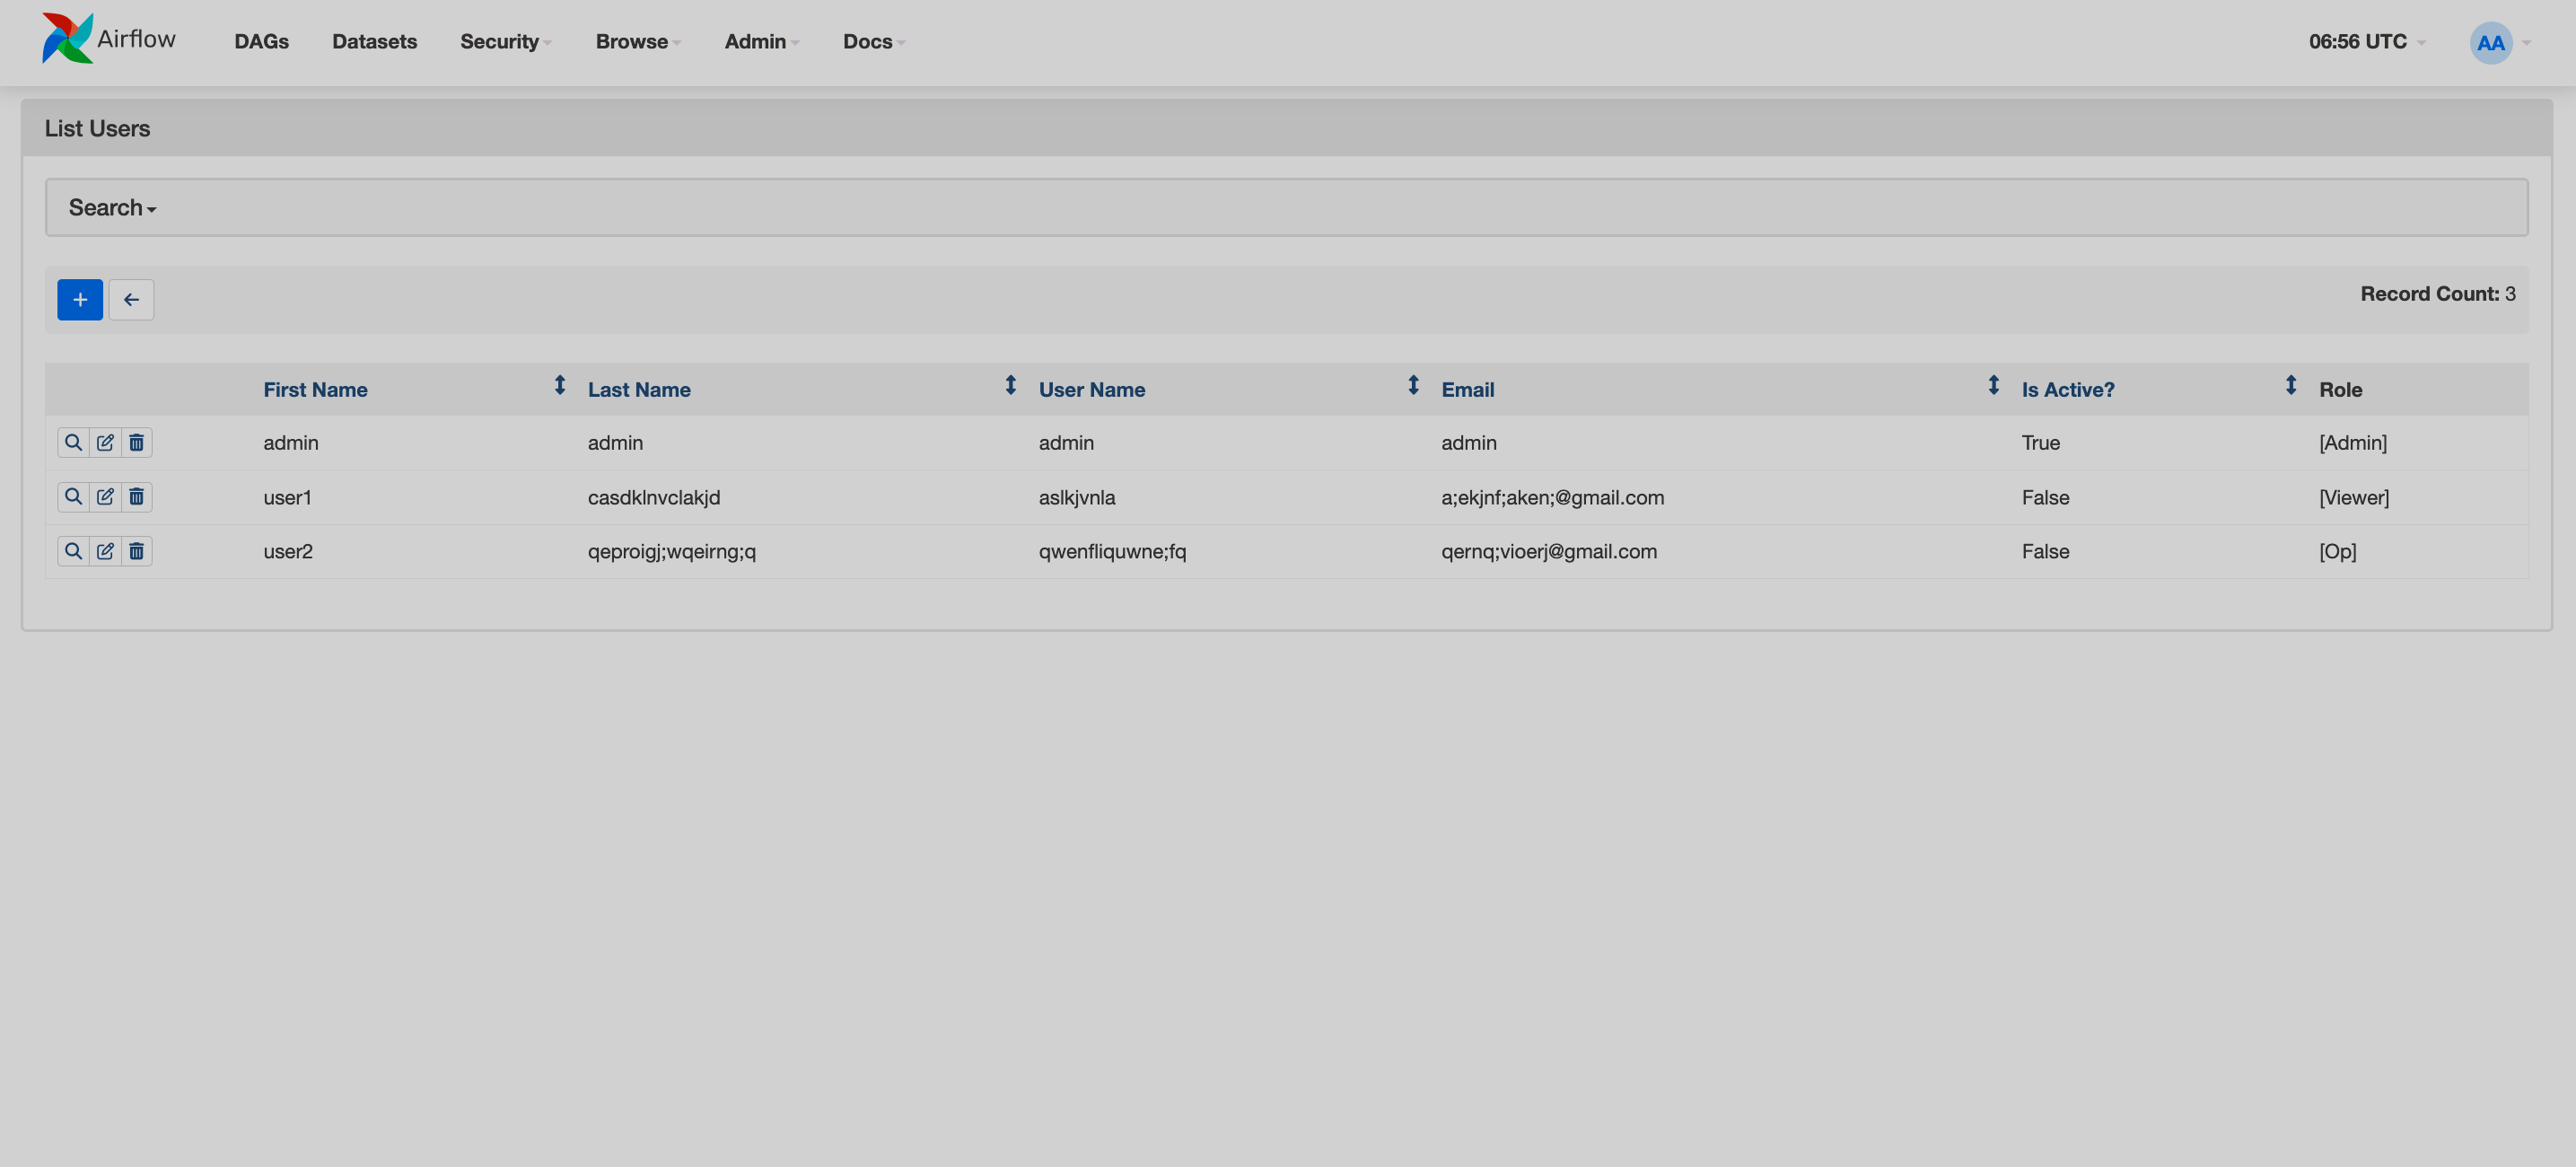
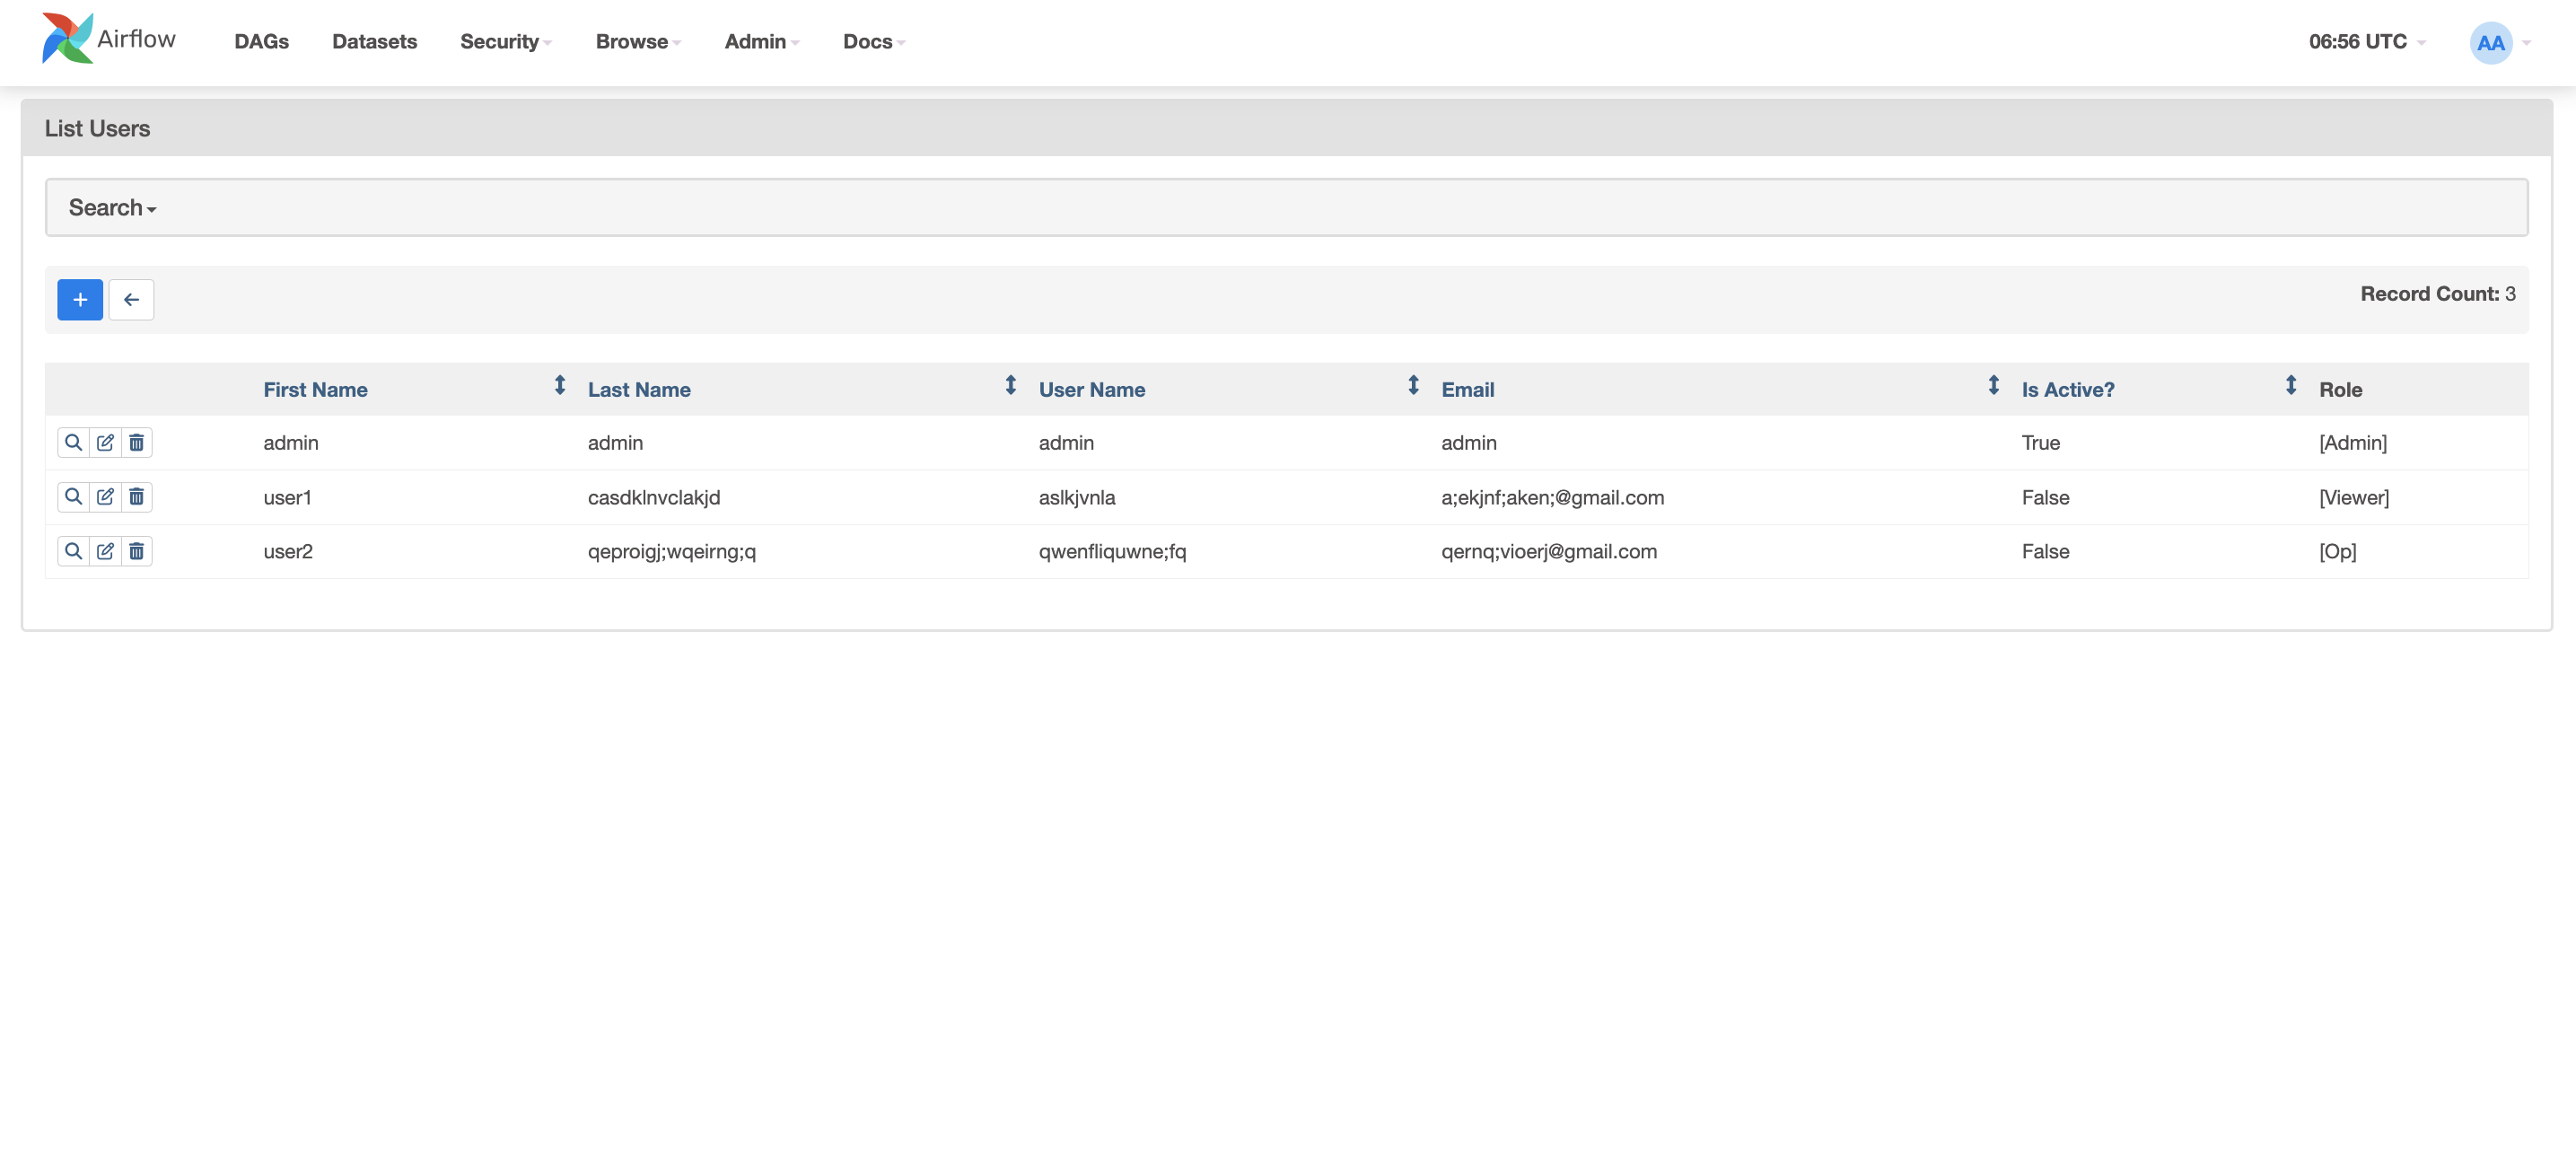
The List Users page displays a list of Airflow users. Each user has the following traits: first name, last name, user name, email, status, and role.
You can view, edit, or delete a user by selecting the corresponding action.
To add a user, click the plus sign and enter the user’s parameters.
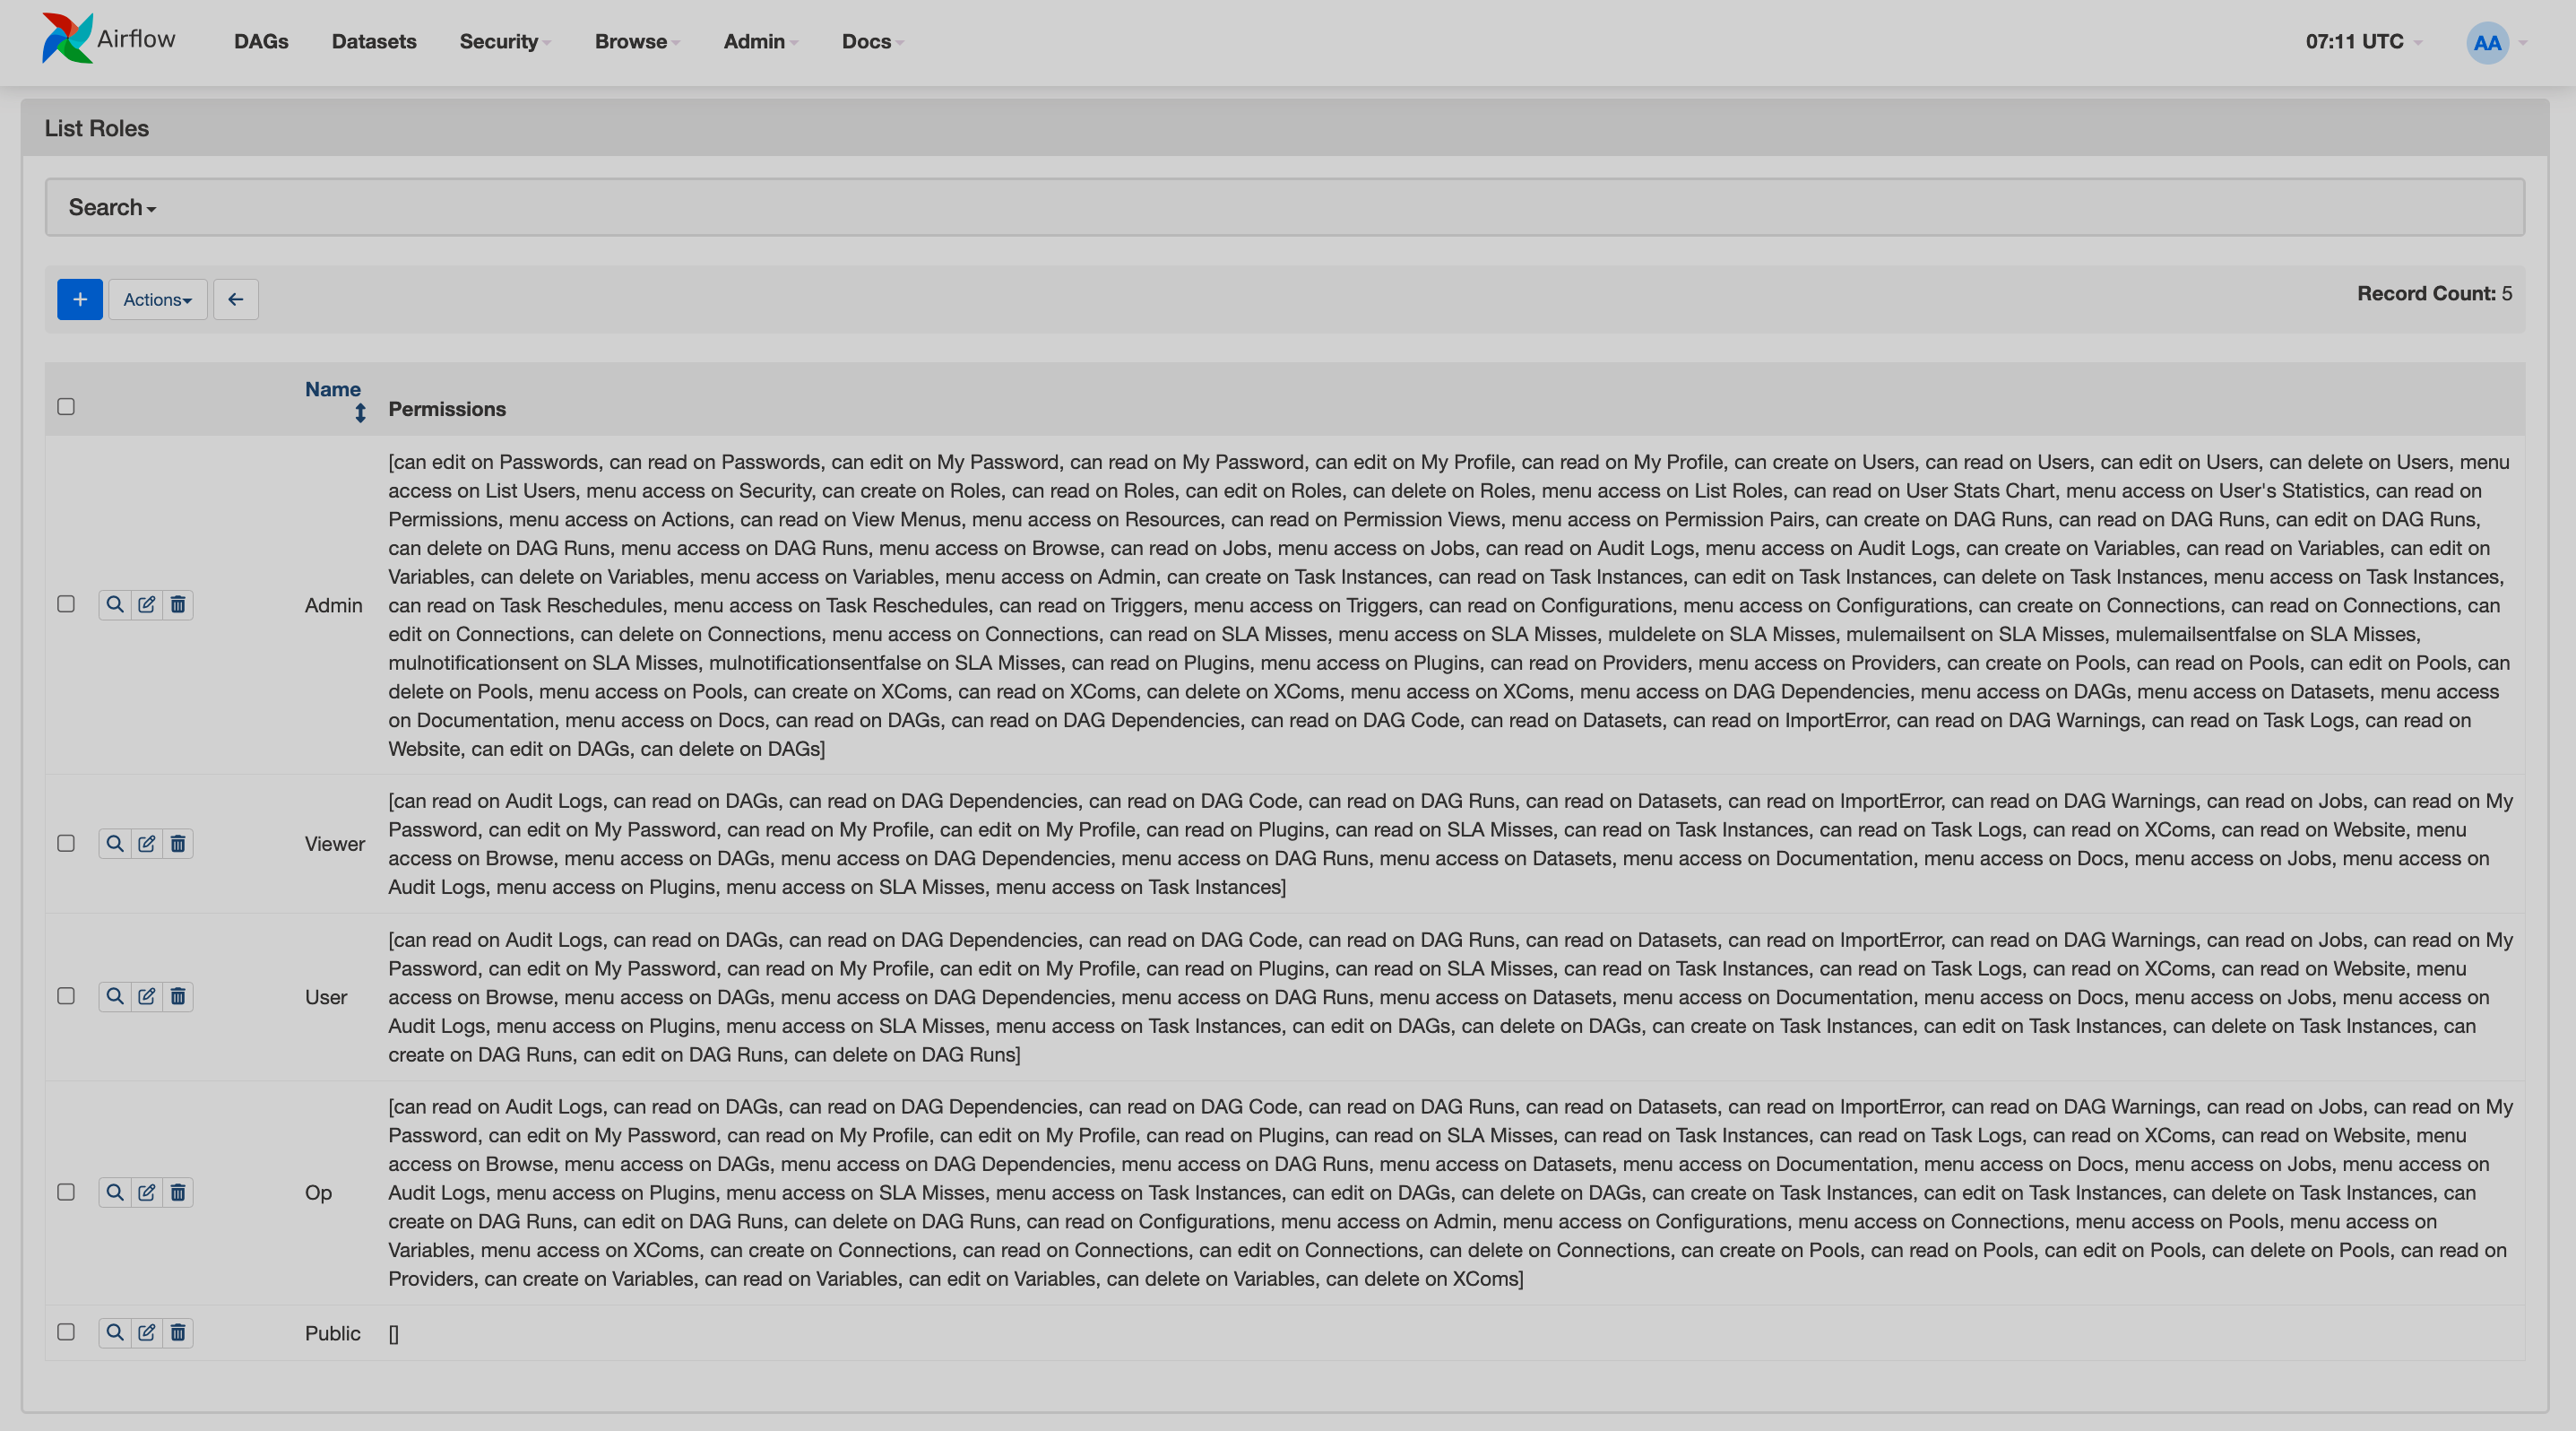
The List Roles page displays a list of user roles. Each role has a name and a list of permissions given to that role.
You can view, edit, or delete a role by selecting the corresponding action.
To add a role, click the plus sign and enter the role’s name and its permissions.
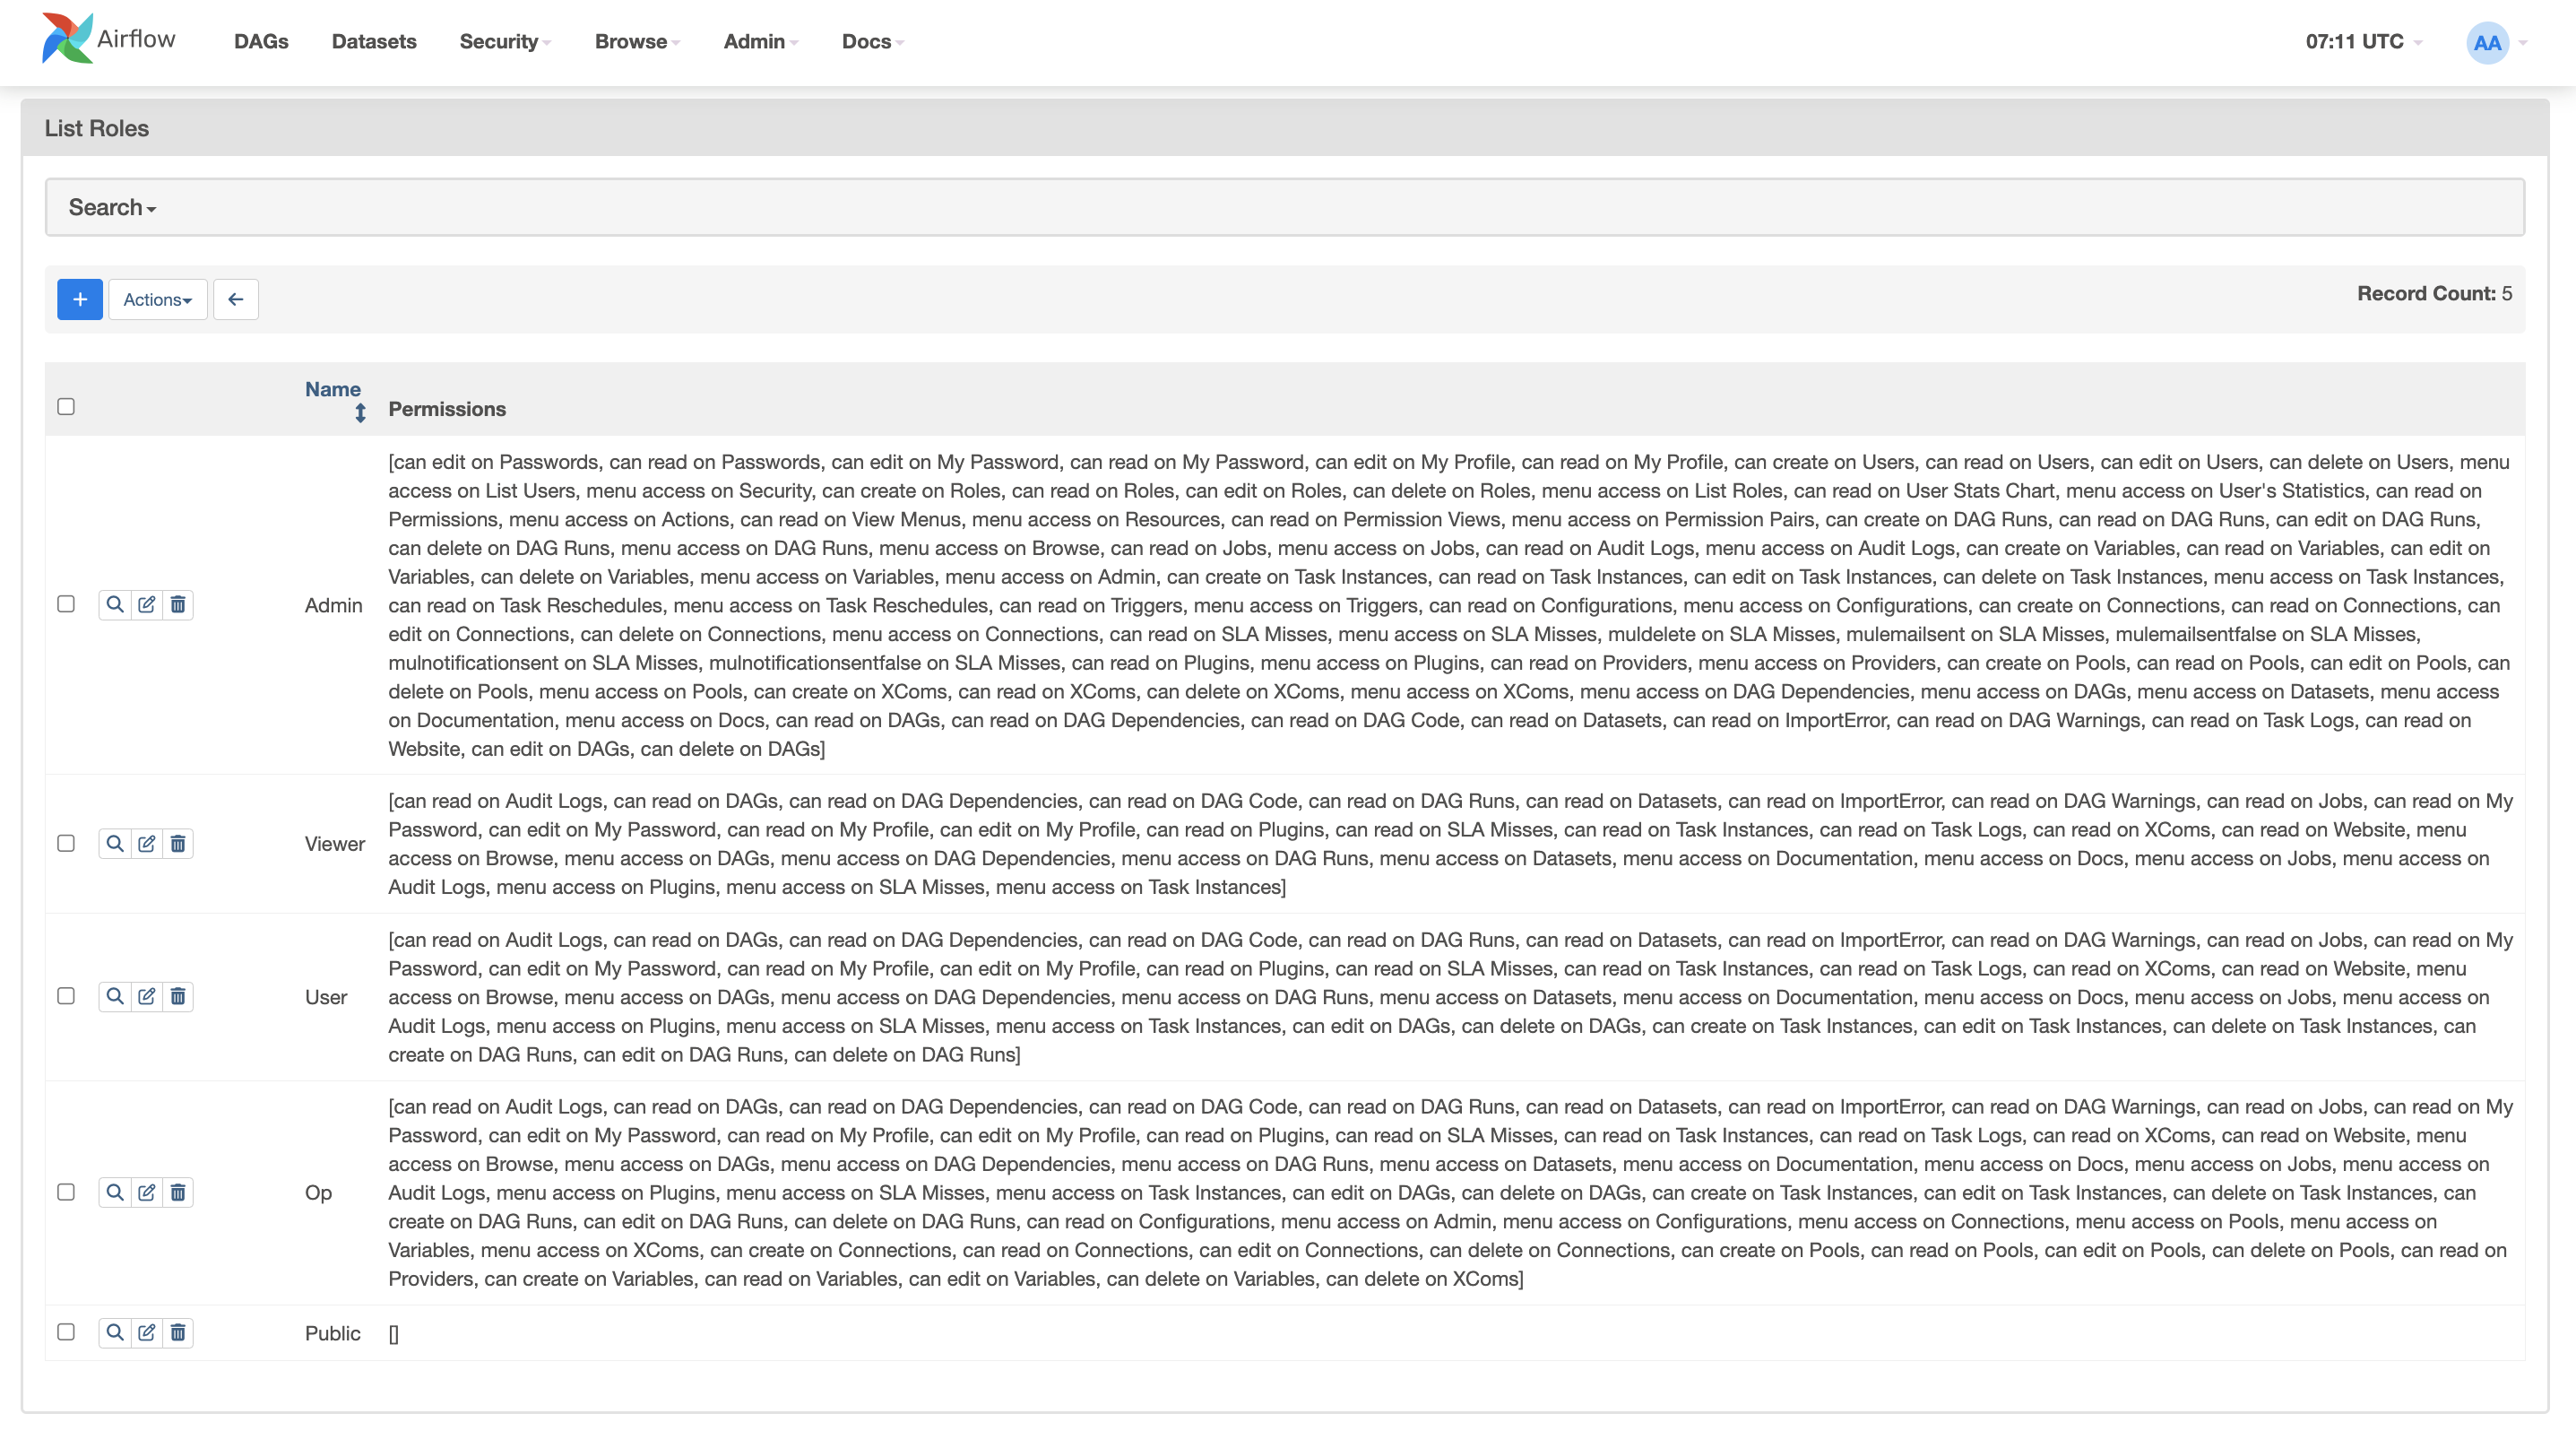
The User’s statistics page displays a chart of users' login counts. You can change the view by selecting either login counts or failed login attempts.
-
The Actions page displays a list of actions that can be granted to a user.
-
The Resources page displays a list of resources to which you can give access.
-
The Permissions page displays a list of actions that can be granted for a particular resource.
Browse
The Browse menu provides a set of pages with lists that allow you to control several entities at once.
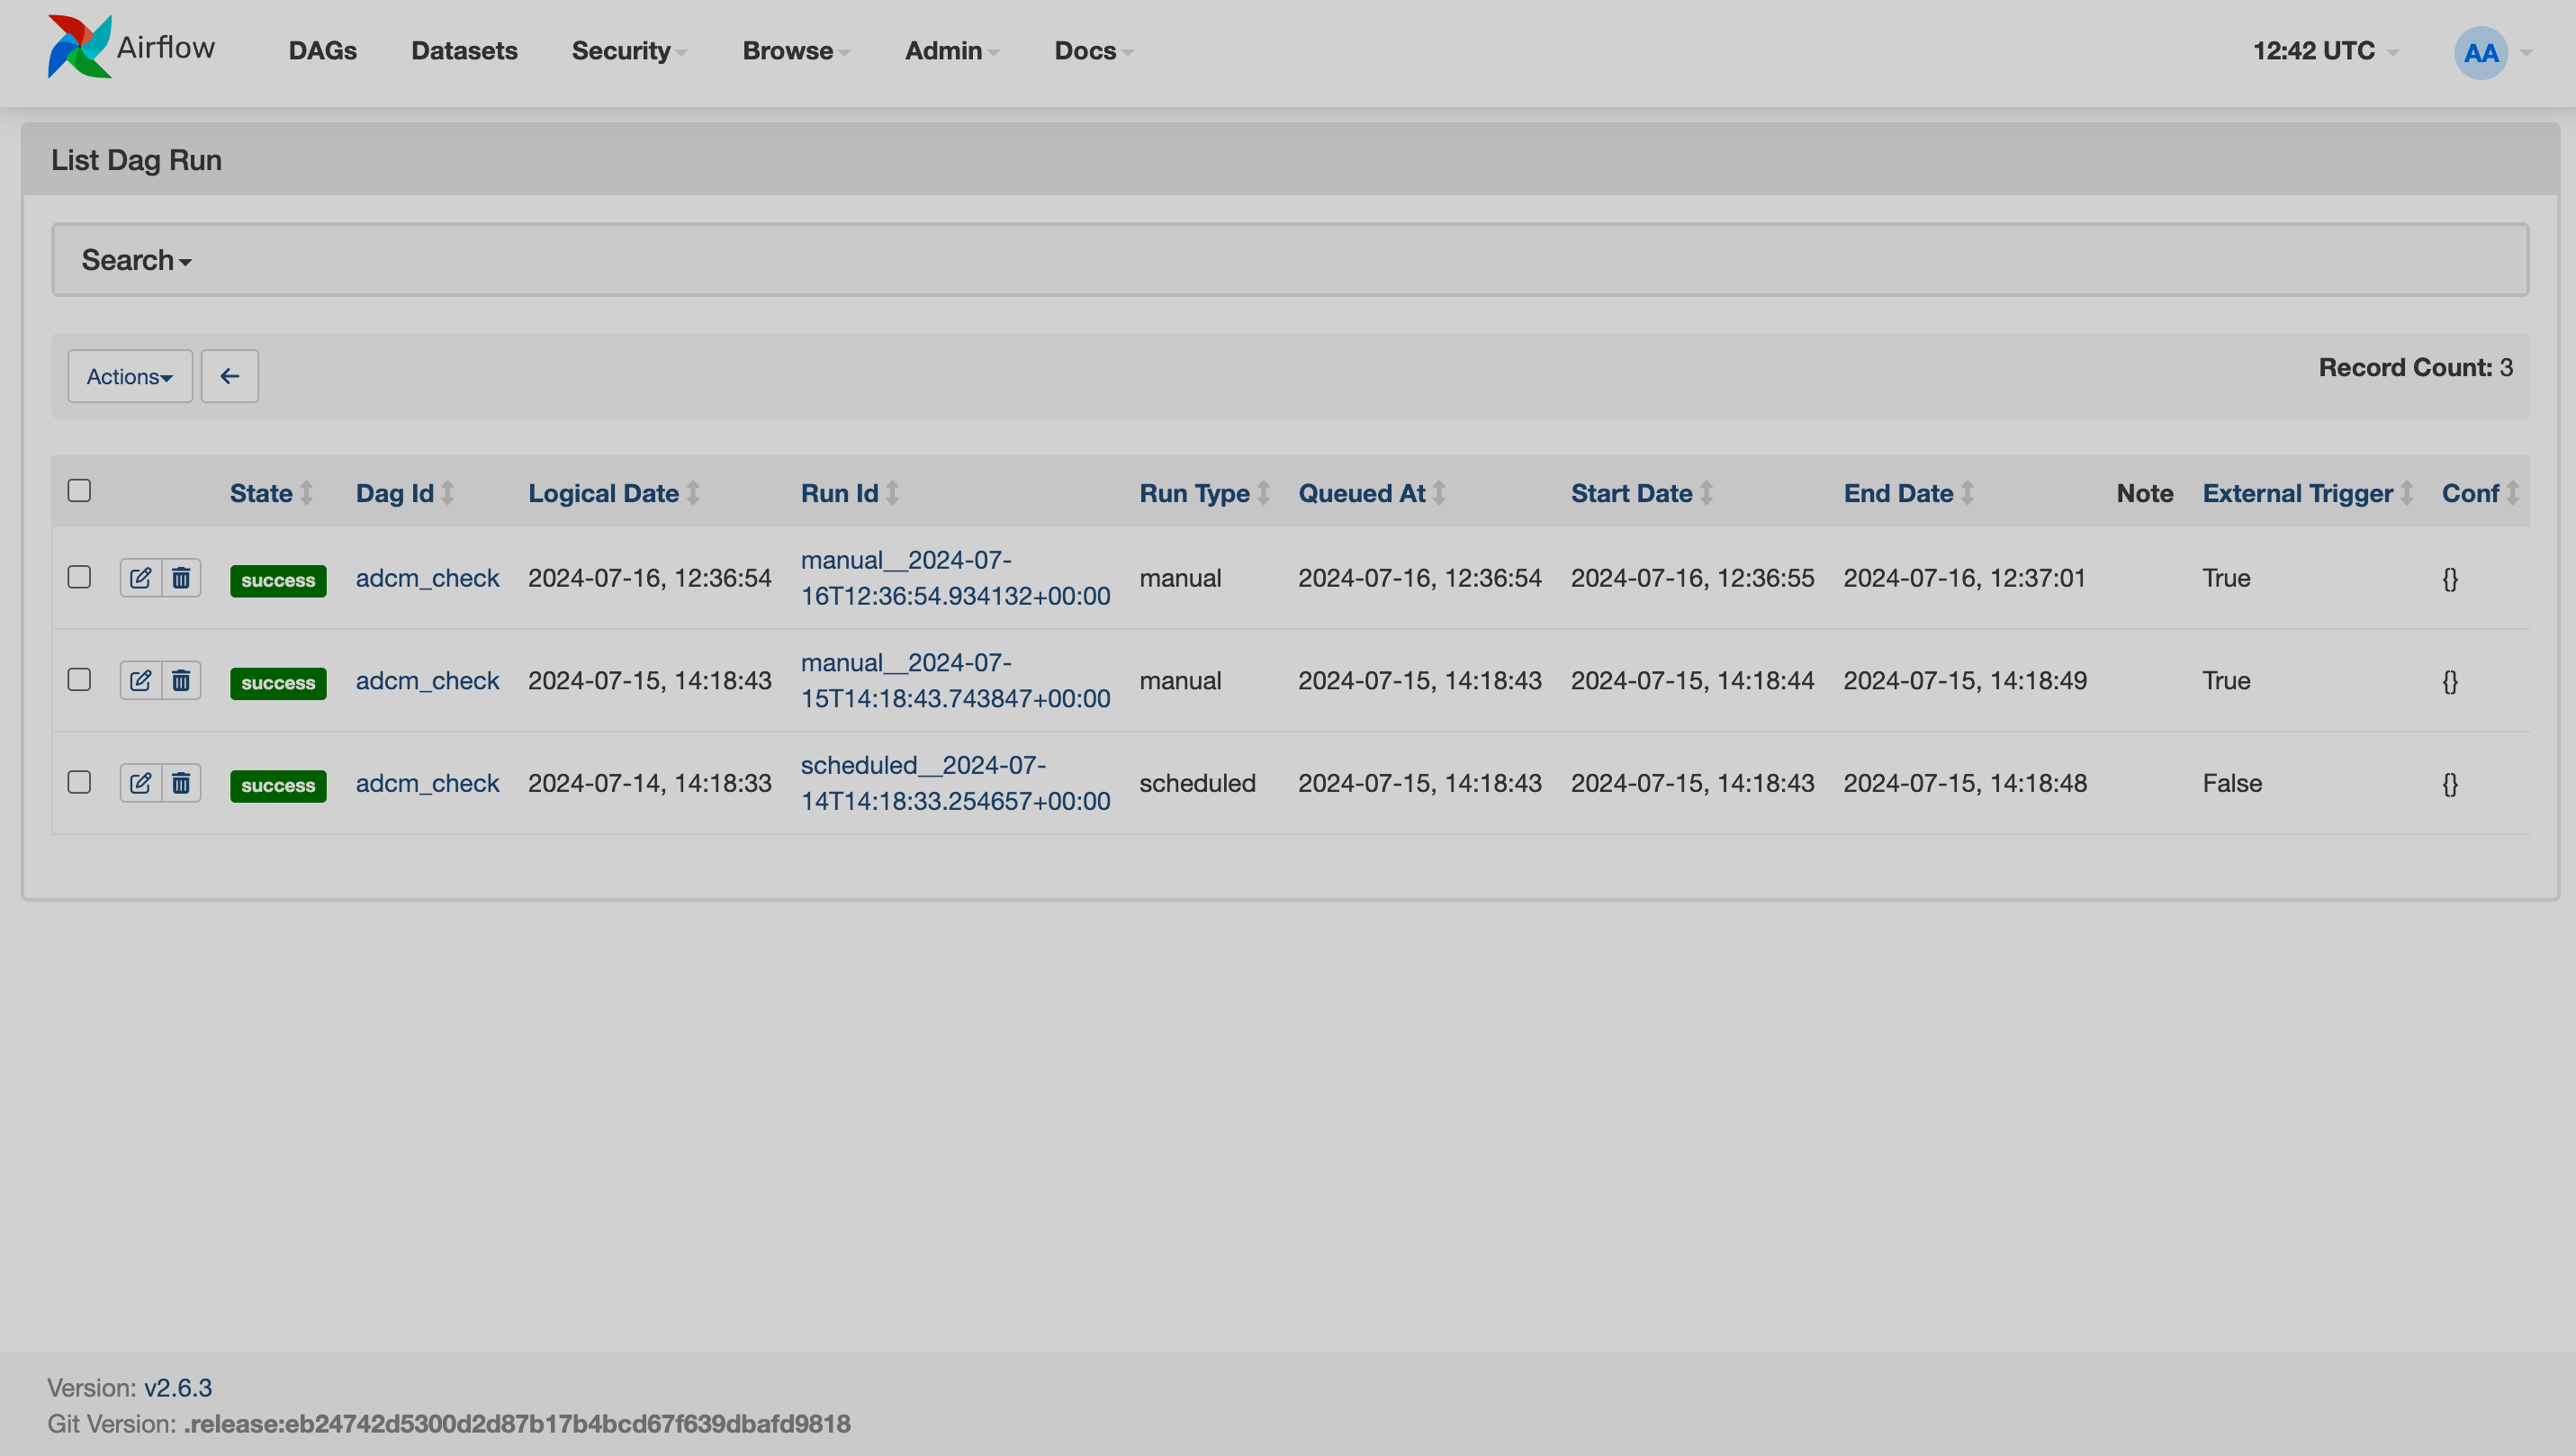
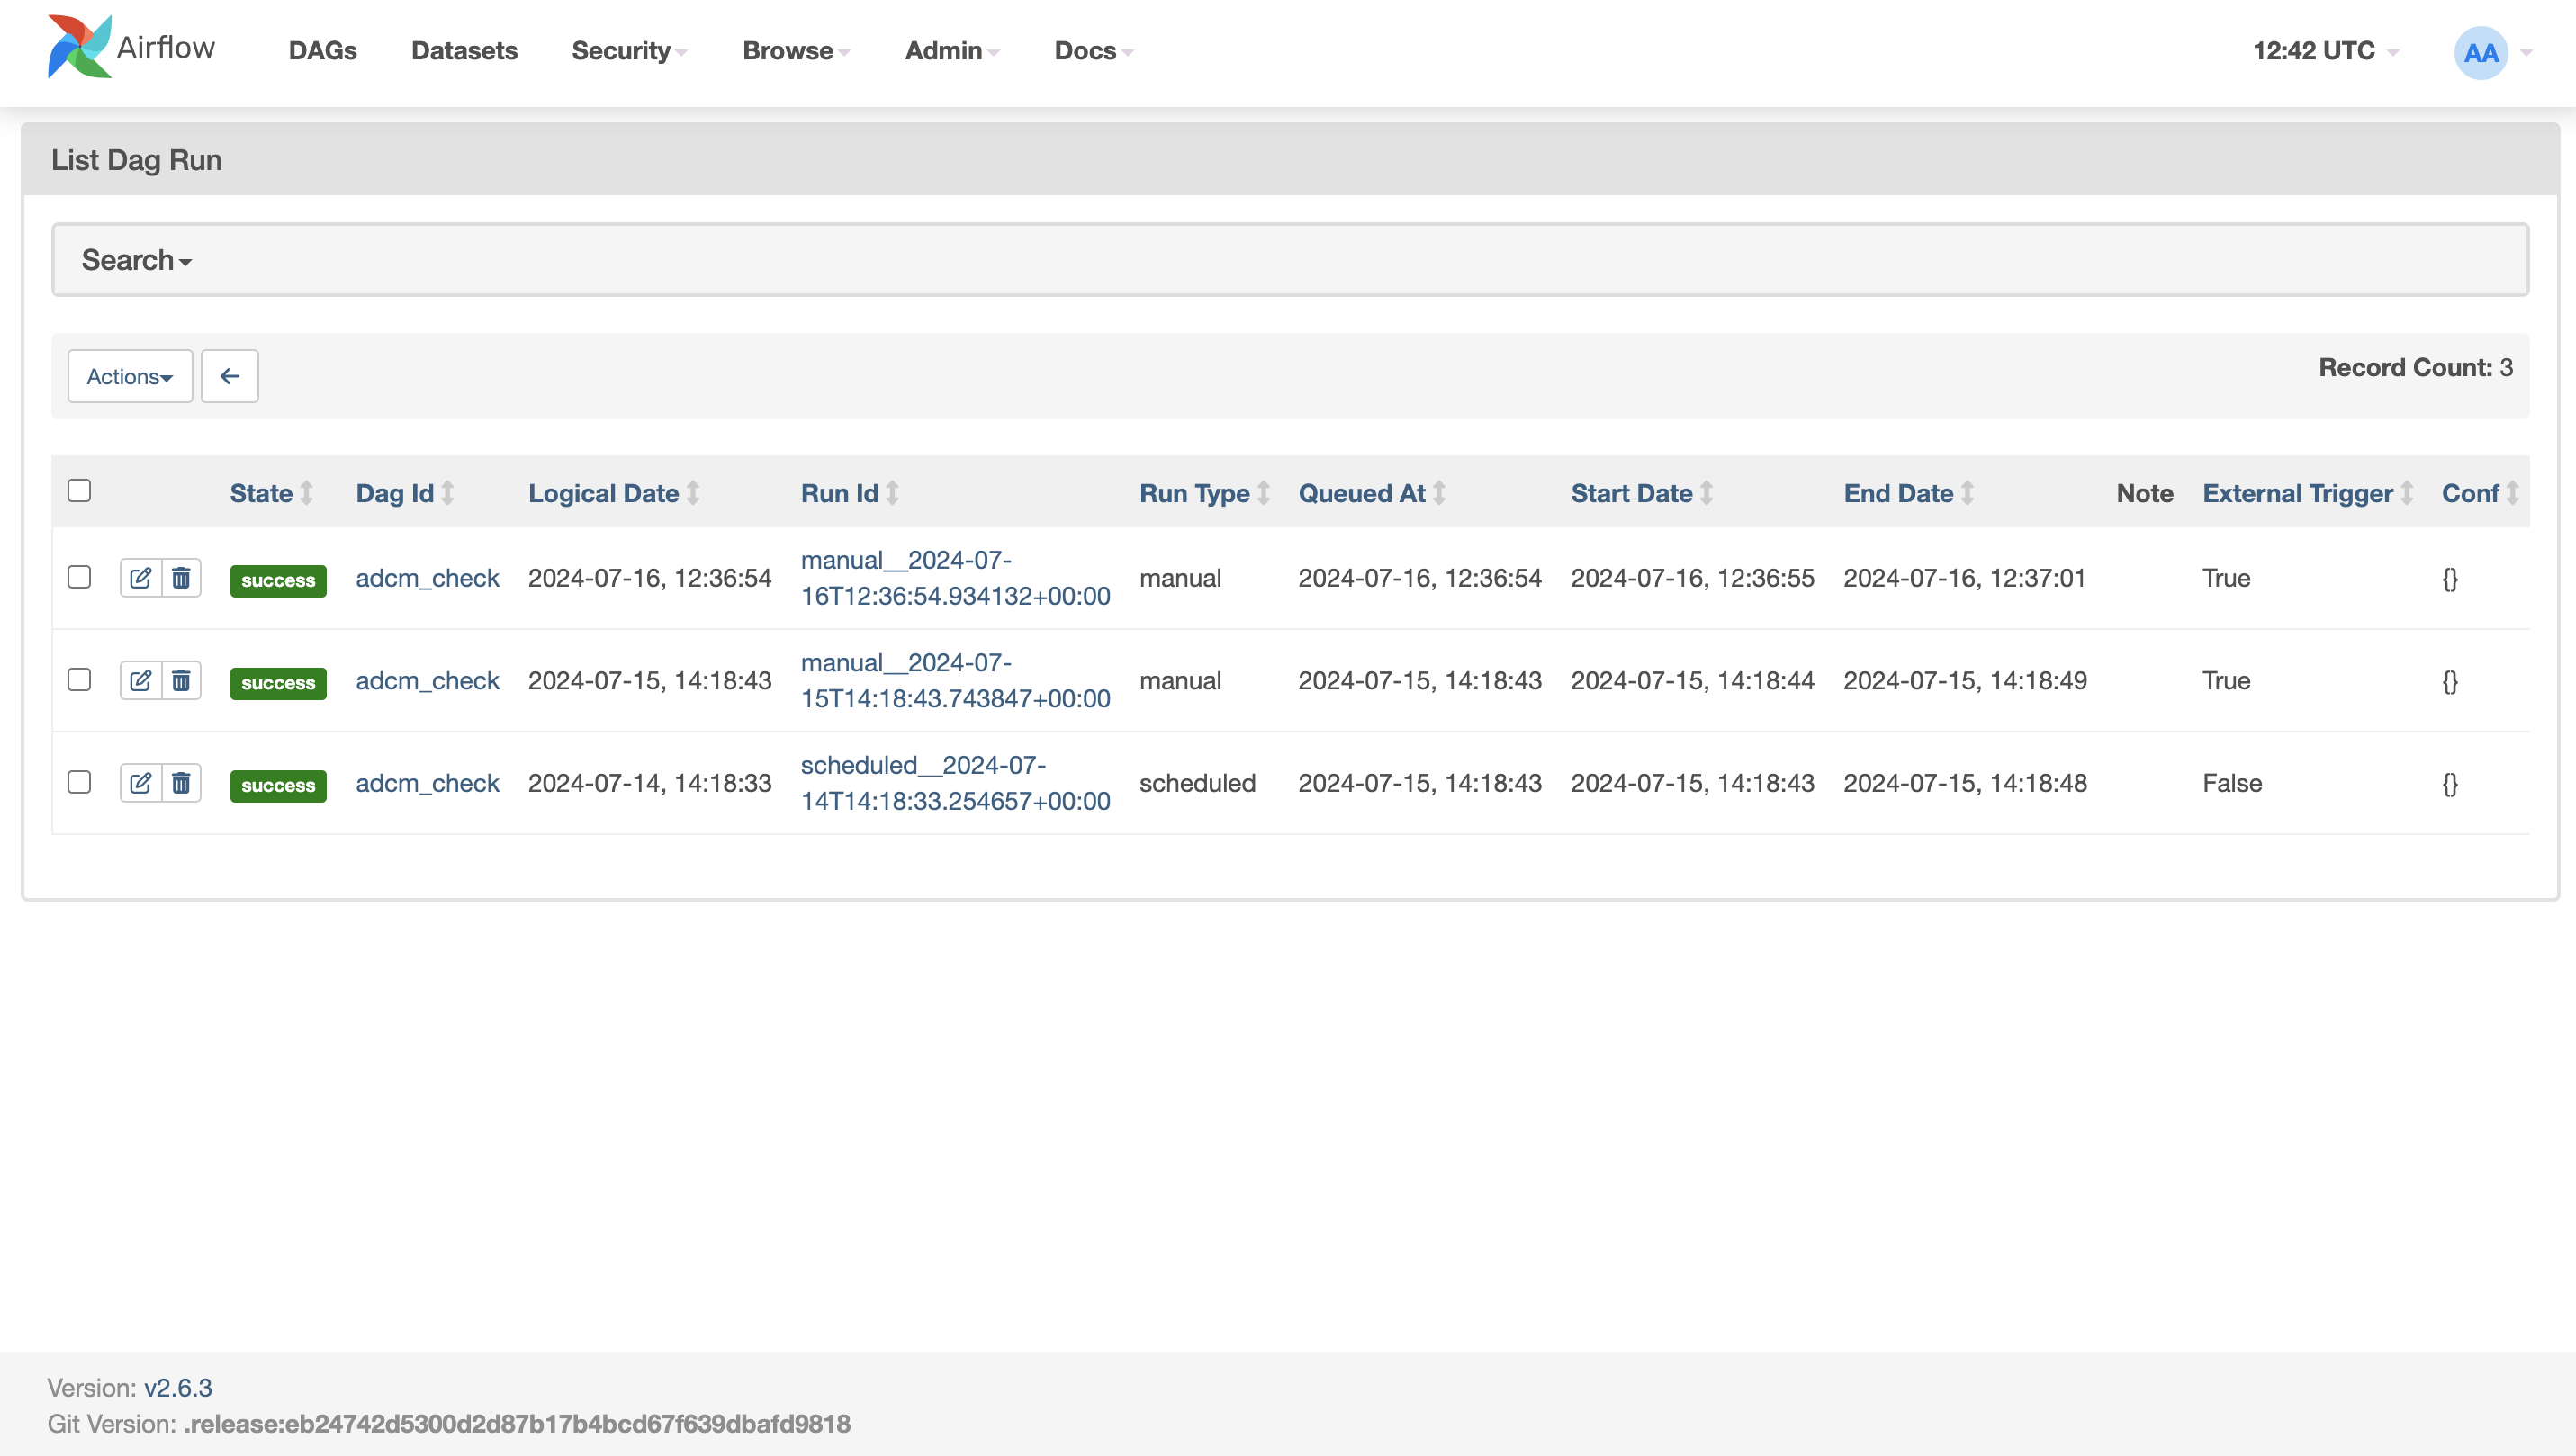
The DAG Runs page displays a list of all DAG runs.
You can manage several DAGs at once by picking the necessary DAG runs and selecting a common action for them.
By clicking on the Dag Id or Run Id of a specific DAG run, you can navigate to that DAG’s page.
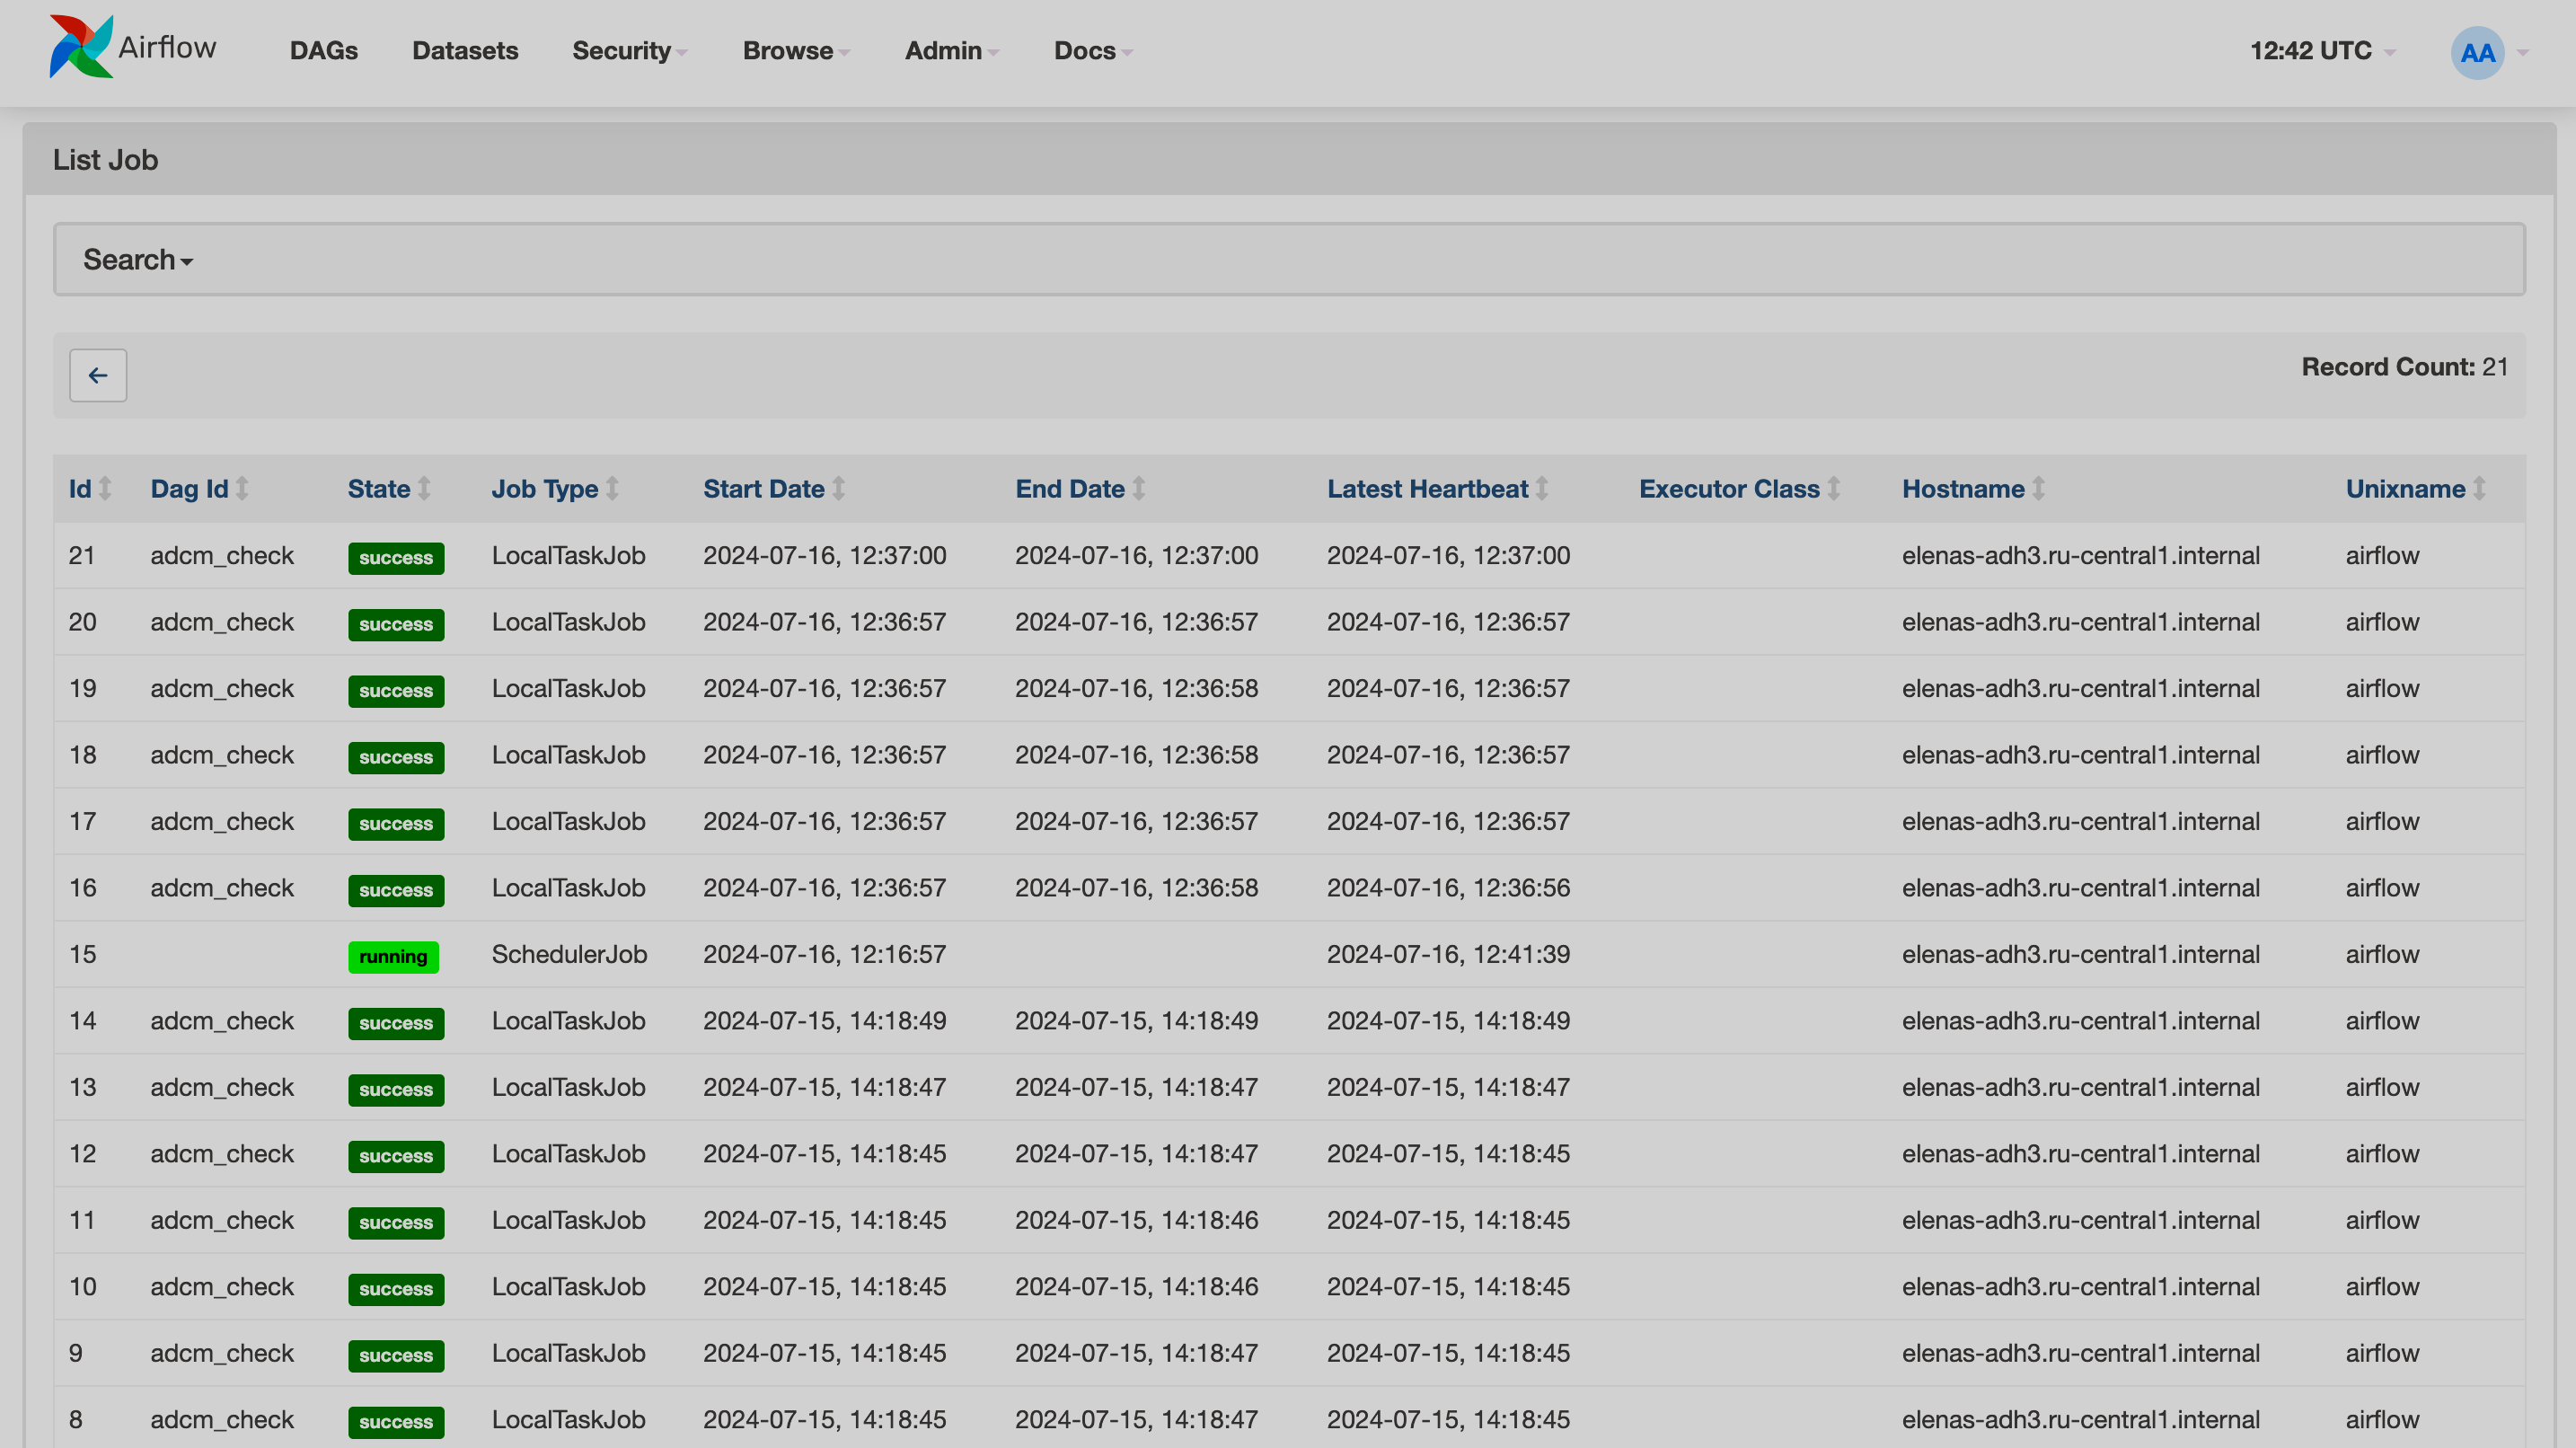
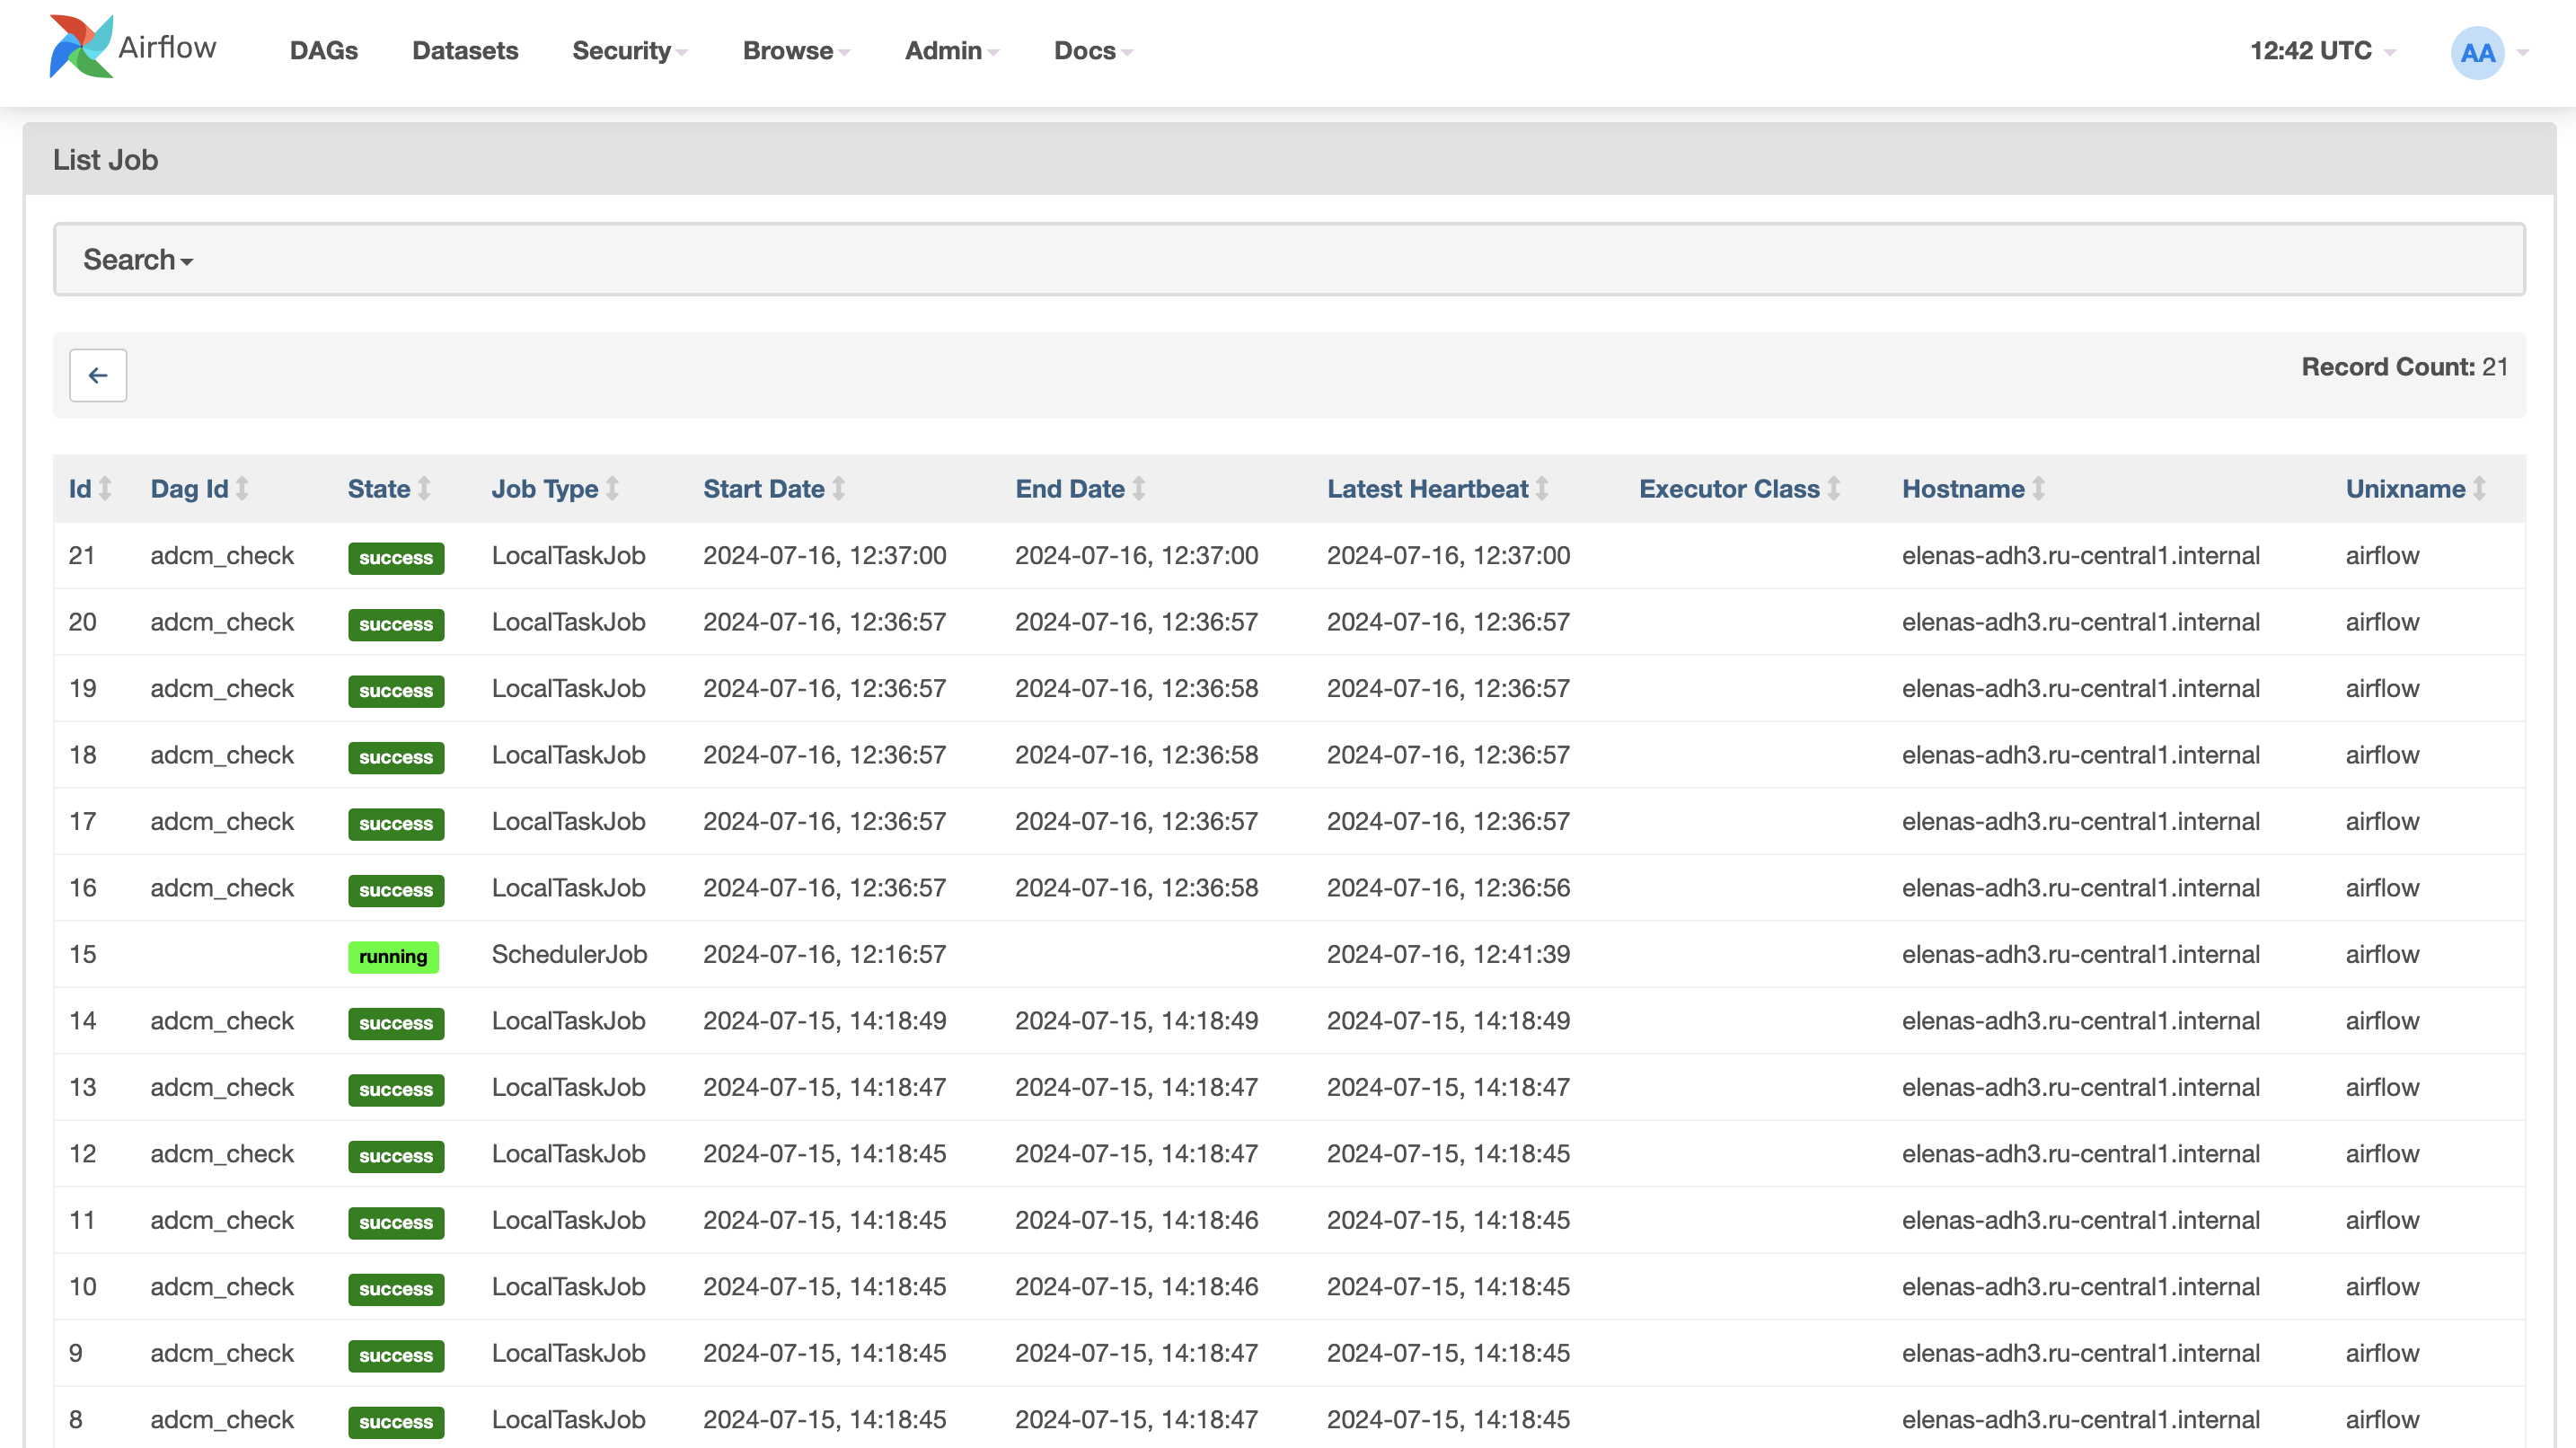
The Jobs page displays a list of all jobs with information about their DAGs, current state, start and finish dates, latest heartbeat, executor class, hostname, and unixname.
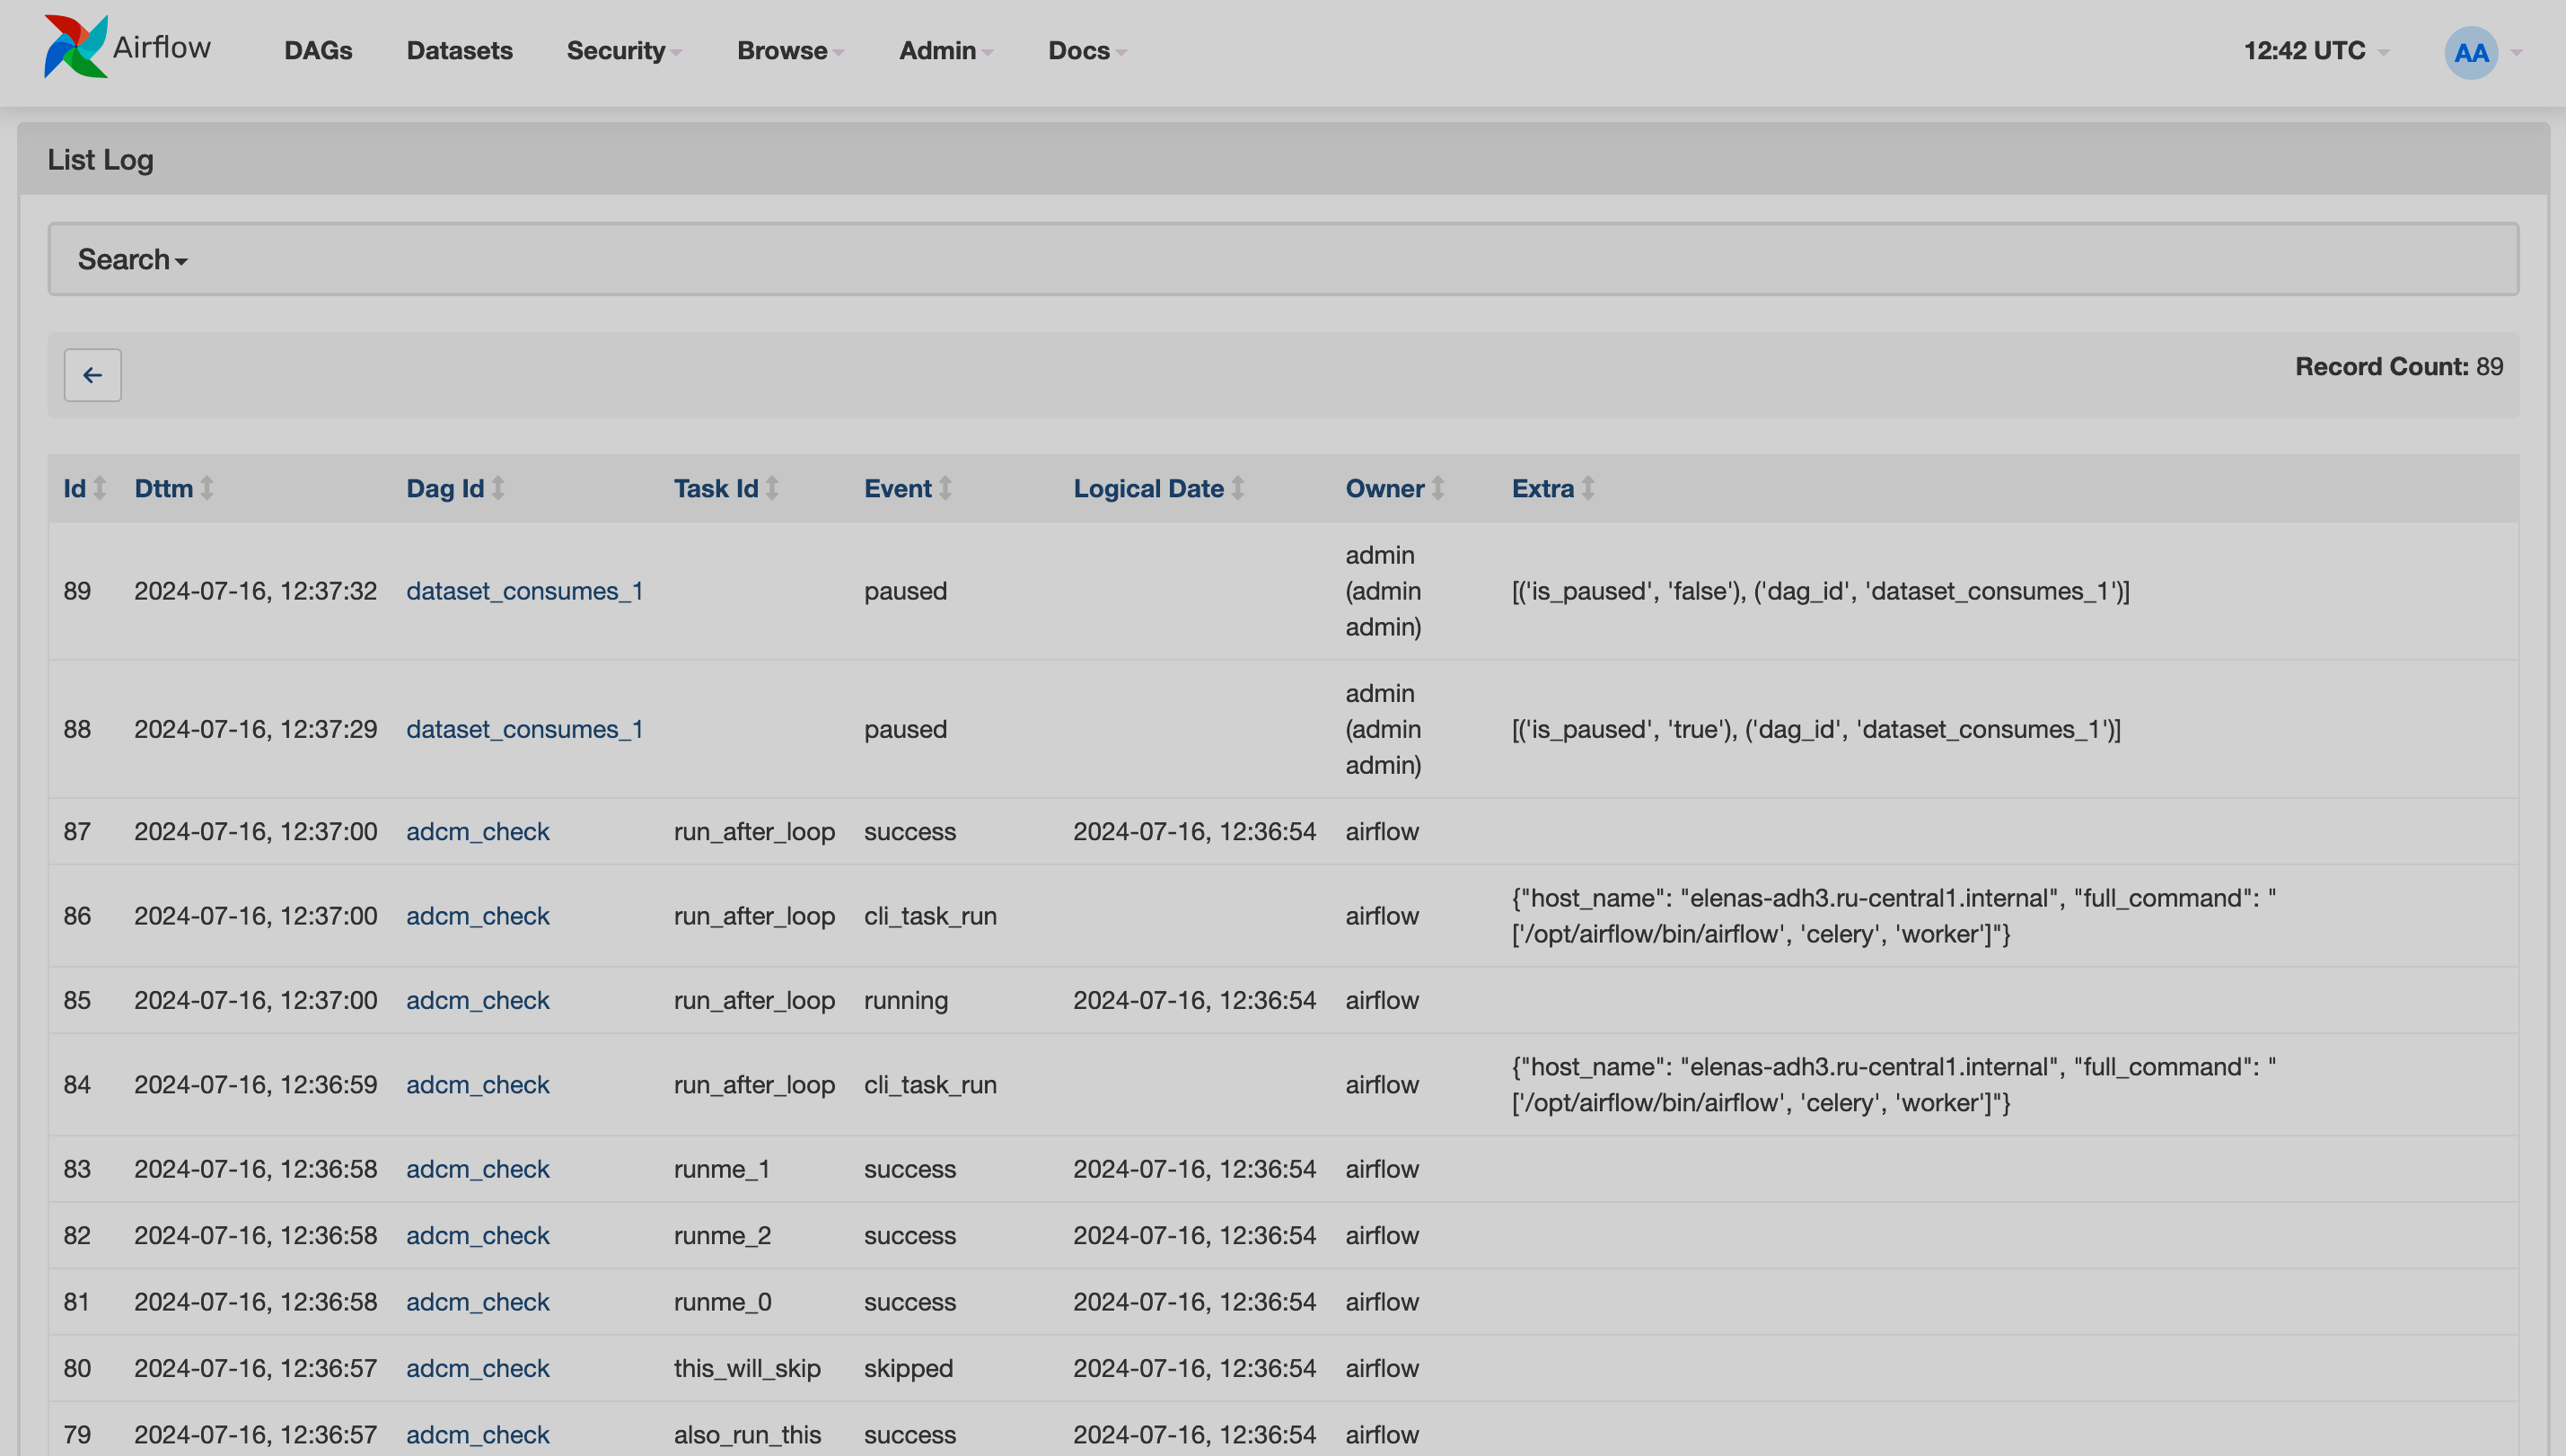
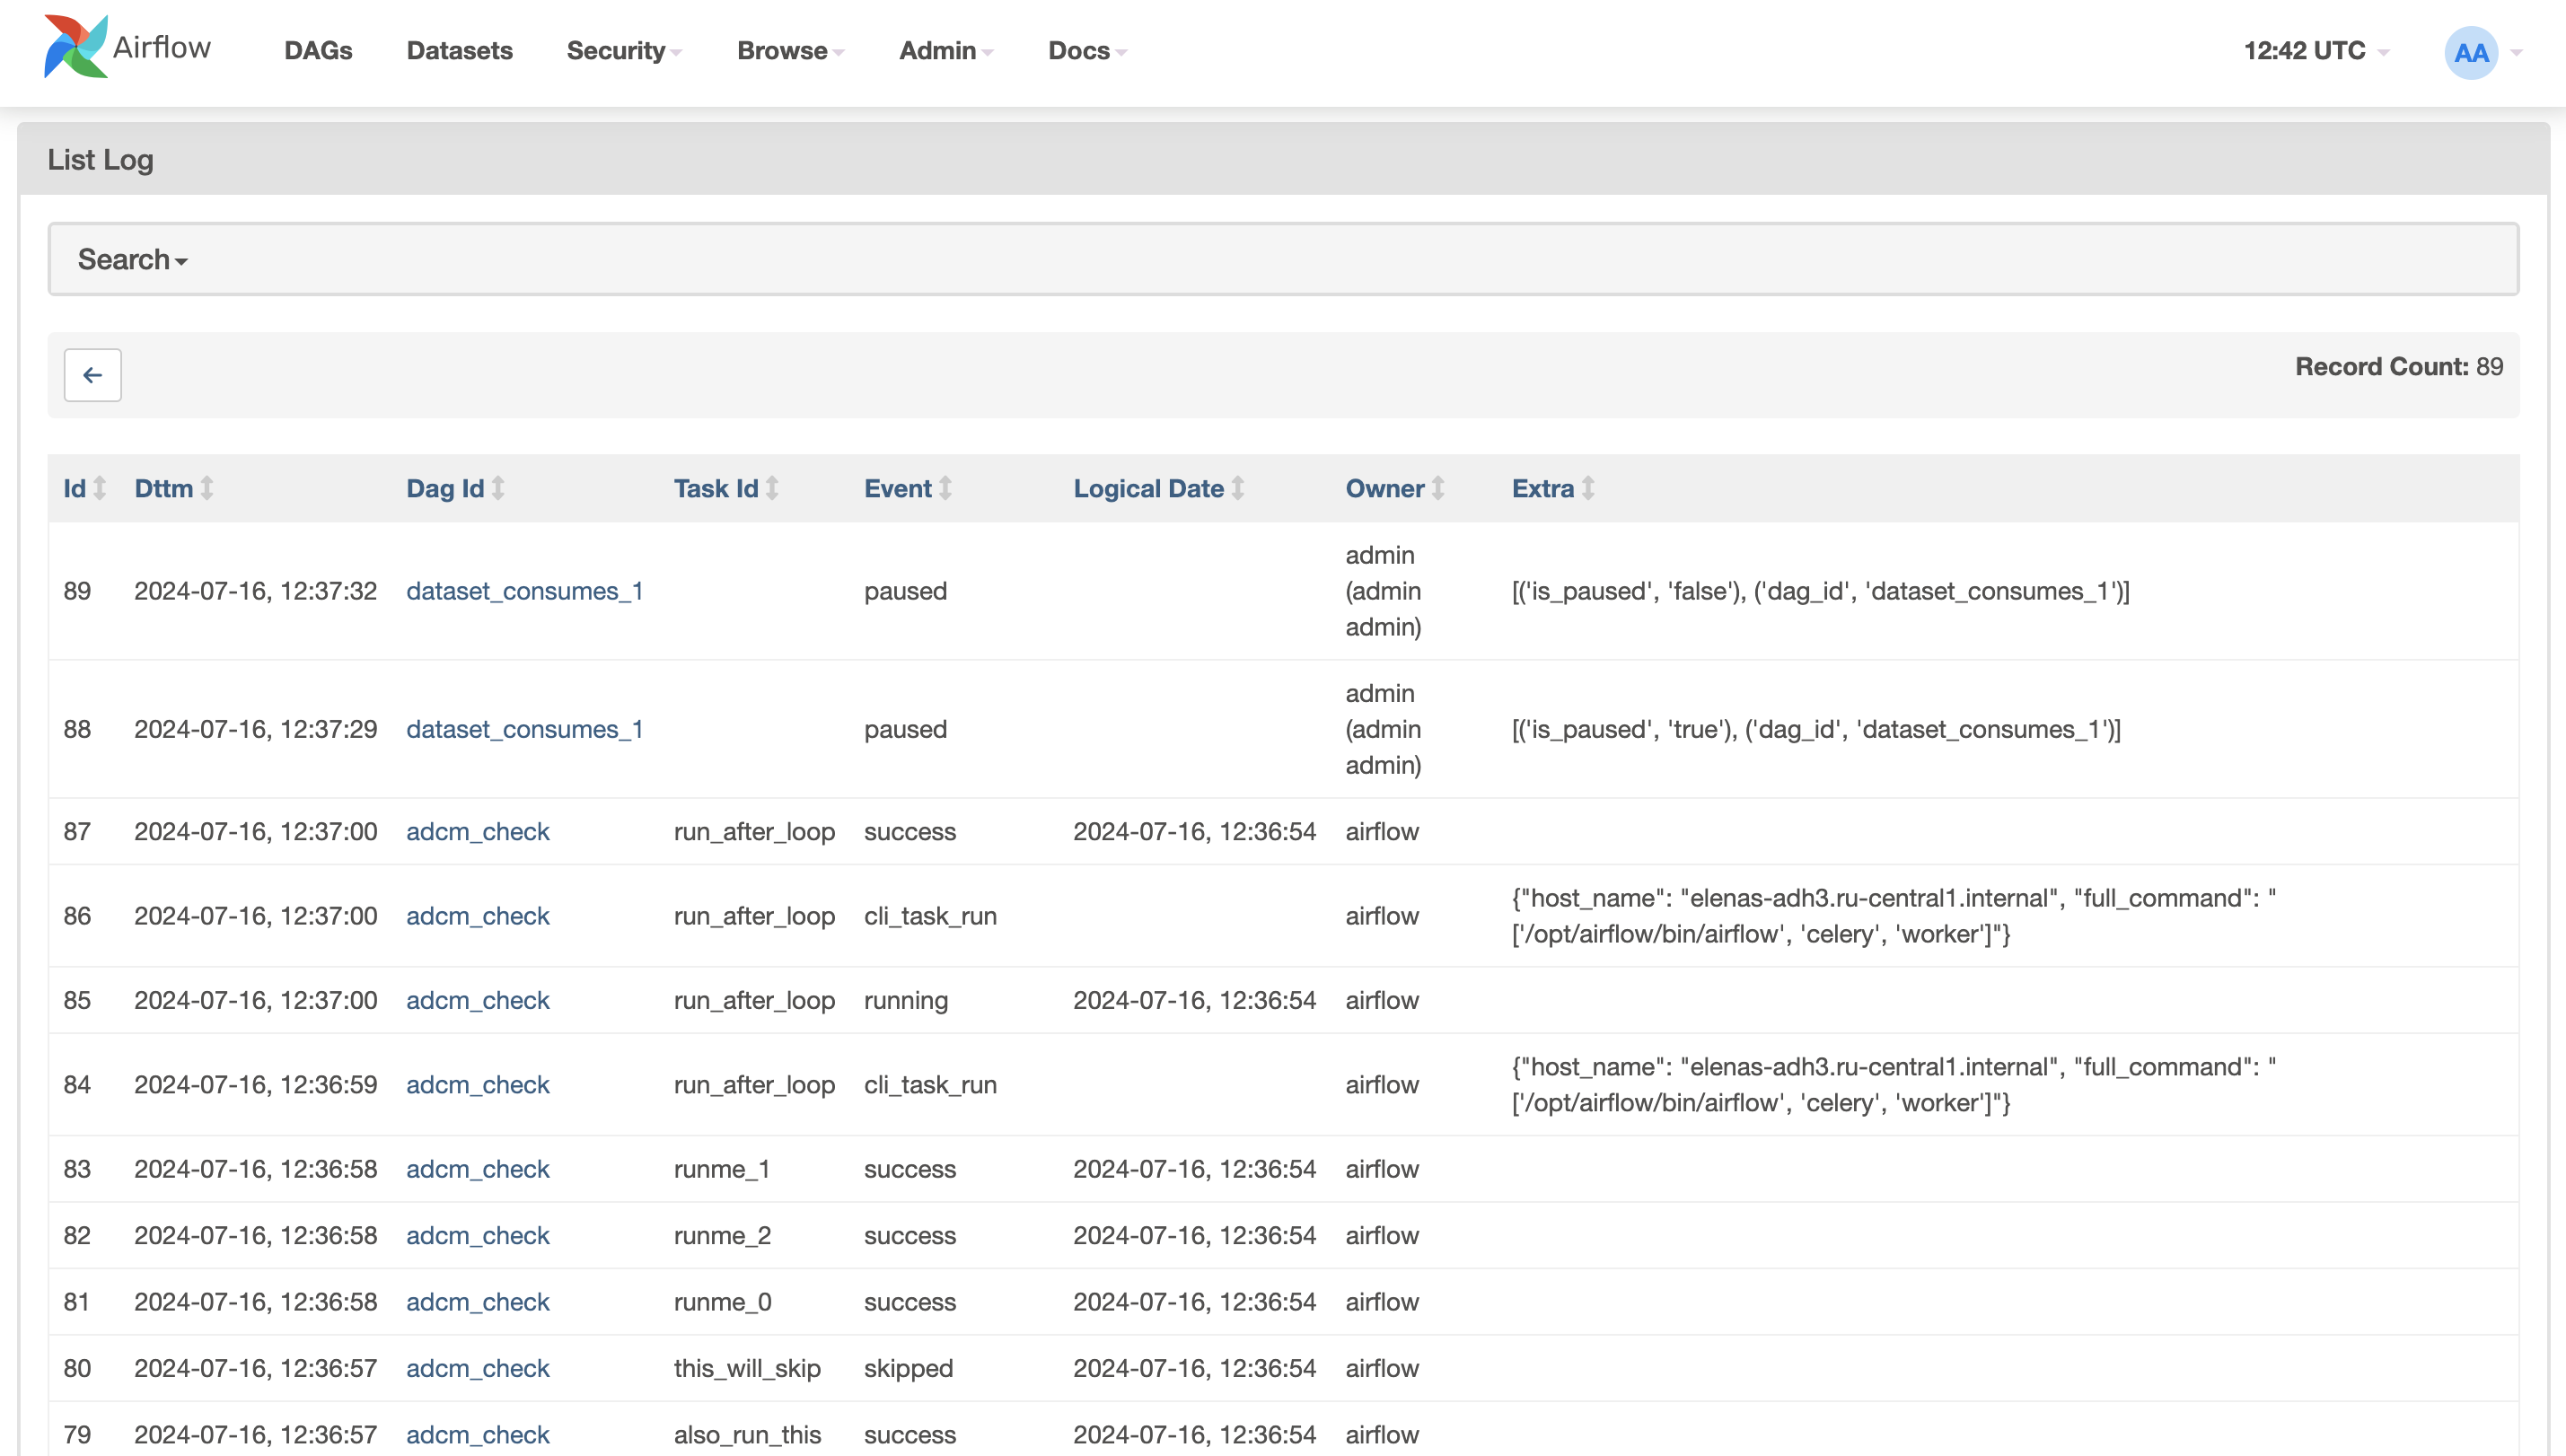
In Airflow, audit logs are used to track user actions and system events that occur during the execution of DAGs and tasks.
The Audit Logs page provides information about the events triggered by DAG runs or users.
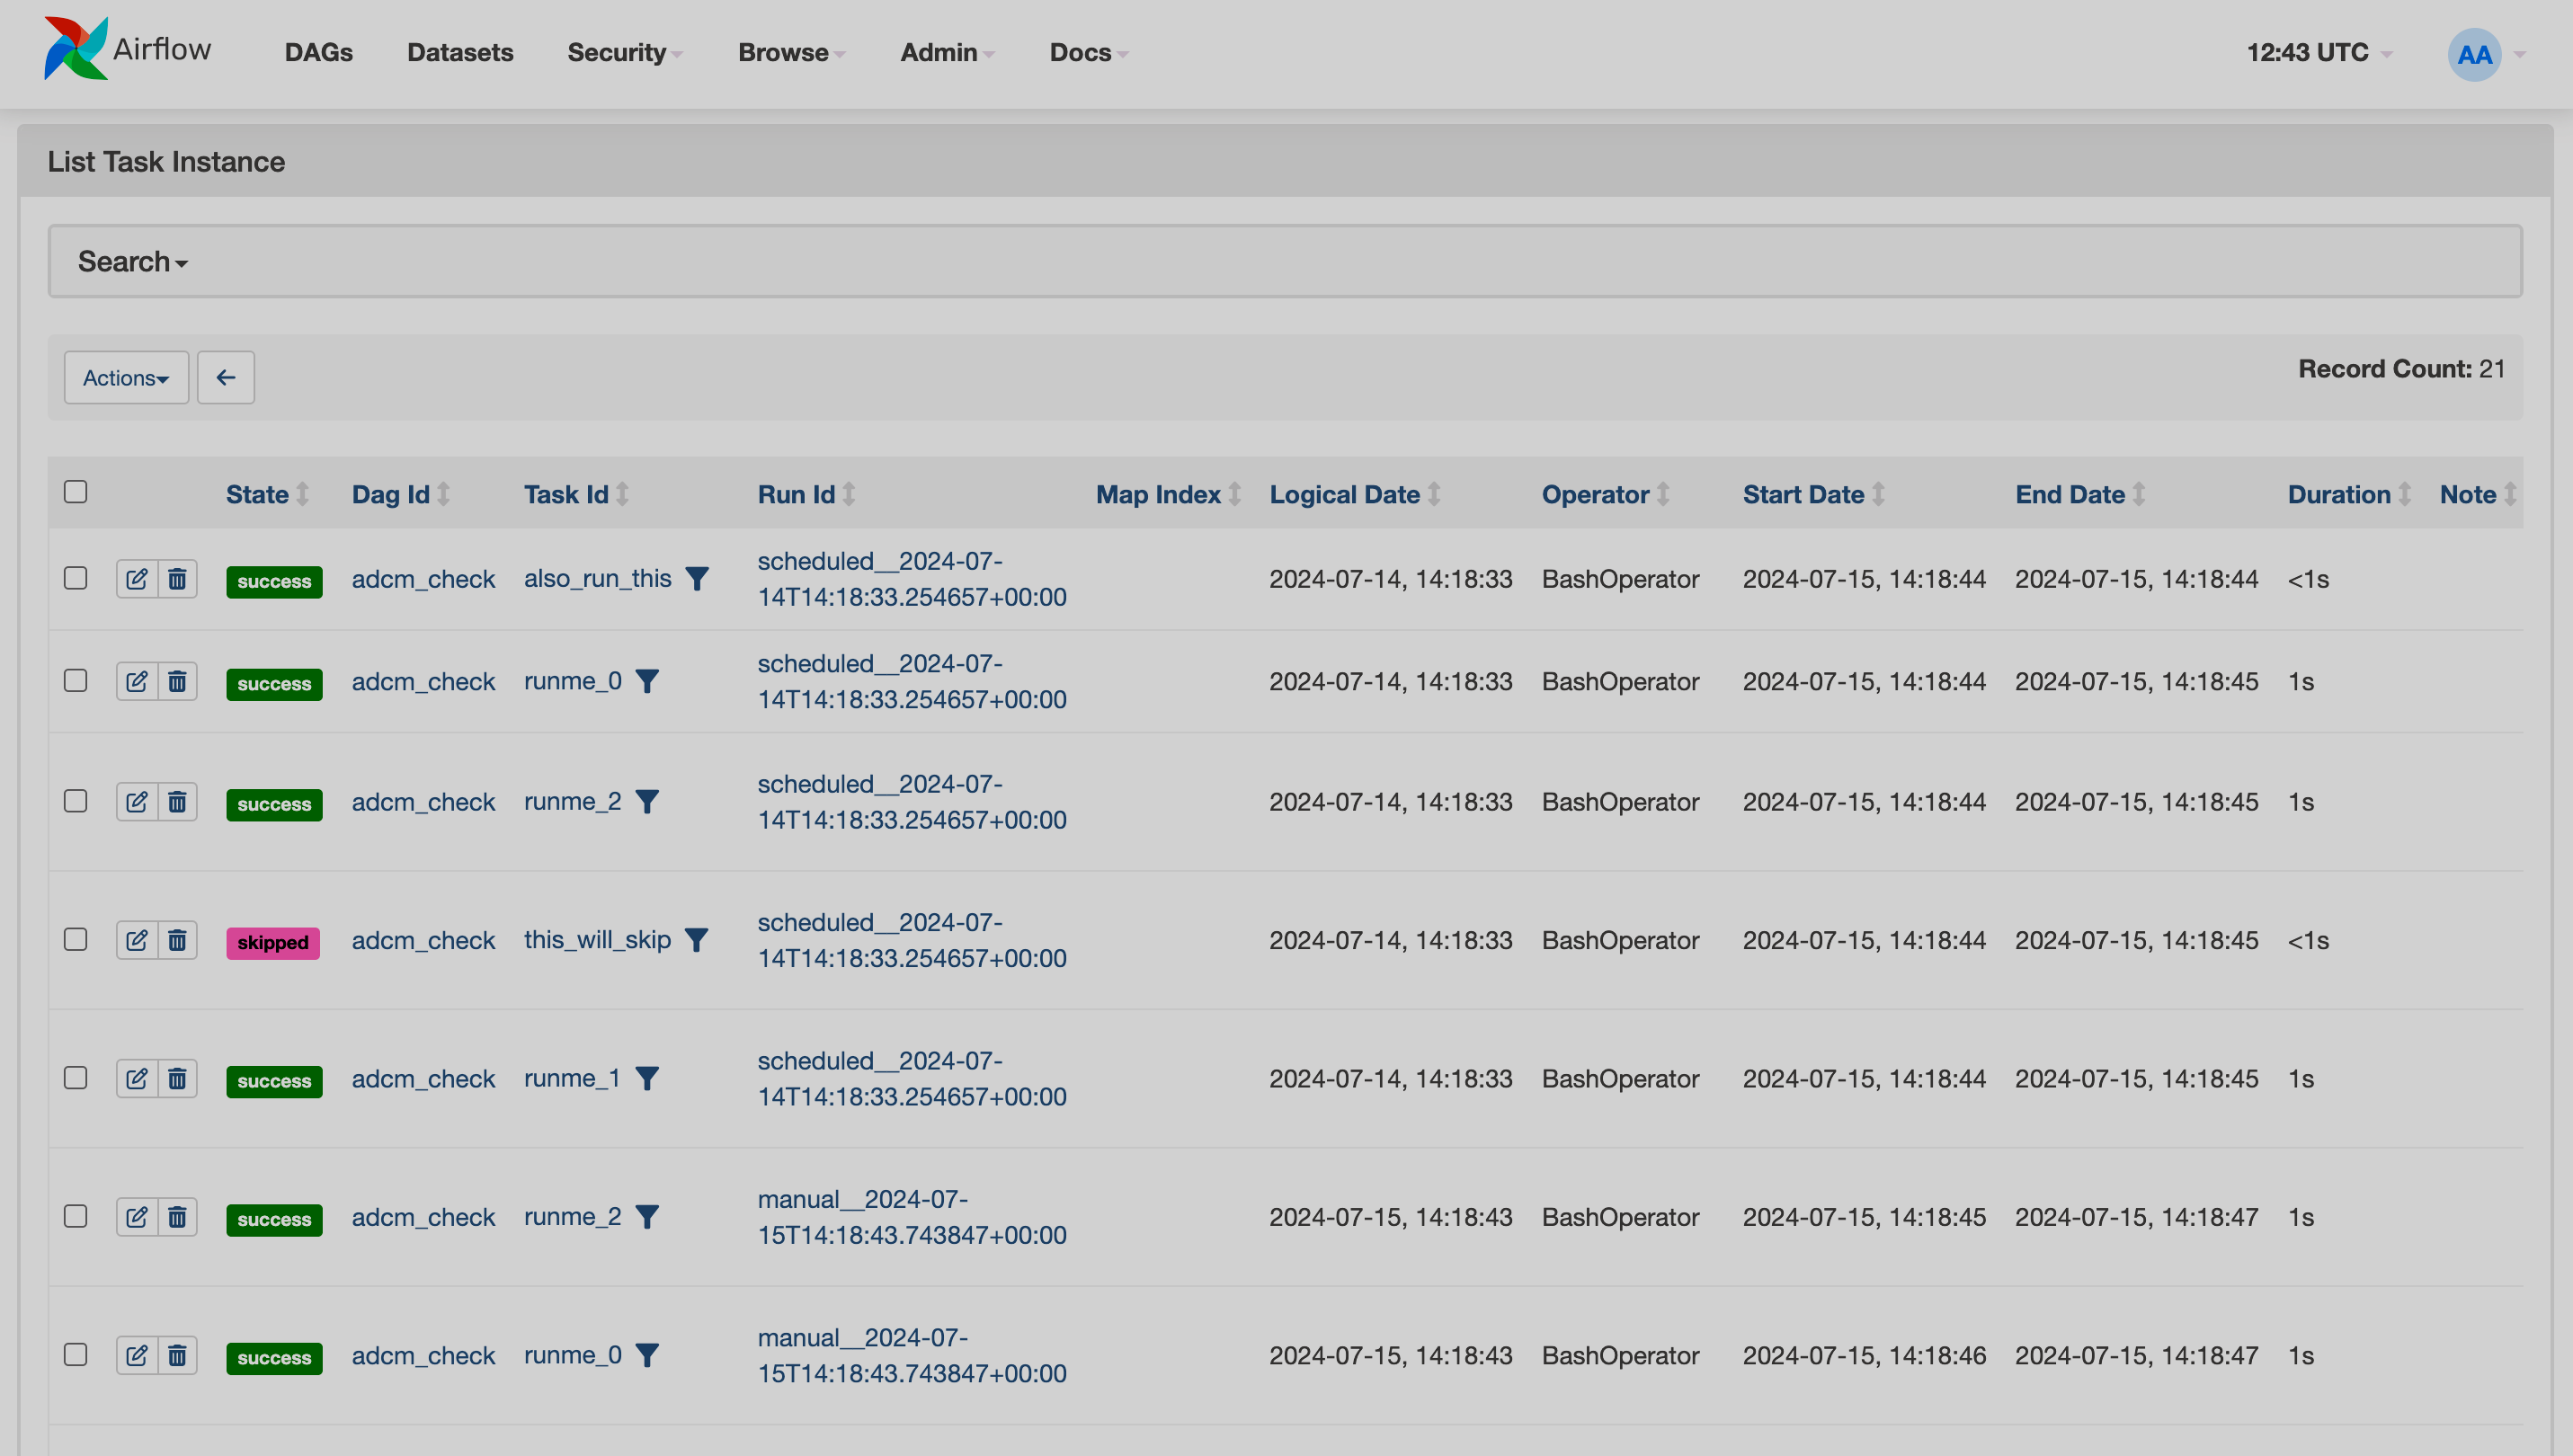
The Task Instances page provides information about each task: their DAGs, start and finish times, and more.
You can manage several tasks at once by picking the necessary tasks and selecting a common action for them.
By clicking on the Dag Id, Task Id or Run Id of a specific task, you can navigate to that task’s DAG page.
The Task Reschedules page displays a list of rescheduled tasks and information about them.
The Triggers page displays a list of existing triggers.
For more information about triggers, see the Airflow documentation.
An SLA, or service level agreement, is an expectation for the maximum time a task should be completed relative to the DAG Run start time. If a task takes longer than this, it will appear on the SLA Misses page.
For more information about the SLAs, see the Airflow documentation.
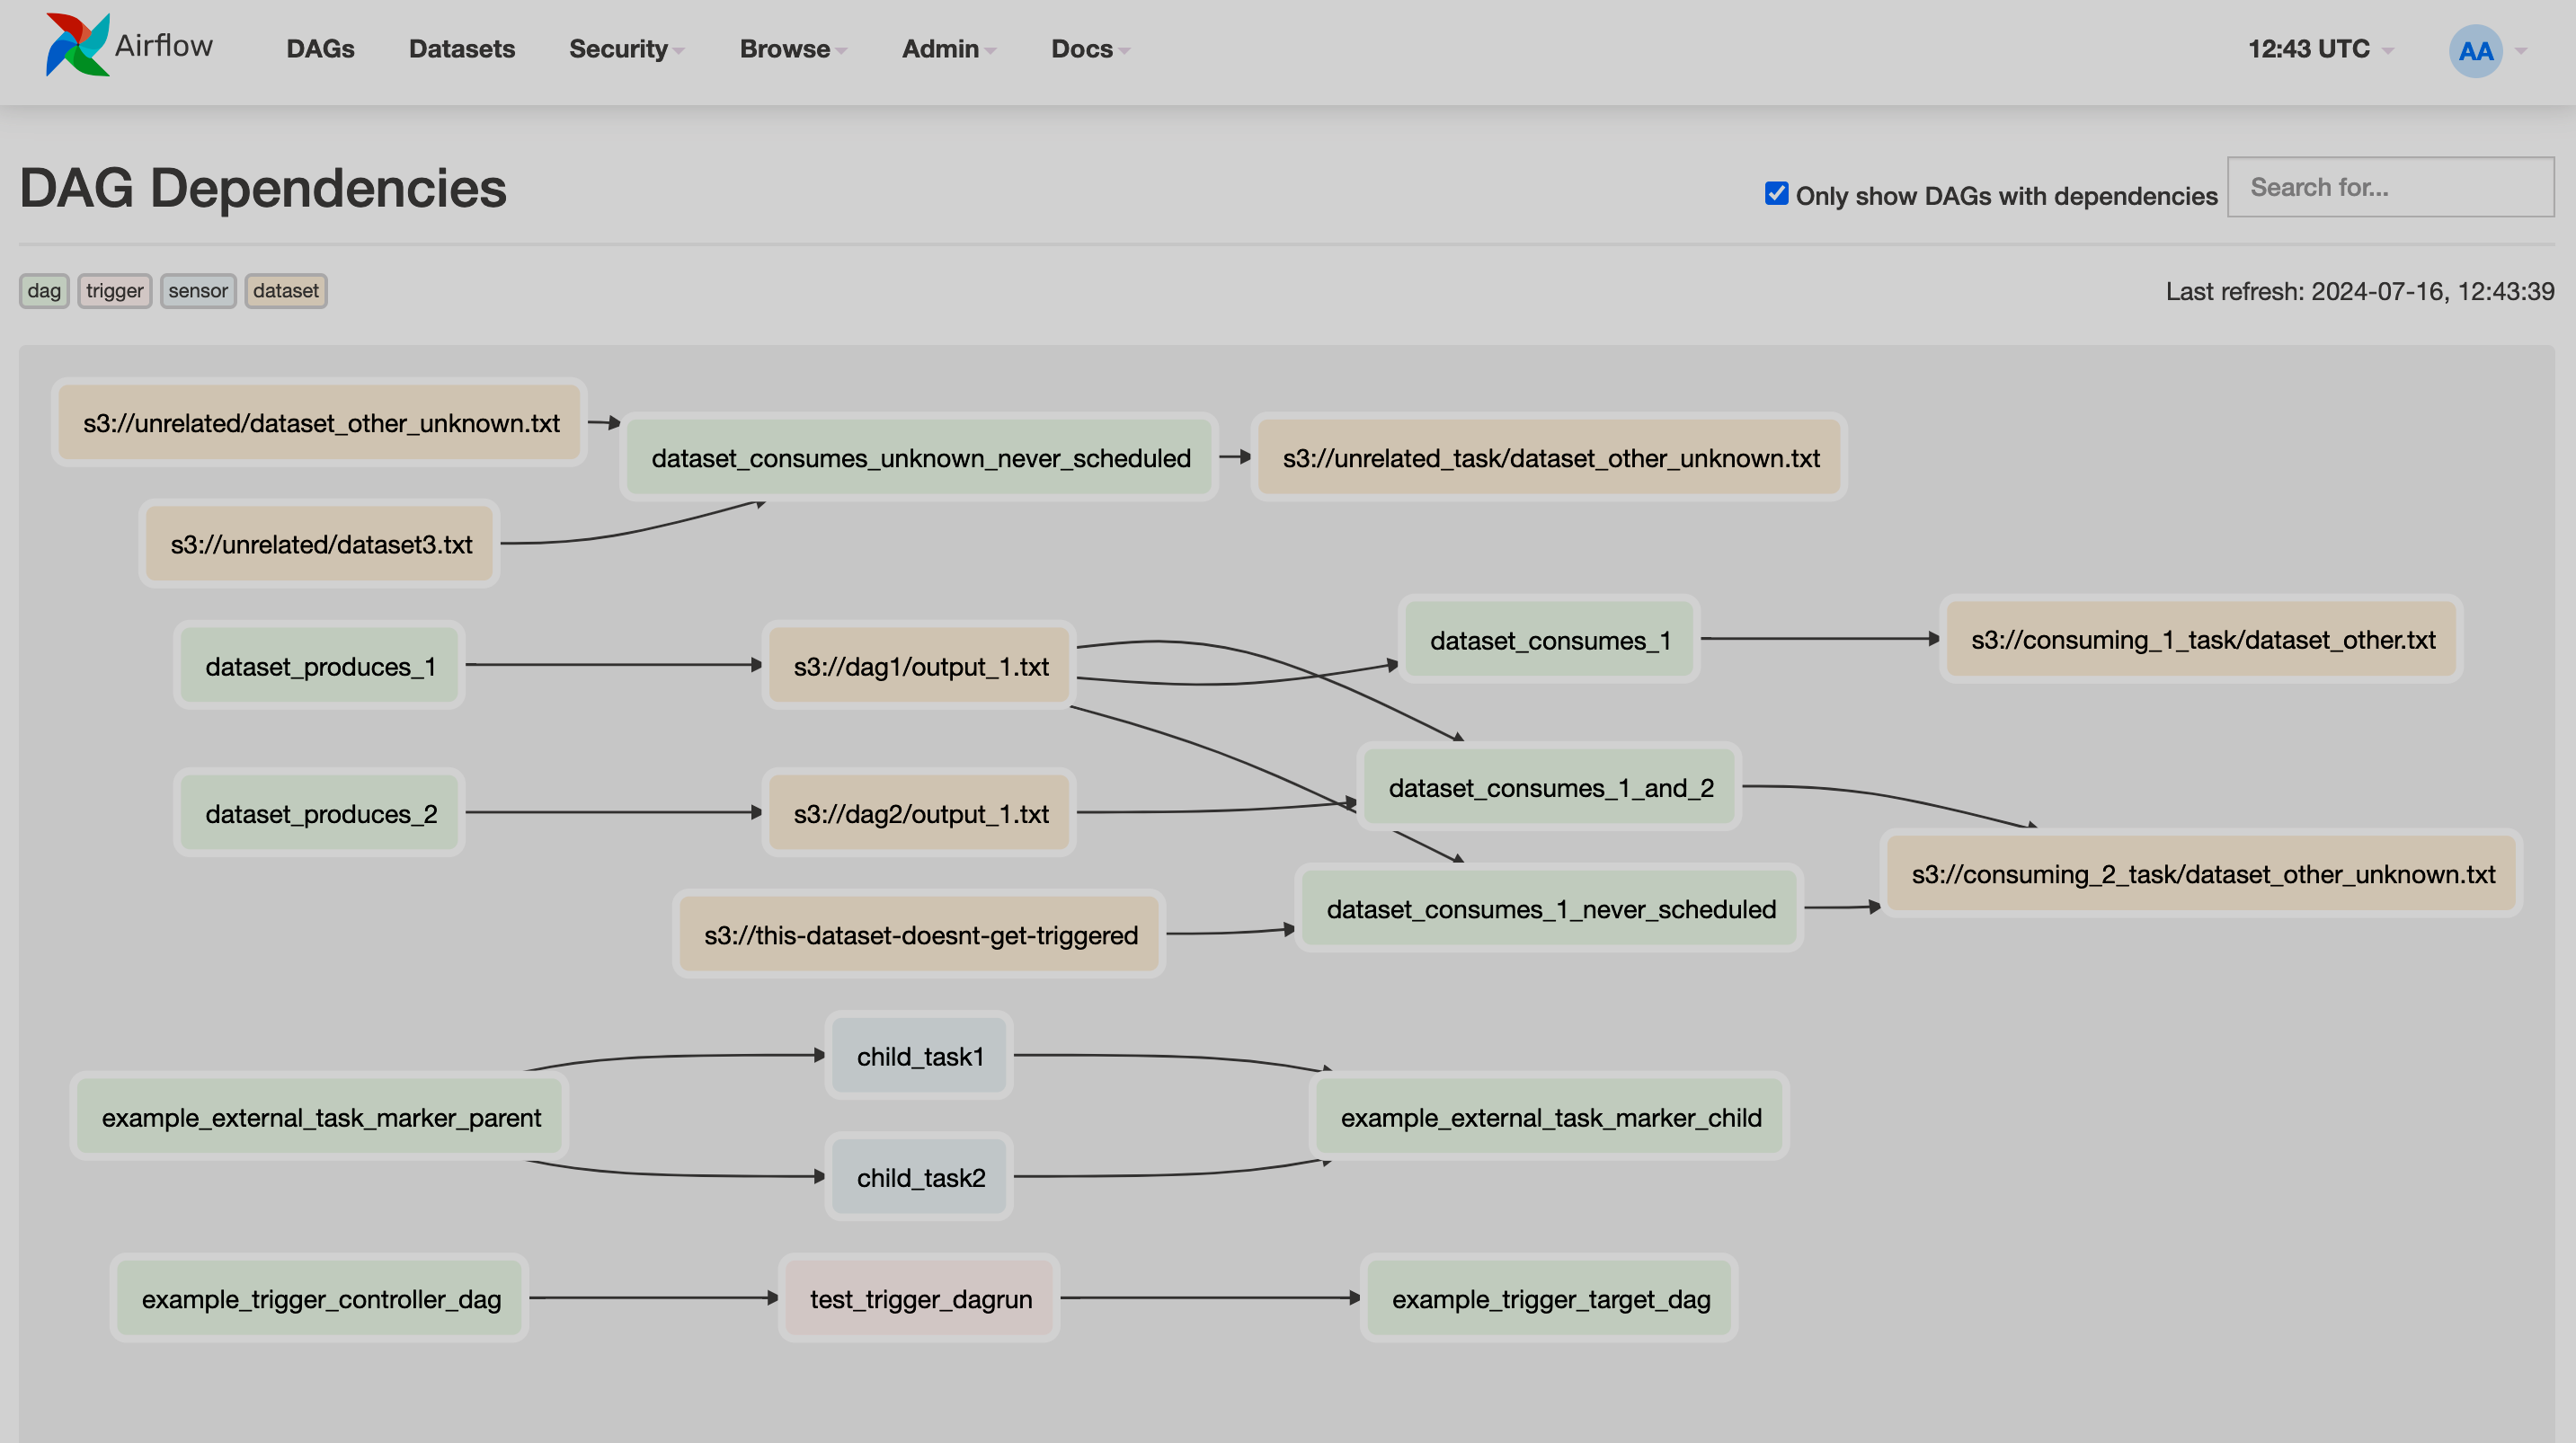
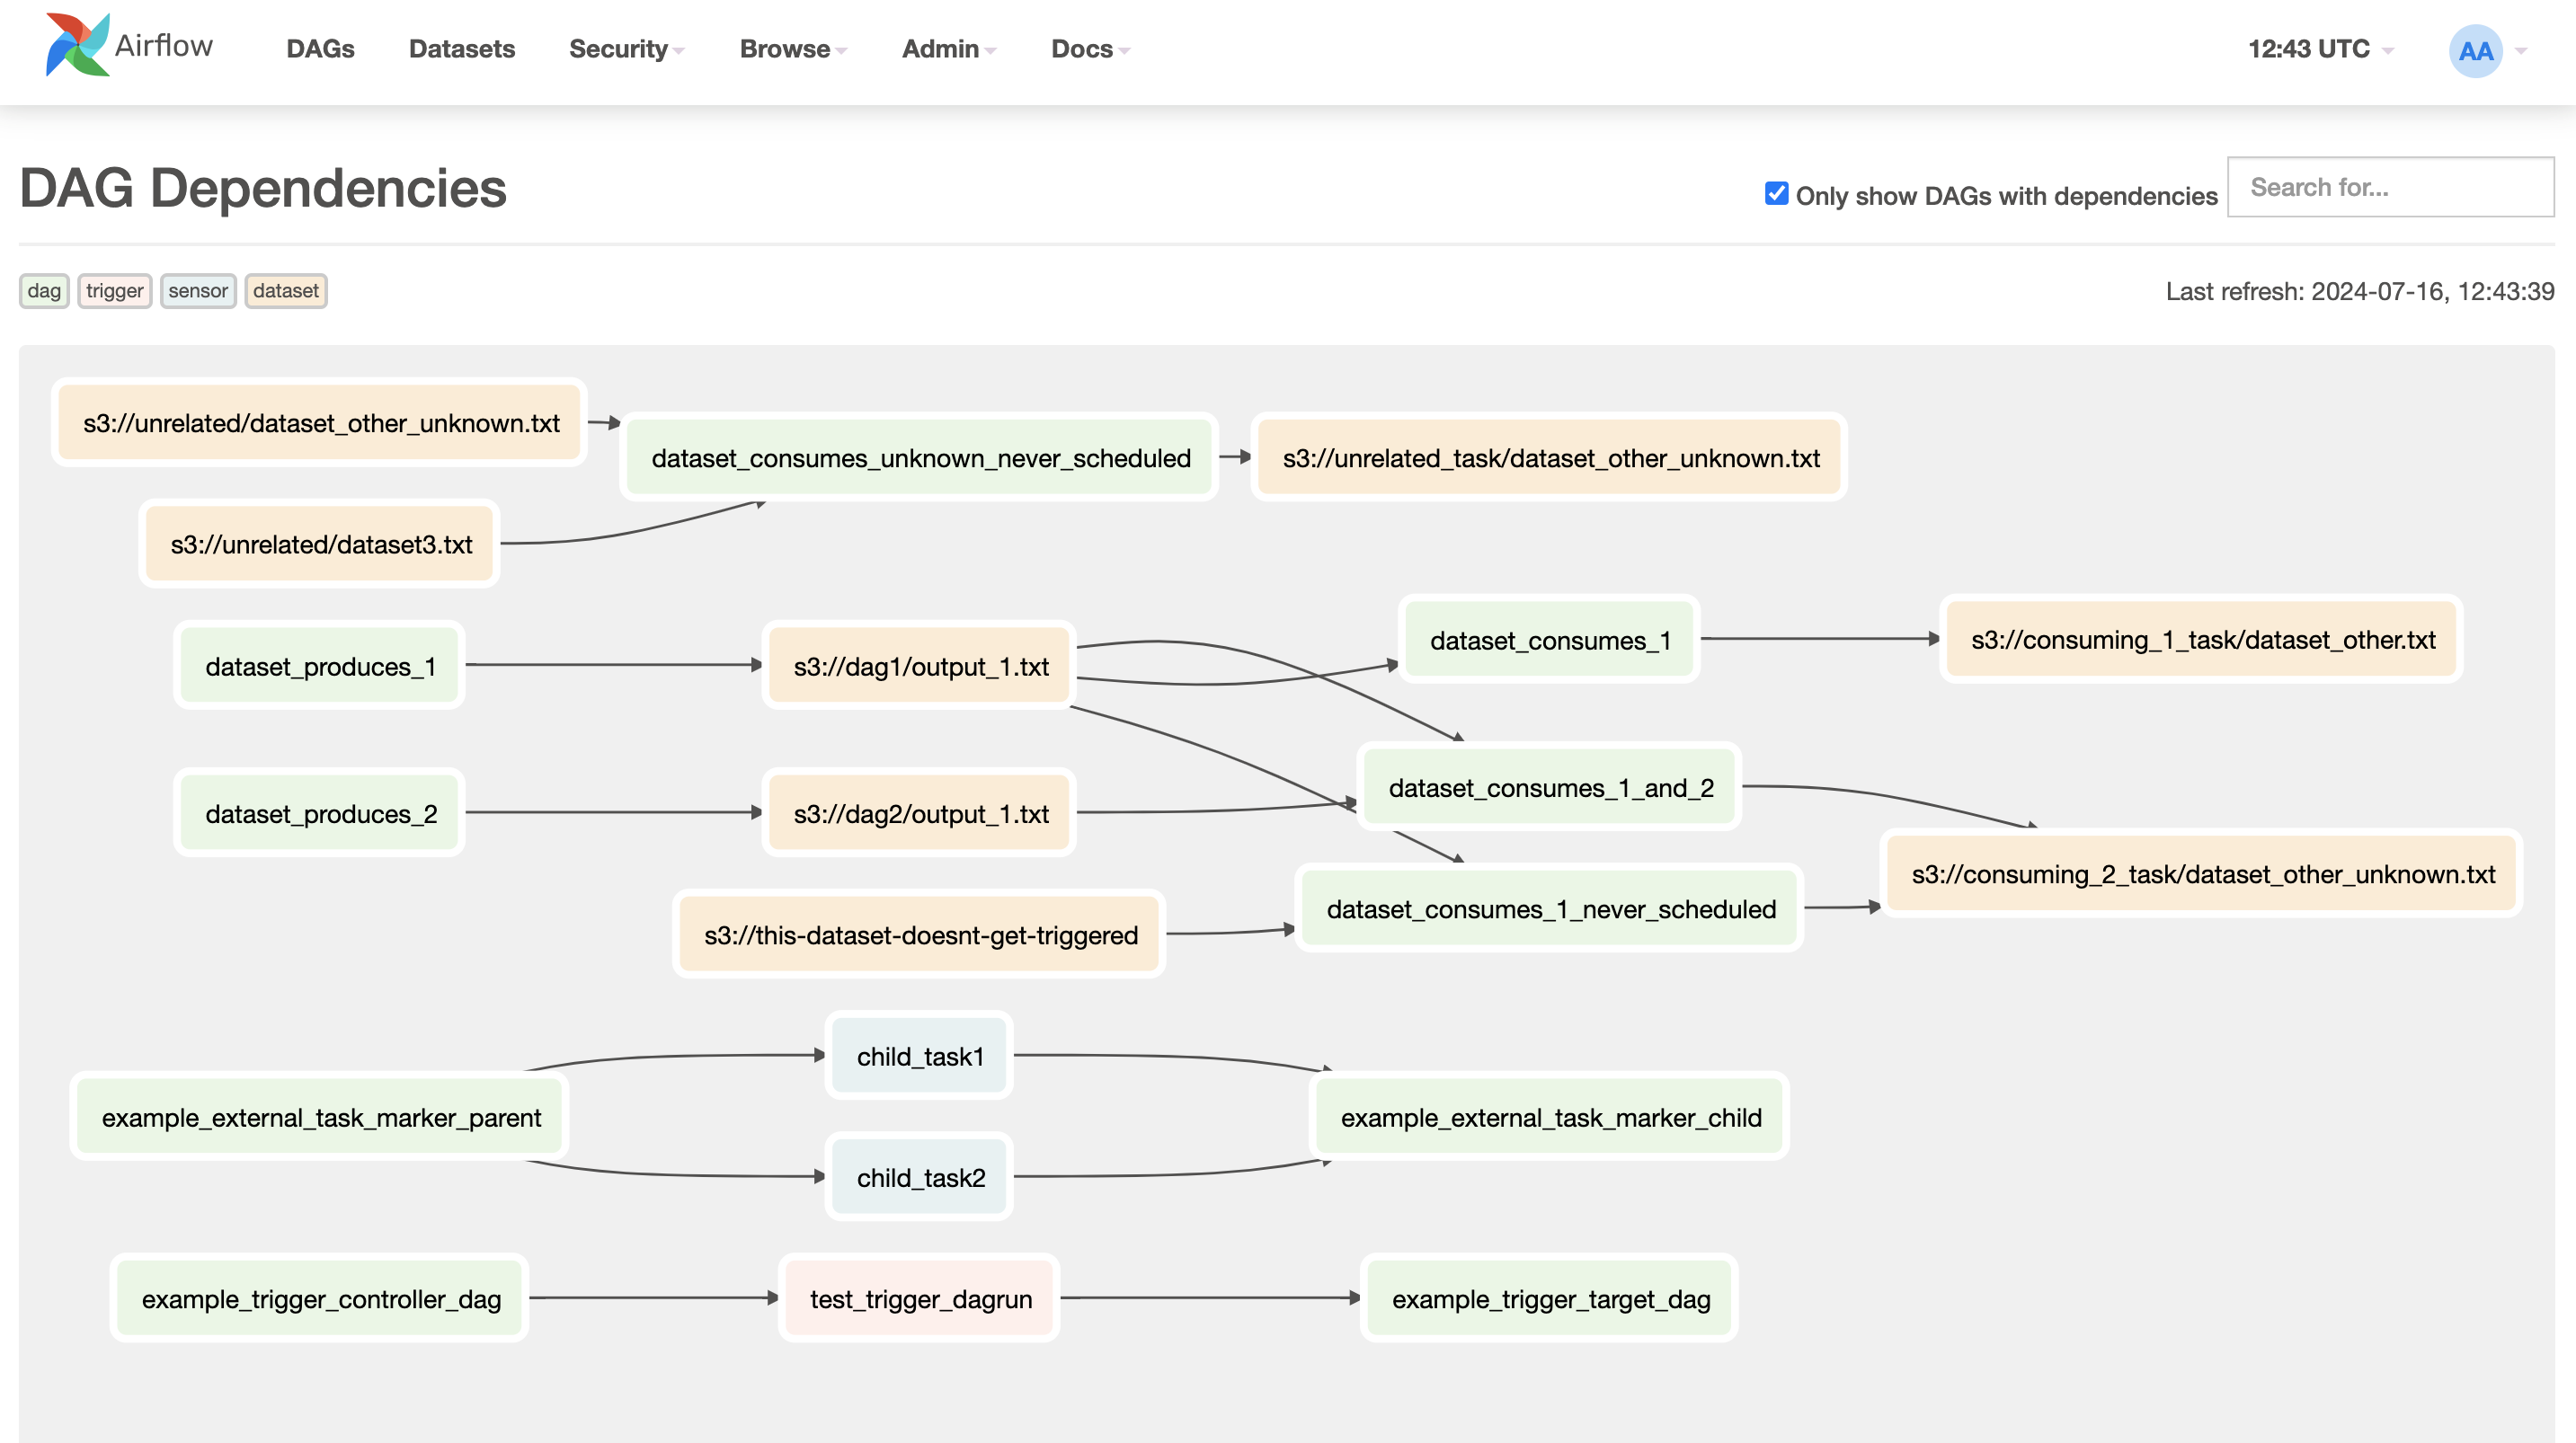
The DAG Dependencies page shows a graph of connections between DAGs, triggers, sensors, and datasets.
Admin
The Admin menu provides resource control actions and information about the Airflow configuration.
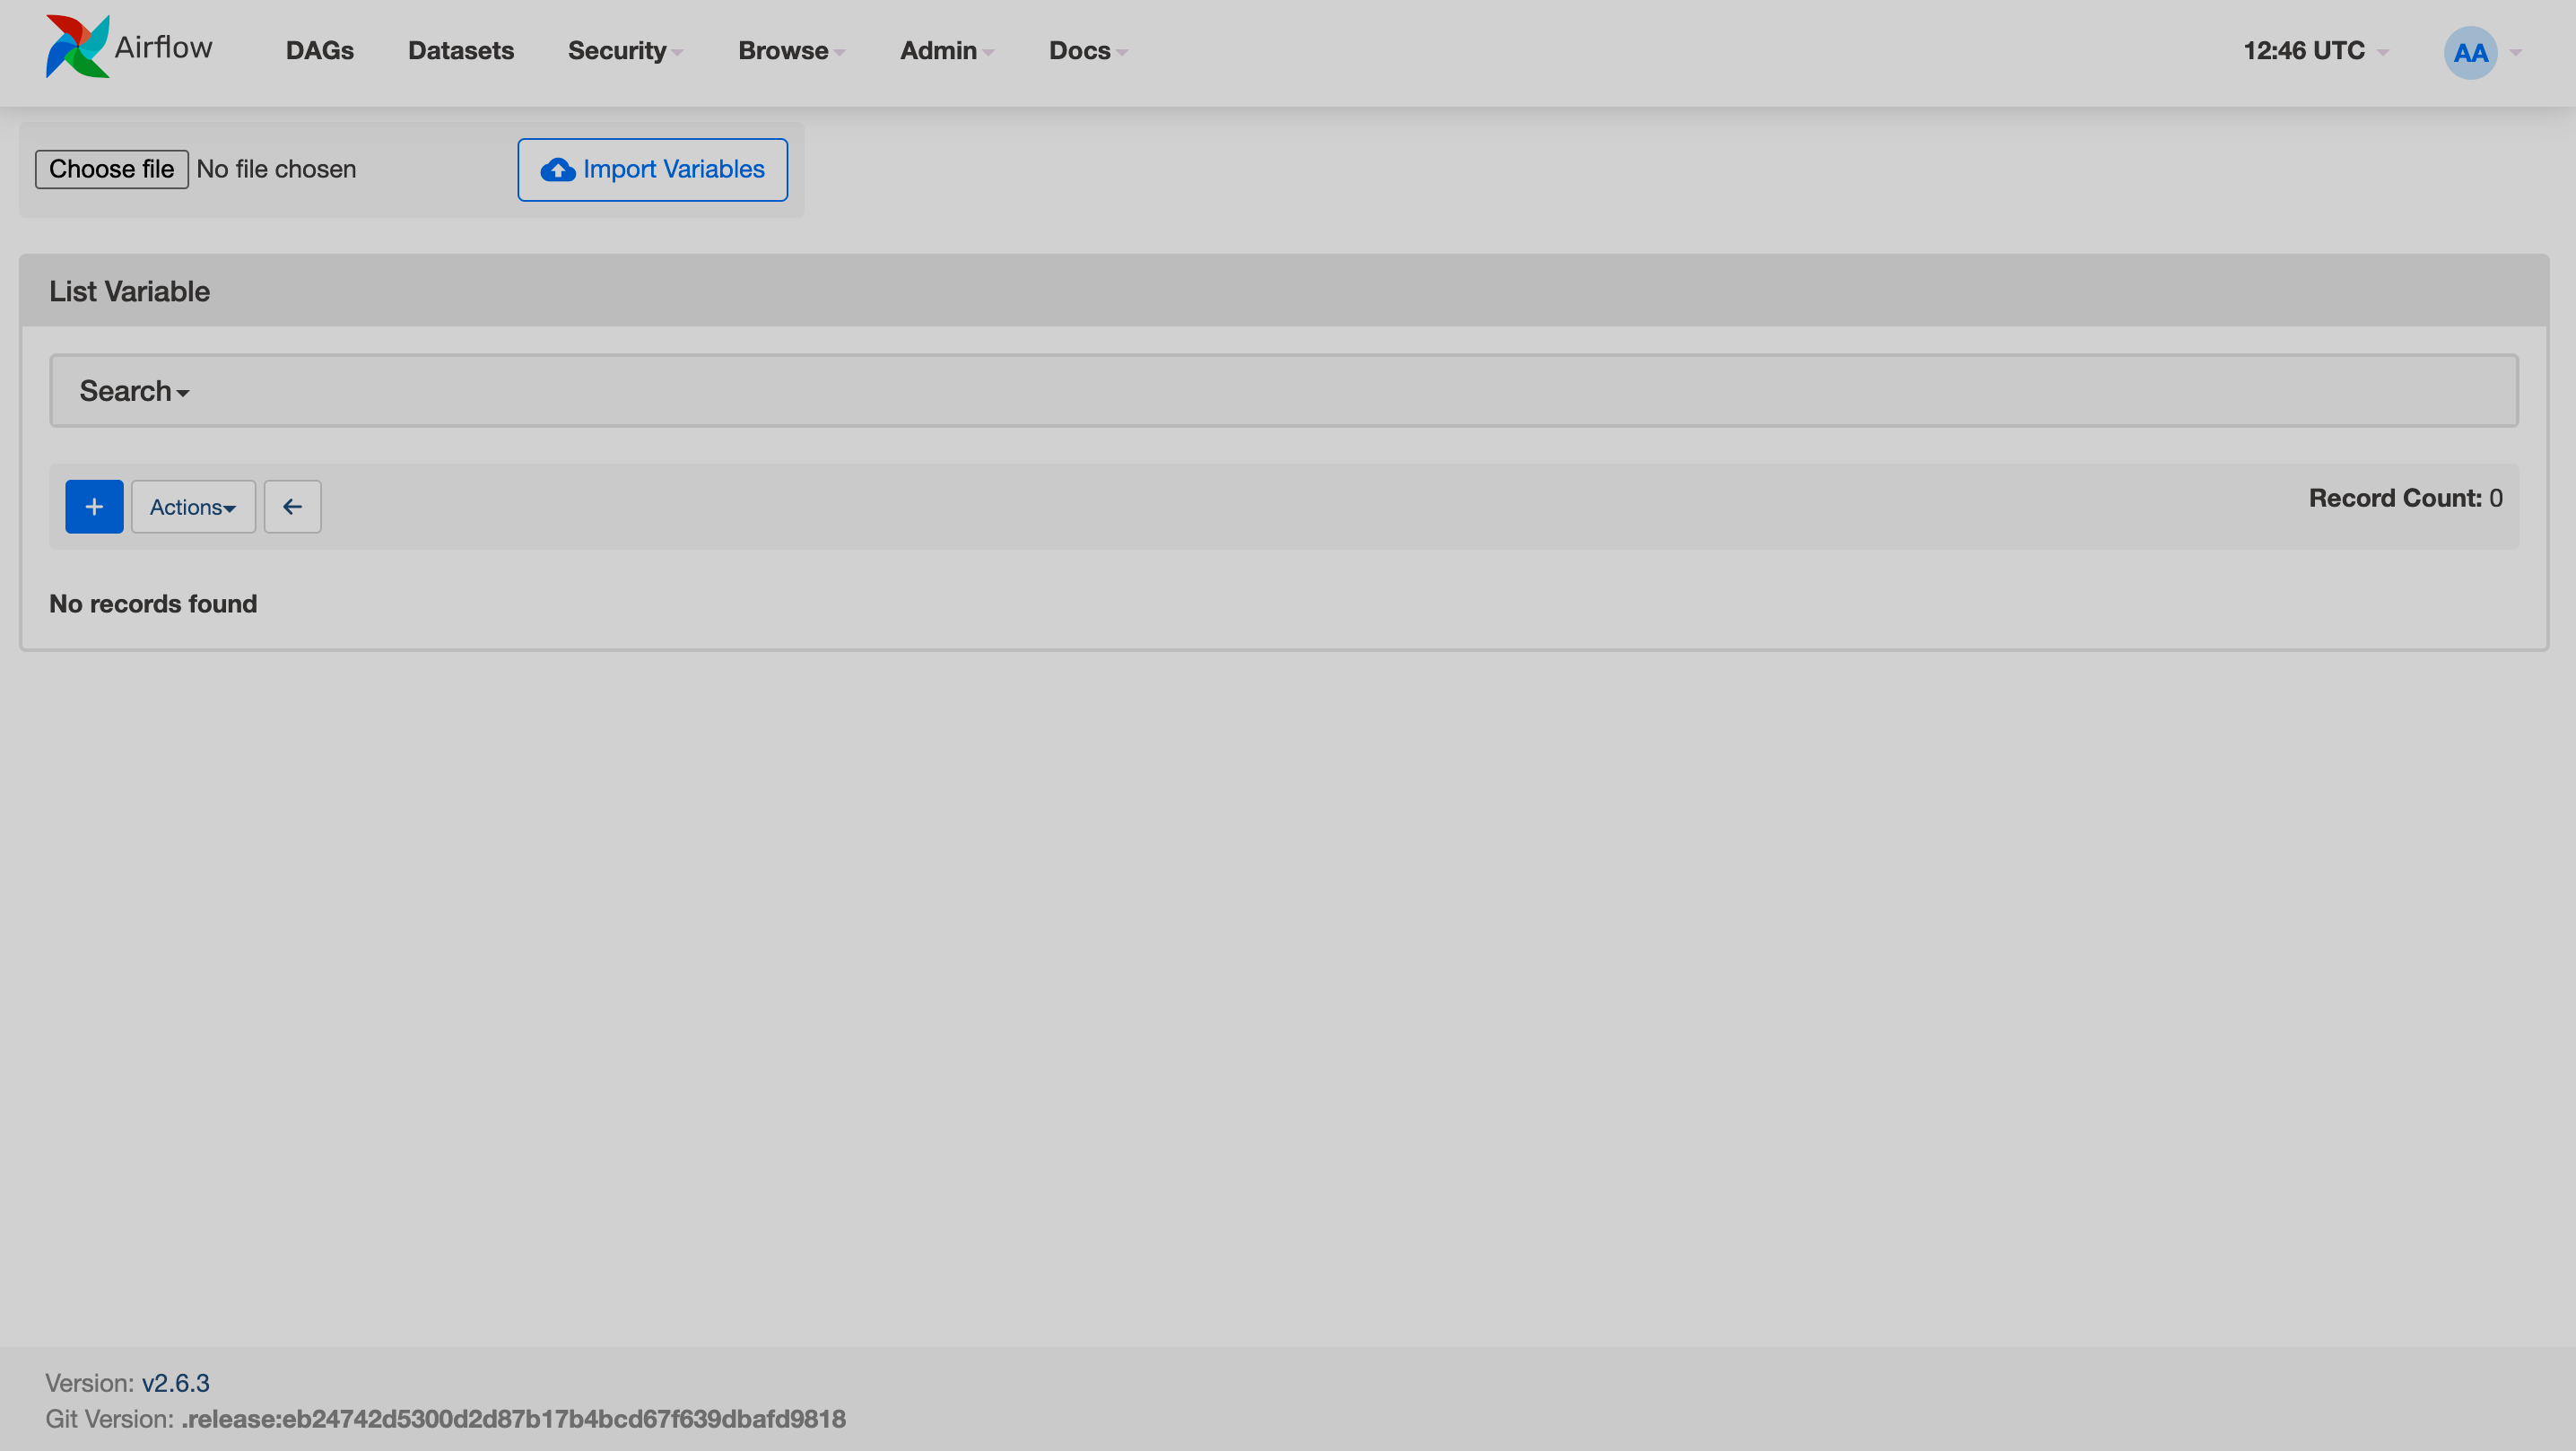
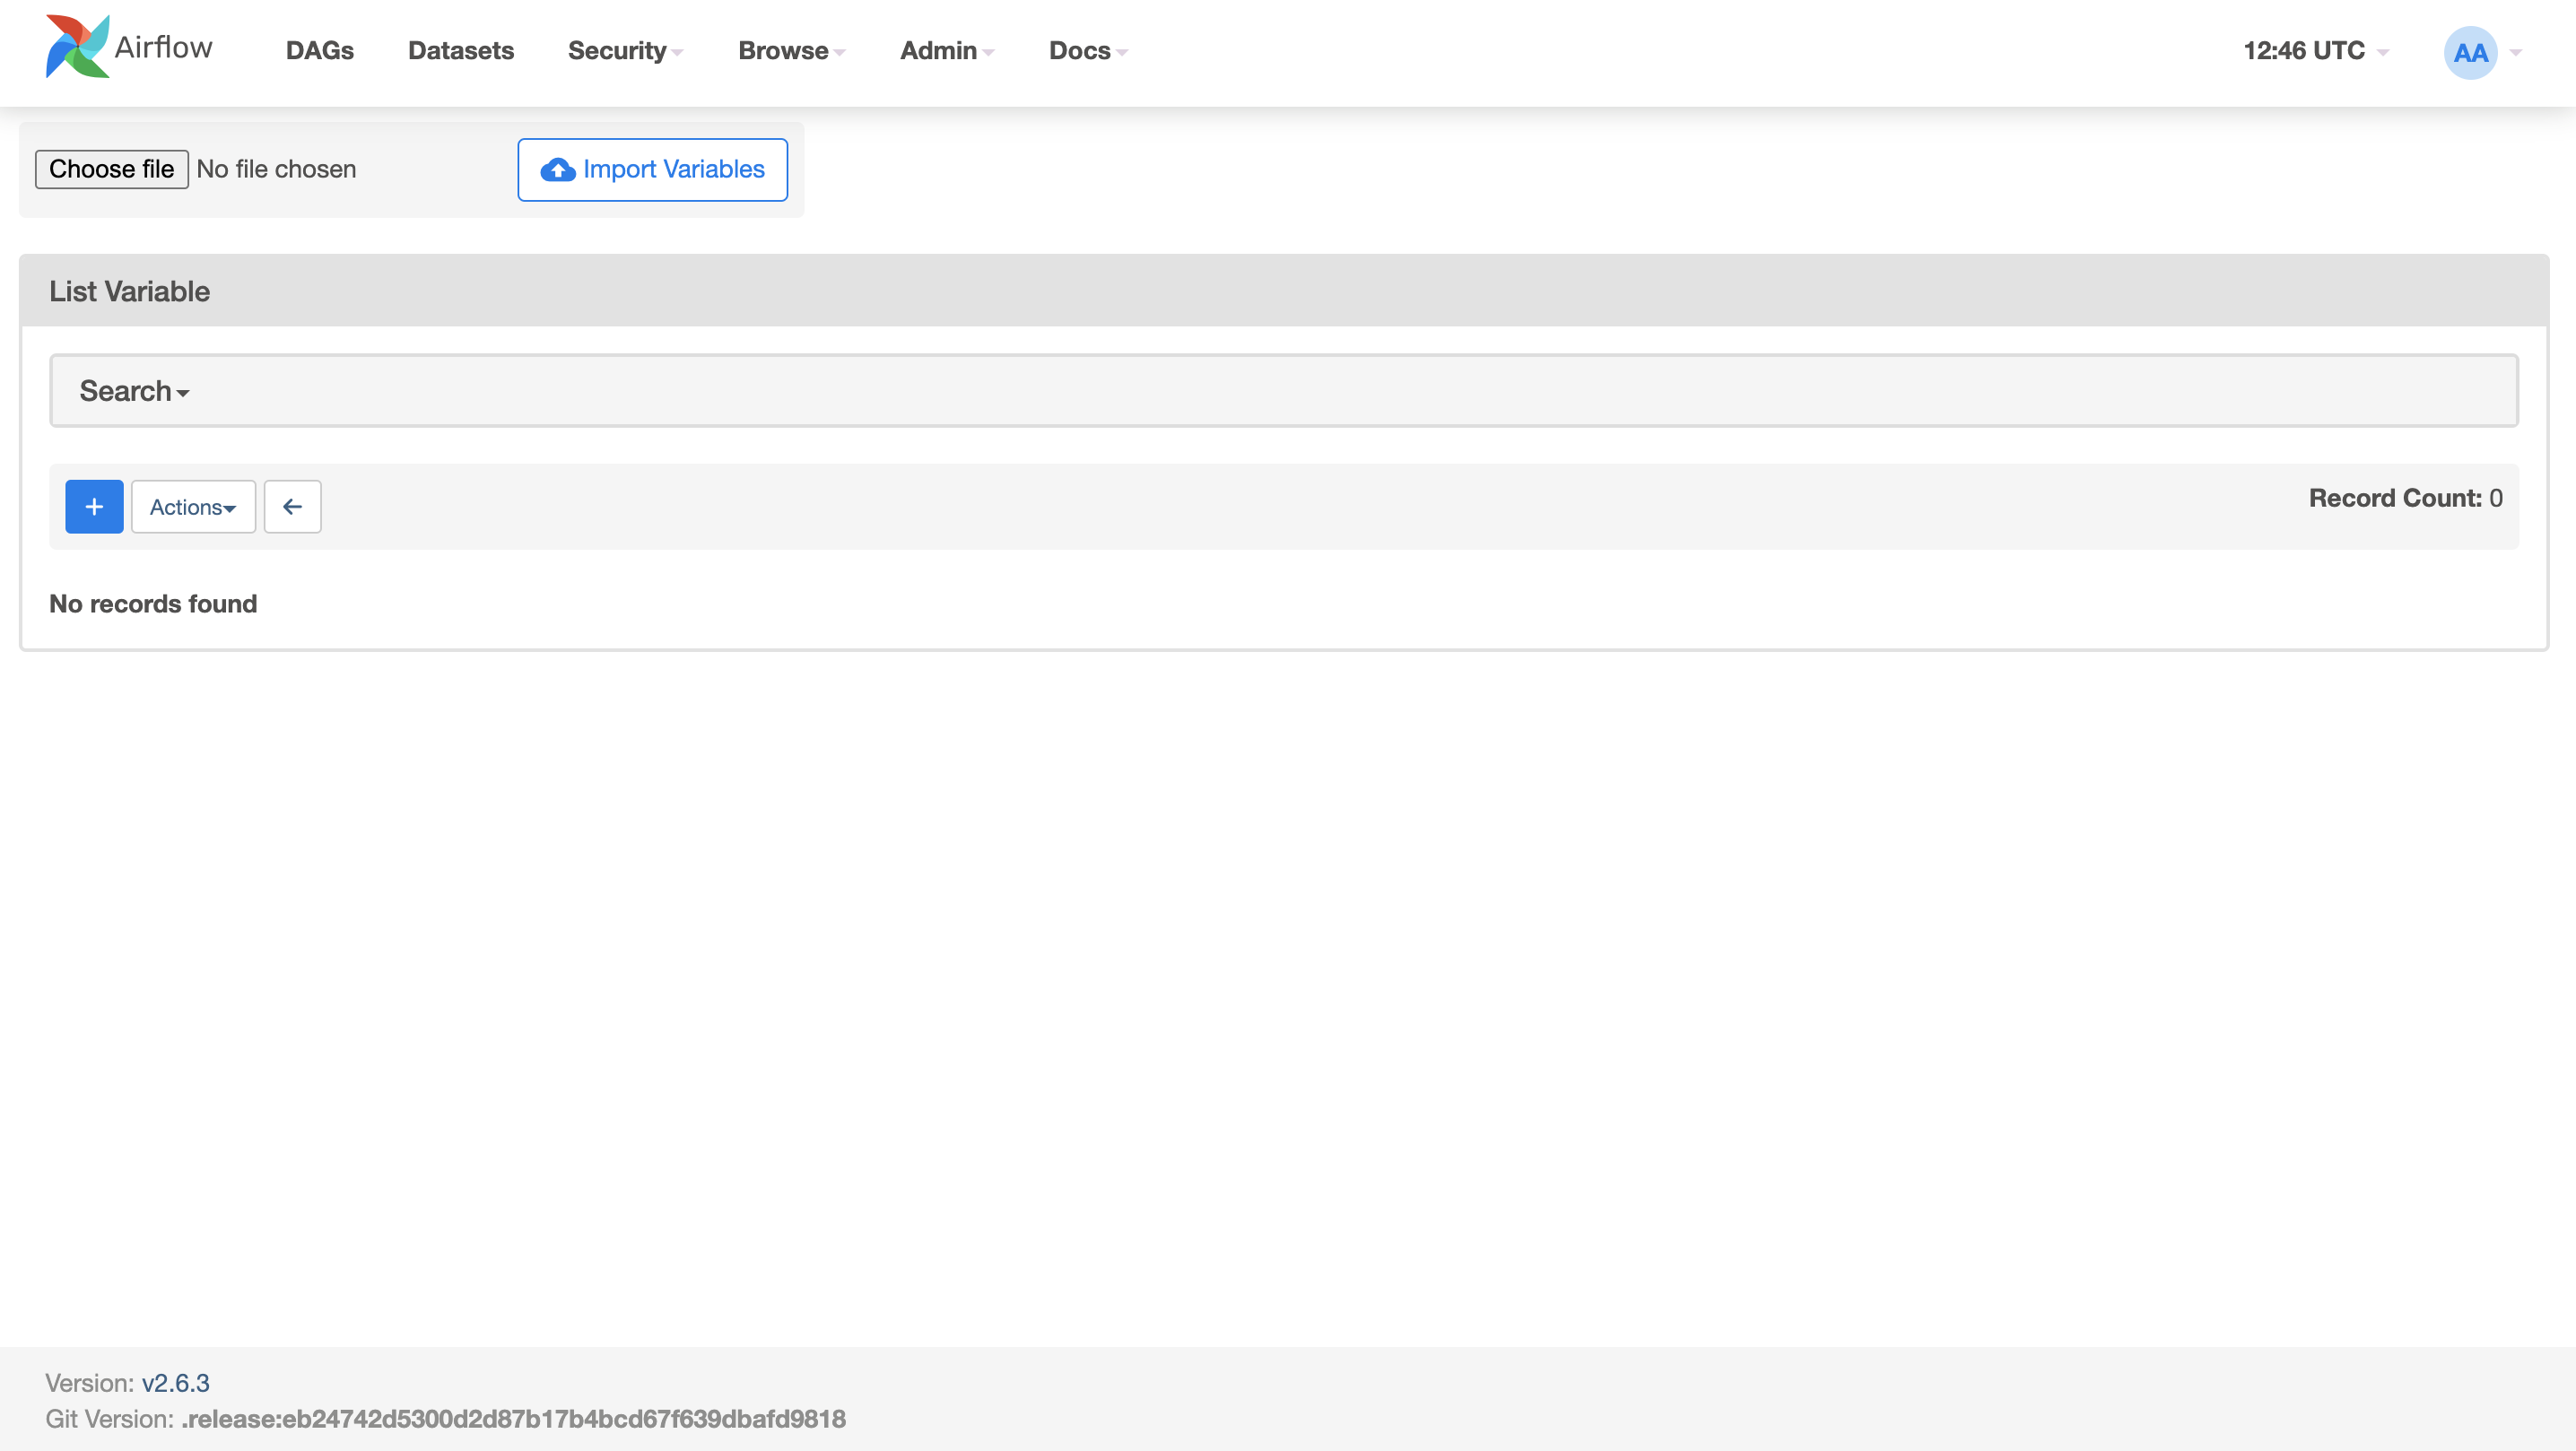
A variable in Airflow is a key/value pair that expects a string value. On this page, you can create variables that can be used in DAGs and task code.
By default, the value of a variable will be hidden if the key contains the following words: password, secret, passwd, authorization, api_key, apikey, access_token. If you don’t want the value to be hidden, you can configure the variable to show plain text.
To add a single variable, click the plus sign and enter the variable key/value.
To upload several variables at once, click Choose file, upload a variables file, and click Import Variables.
The page displays the table with the configuration of your Airflow instance.
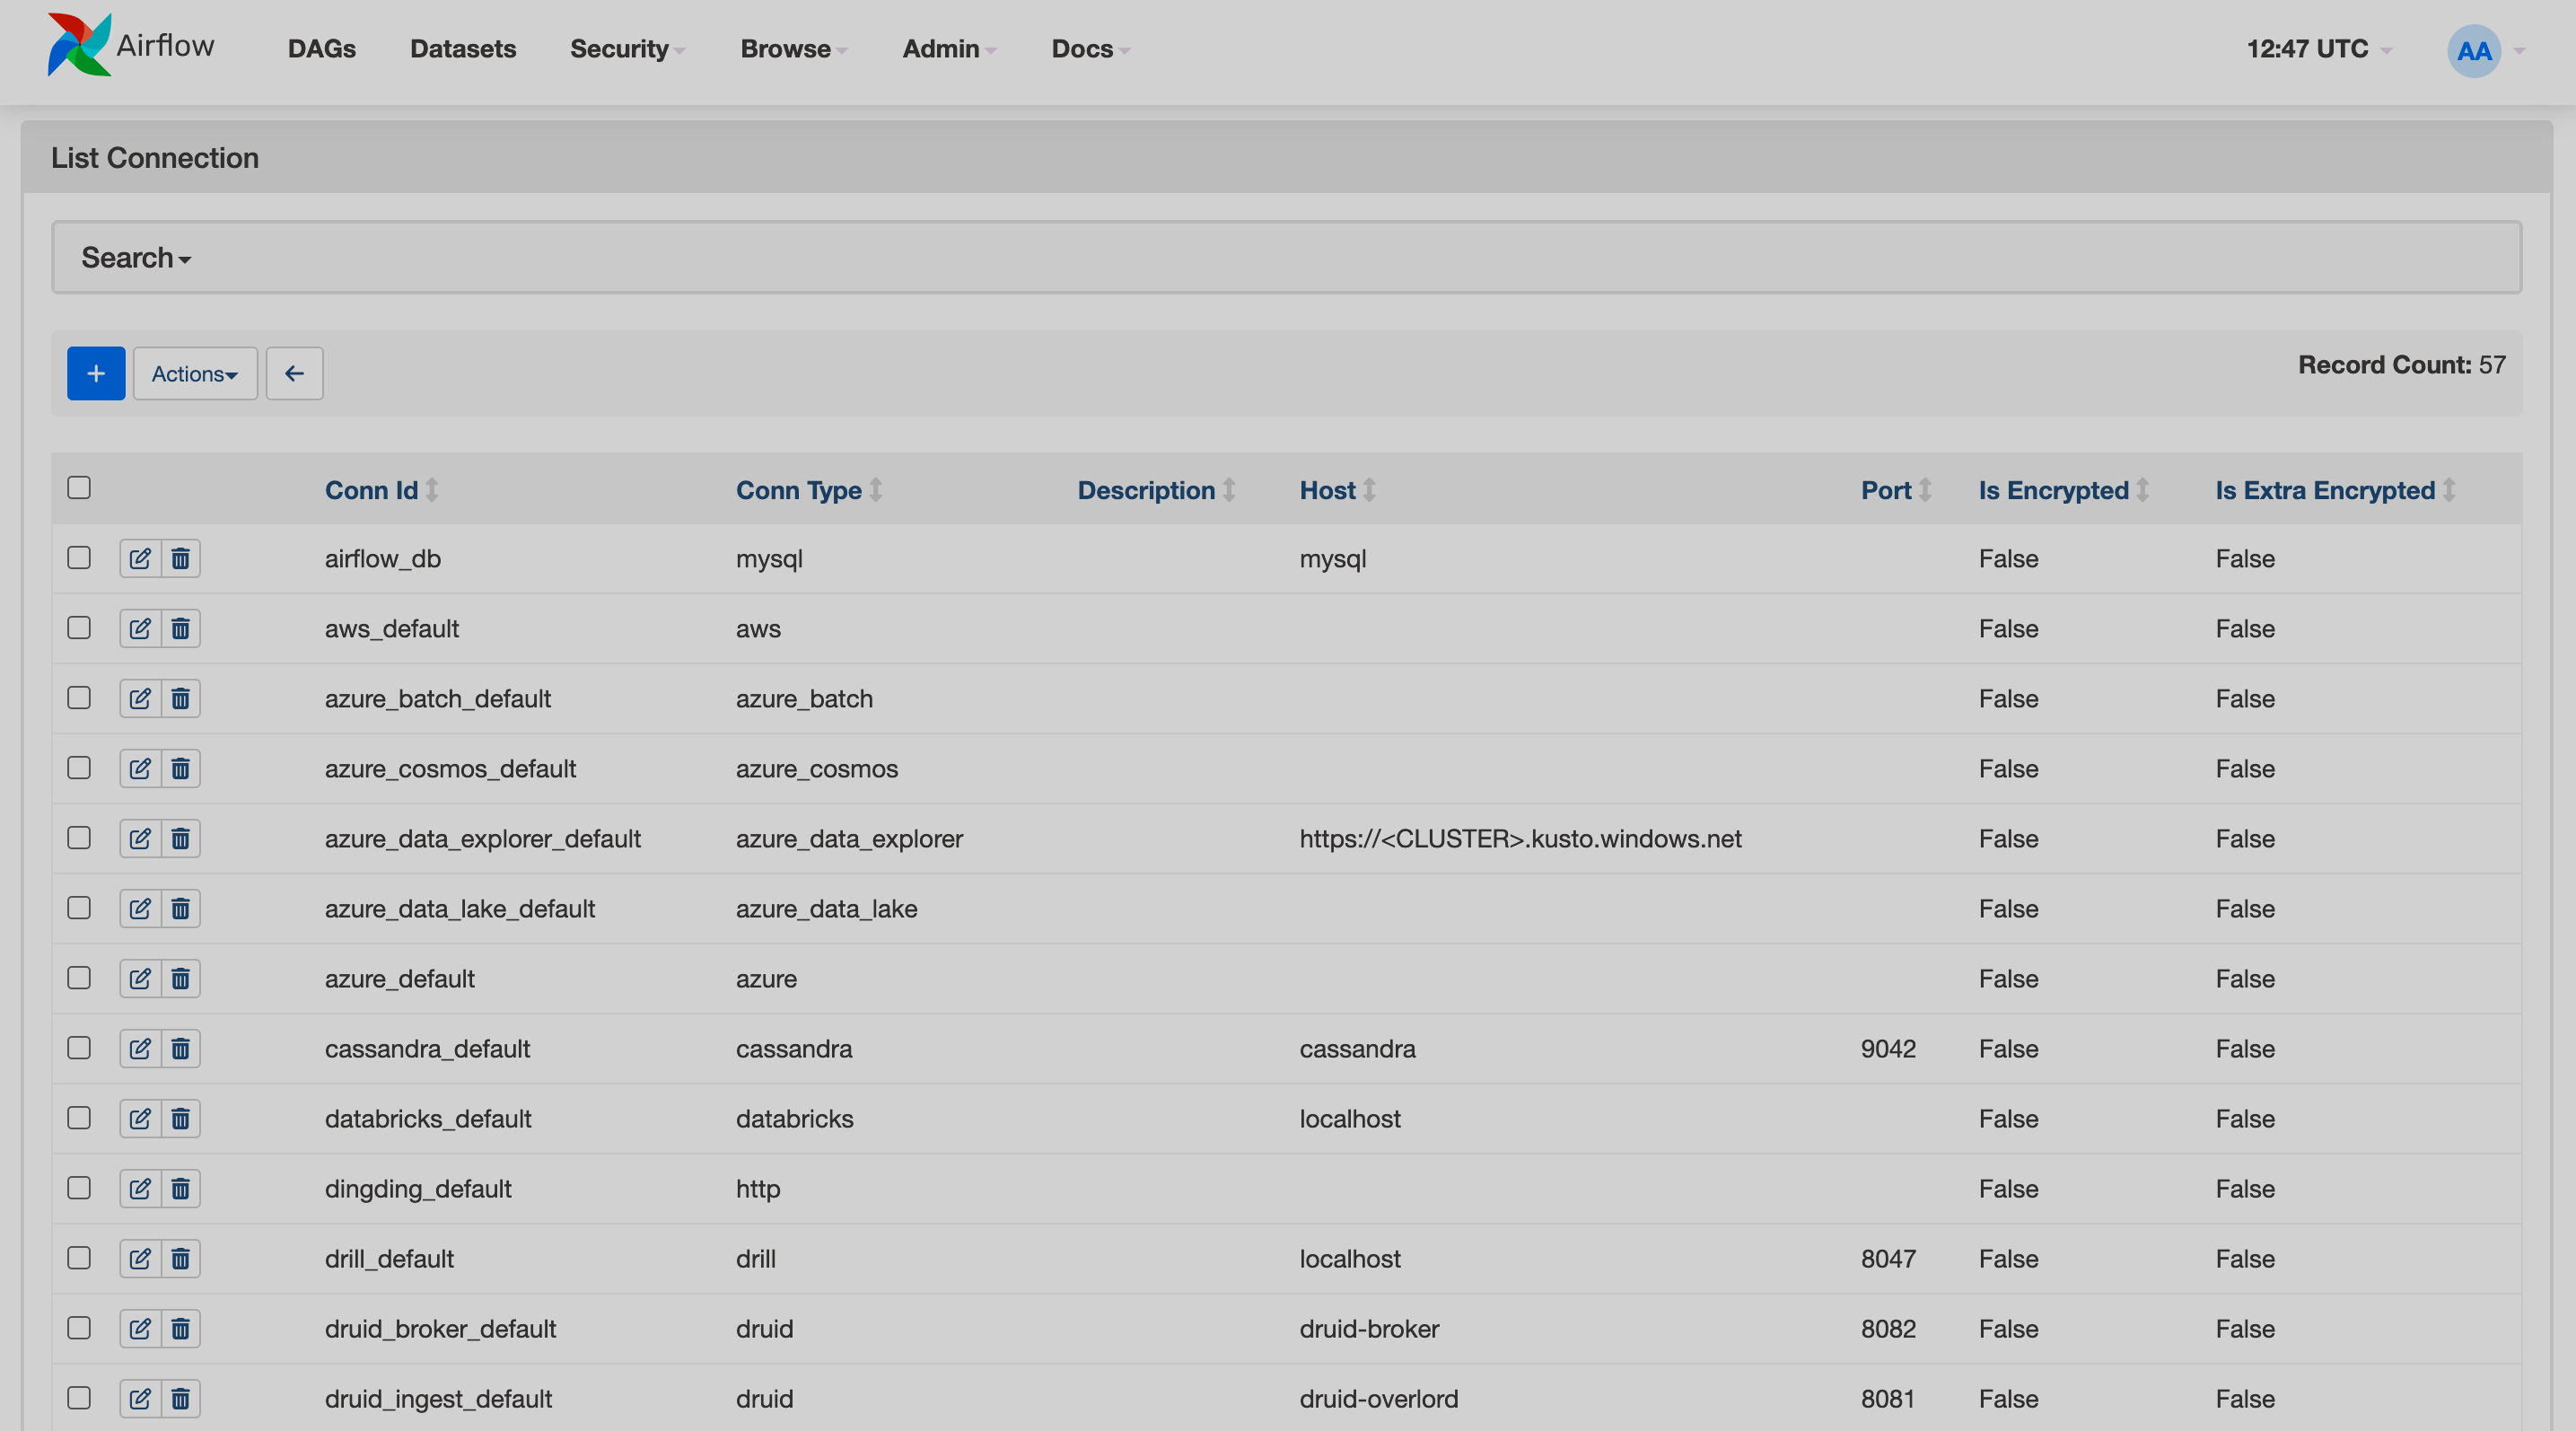
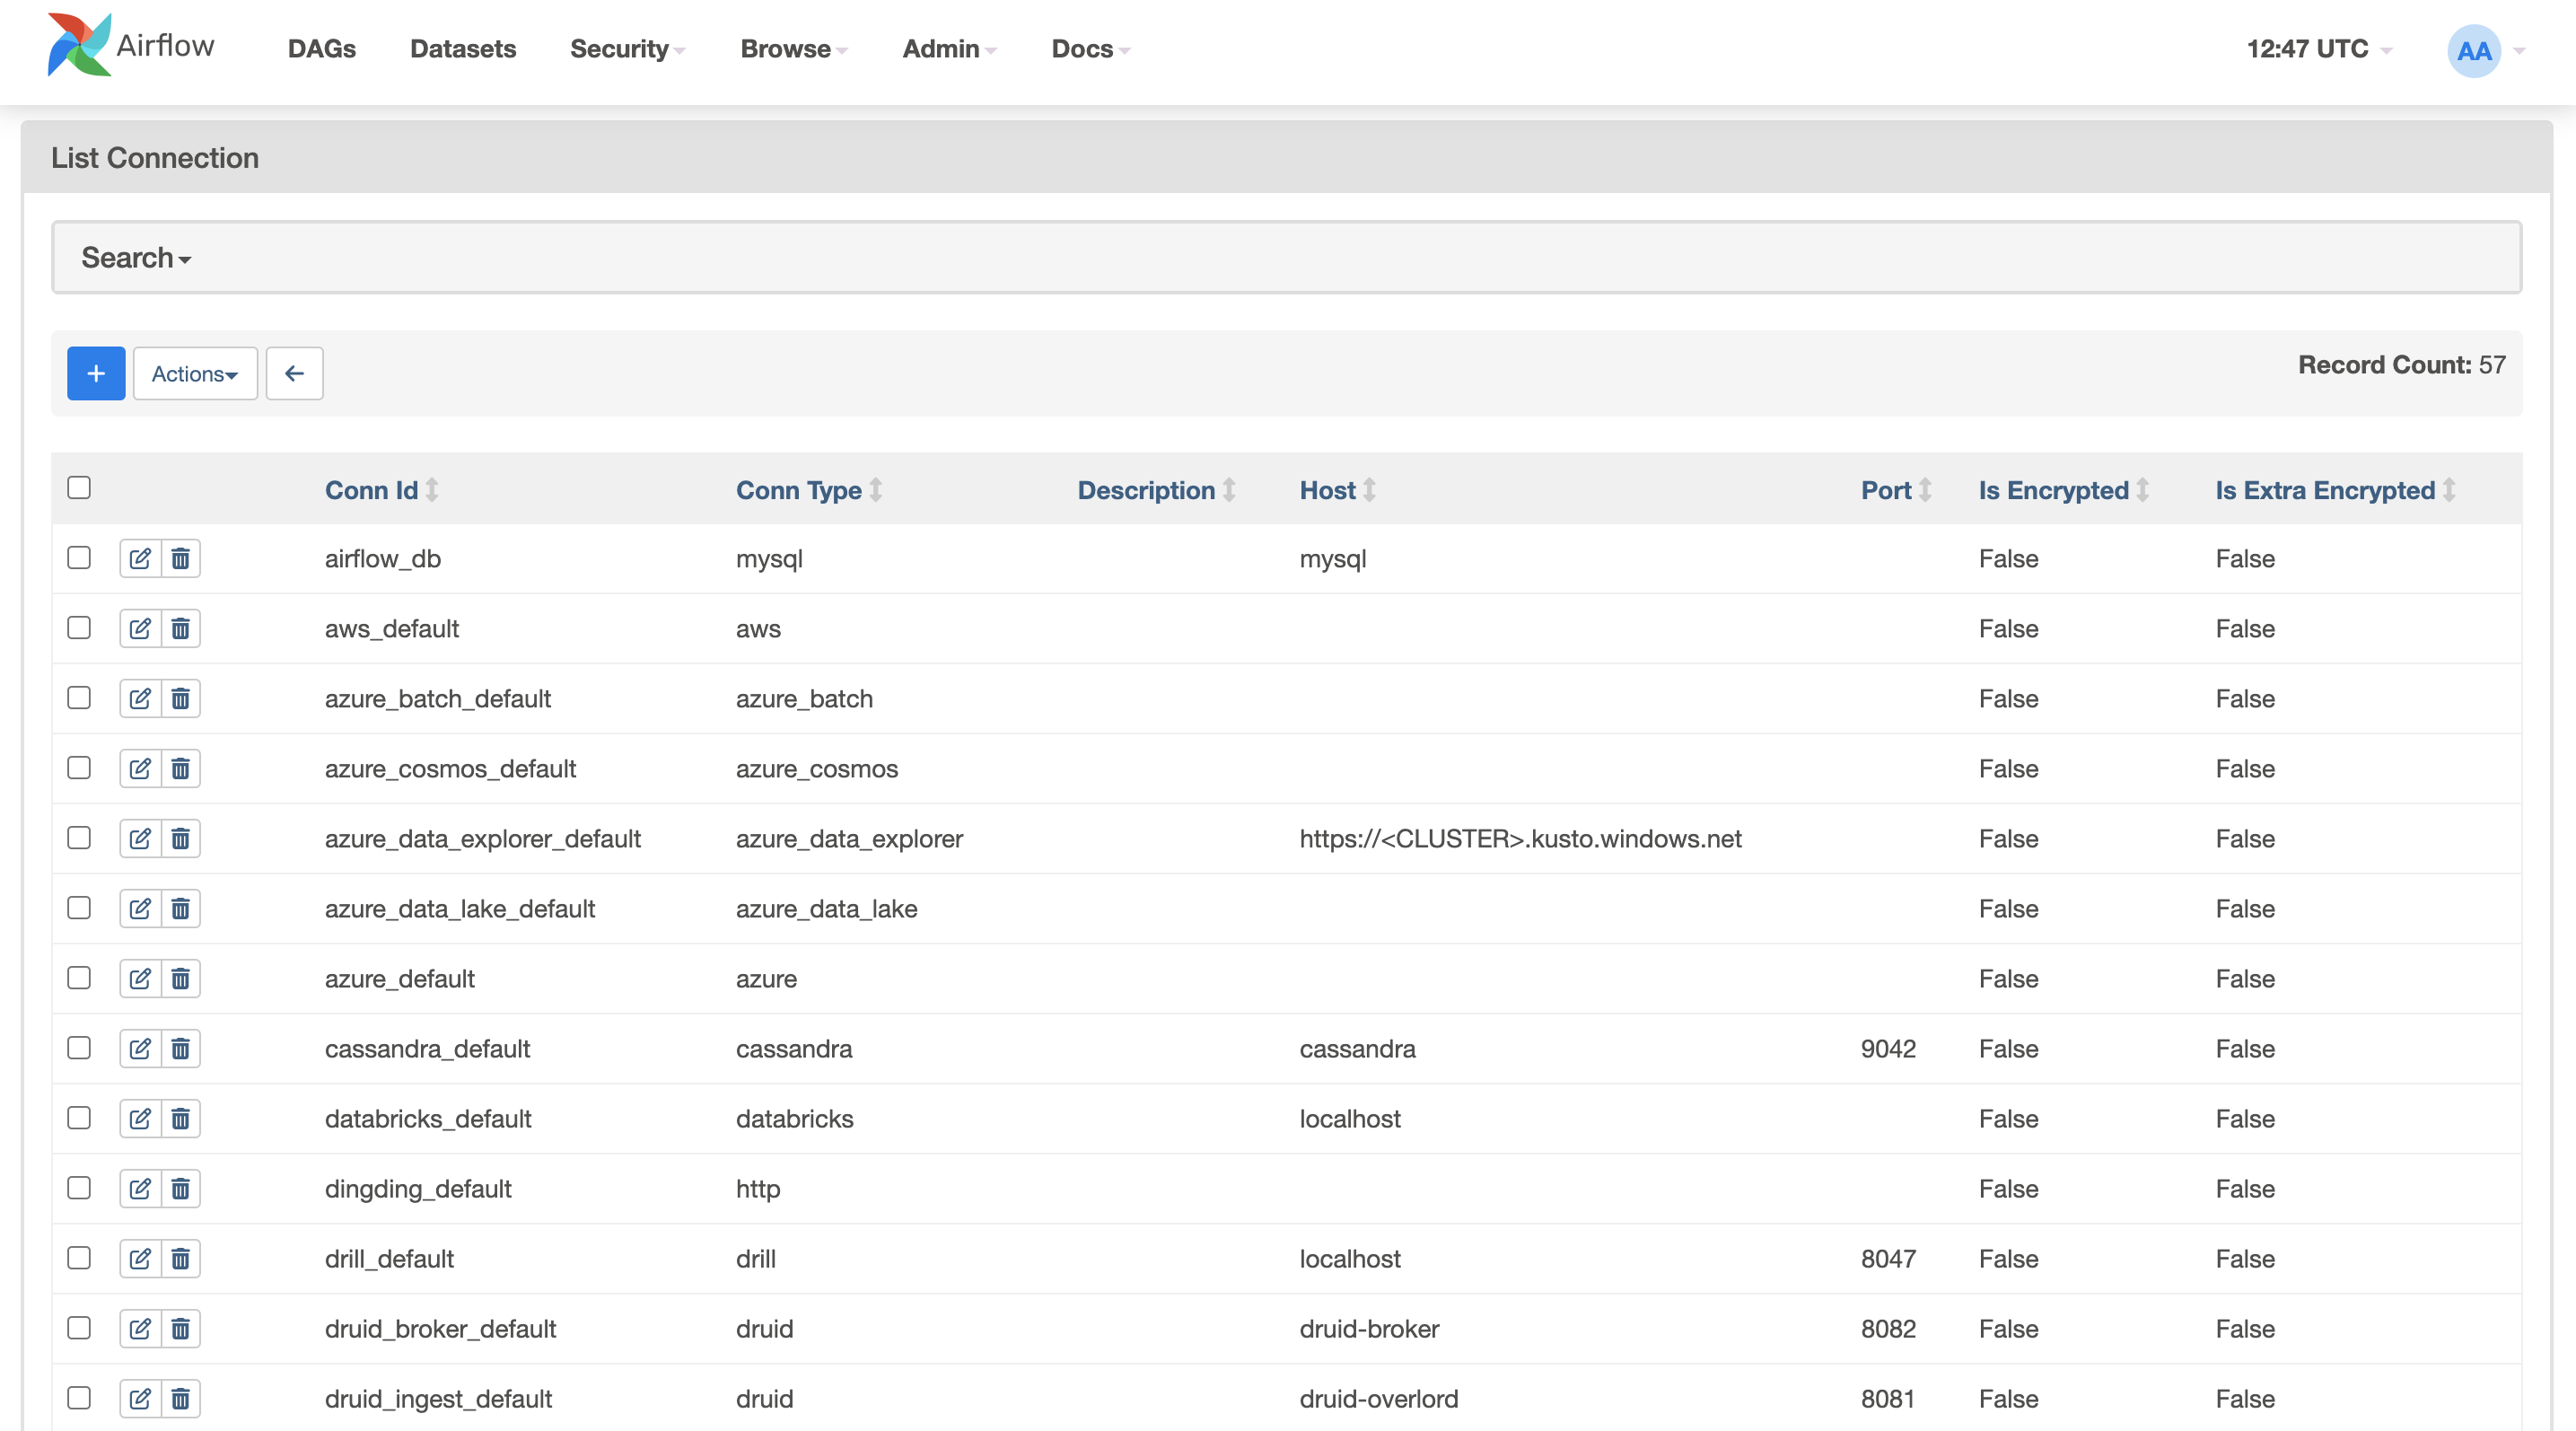
The connections enable integration of Airflow with other services. This page displays a list of created connections.
To create a connection, click the plus sign and enter the connection parameters. After the connection information is saved, you can check the connection by clicking Test.
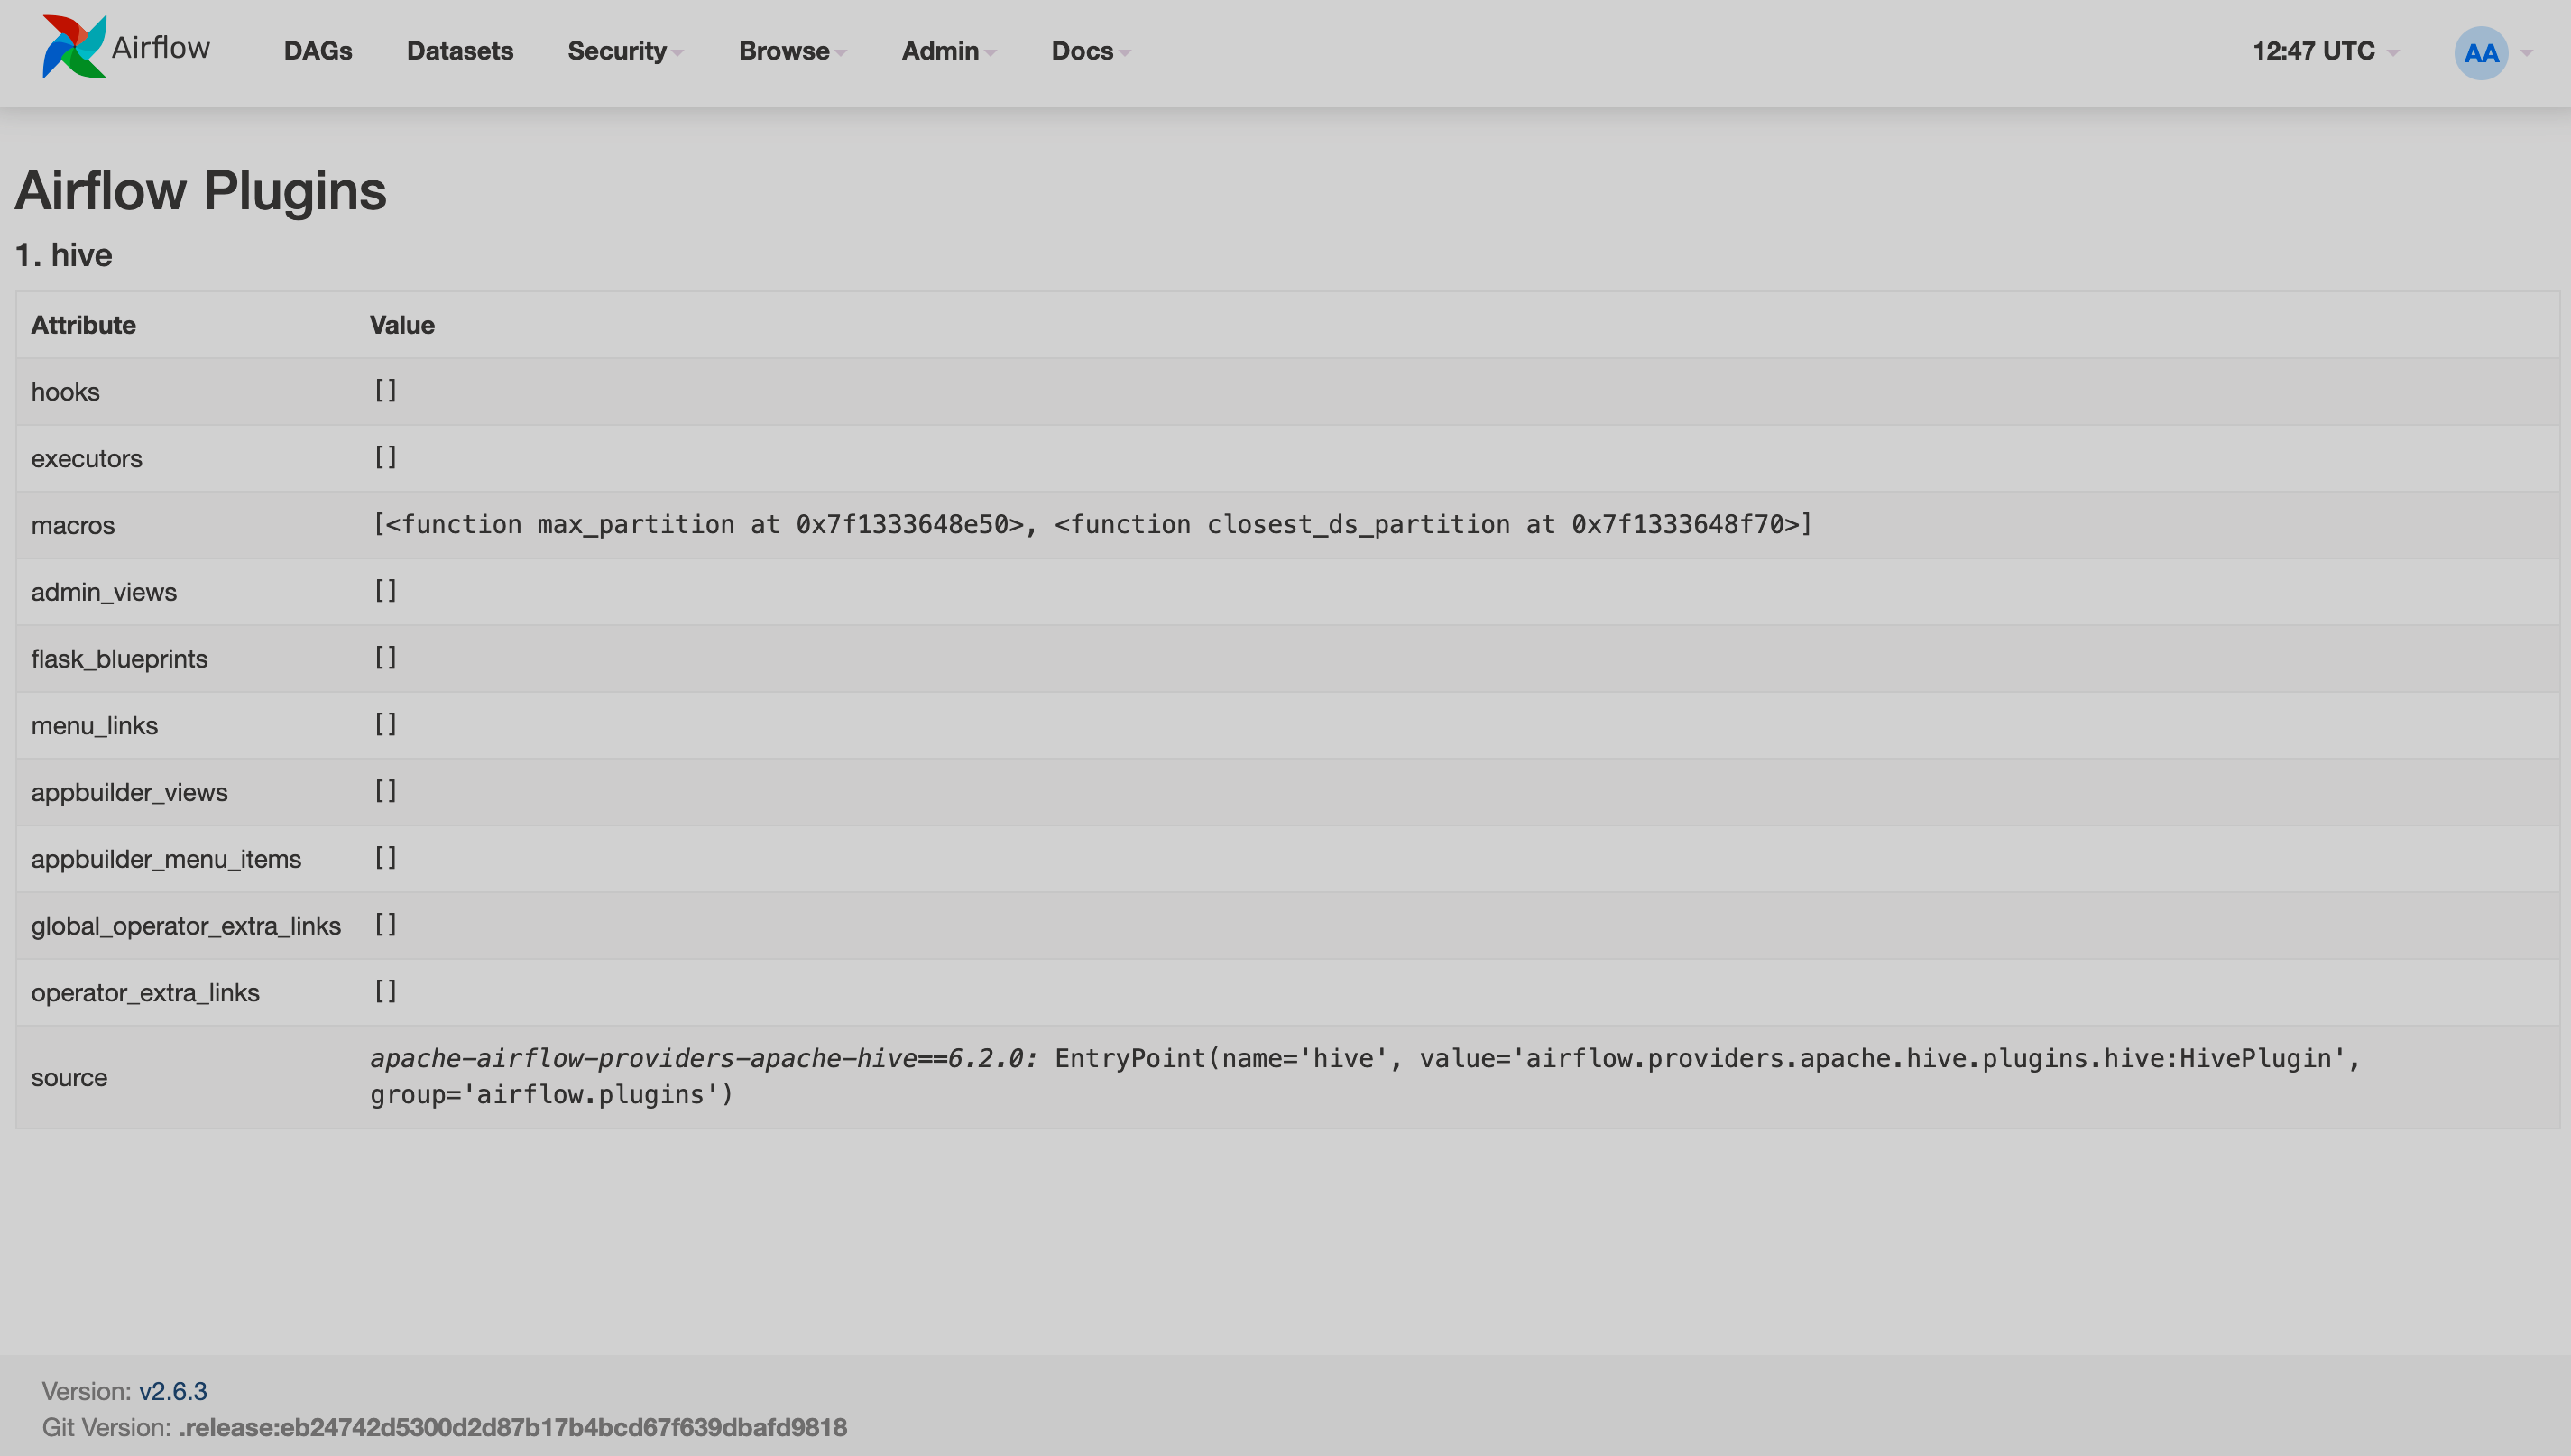
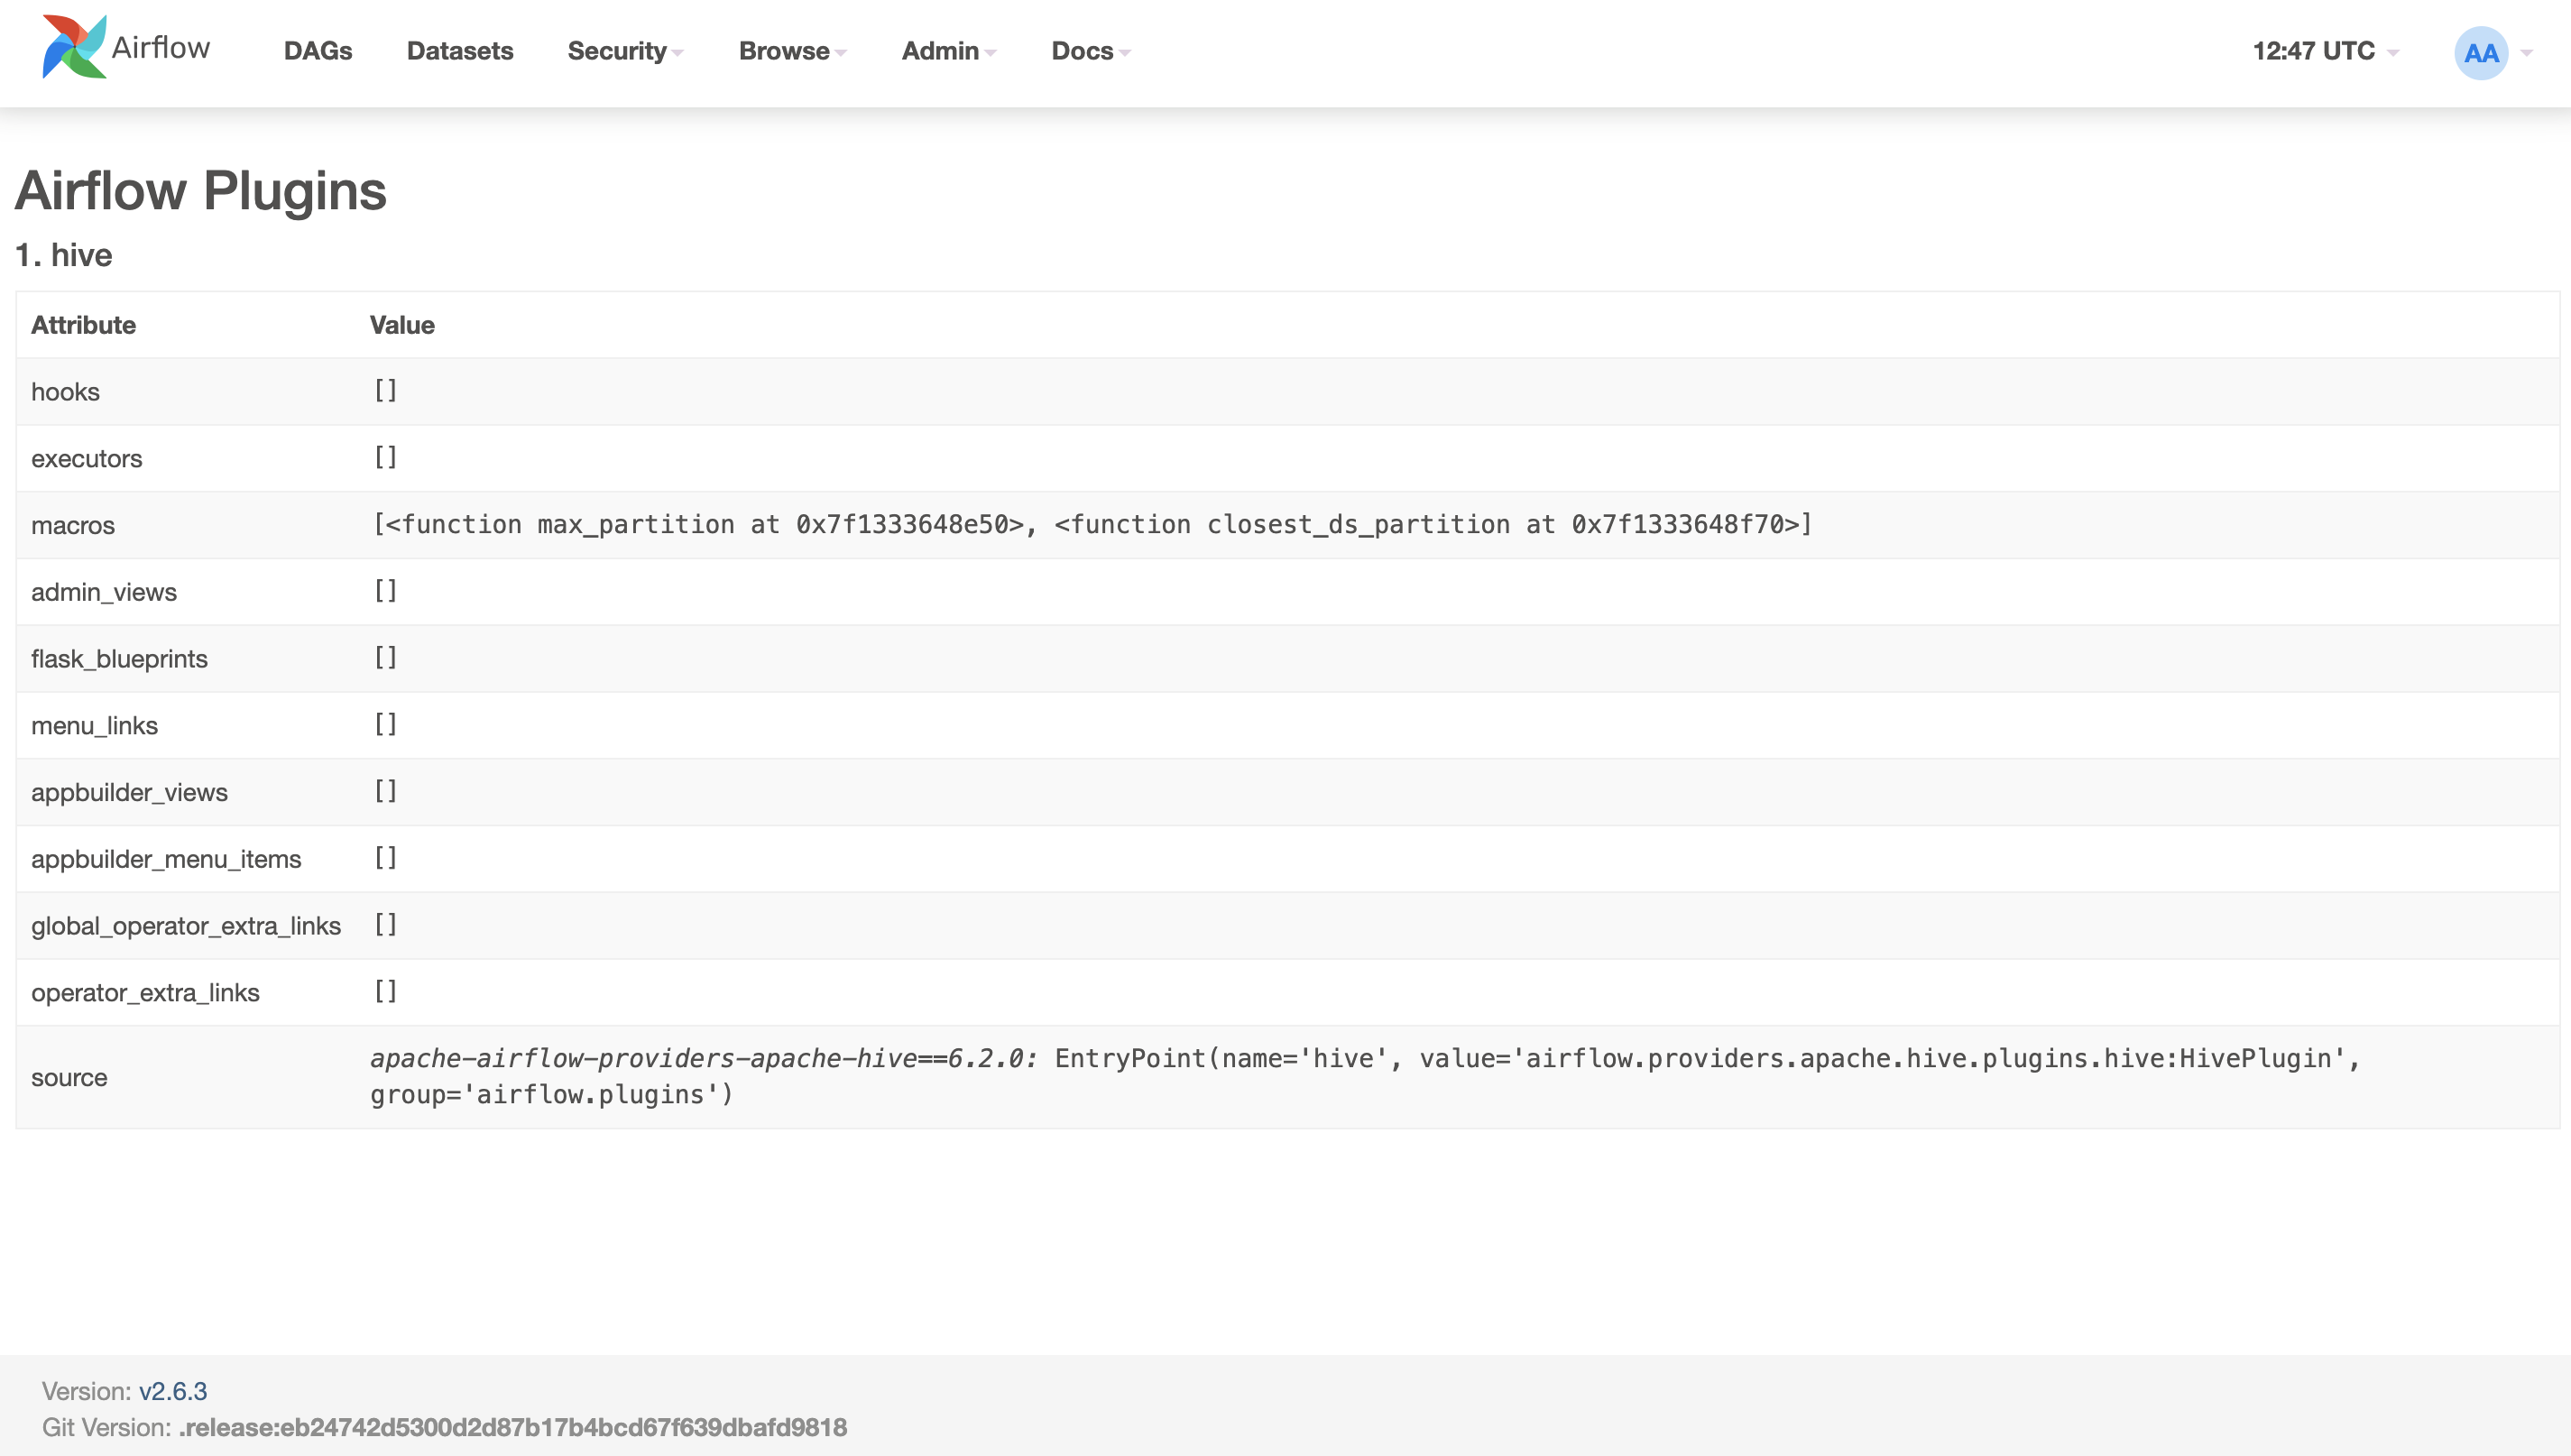
This page provides a list of available plugins. In order to add a plugin, you have to add a connection first.
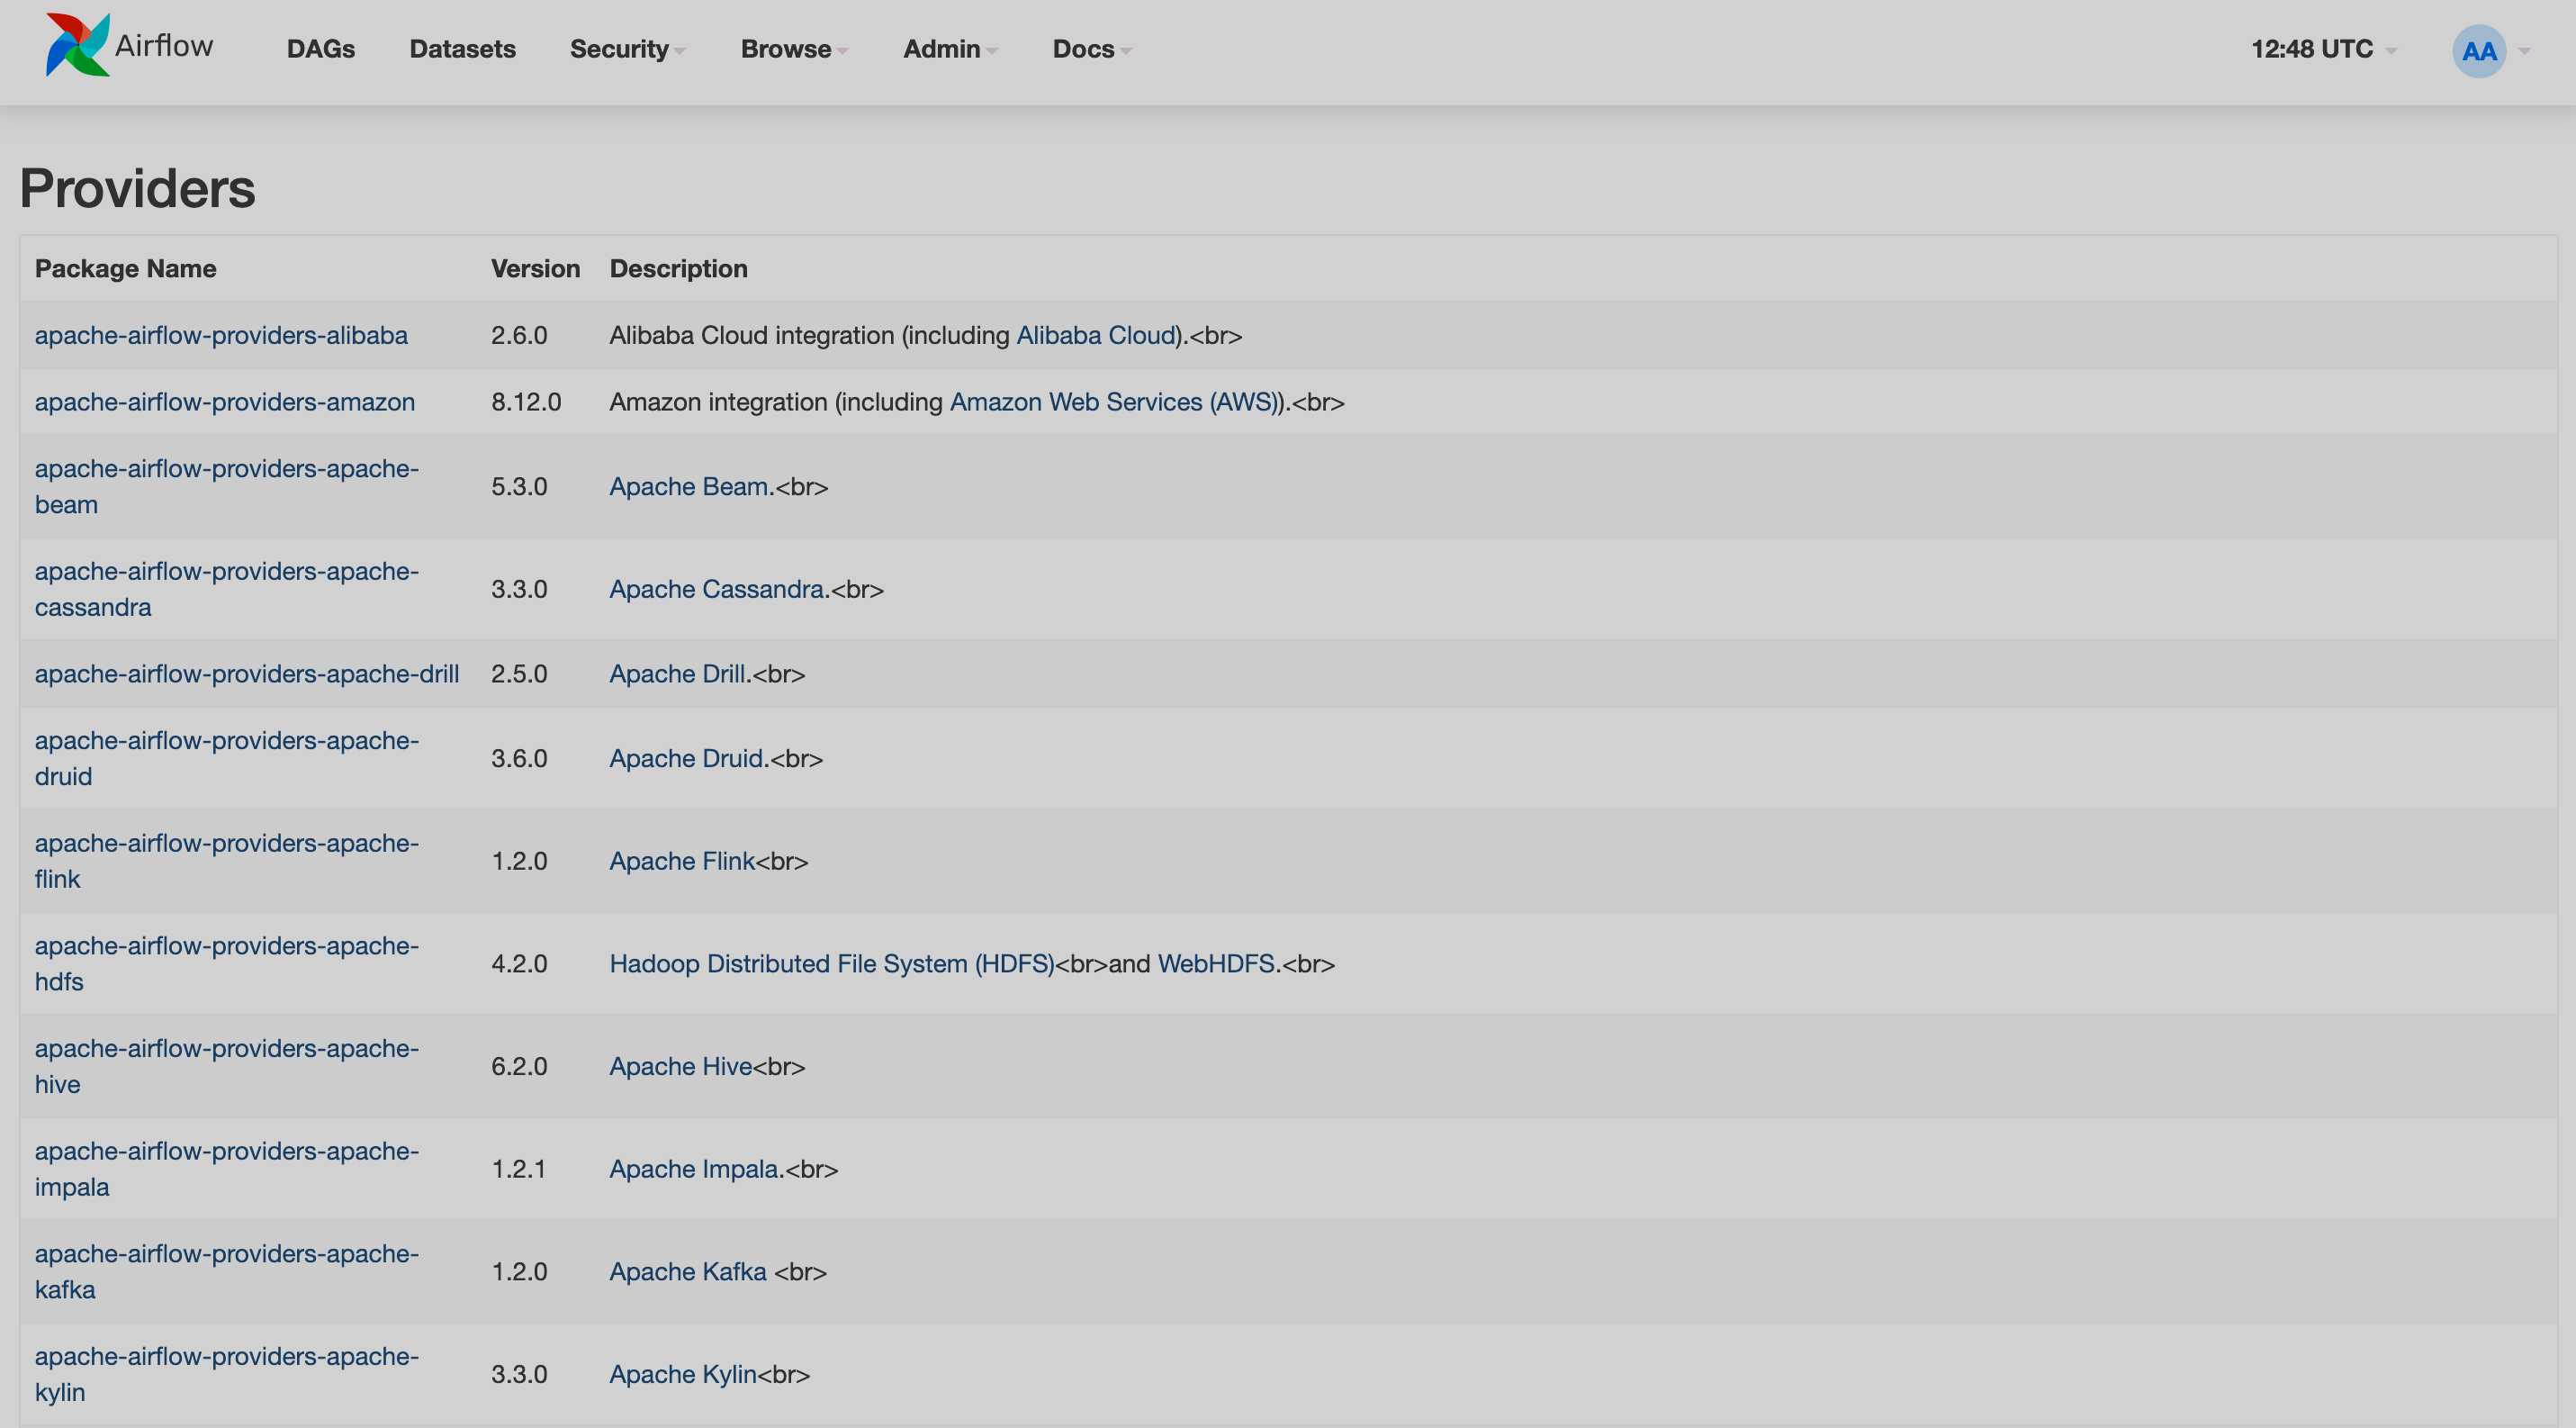
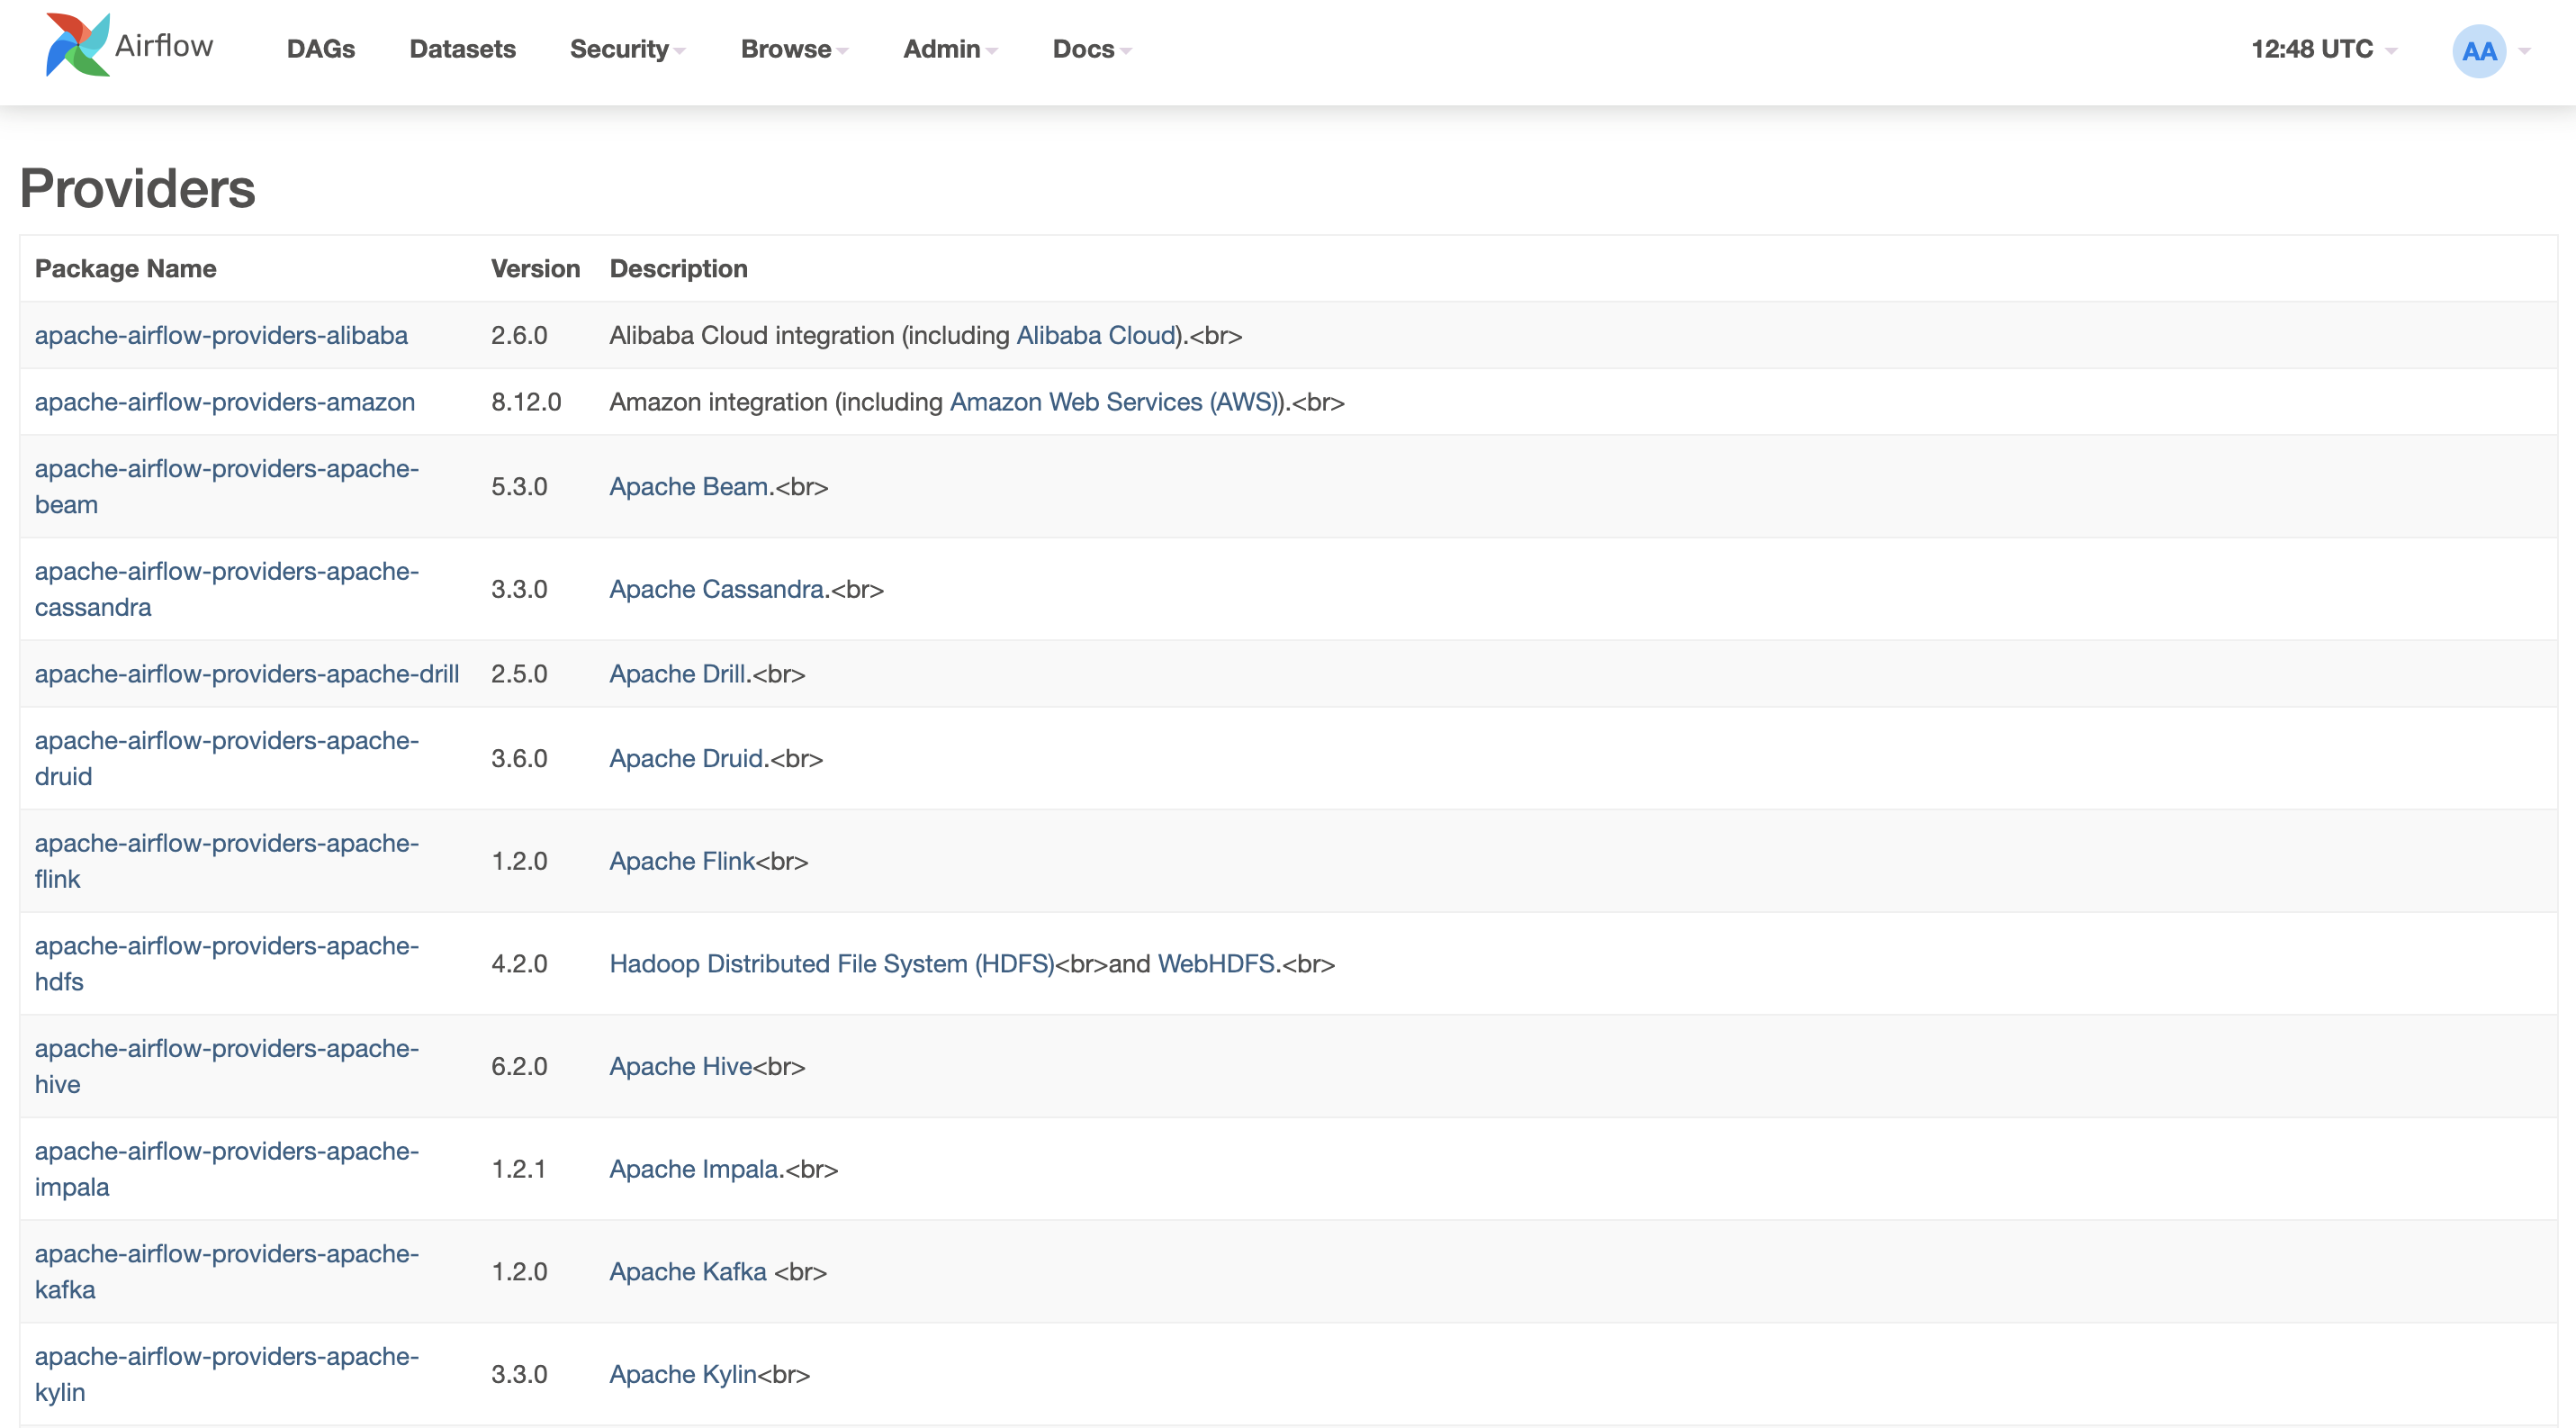
This page displays available providers for integration with other services.
By clicking on the provider’s name, you can navigate to the Airflow documentation page for that provider. The links in the description column lead to the services' official web pages.
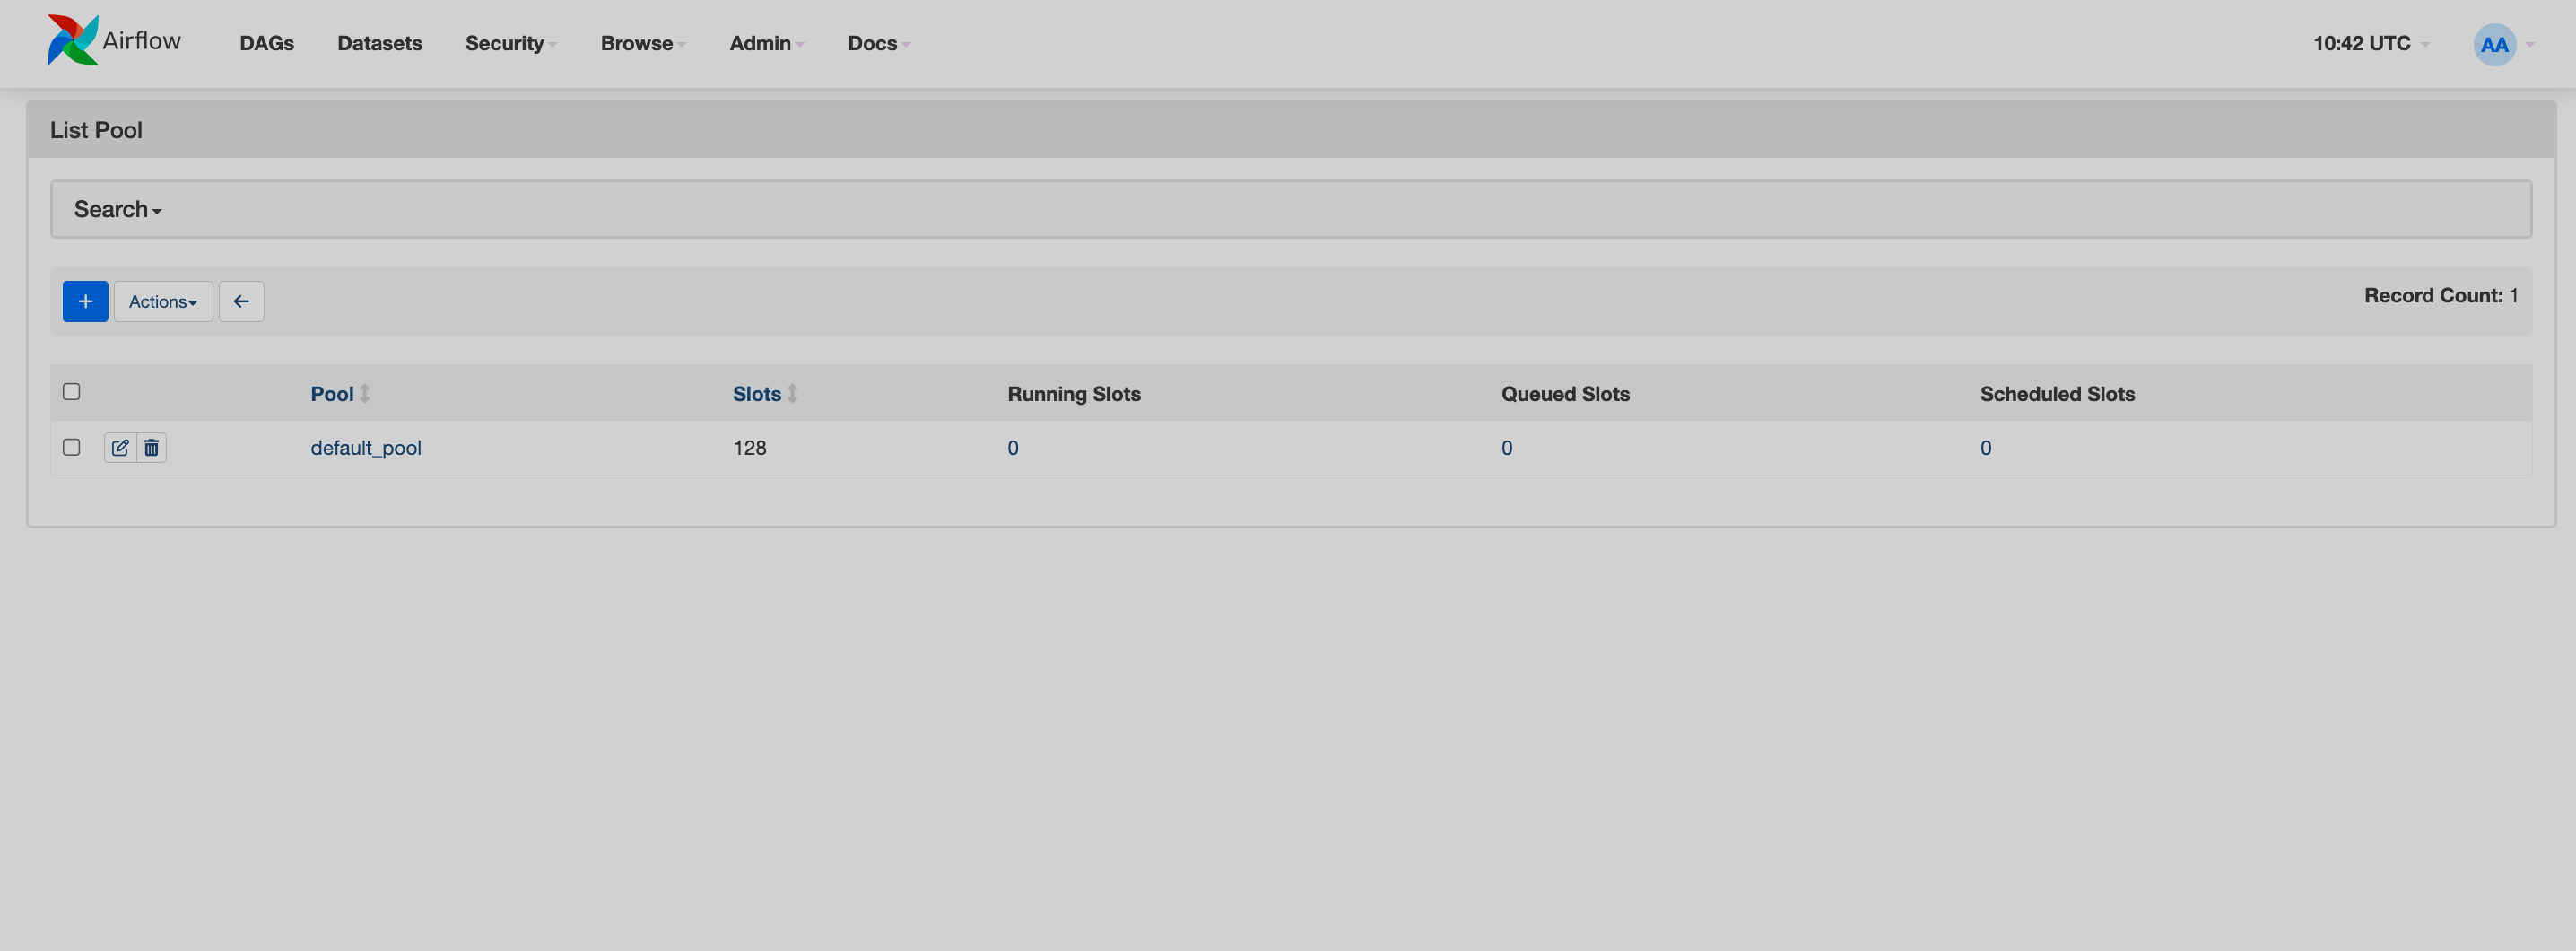
This page displays a list of existing pools. In Airflow, the pools allow you to limit the concurrency of a set of tasks. By default, all tasks run through a default pool.
Each pool has the following parameters:
-
Pool — the name of the pool. By clicking on a pool’s name, you can navigate to the list of tasks that belong to that pool.
-
Slots — the amount of tasks a pool can have.
-
Running Slots — the number of busy slots. By clicking on the amount of slots, you can navigate to the list of tasks that occupy those slots.
-
Queued Slots — the number of reserved slots for tasks in the queue. By clicking on the amount of slots, you can navigate to the list of tasks that occupy those slots.
-
Scheduled Slots — the number of slots required for the scheduled tasks. By clicking on the amount of slots, you can navigate to the list of tasks that occupy those slots.
To create a pool, click the plus sign and enter the pool parameters.
You can edit or delete a pool by selecting the corresponding action.
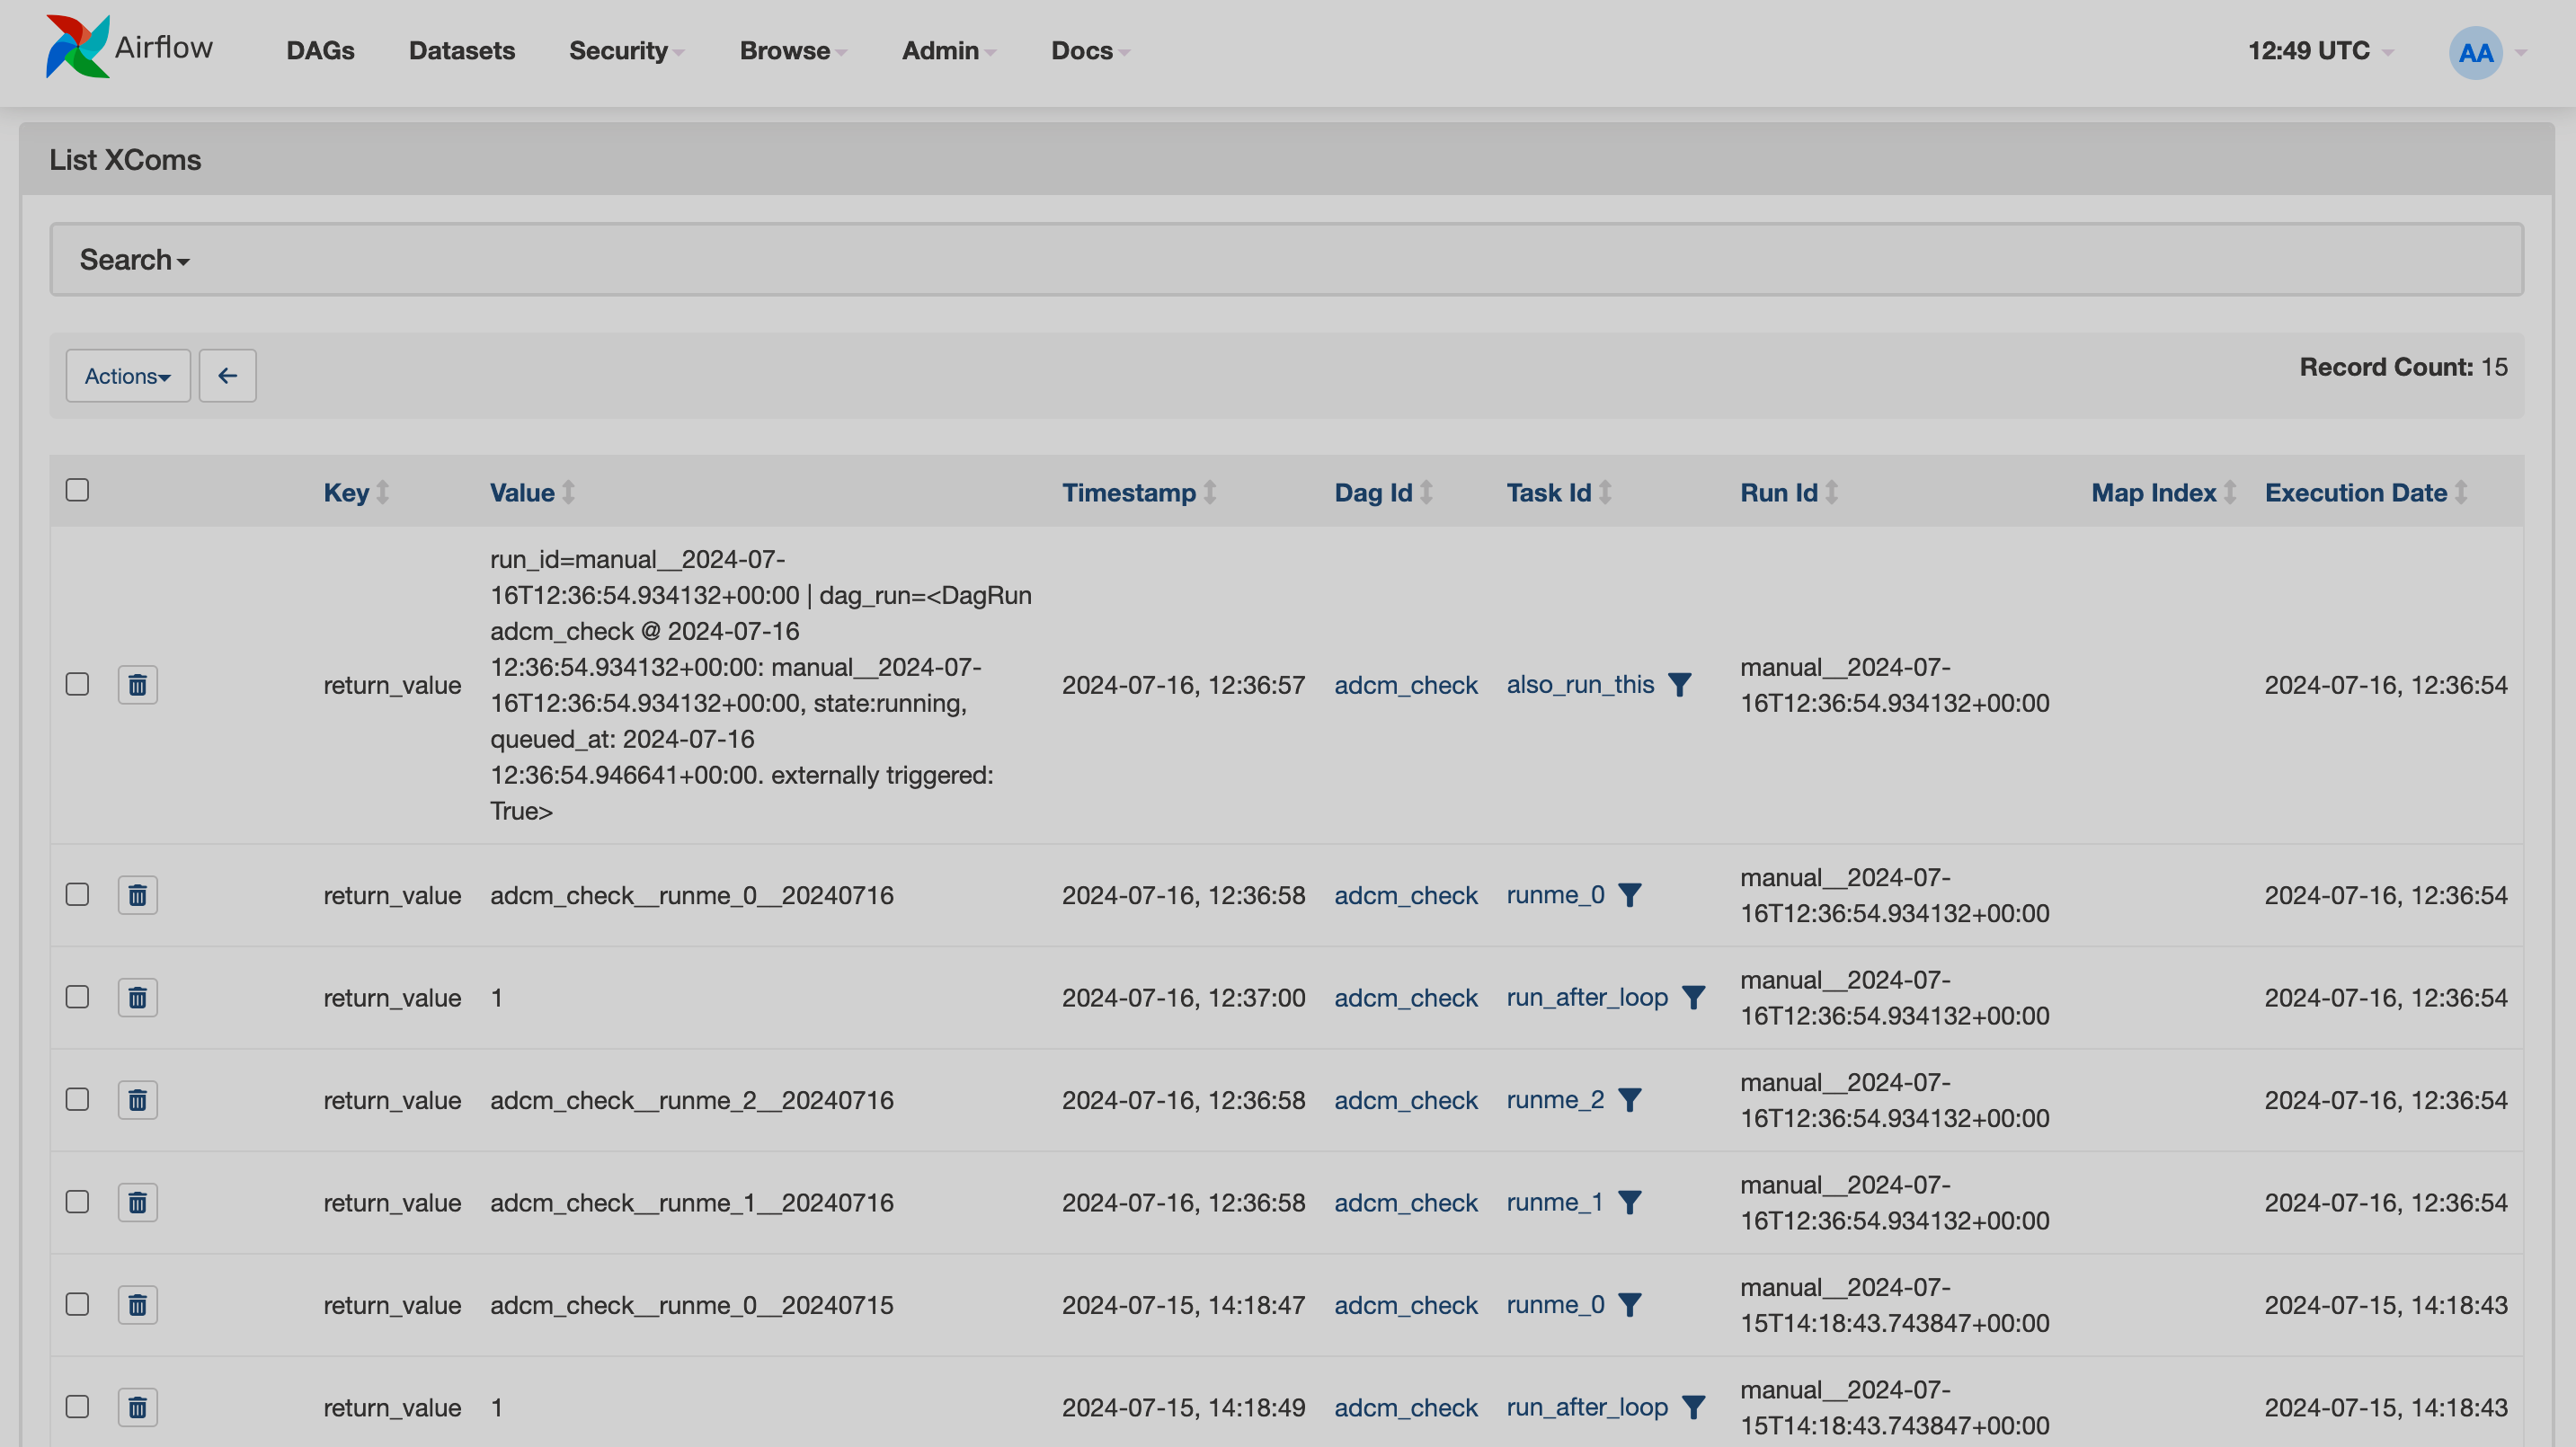
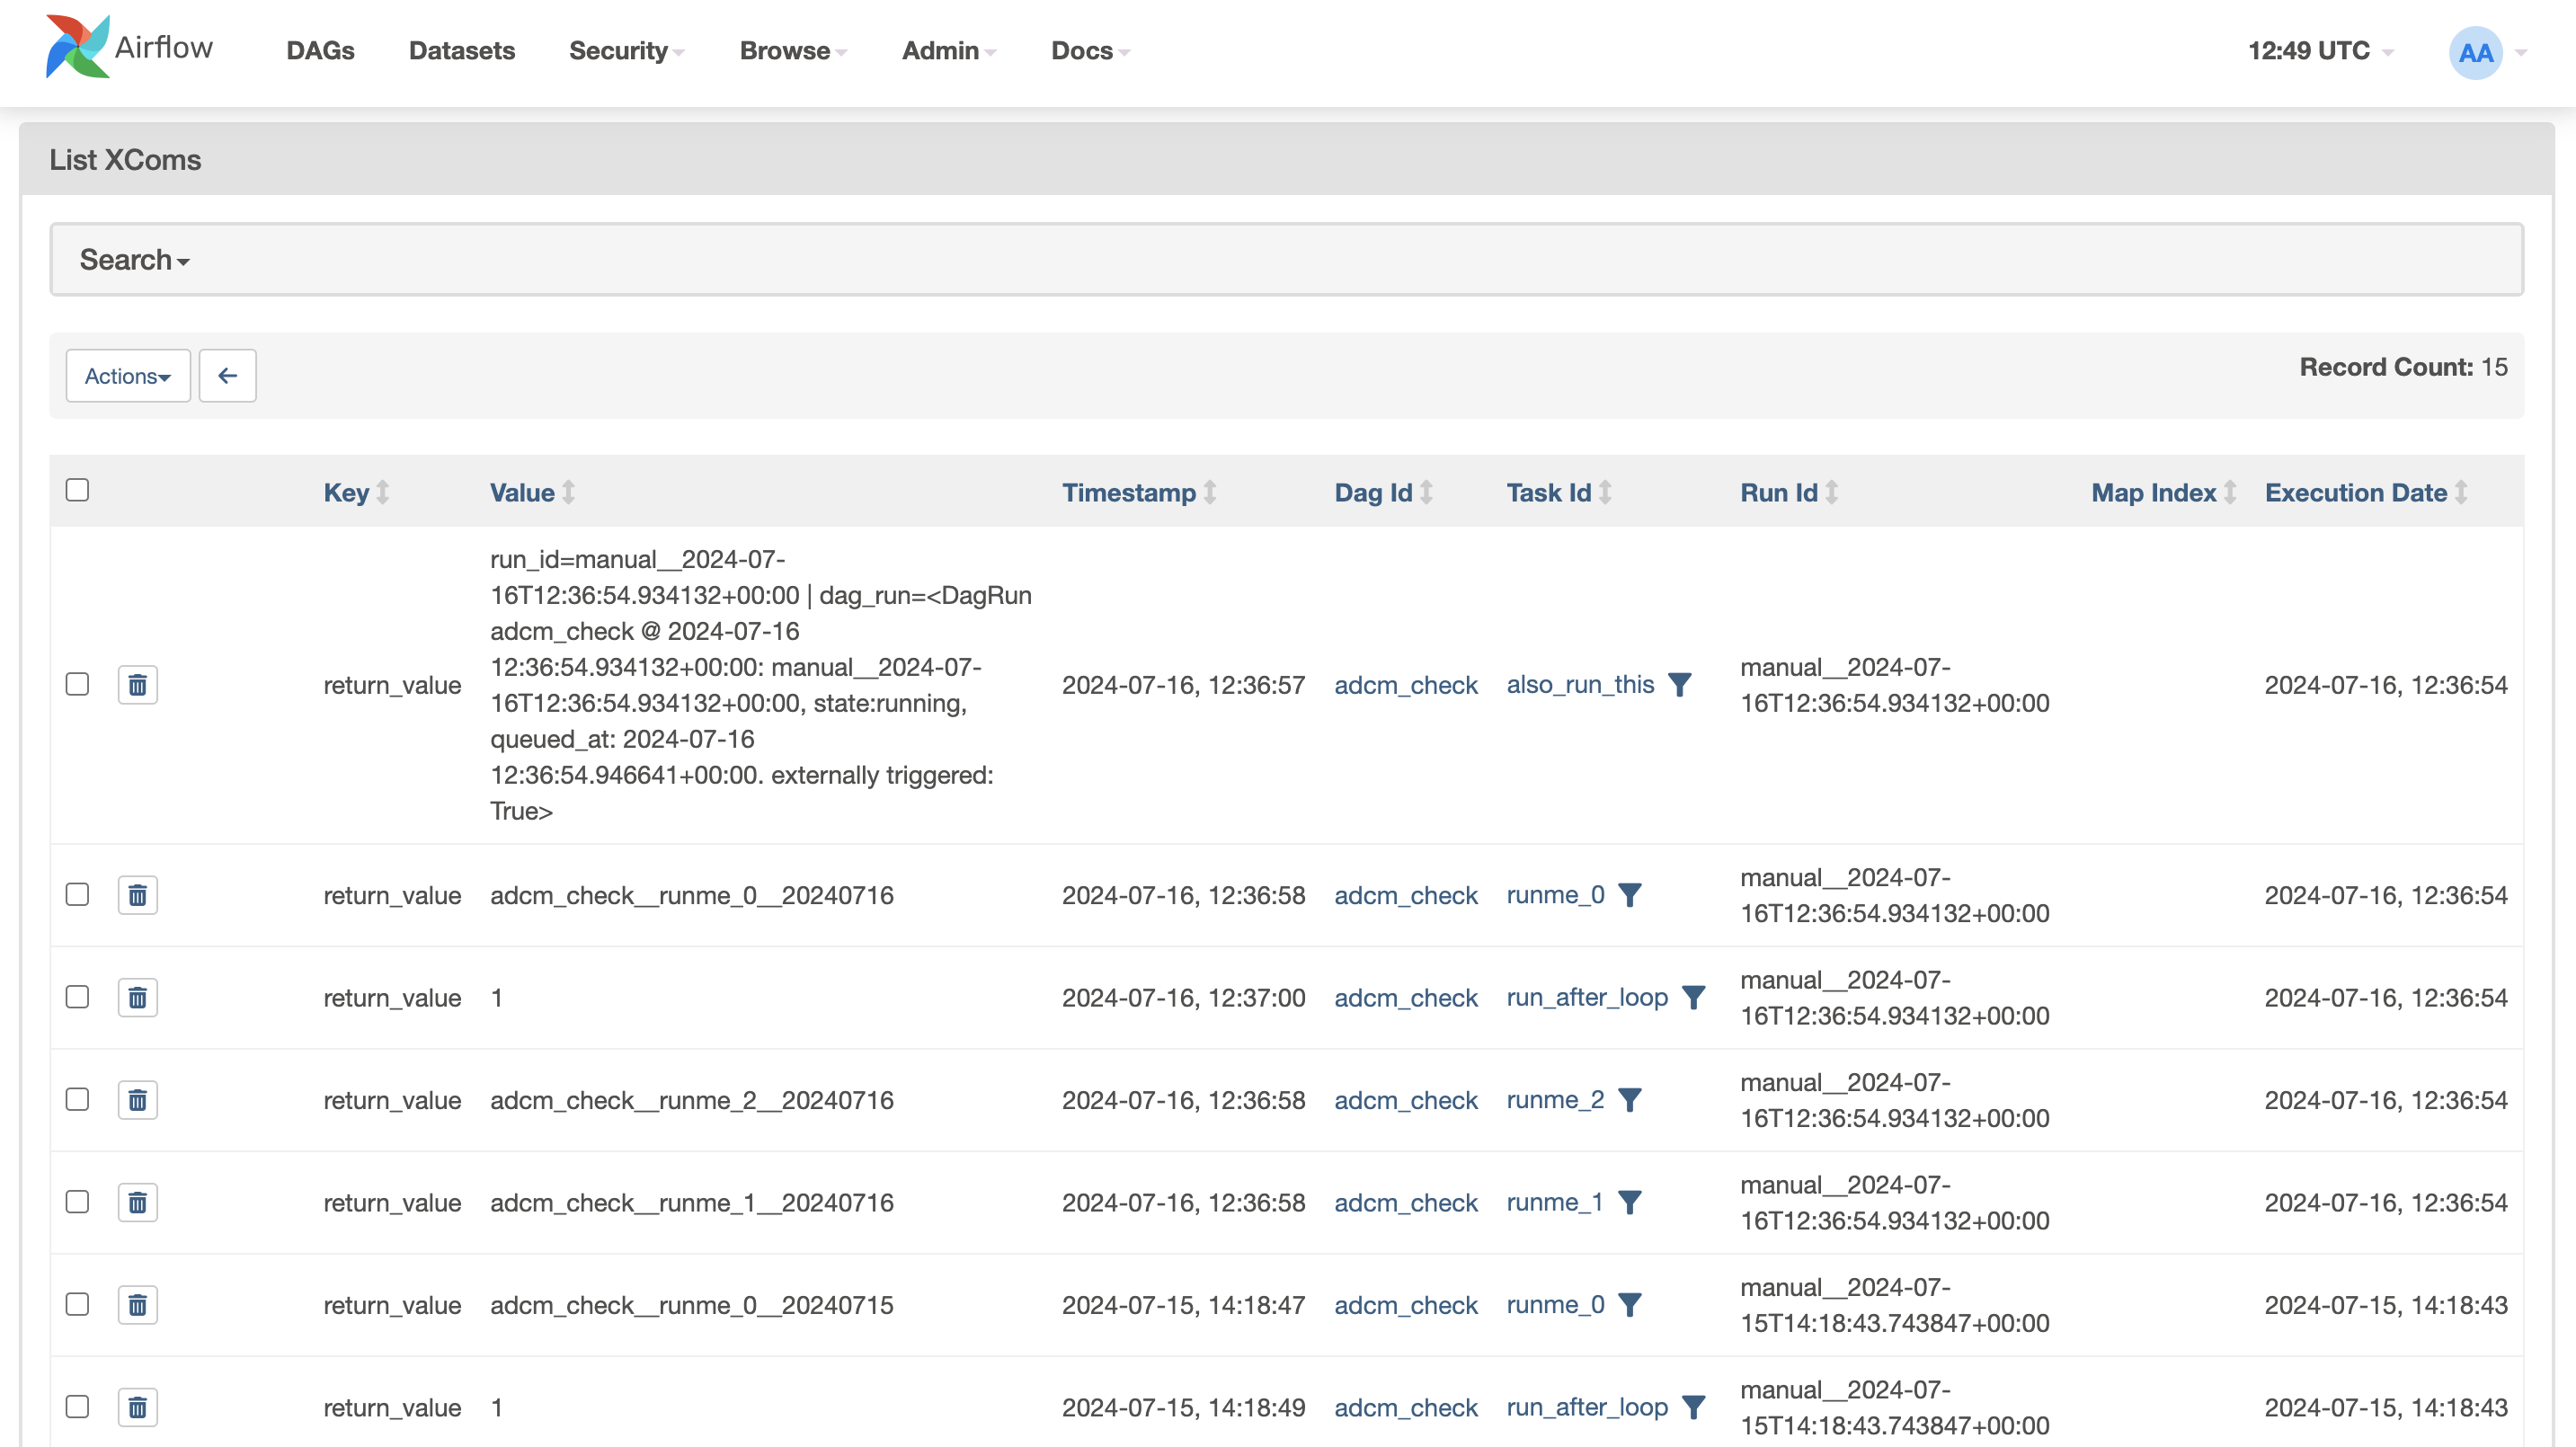
In Airflow, XComs are tools that enable sharing data between tasks. On this page, you can see a list of available XComs.
Docs
The Docs menu provides links to the following helpful resources:
-
Documentation — the official Airflow documentation.
-
Airflow Website — the official Airflow website.
-
GitHub Repo — the Airflow project repository on GitHub.
-
REST API Reference (Swagger UI) — the REST API methods description in the Swagger format.
-
REST API Reference (Redoc) — the REST API methods description in the Redoc format.
Flower UI
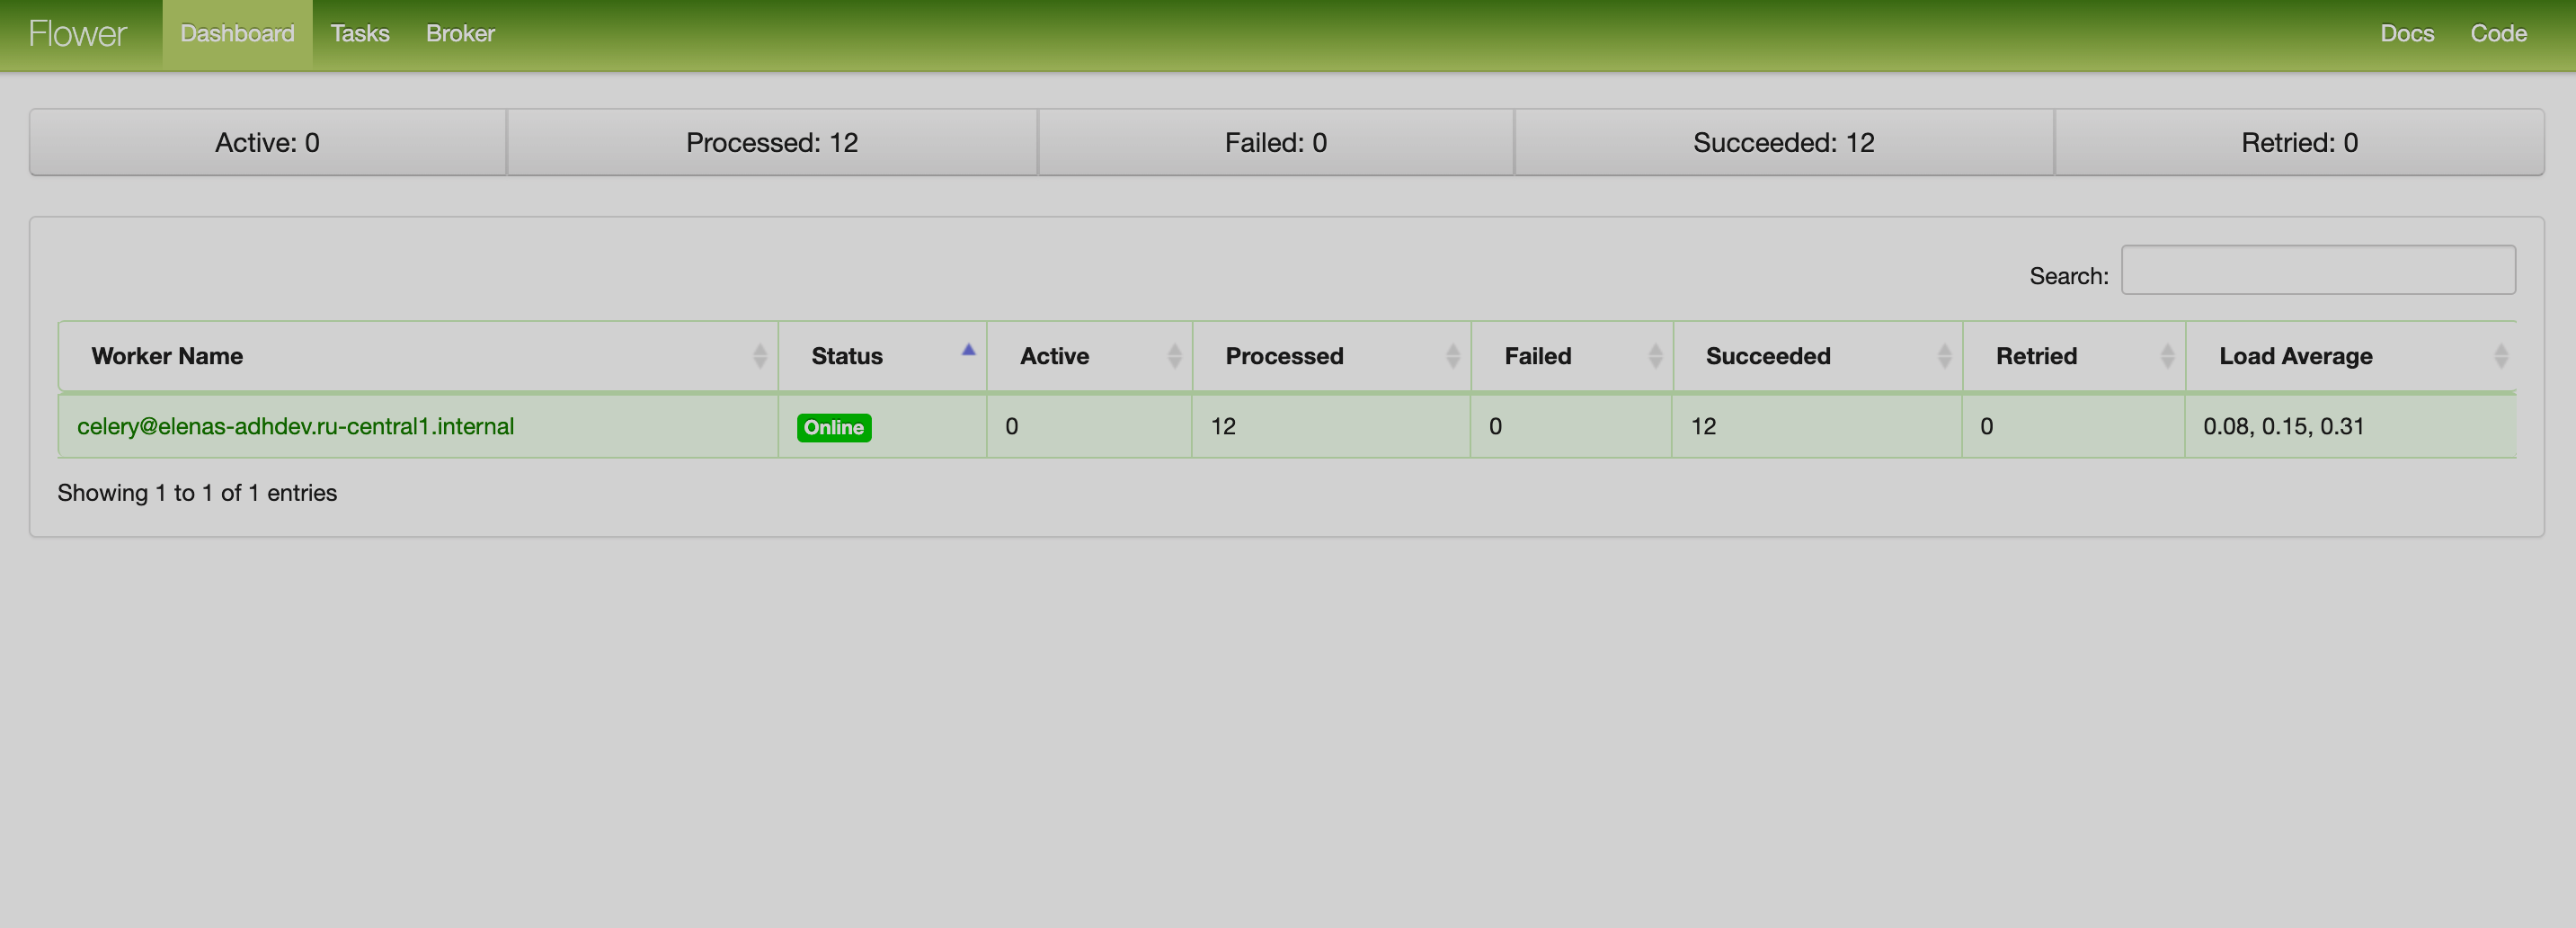
Flower is a web UI tool for monitoring and administrating Celery clusters. The Flower web UI has four tabs:
-
Workers — the page provides a list of existing Celery workers and information about them.
-
Tasks — the page displays a list of tasks with their worker, UUID, state,
args/kwargs, and start and runtime information. -
Broker — the page shows information about the Celery brokers.
-
Documentation — the tab redirects to the official Flower documentation.
For more information about Flower, see the Flower documentation.