

Ozone UIs overview
Each Ozone component has its own web UI which displays diagnostic and status information. If a component is distributed among several hosts, then each of those hosts will have a UI for that component. You can find links to these UIs on the Info tab of the Ozone service in the ADCM UI.
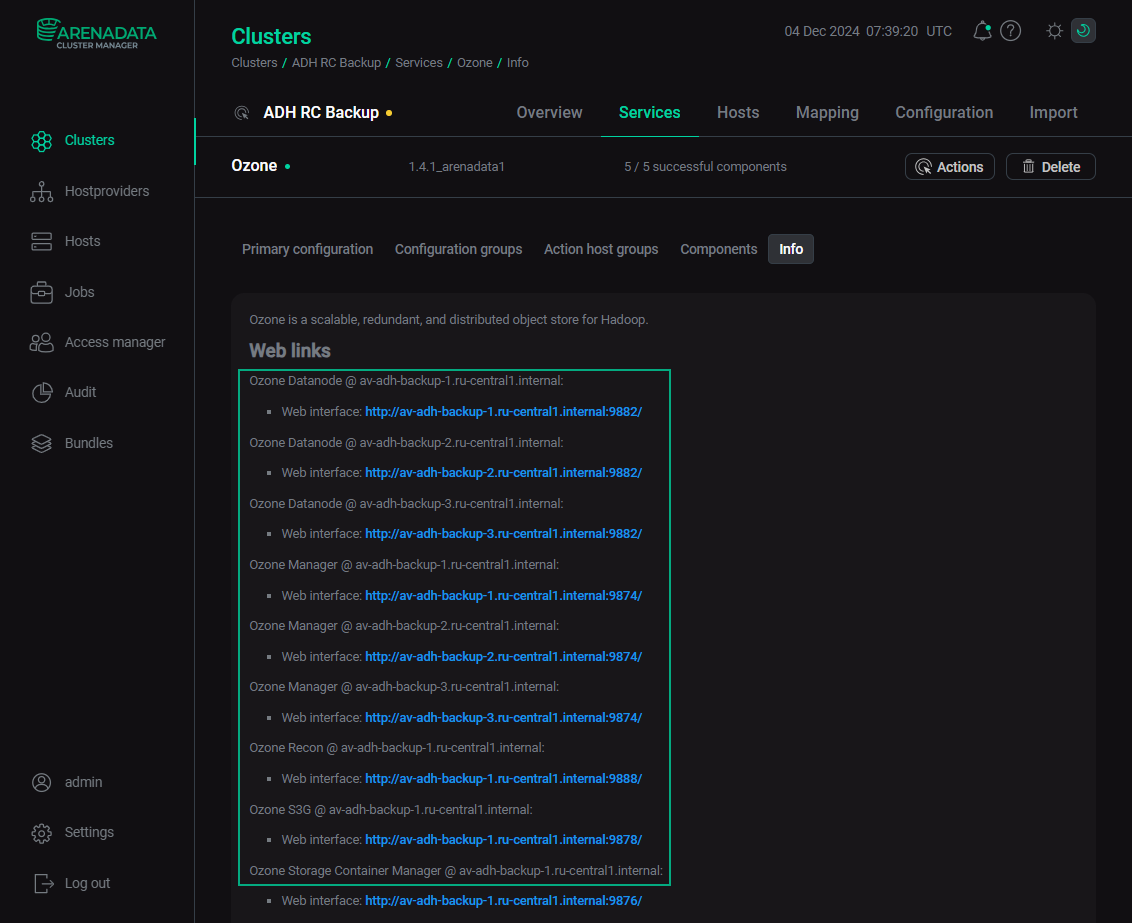
A component web UI URL has the following form: http://<node‑hostname>:<component-port>/.
Example: http://adh-host1.ru-central1.internal:9876/.
For secure clusters, use https:// instead of http://.
The default web server ports are listed in the table below.
| Component | Port |
|---|---|
Ozone Datanode |
9880 |
Ozone Manager |
9874 |
Ozone Recon |
9888 |
Ozone S3G |
9878 |
Ozone Storage Container Manager |
9876 |
Ozone Datanode UI
Overview
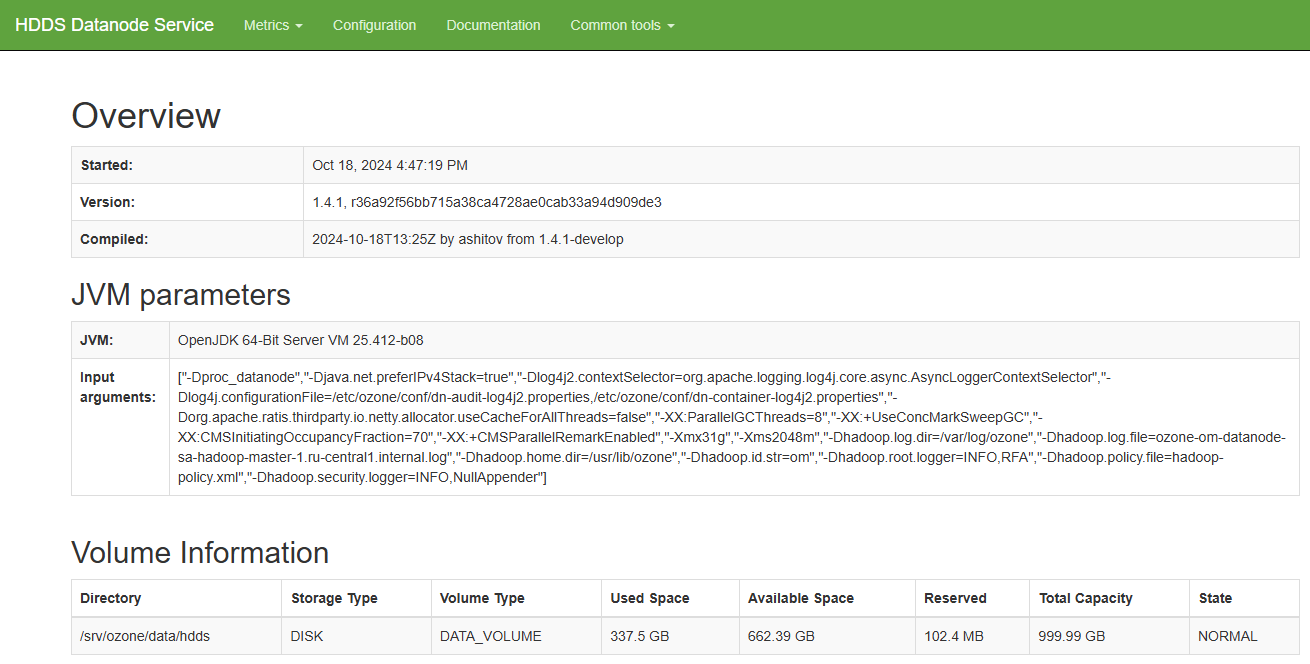
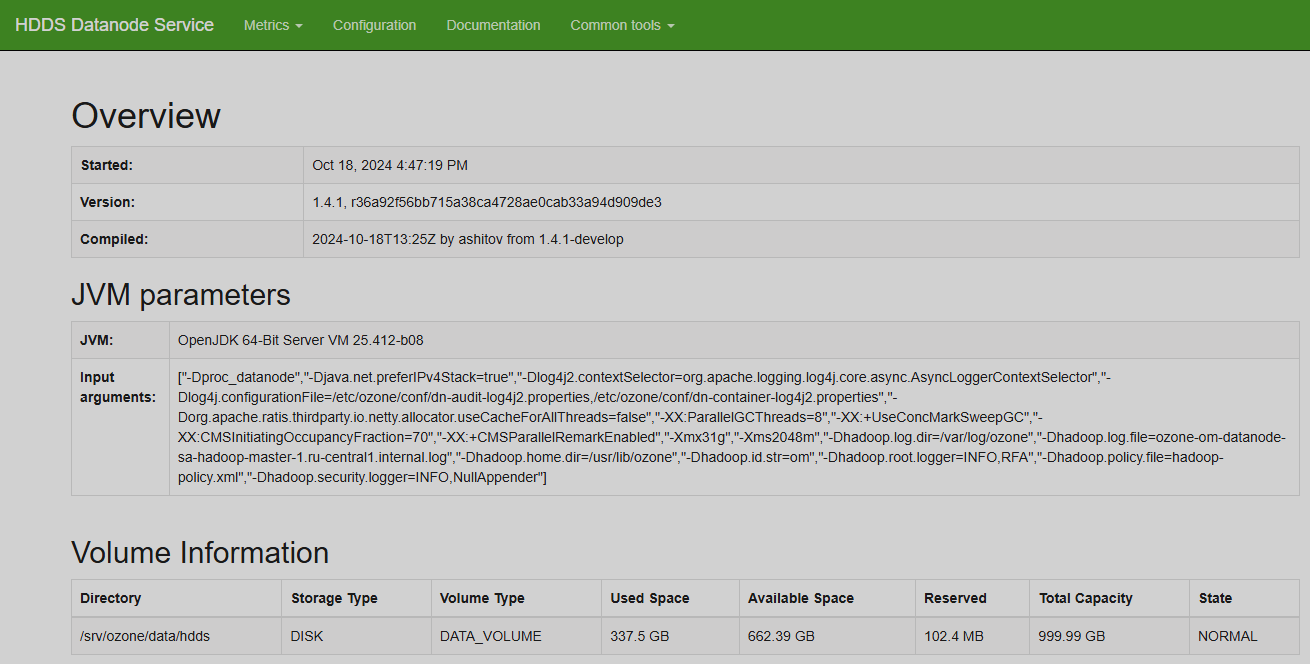
Start page of the Ozone Datanode UI is the Overview page. It contains the following information:
-
Service details:
-
time started;
-
version and checksum;
-
time compiled, user, and source branch.
-
-
Java virtual machine details: version and input arguments string.
-
Volume information:
-
path to the volume directory;
-
storage type;
-
volume type;
-
disk usage statistics;
-
volume state.
-
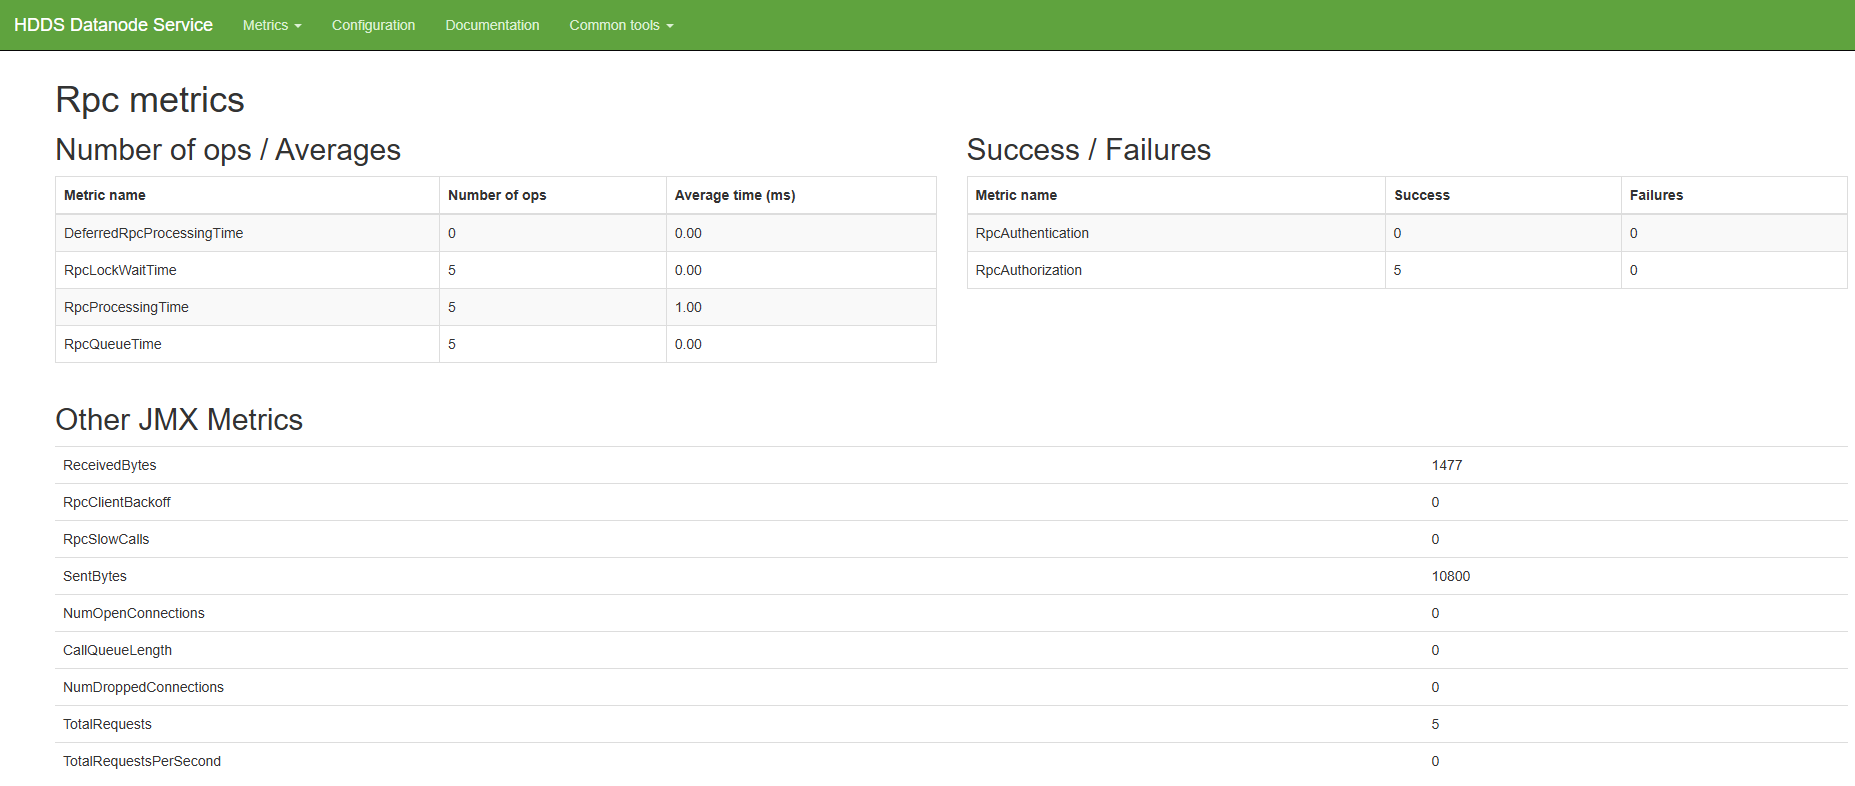
Metrics
The Metrics group contains the Rpc metrics page. This page contains the following information:
-
Number of executed operations and their average times.
-
Success and failure statistics on RPC authentication and authorization metrics.
-
Other Java management extensions (JMX) metrics.

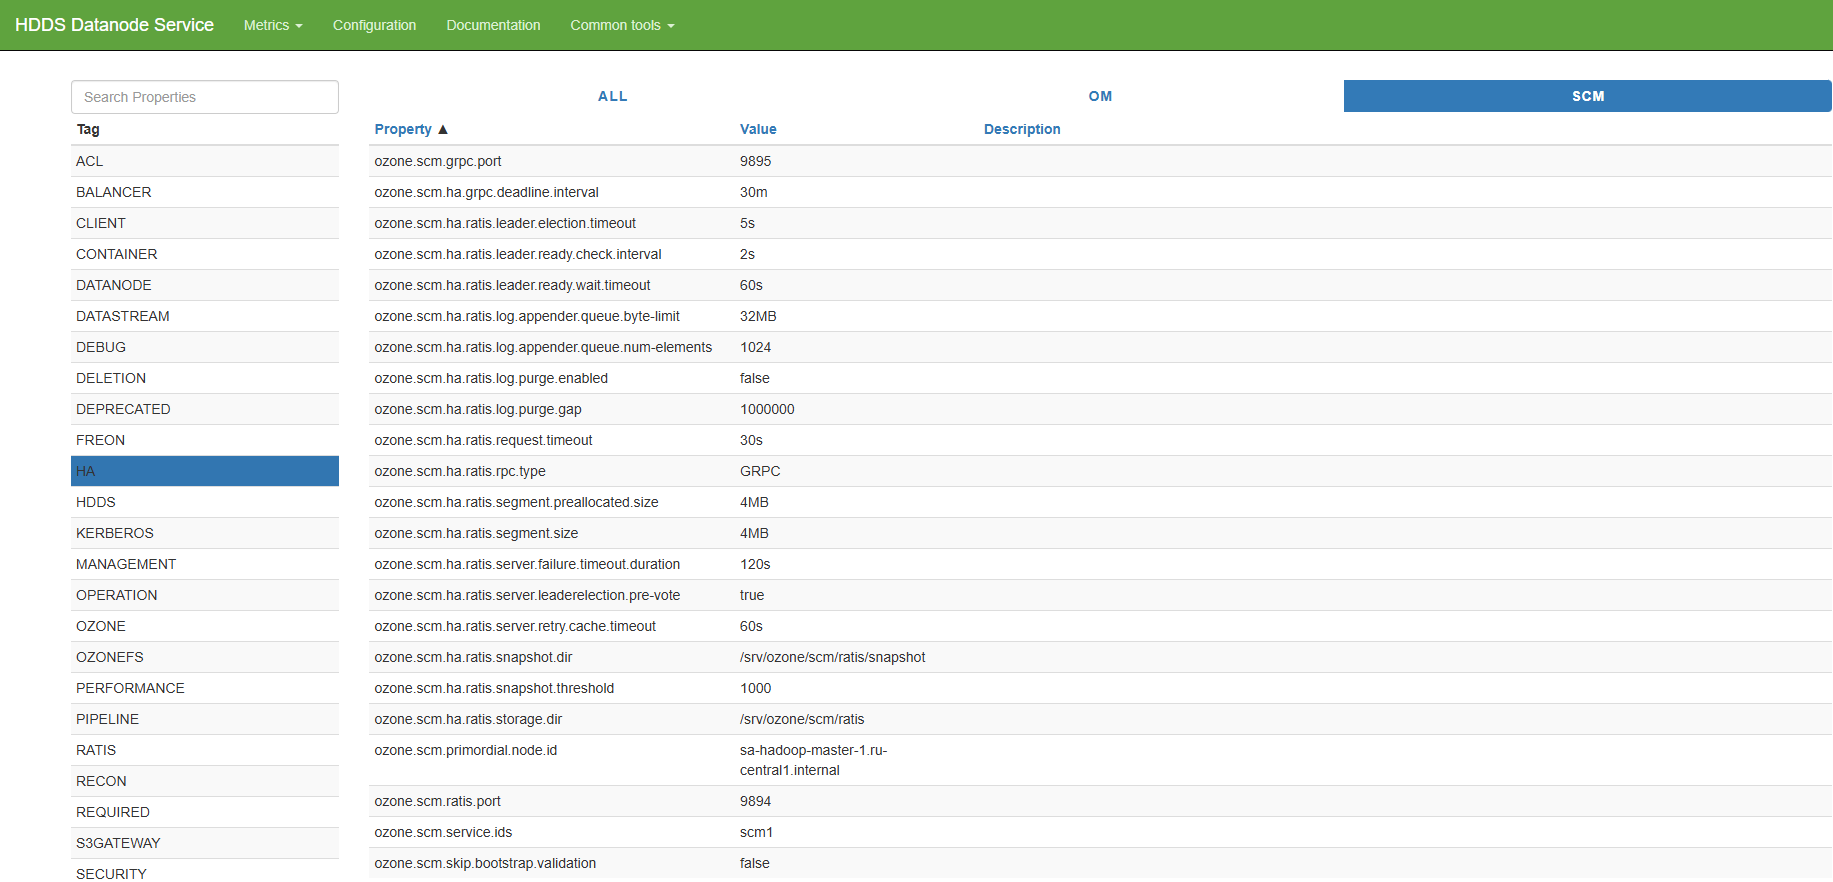
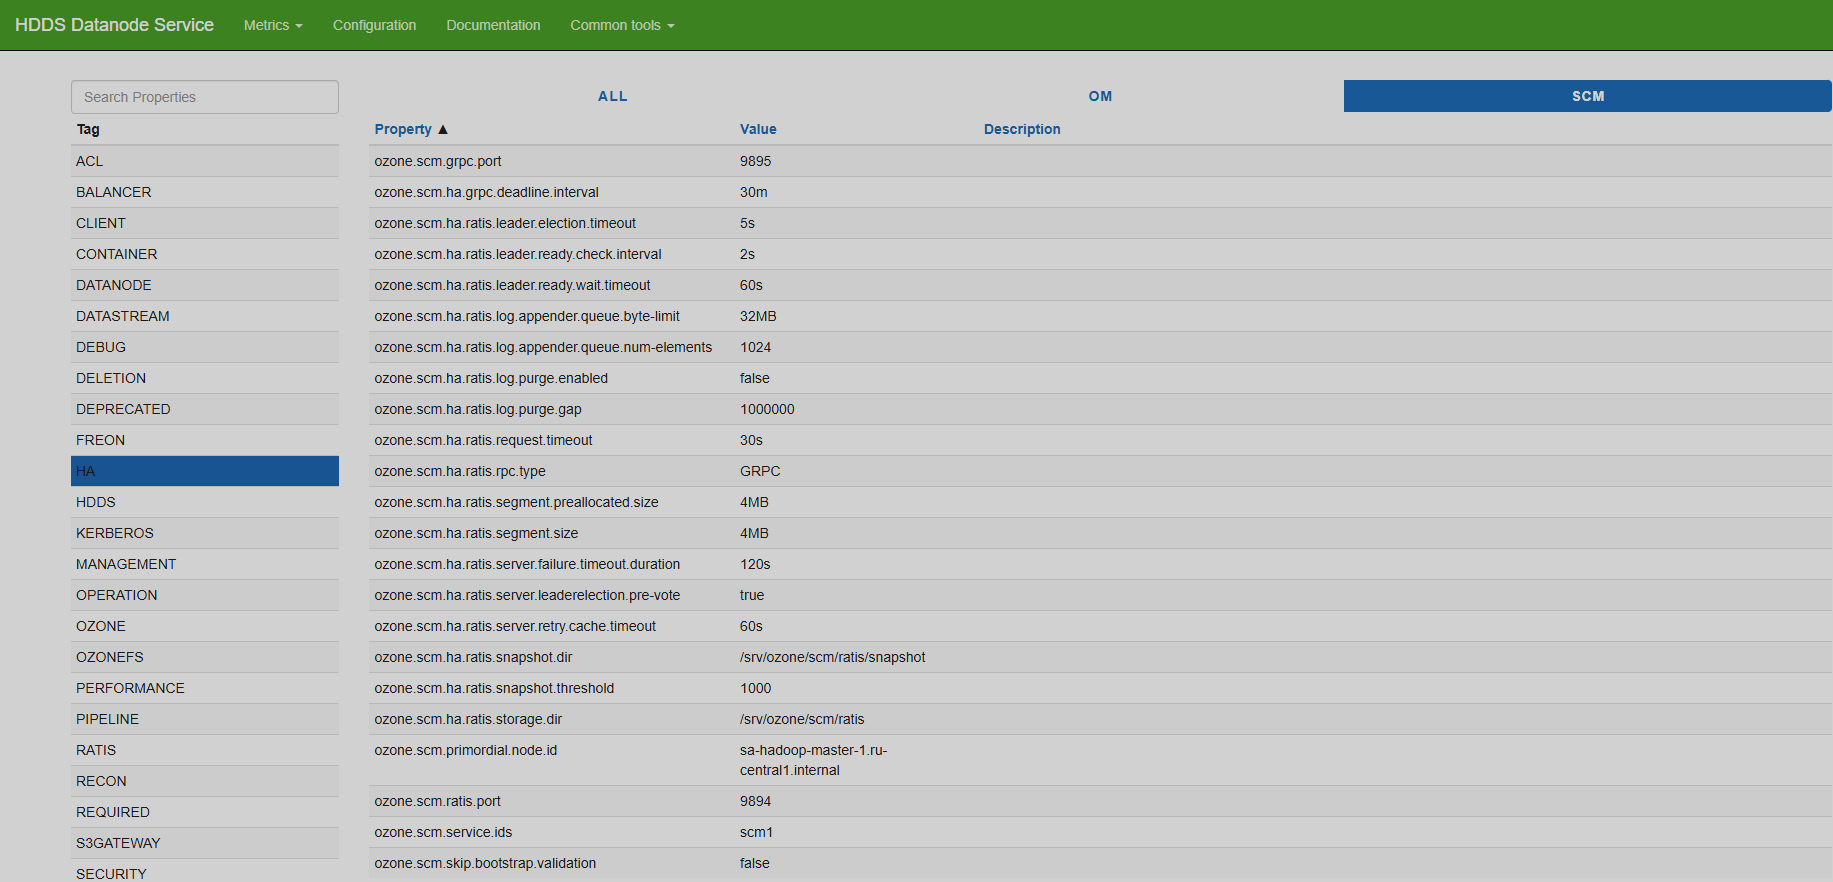
Configuration
The Configuration page contains a list of all configuration parameters pertaining to the Ozone service functioning. You can search for parameters by their name or value in the Search Properties field. Also, you can filter the parameter list by highlighting one or more tags listed in the leftmost part of the screen. To view the Ozone Manager parameters, click OM in the top part of the screen, or click SCM to view the Storage Container Manager parameters. Moreover, the parameter list is sortable by name and by value.
For example, to view the configuration parameter values related to the high availability mode in the Storage Container Manager component, highlight the HA tag and select the SCM tab.
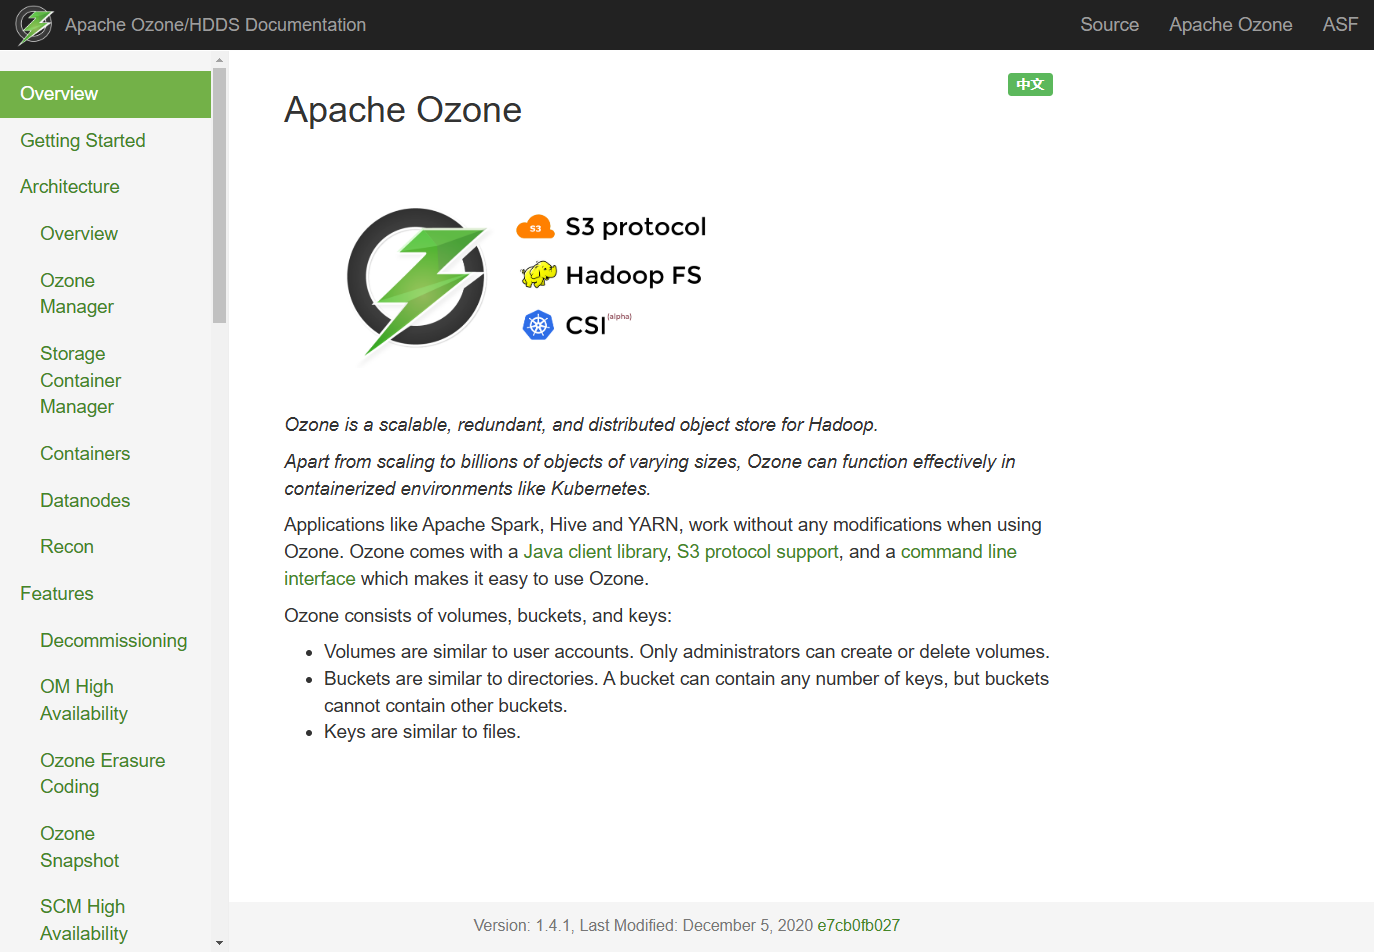
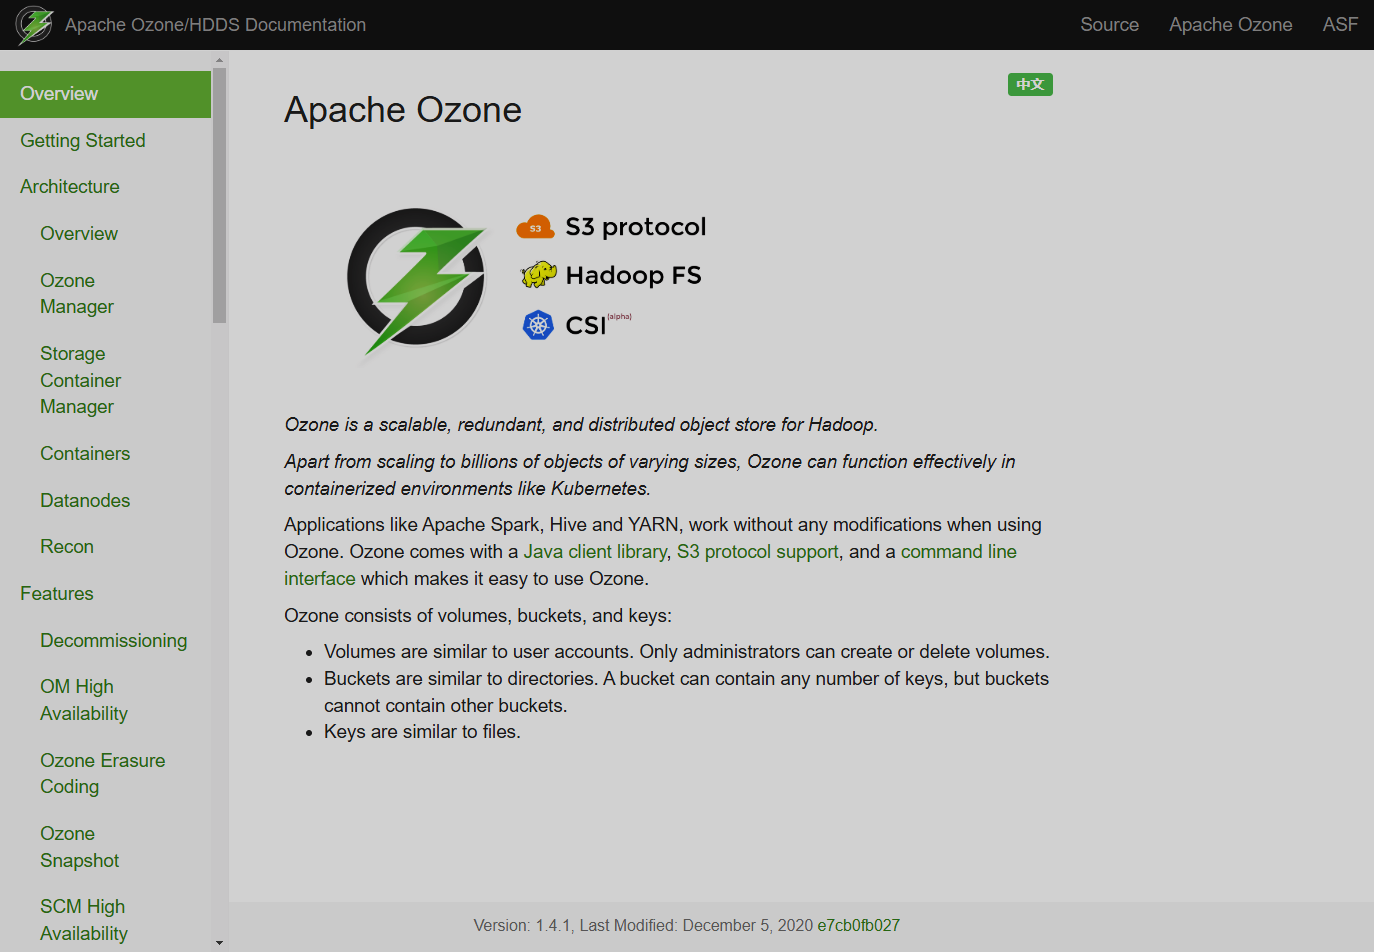
Documentation
The Documentation page contains the Apache Ozone manual. It is available in English and Chinese — the language switch is in the top right corner. Also there are links to the Ozone source code repository, Apache Ozone, and Apache Software Foudation official websites.
Common tools
The Common tools group contains the JMX, Config, Stacks, and Log levels pages.
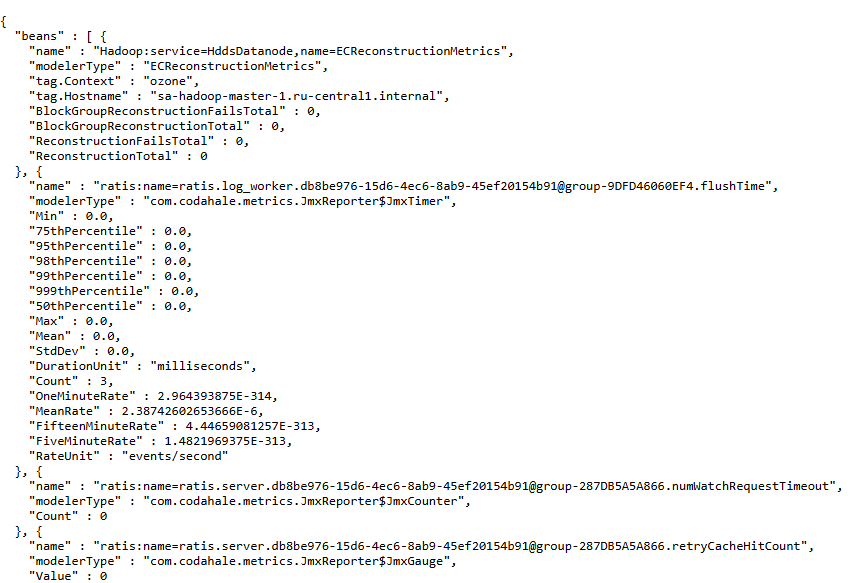
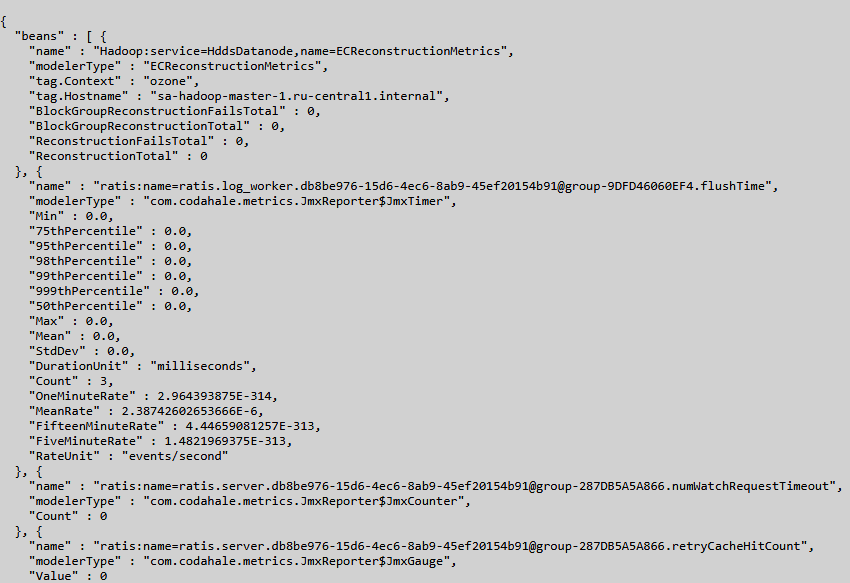
JMX
The JMX page displays the listing of the JMX metrics of Java applications used by Ozone.
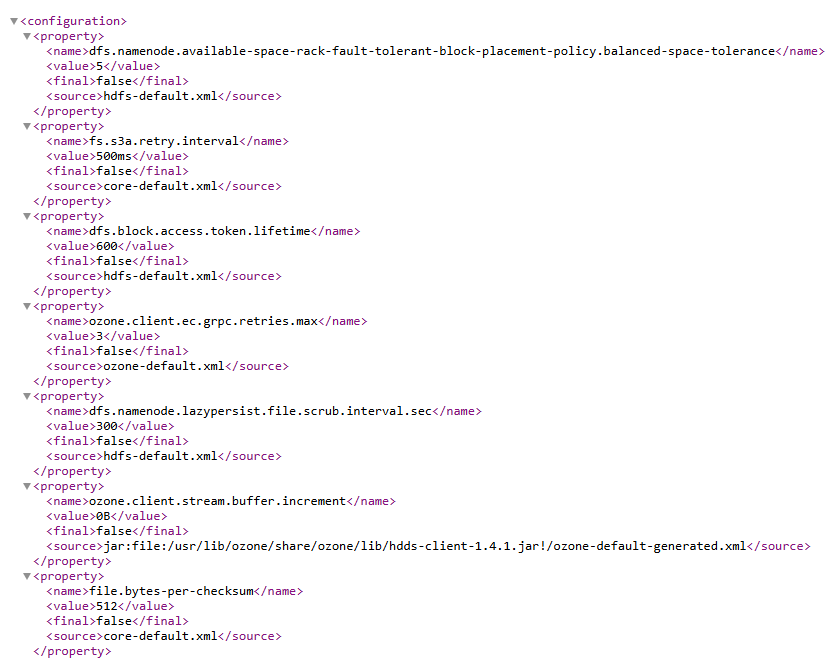
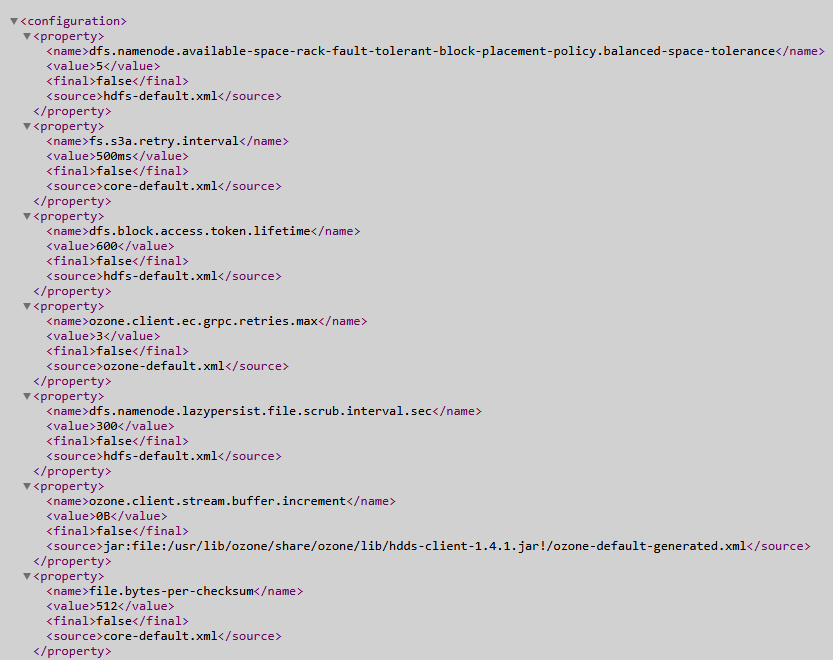
Config
The Config page contains the listing of all configuration parameters pertaining to the Ozone service functioning in XML format.
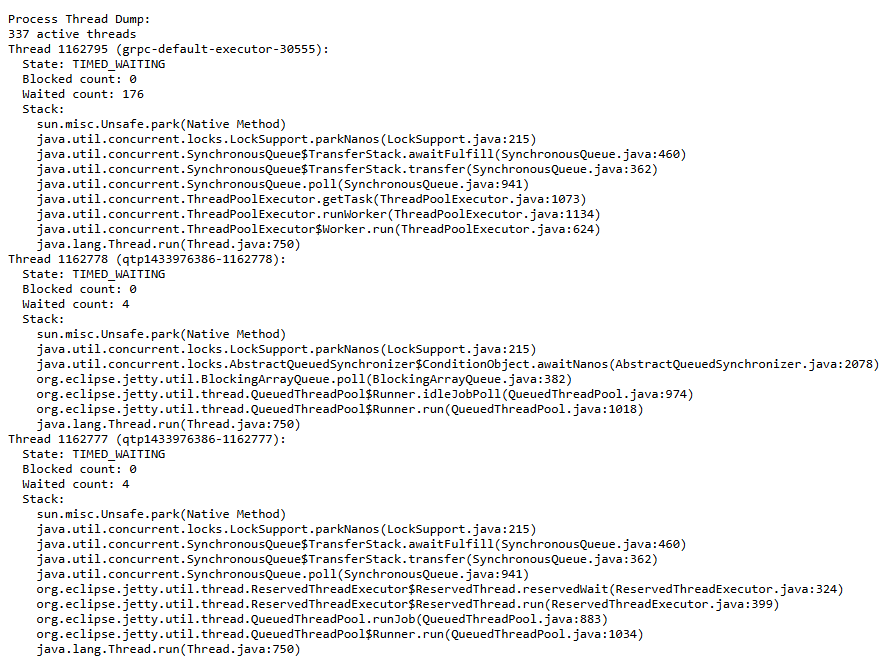
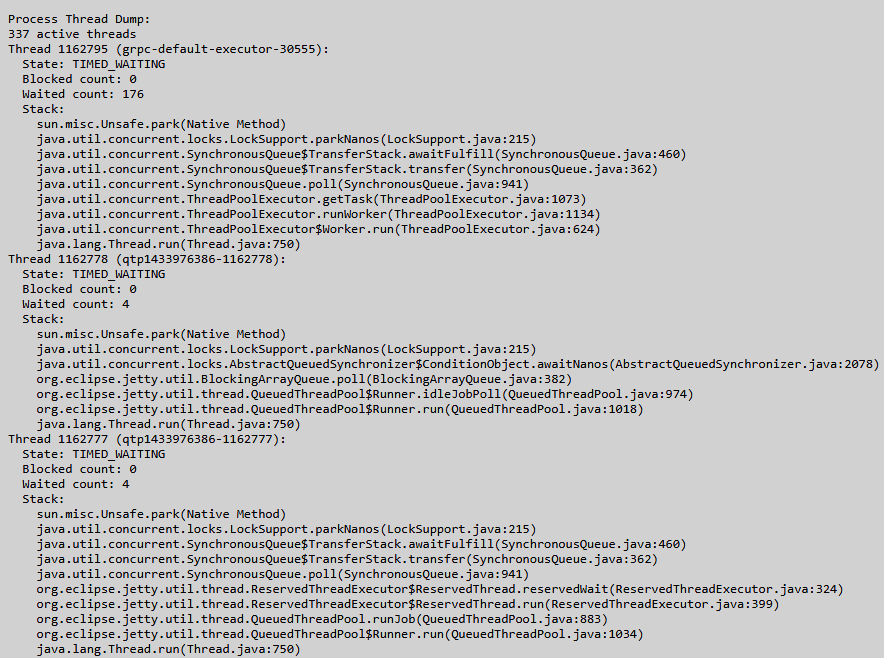
Stacks
The Stacks page contains the list of thread stacks of the JVM used by the Ozone service.
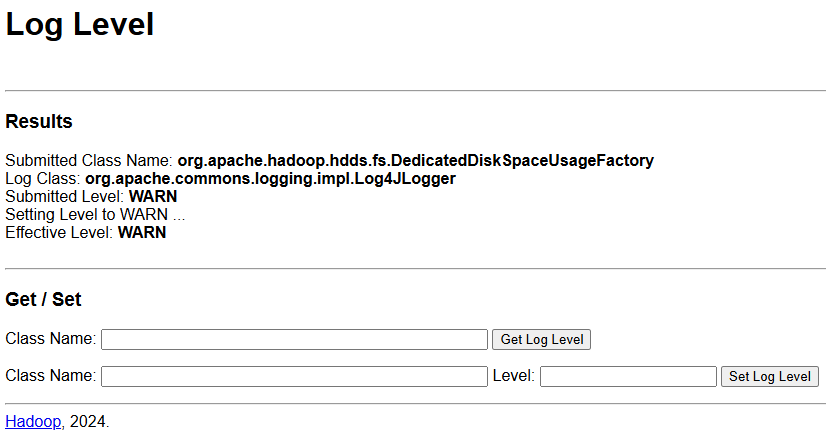
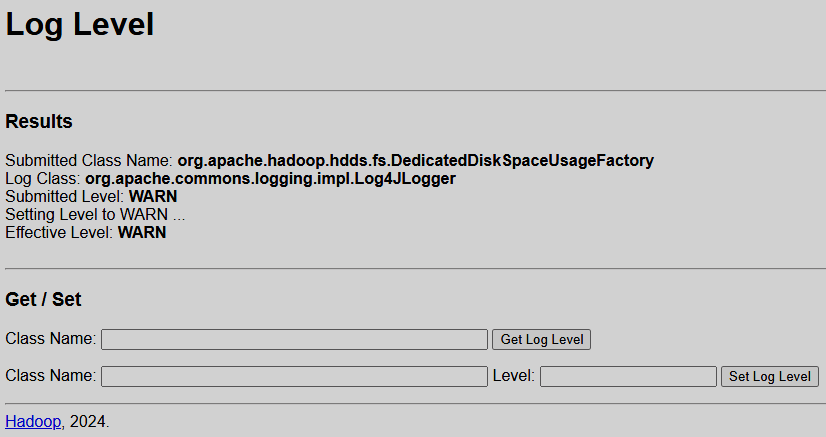
Log levels
The Log levels page allows you to view and set the logging levels of classes used by Ozone.
To view the logging level of a class, paste its name in the first Class Name field and click Get Log Level.
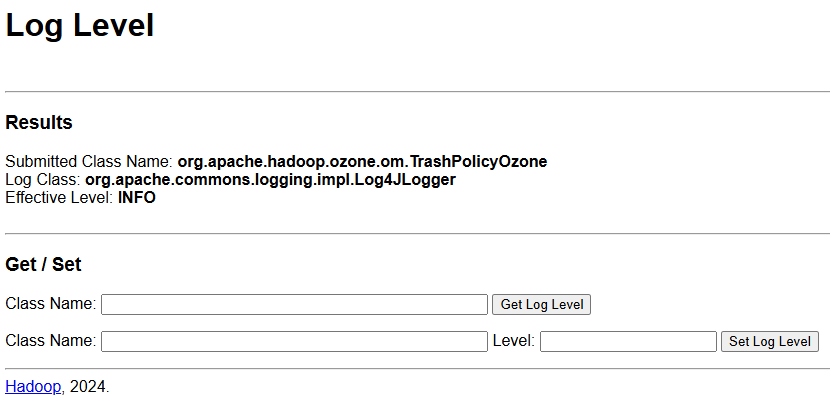
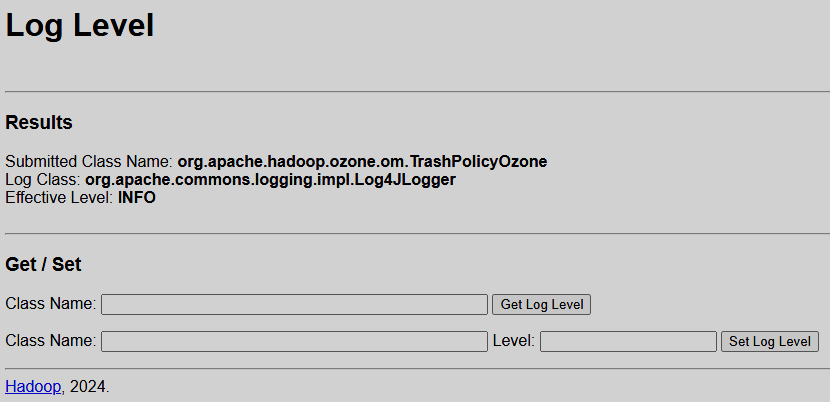
To set a logging level for a class, paste its name in the second Class Name field, then specify the logging level value in the Level field, and click Set Log Level.
Ozone Manager UI
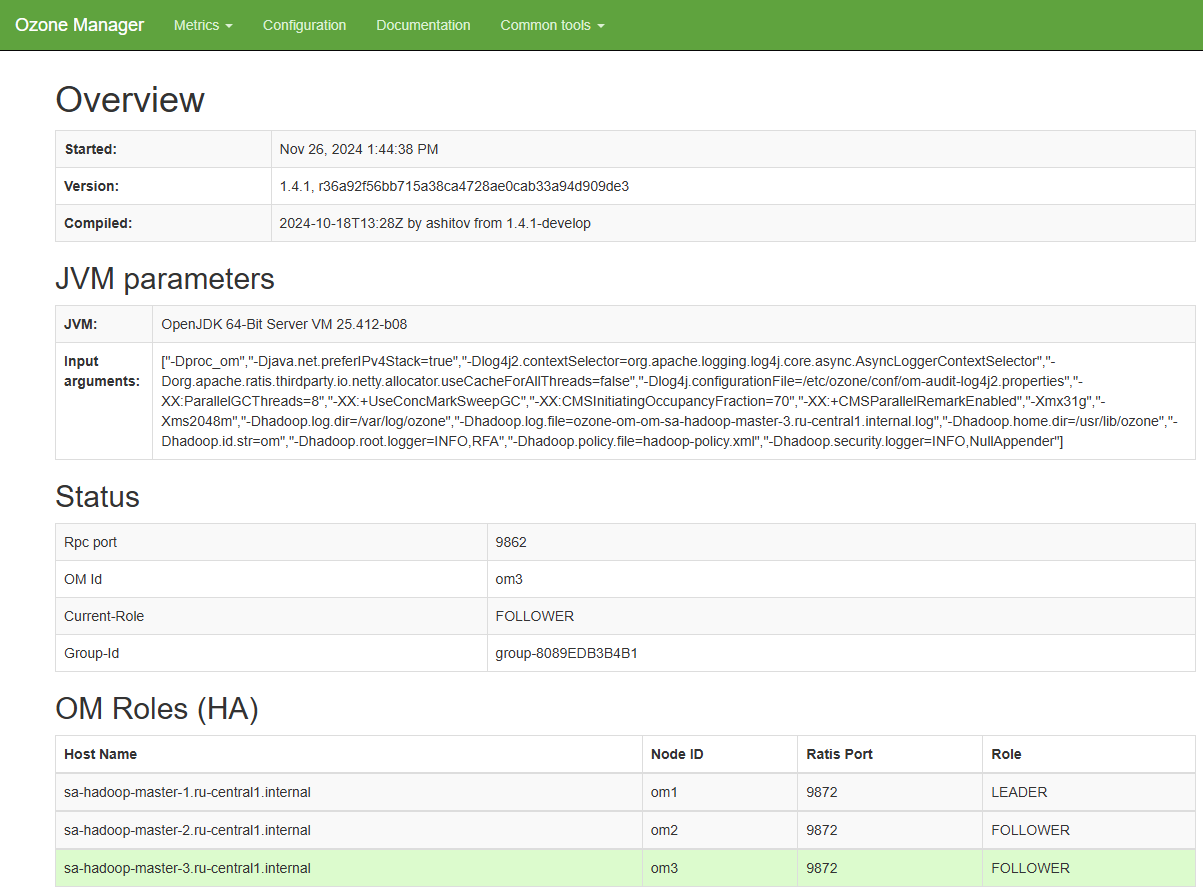
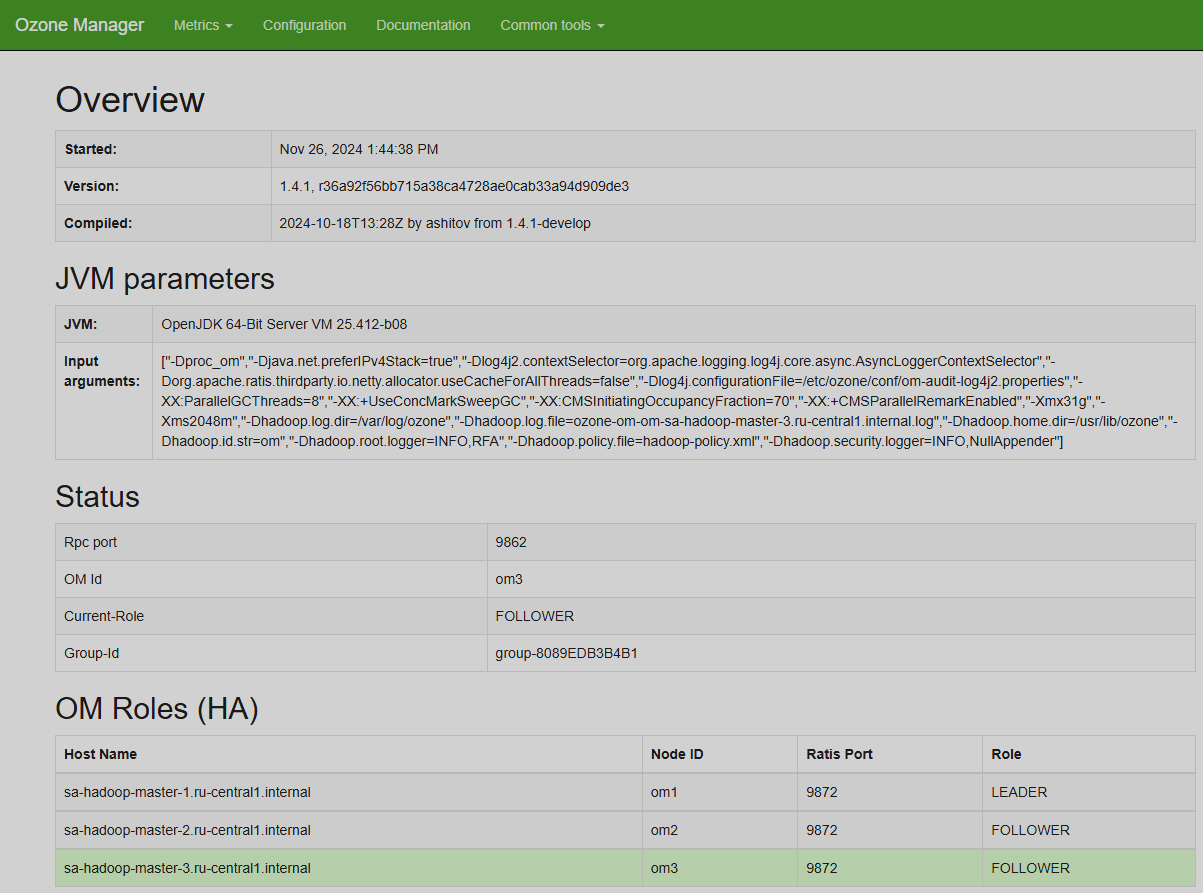
Overview
Start page of the Ozone Manager UI is the Overview page. It contains the following information:
-
Service details:
-
time started;
-
version and checksum;
-
time compiled, user, and source branch.
-
-
Java virtual machine details: version and input arguments string.
-
Status of the current Ozone Manager node:
-
number of the RPC port;
-
ID of the current Ozone Manager node;
-
role of the current Ozone Manager node (leader or follower);
-
ID of the group.
-
-
Ozone Manager node roles in the high availability mode. Current node is highlighted green.
-
Metadata volume information: home directories for Ratis and RocksDB.
Metrics
The Metrics group contains the Rpc metrics and the OM metrics pages.
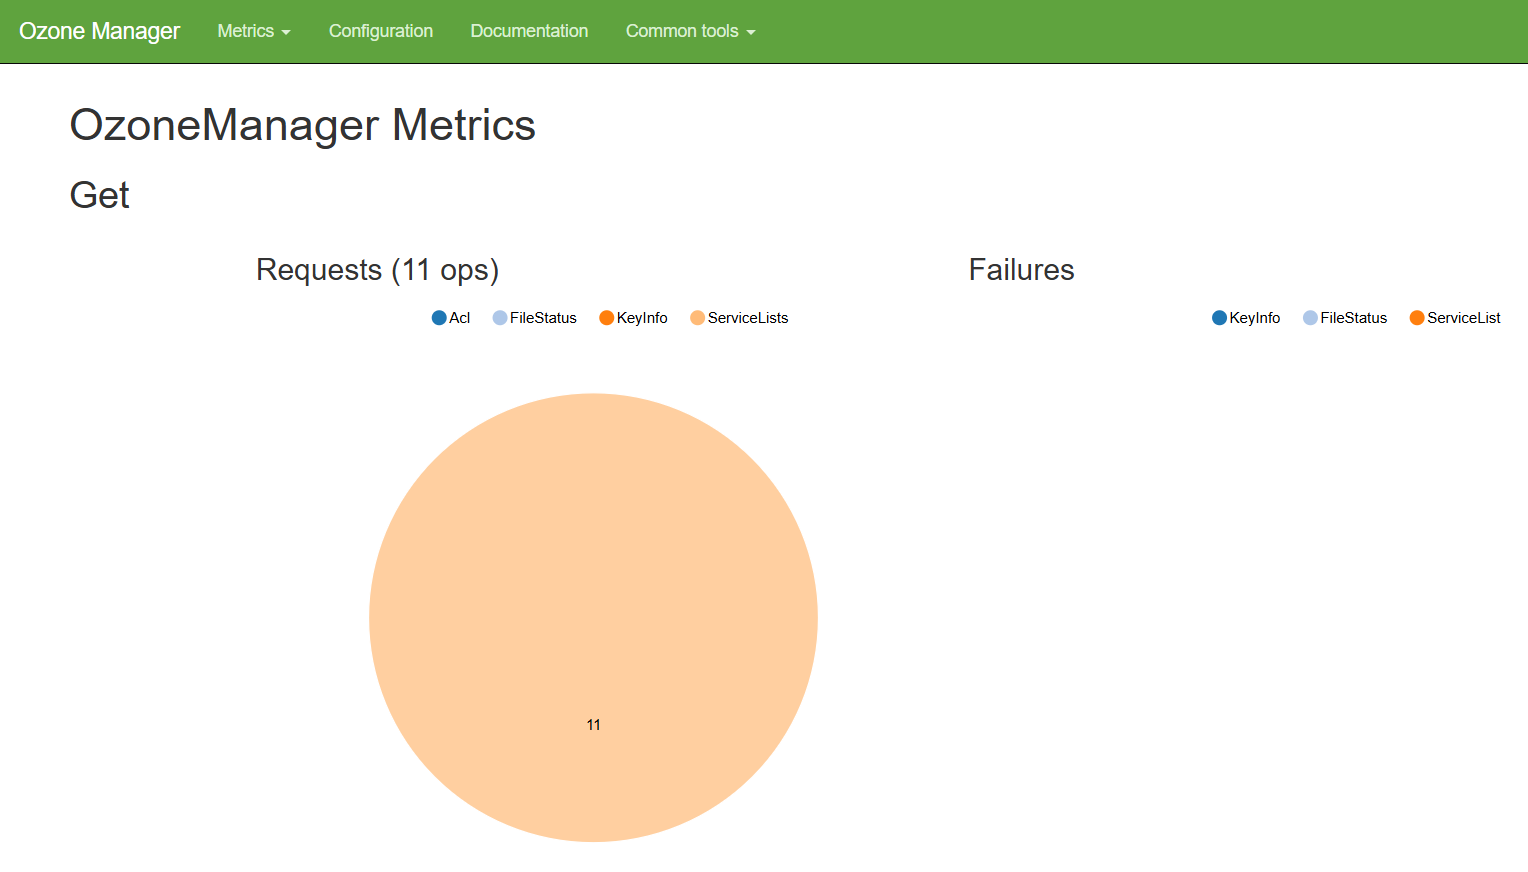
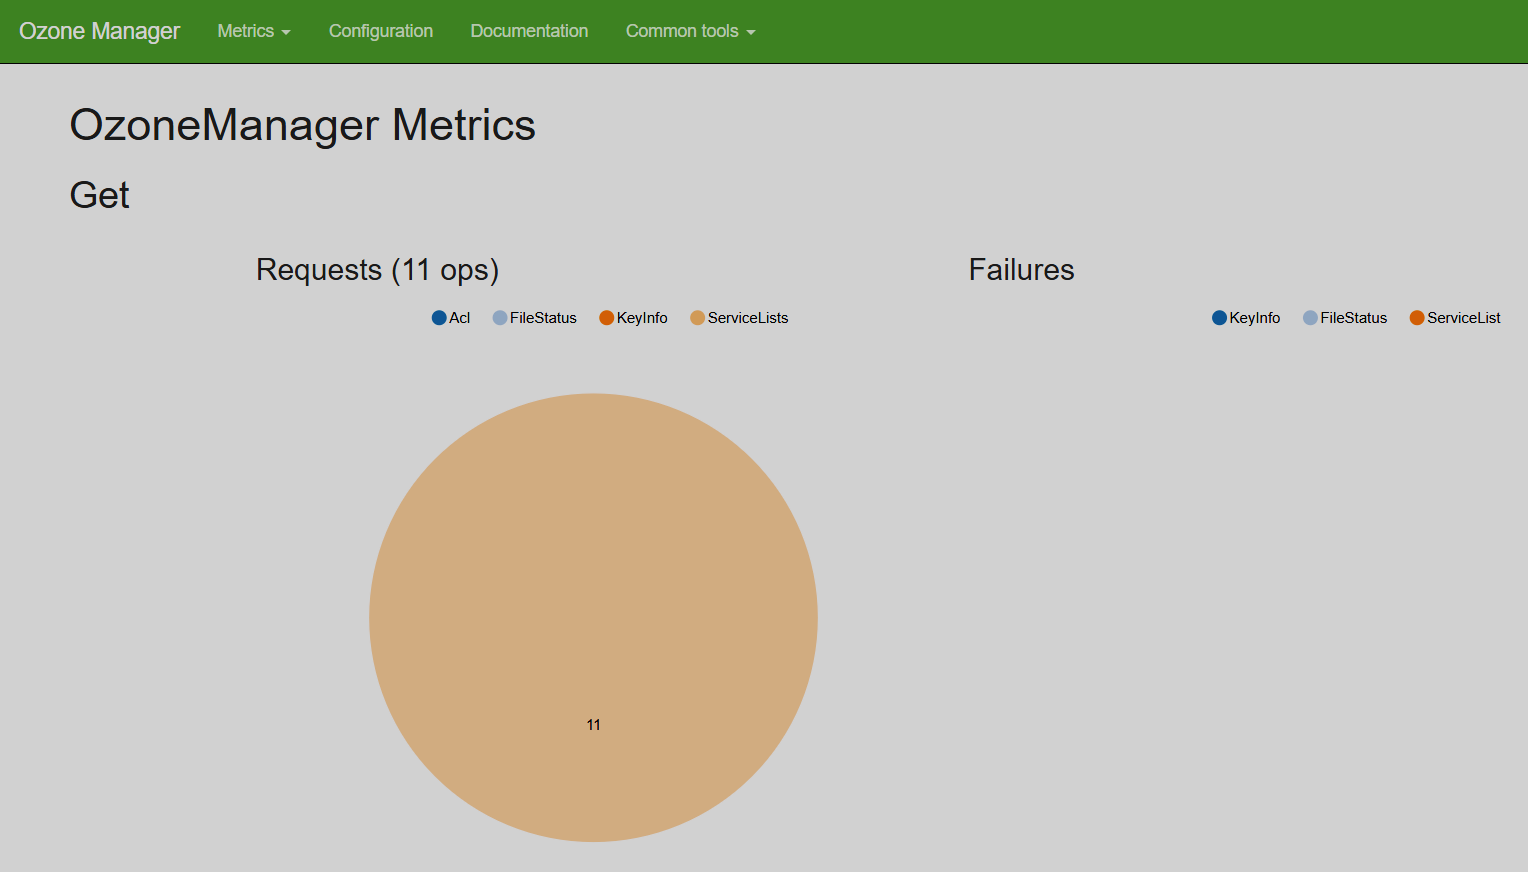
OM metrics
This page contains pie charts of requests and failures statistics for various JMX properties, as well as a table of some other properties at the bottom of the page.
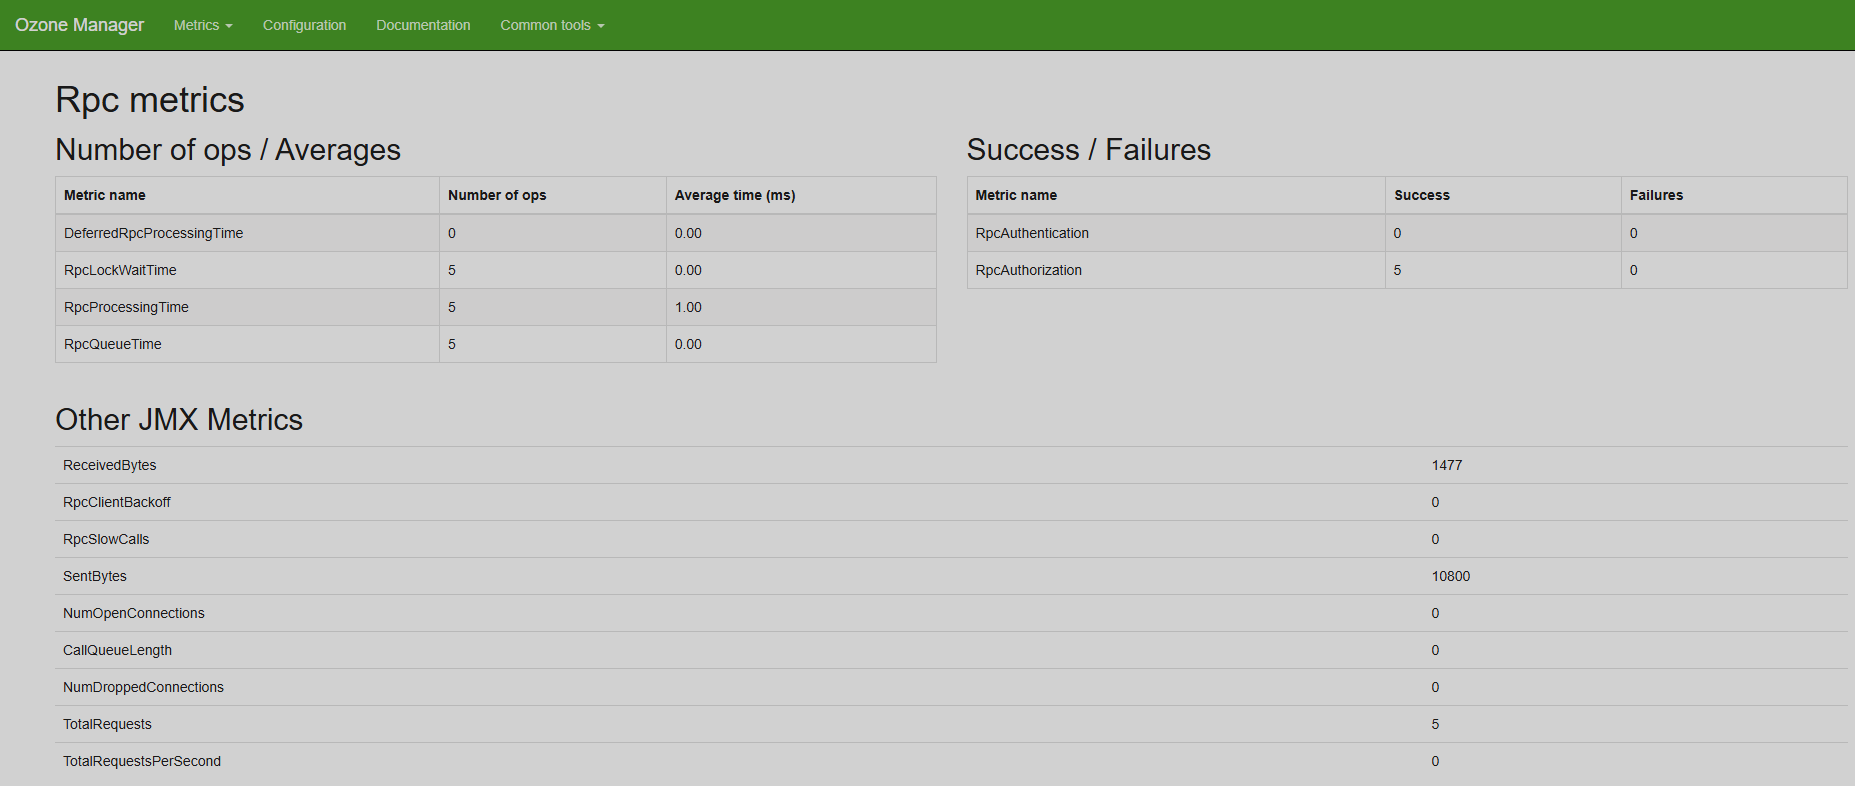
Rpc metrics
This page contains the following information:
-
Number of executed operations and their average times.
-
Success and failure statistics on RPC authentication and authorization metrics.
-
Other JMX metrics.

Configuration
The Configuration page is identical to the Configuration page of the Ozone Datanode UI.
Documentation
The Documentation page is identical to the Documentation page of the Ozone Datanode UI.
Common tools
The Common tools group pages are identical to the corresponding pages of the Common tools group of the Ozone Datanode UI.
Ozone Recon UI
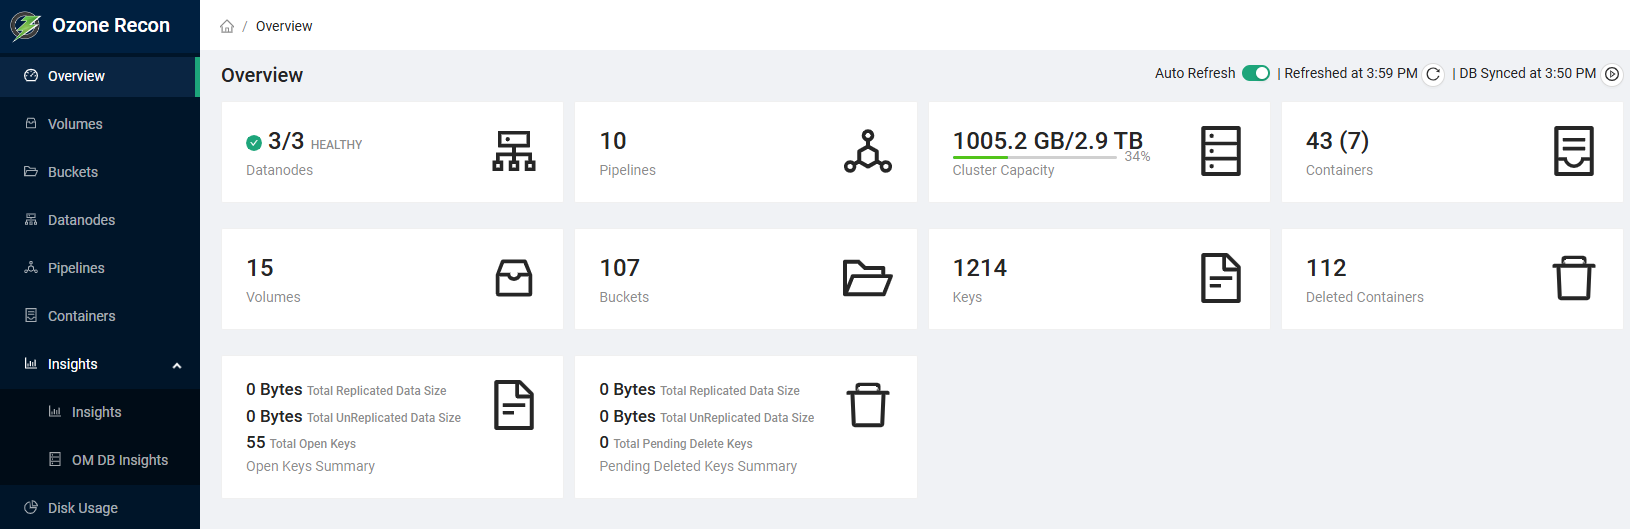
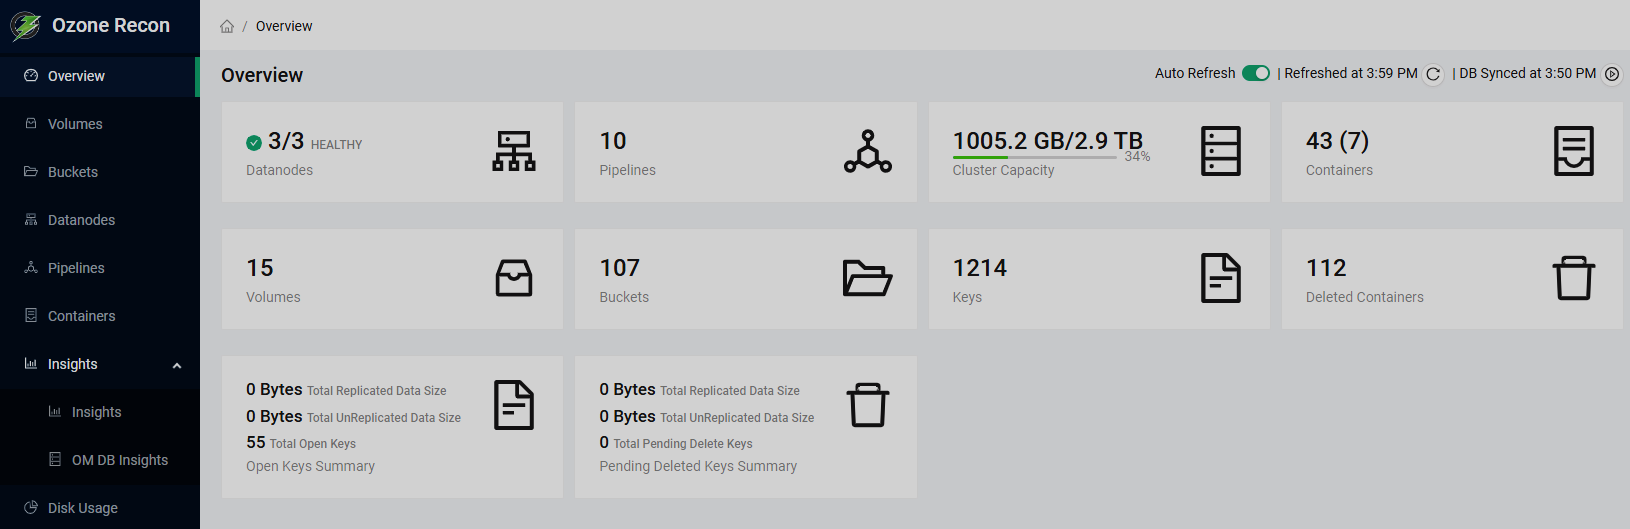
Overview
Start page of the Ozone Recon UI is the Overview page. It contains ten graphical blocks with some quick statistics. Some of the blocks are clickable and lead to the corresponding pages of the UI. The Cluster Capacity block has a pop-up legend appearing on mouse hover. The Container block also has a pop-up tip.
This page auto-refreshes by default. You can turn the auto-refresh off by clicking on its switch in the top right area of the page. Also, in the same area, you can refresh the page manually or invoke the databases synchronization by clicking the respective buttons.
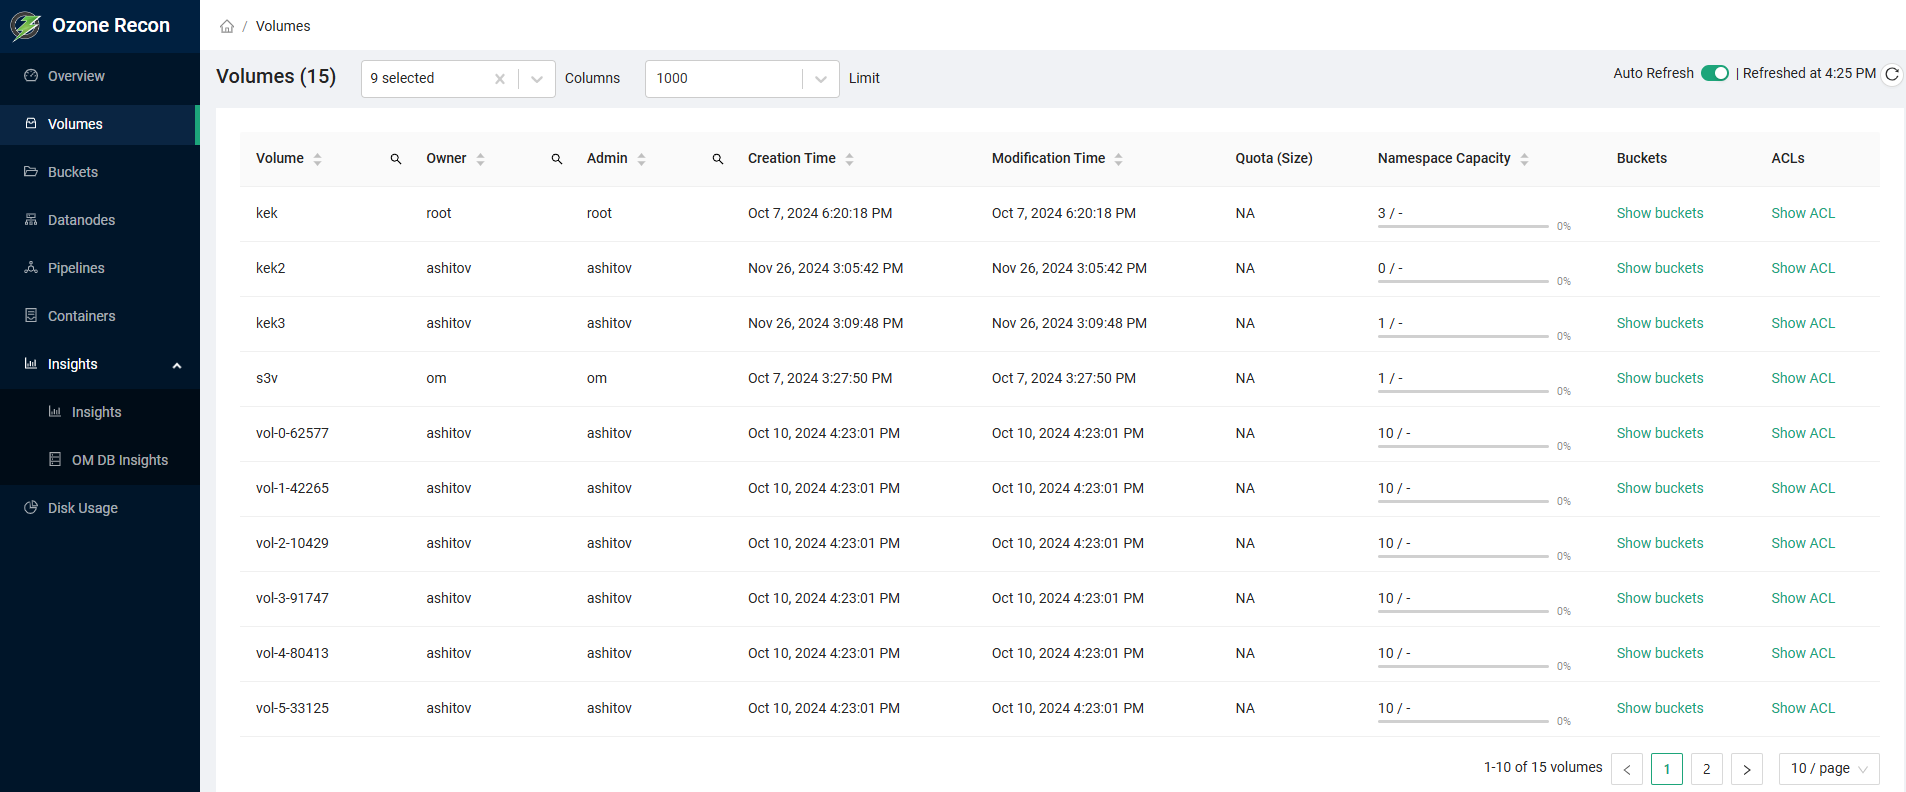
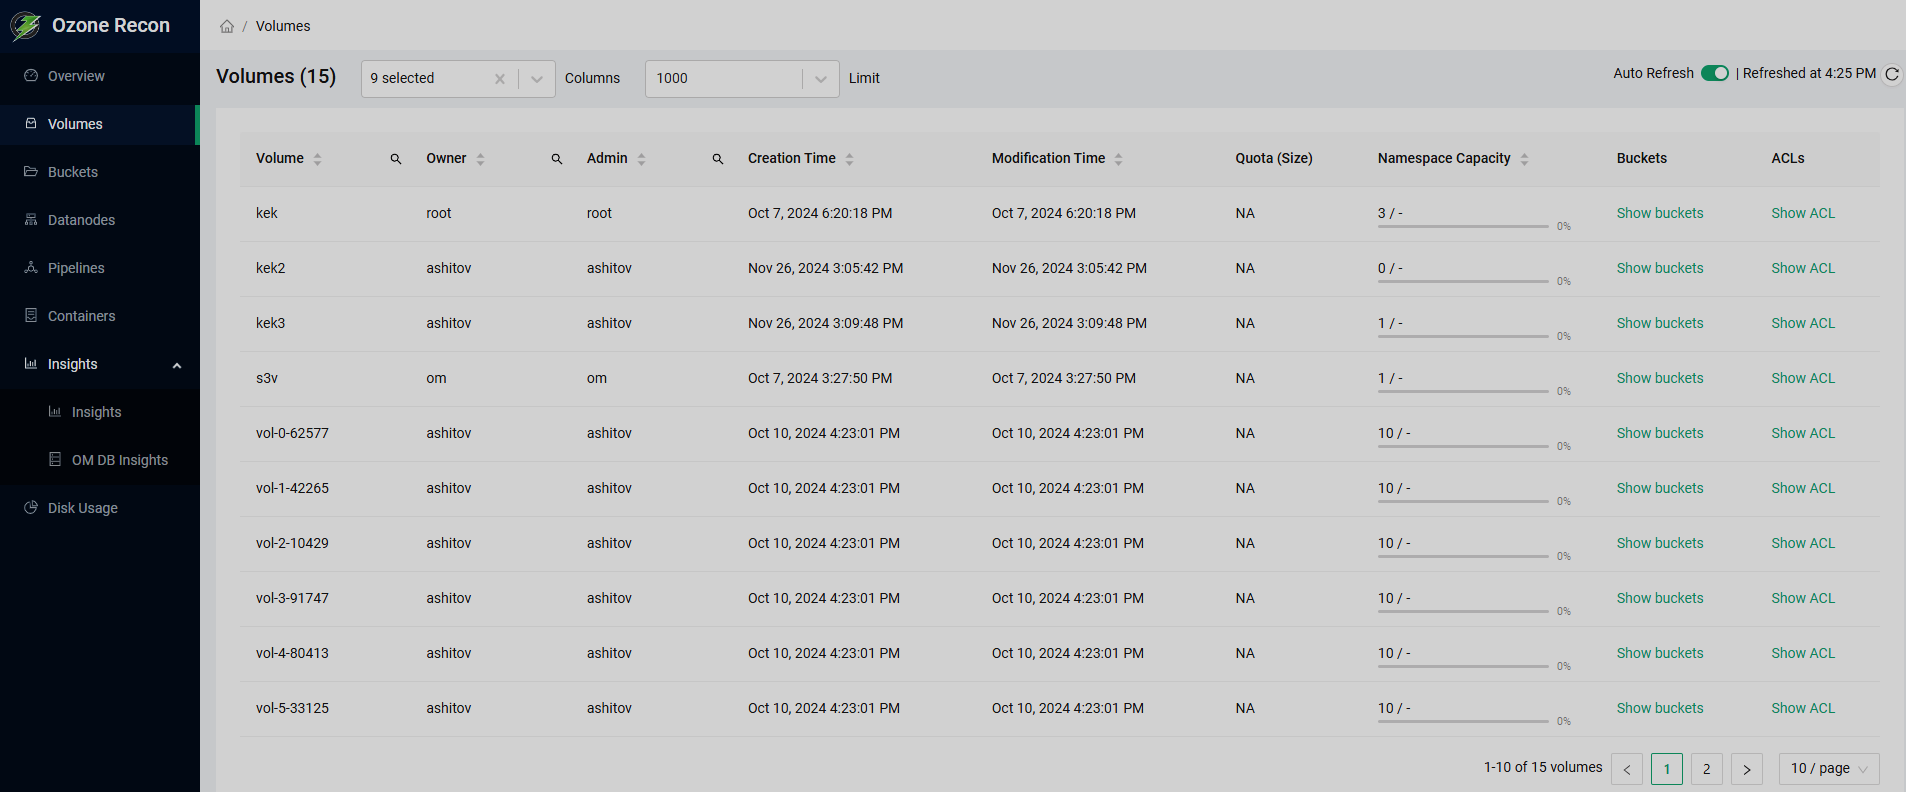
Volumes
The Volumes page contains details of the volumes existing in the Ozone storage. The information is presented as a table that has the following columns:
-
Volume — name of the volume.
-
Owner — username of the volume owner.
-
Admin — username of the volume administrator.
-
Creation Time — time when the volume was created.
-
Modification Time — time when the volume was last modified.
-
Quota — quota value for the volume or buckets, if specified.
-
Namespace Capacity — statistics of namespace usage by the volume: used, remaining, and the percentage of used among total.
-
Buckets — link to the Buckets page with the filter of this volume applied to the list.
-
ACLs — button that allows viewing the access control list for the volume.
The table is sortable by all columns except Quota, Buckets, and ACLs. You can arbitrarily select the columns to be displayed in the Columns drop-down list in the top area of the page. You can also specify the limit of rows in the Limit drop-down list in the same area. Moreover, you can toggle auto-refresh and refresh the page manually the same way as in the Overview page. In the bottom of the page, you can find the pagination controls.
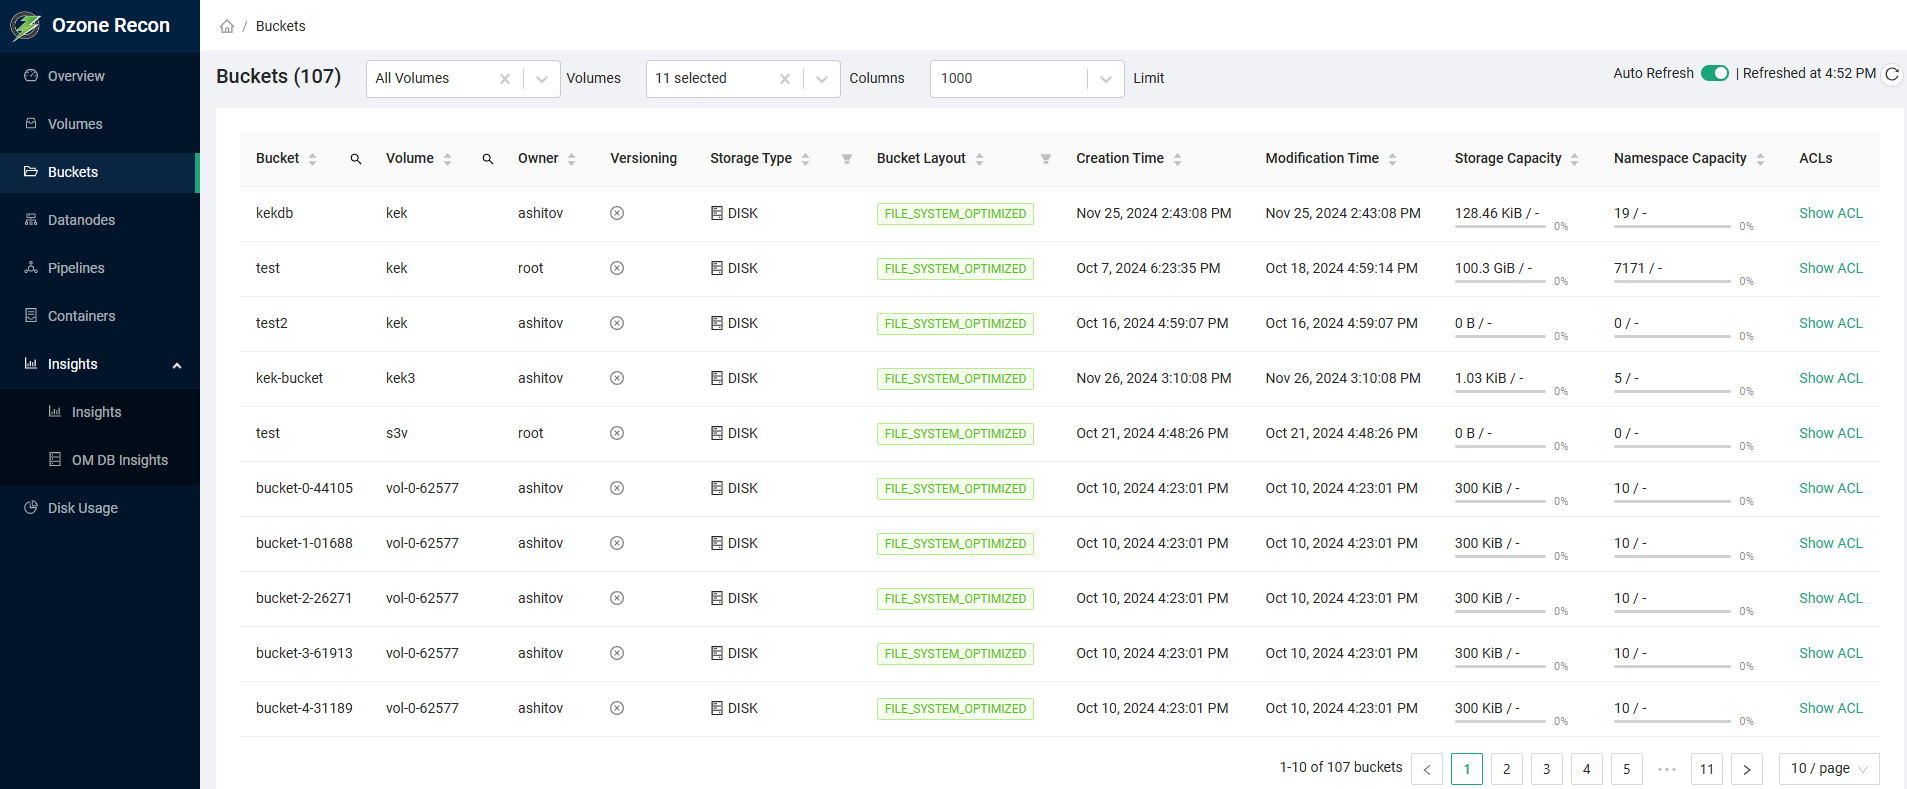
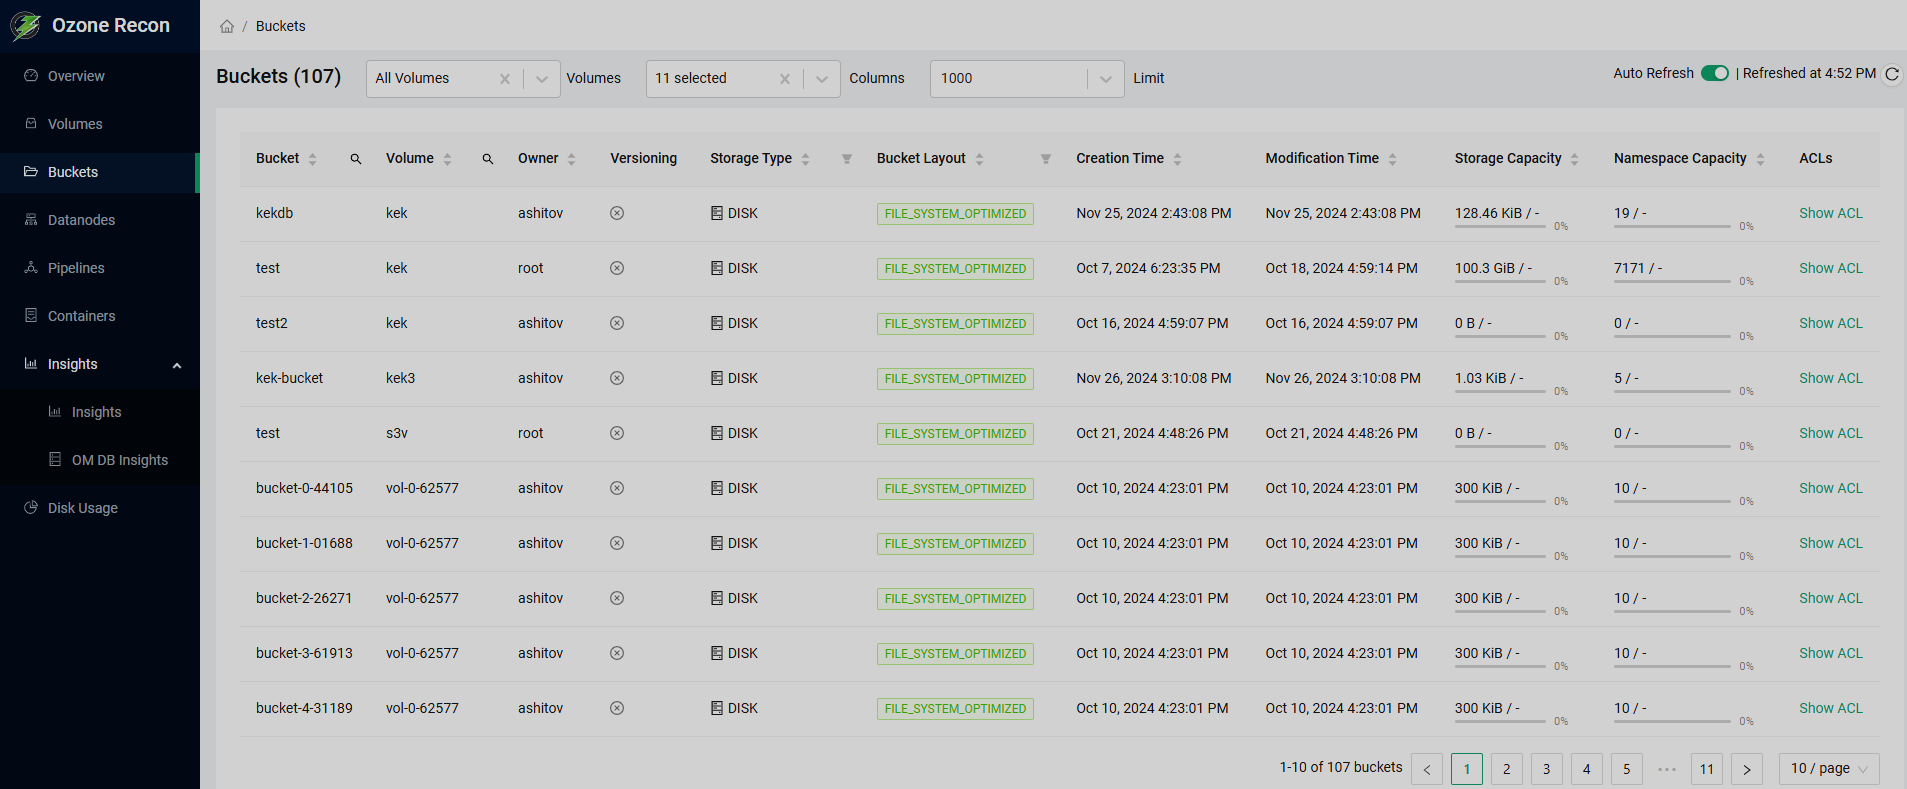
Buckets
The Buckets page contains details of the buckets stored in the volumes. The information is presented as a table that has the following columns:
-
Bucket — name of the bucket.
-
Volume — name of the volume that the bucket belongs to.
-
Owner — username of the bucket owner.
-
Versioning — whether versioning is used for the bucket.
-
Storage Type — type of storage where the bucket is located. Possible values:
SSD,DISK,ARCHIVE, orRAM_DISK. -
Bucket Layout — type of the bucket layout. Possible values:
FILE_SYSTEM_OPTIMIZED,OBJECT_STORE, orLEGACY. -
Creation Time — time when the bucket was created.
-
Modification Time — time when the bucket was last modified.
-
Storage Capacity — storage size occupied by the bucket, remaining storage size, and the percentage of used among total.
-
Namespace Capacity — statistics of namespace usage by the bucket: used, remaining, and the percentage of used among total.
-
Source Volume — volume that the bucket originates from.
-
Source Bucket — bucket that the bucket originates from.
-
ACLs — button that allows viewing the access control list for the bucket.
The table is sortable by all columns except Versioning, Source Volume, Source Bucket, and ACLs. You can arbitrarily select the columns to be displayed in the Columns drop-down list in the top area of the page, and filter the table by volumes using the Volumes drop-down list. You can also specify the limit of rows in the Limit drop-down list in the same area. Moreover, you can toggle auto-refresh and refresh the page manually the same way as in the Overview page. In the bottom of the page, you can find the pagination controls.
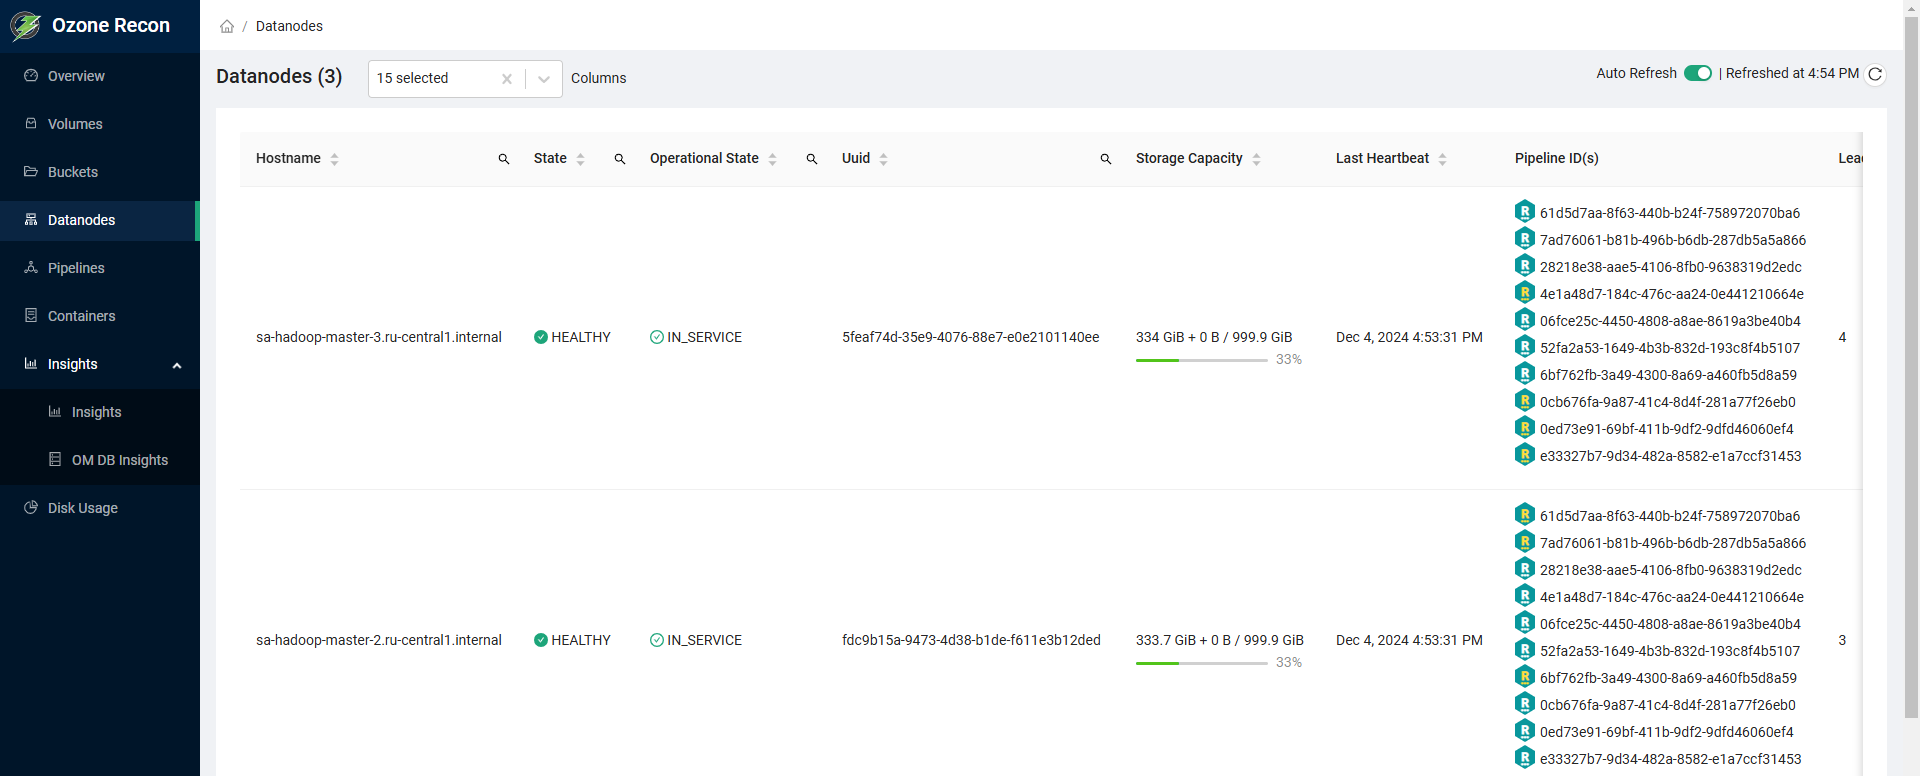
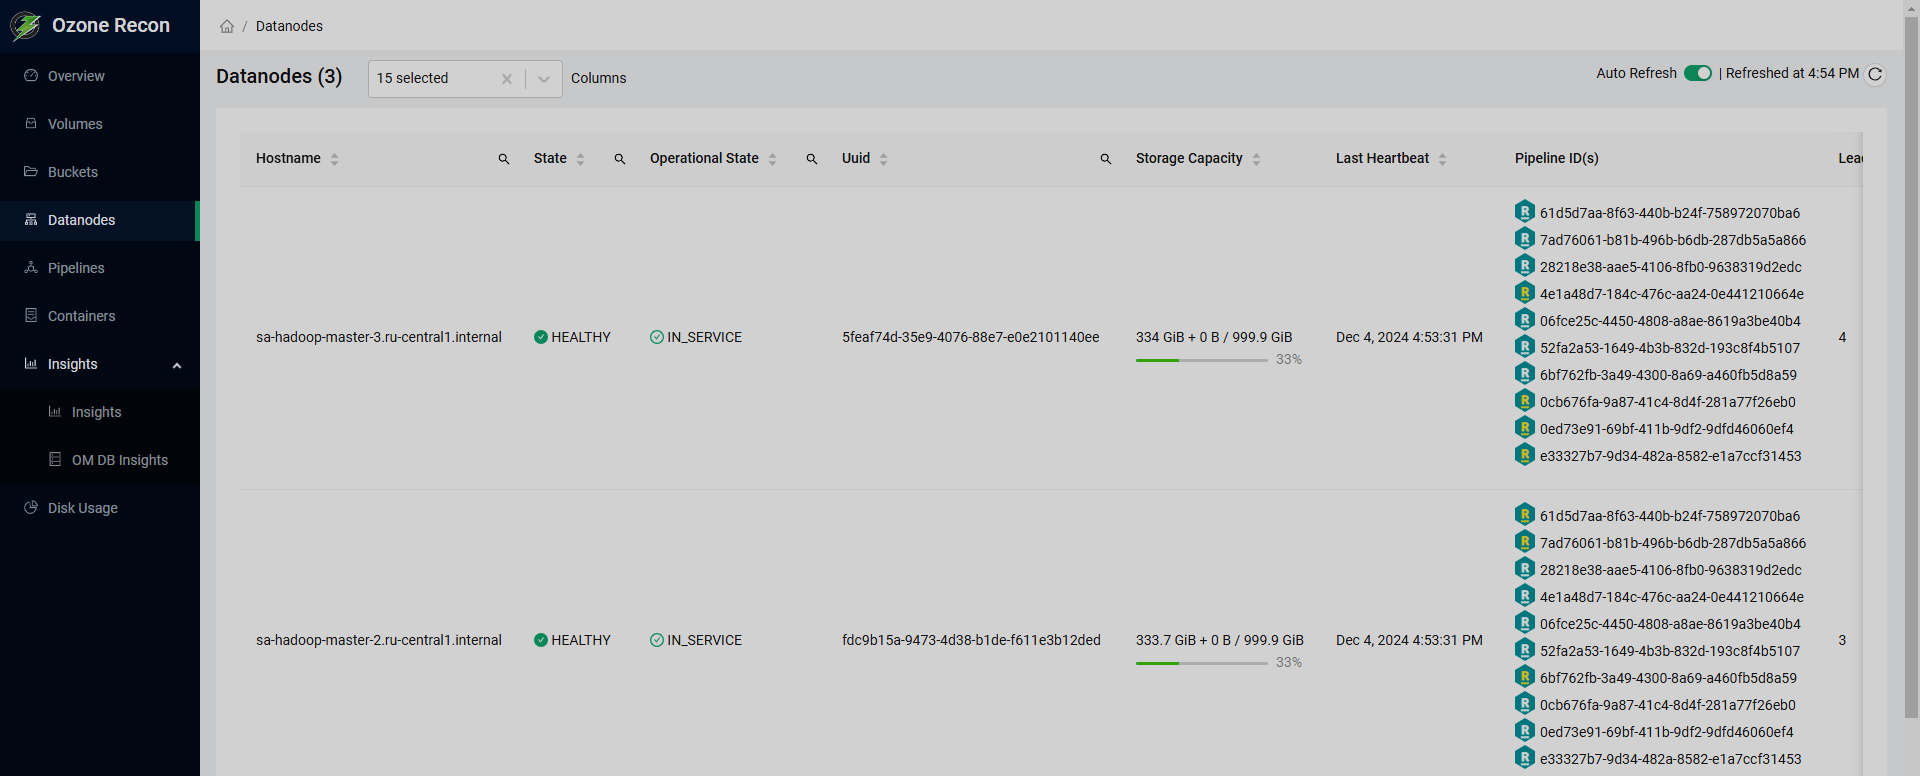
Datanodes
The Datanodes page contains details of the datanodes in the Ozone cluster. The information is presented as a table that has the following columns:
-
Hostname — FQDN of the datanode.
-
State — health state of the datanode. Possible values:
HEALTHY,HEALTHY_READONLY,STALE, orDEAD. -
Operational State — operational state of the datanode. Possible values:
IN_SERVICE,DECOMMISSIONING, orDECOMMISSIONED. -
Uuid — UUID of the datanode.
-
Storage Capacity — statistics of storage usage on the datanode: used space, remaining space, and the percentage of used among total.
-
Last Heartbeat — time of the last hearthbeat obtained from the datanode.
-
Pipeline ID(s) — list of IDs of the pipelines in which the datanode participates.
-
Leader Count — number of pipelines in which the datanode is elected as a leader.
-
Containers — number of containers on the datanode.
-
Open Containers — number of open containers per pipeline.
-
Version — Ozone version number installed on the datanode.
-
Setup Time — time when the datanode was started.
-
Revision — checksum of the Ozone distribution installed on the datanode.
-
Build Date — time when the Ozone distribution installed on the datanode was built.
-
Network Location — network location of the datanode.
The table is sortable by all columns except Pipeline ID(s). You can arbitrarily select the columns to be displayed in the Columns drop-down list in the top area of the page. Moreover, you can toggle auto-refresh and refresh the page manually the same way as in the Overview page. In the bottom of the page, you can find the pagination controls.
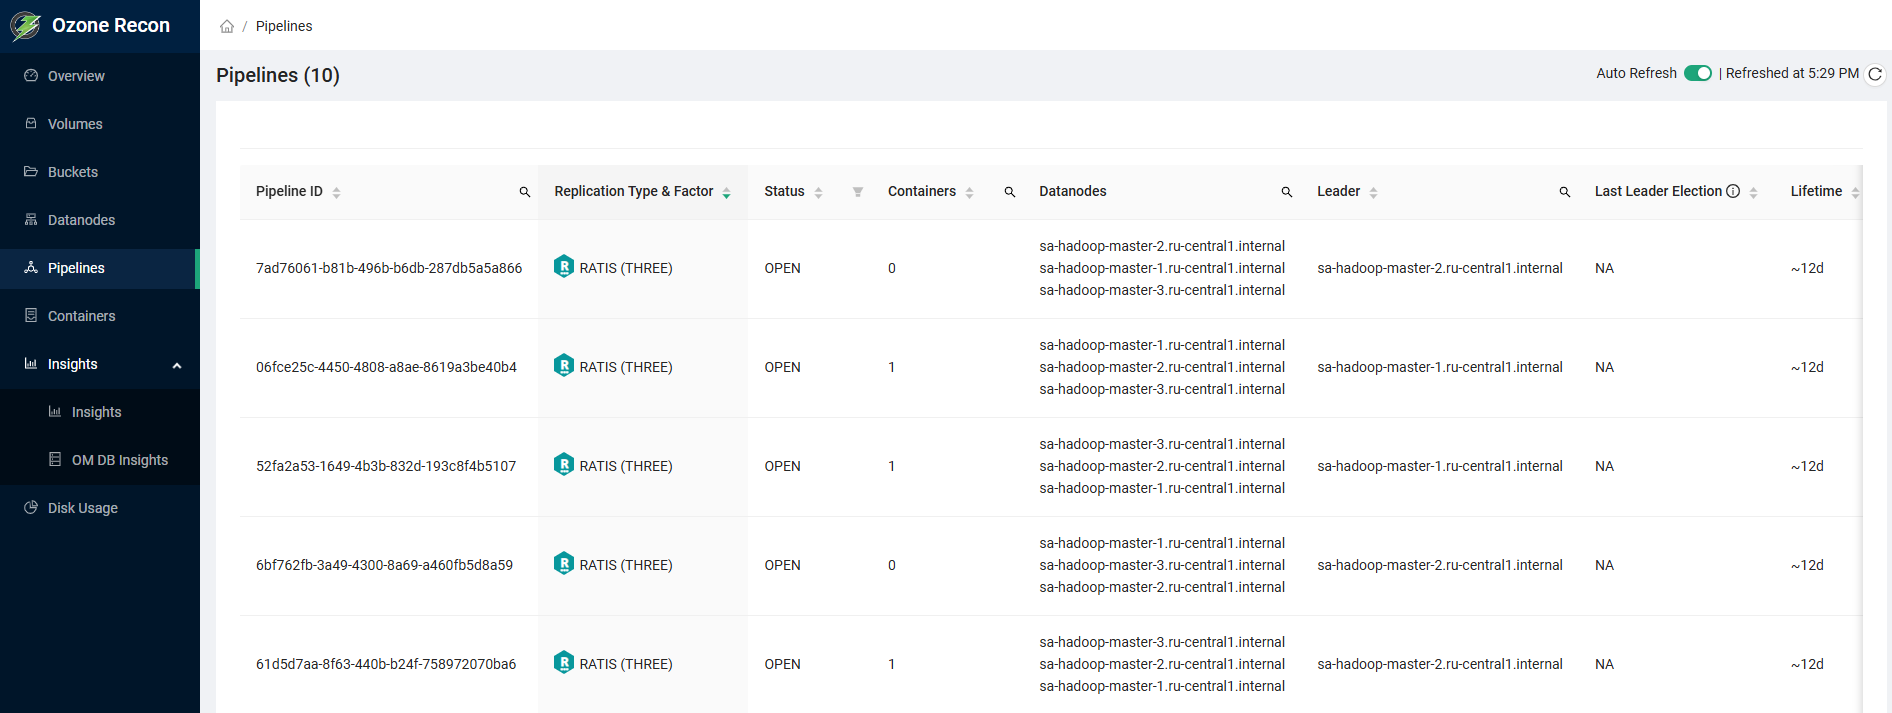
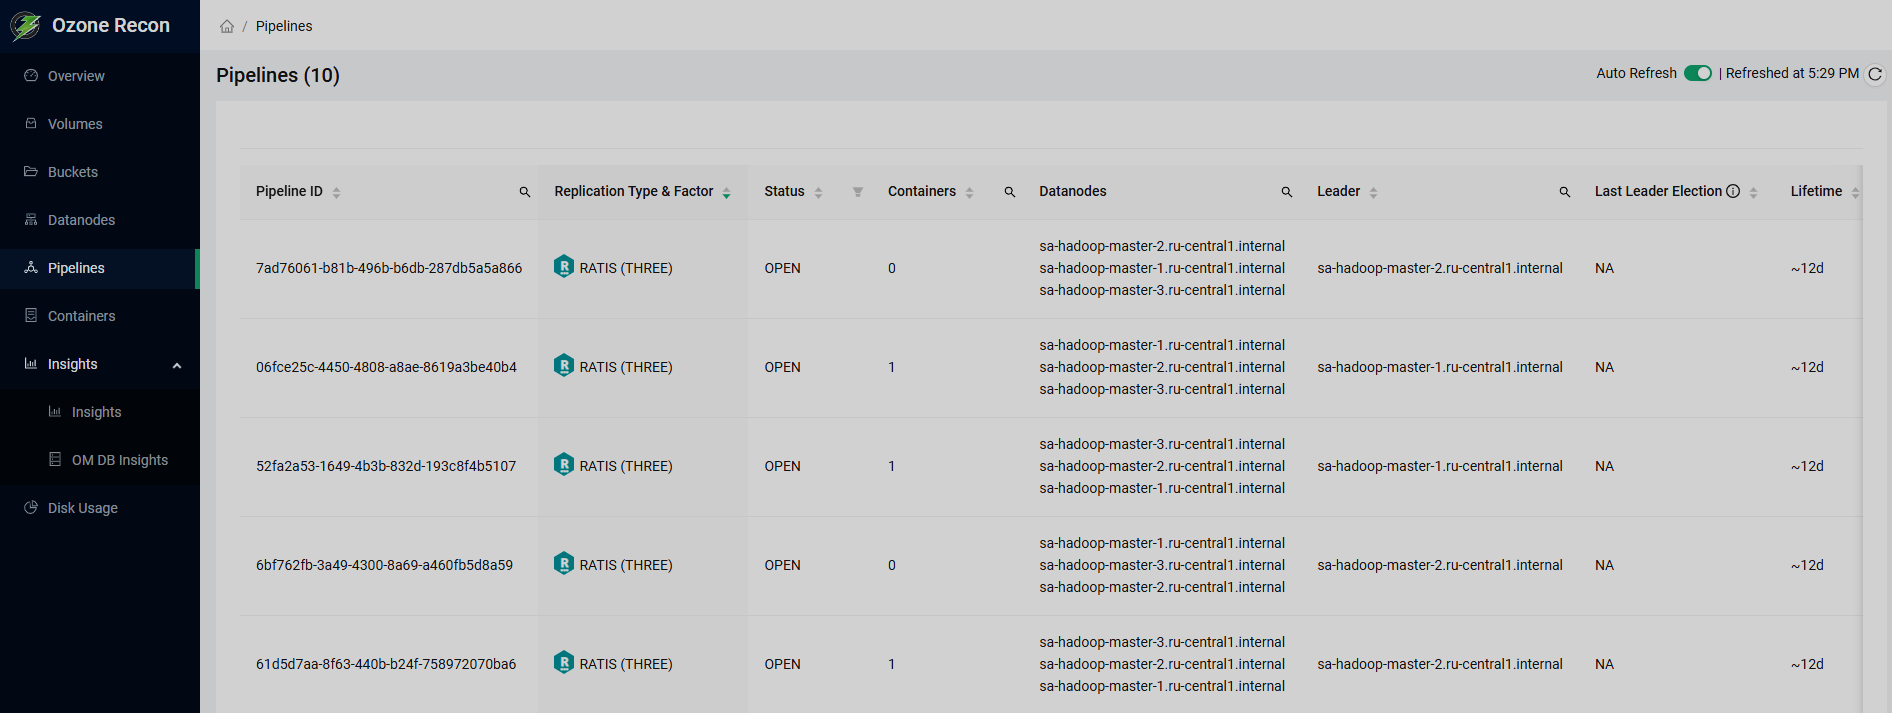
Pipelines
The Pipelines page contains details of the pipelines in the Ozone cluster. The information is presented as a table that has the following columns:
-
Pipeline ID — ID of the pipeline.
-
Replication Type & Factor — type of replication (
RATISorSTANDALONE) and the value of replication factor. -
Status — pipeline status. Possible values:
OPENorCLOSED. -
Containers — number of containers in the pipeline.
-
Datanodes — list of datanodes participating in the pipeline.
-
Leader — datanode having the Ratis
LEADERrole in the pipeline. -
Last Leader Election — last time when a datanode was assigned the Ratis
LEADERrole in the pipeline. -
Lifetime — duration of the pipeline open state.
-
No. of Elections — number of times when datanodes were assigned the Ratis
LEADERrole in the pipeline.
You can toggle auto-refresh and refresh the page manually the same way as in the Overview page. In the bottom of the page, you can find the pagination controls.
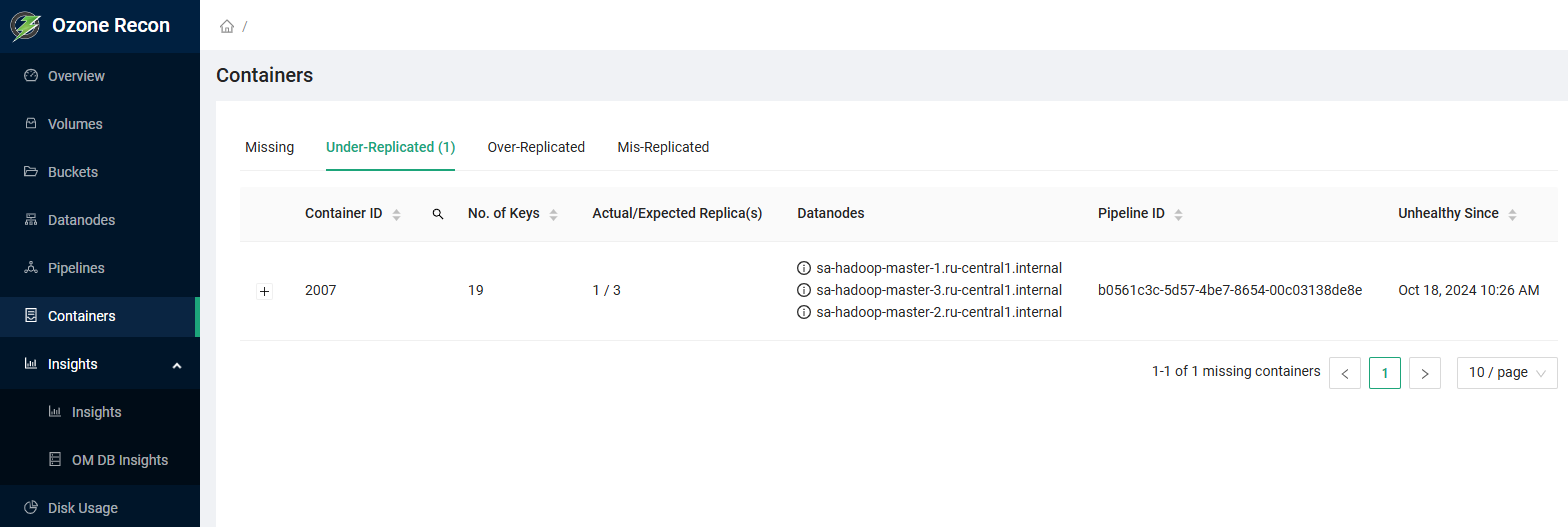
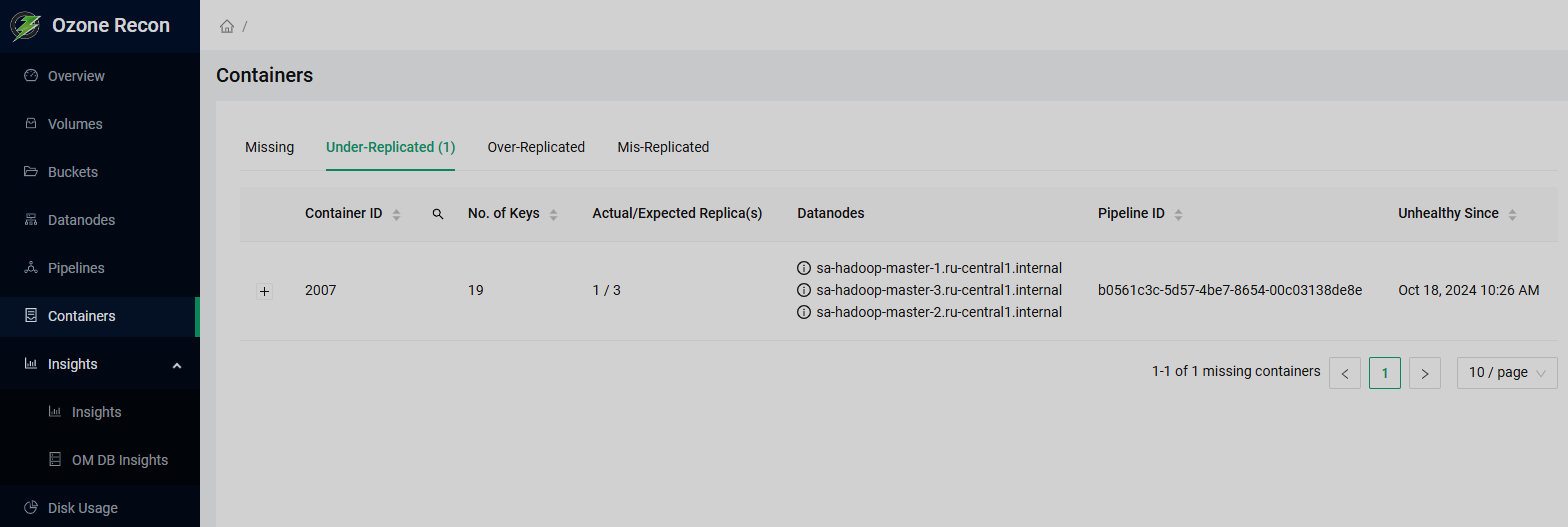
Containers
The Containers page contains details of the containers stored in the Ozone cluster. It has four tabs that contain the following information:
-
Missing — containers that are not reported by any datanode (e.g. containers that were not deleted, but all datanodes that had them are down).
-
Under-Replicated — containers that have less replicas then expected.
-
Over-Replicated — containers that have more replicas then expected.
-
Mis-Replicated — containers that have replicas not compliant with the replication policy (e.g. stored on the same datanode).
The information in each of these tabs is presented as a table that has the following columns:
-
Container ID — ID of the container.
-
No. of Keys — number of keys stored in the container.
-
Actual/Expected Replica(s) — actual and expected numbers of replicas of the container.
-
Datanodes — list of datanodes where the container replicas are expected to be stored.
-
Pipeline ID — ID of the pipeline the container belongs to.
-
Unhealthy Since — time when the container became missing, underreplicated, overreplicated, or misreplicated, depending on the tab.
In the bottom of the page, you can find the pagination controls.
Insights
The Insights group contains the Insights page and the OM DB Insights page.
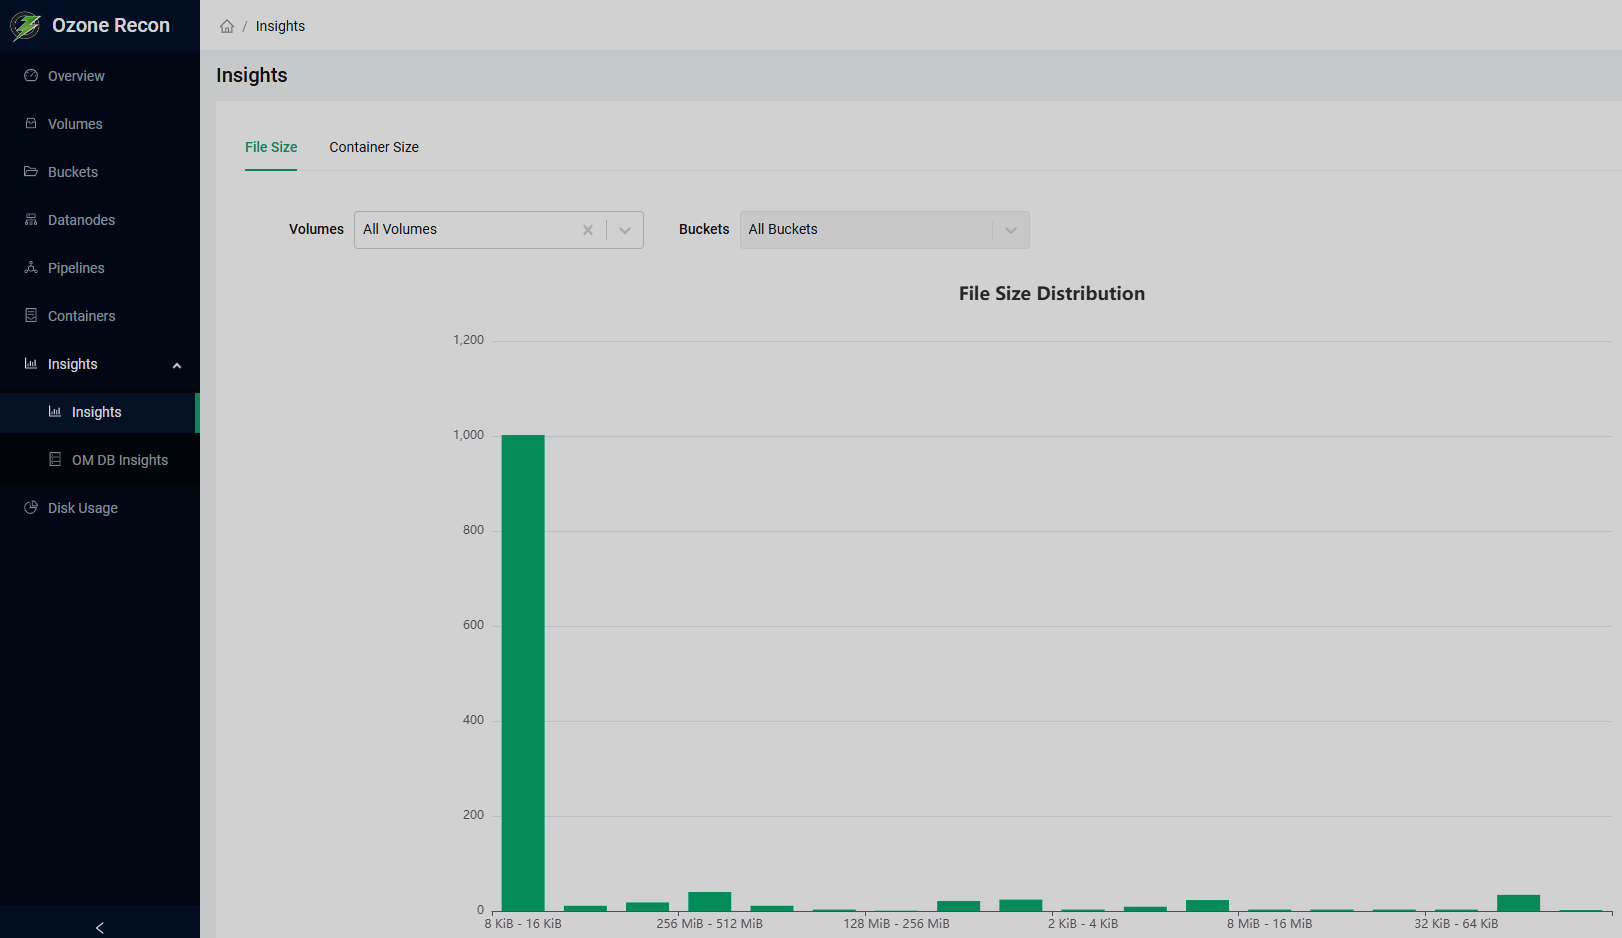
Insights
On the File Size tab of the Insights page, you can see a histogram that shows the distribution of files by their sizes. You can choose which volumes to include in the representation using the Volumes drop-down list. If you choose a single volume, you can choose its particular buckets in the Buckets drop-down list.
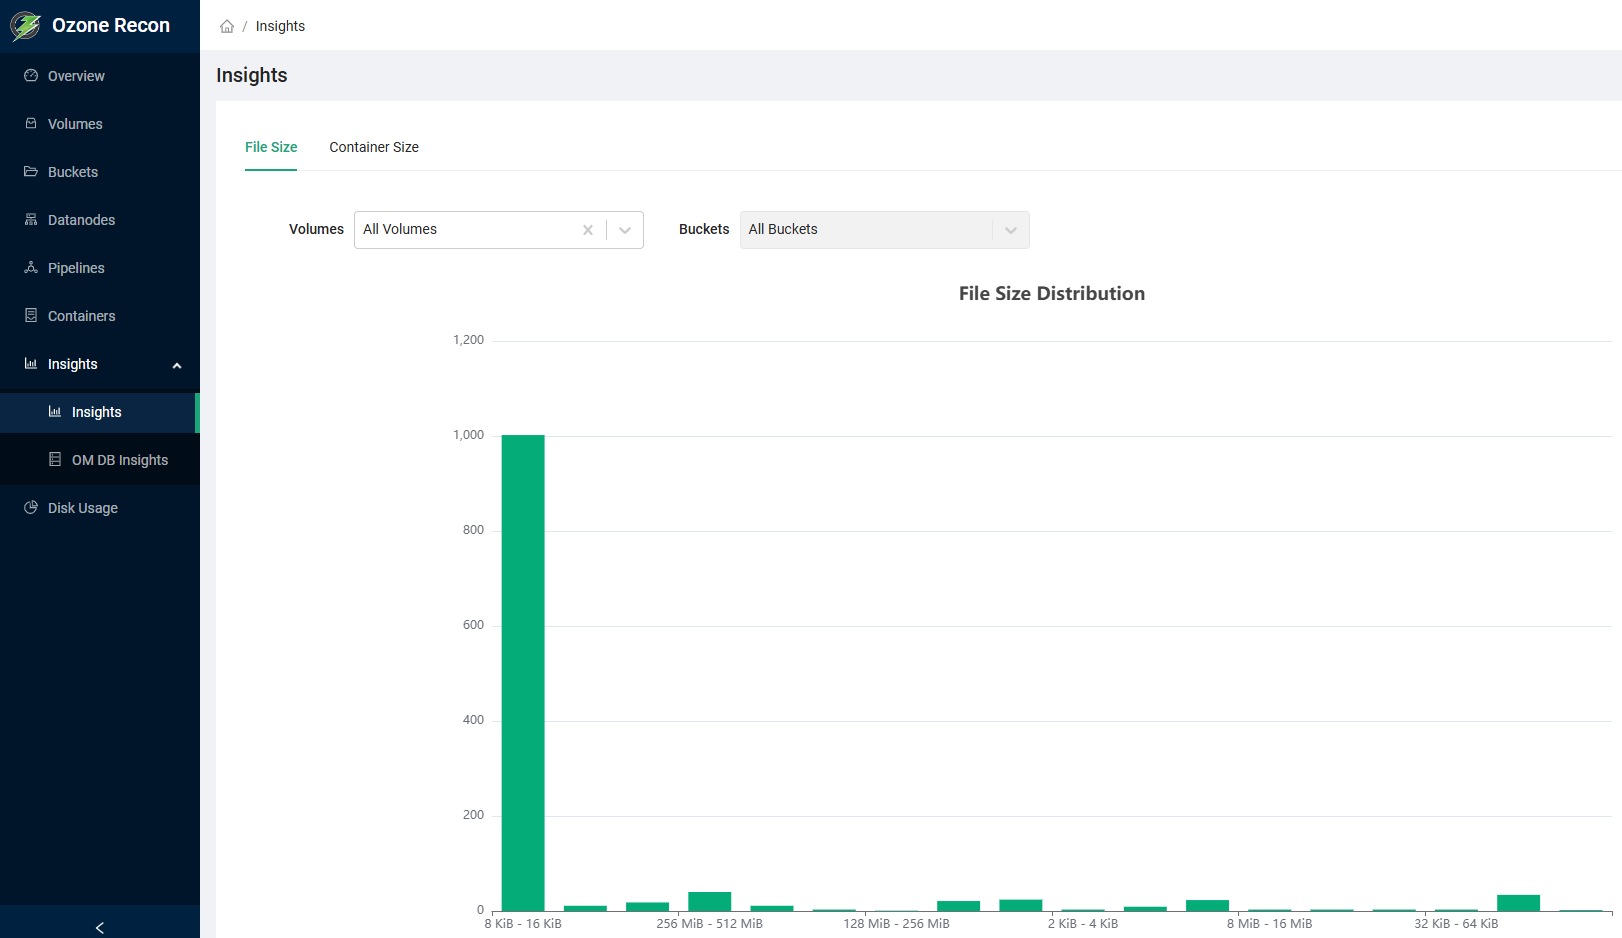
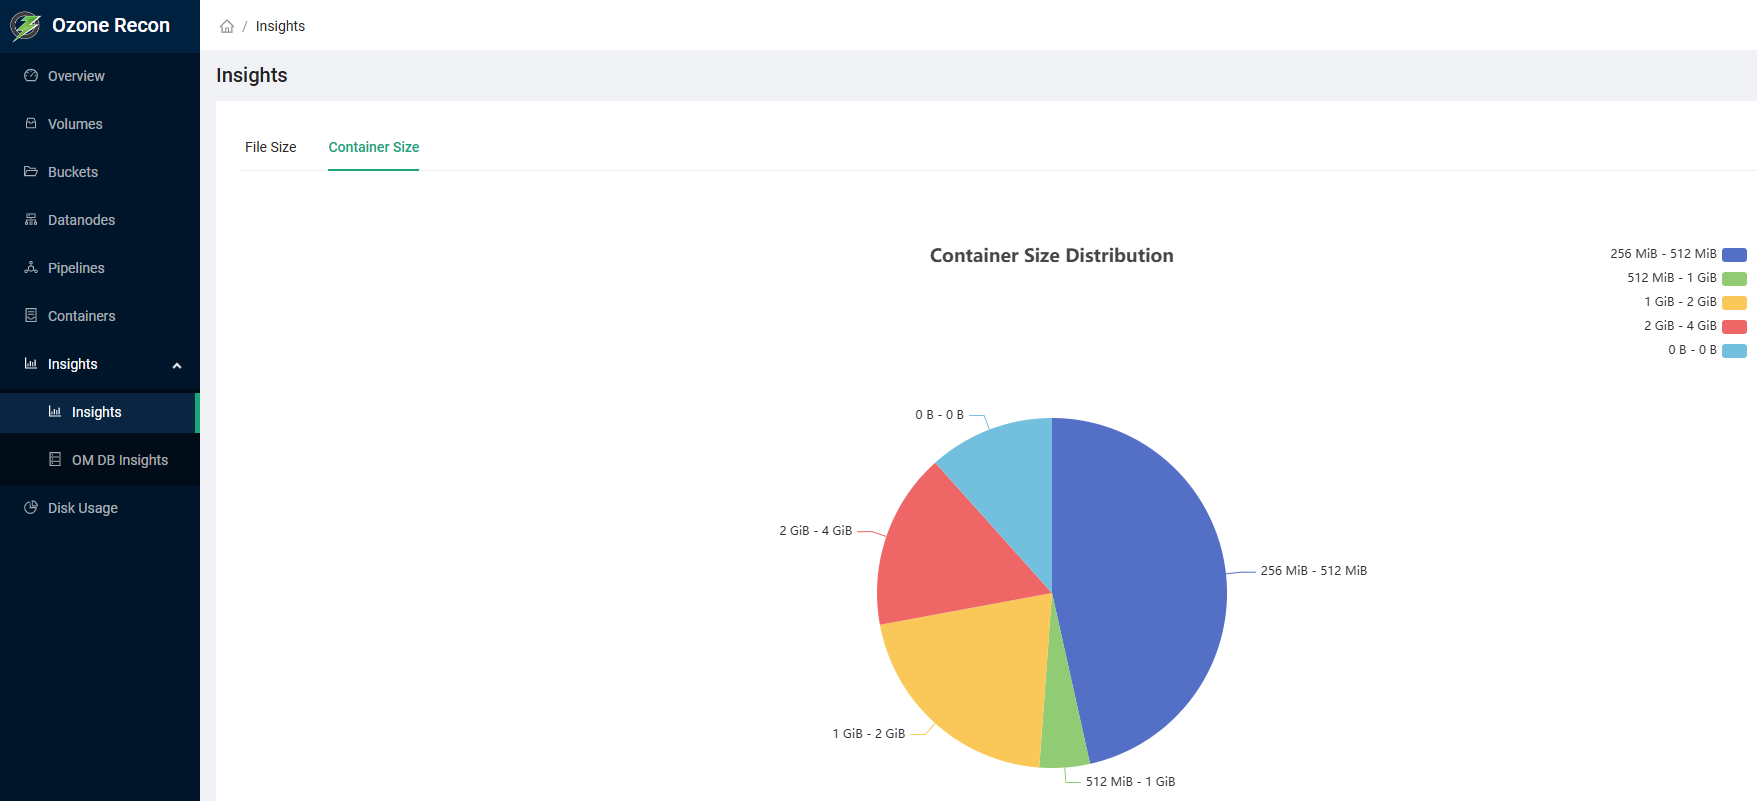
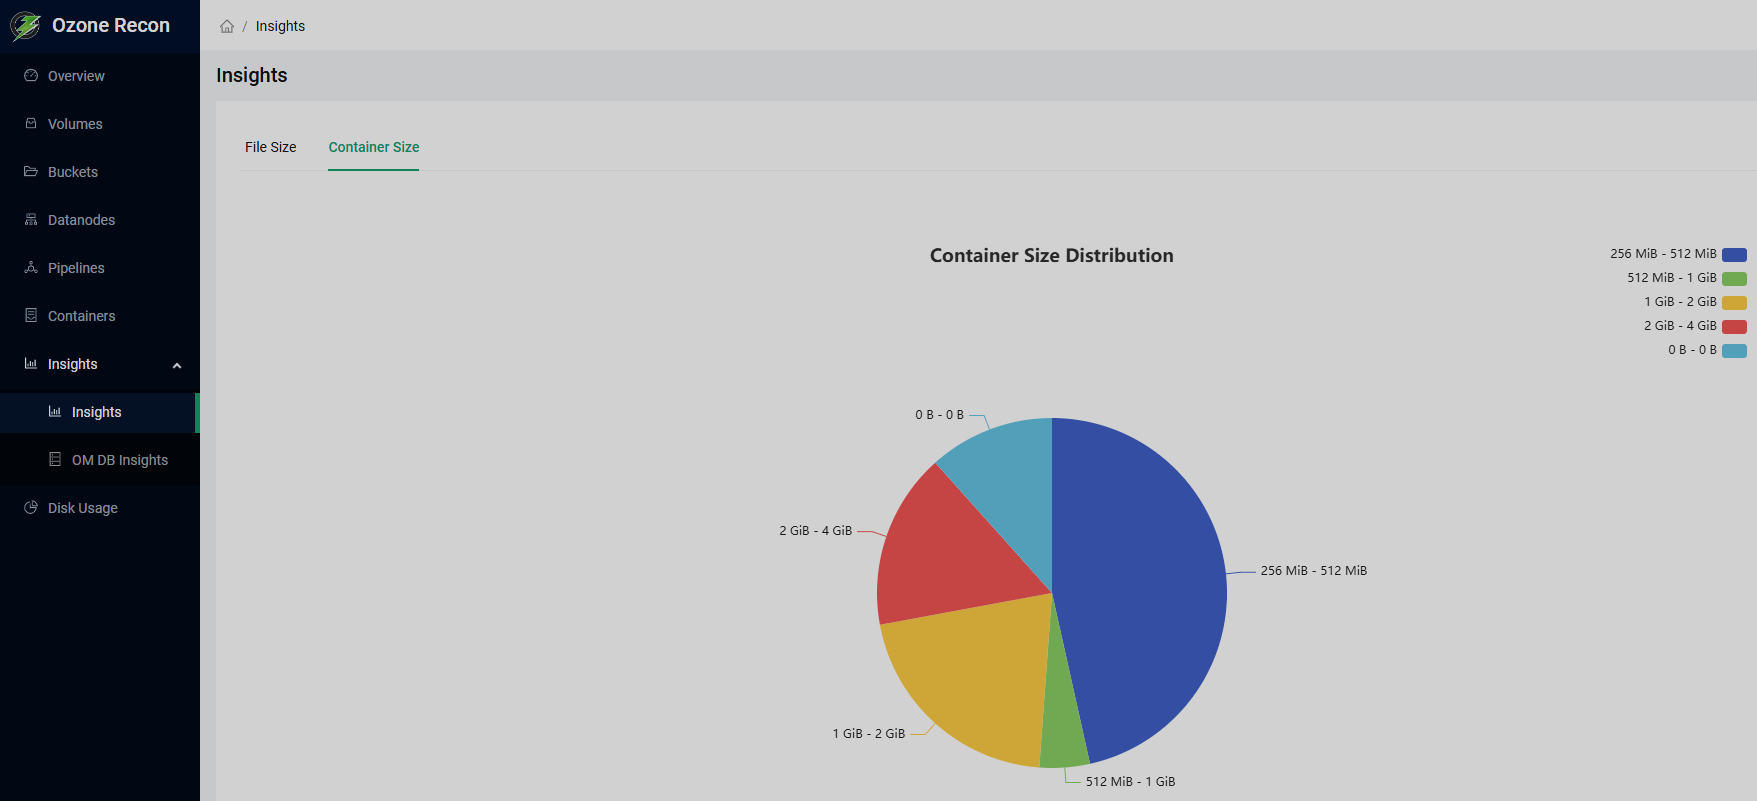
On the Container Size tab of the Insights page, you can see a pie chart that shows the distribution of containers by their sizes.
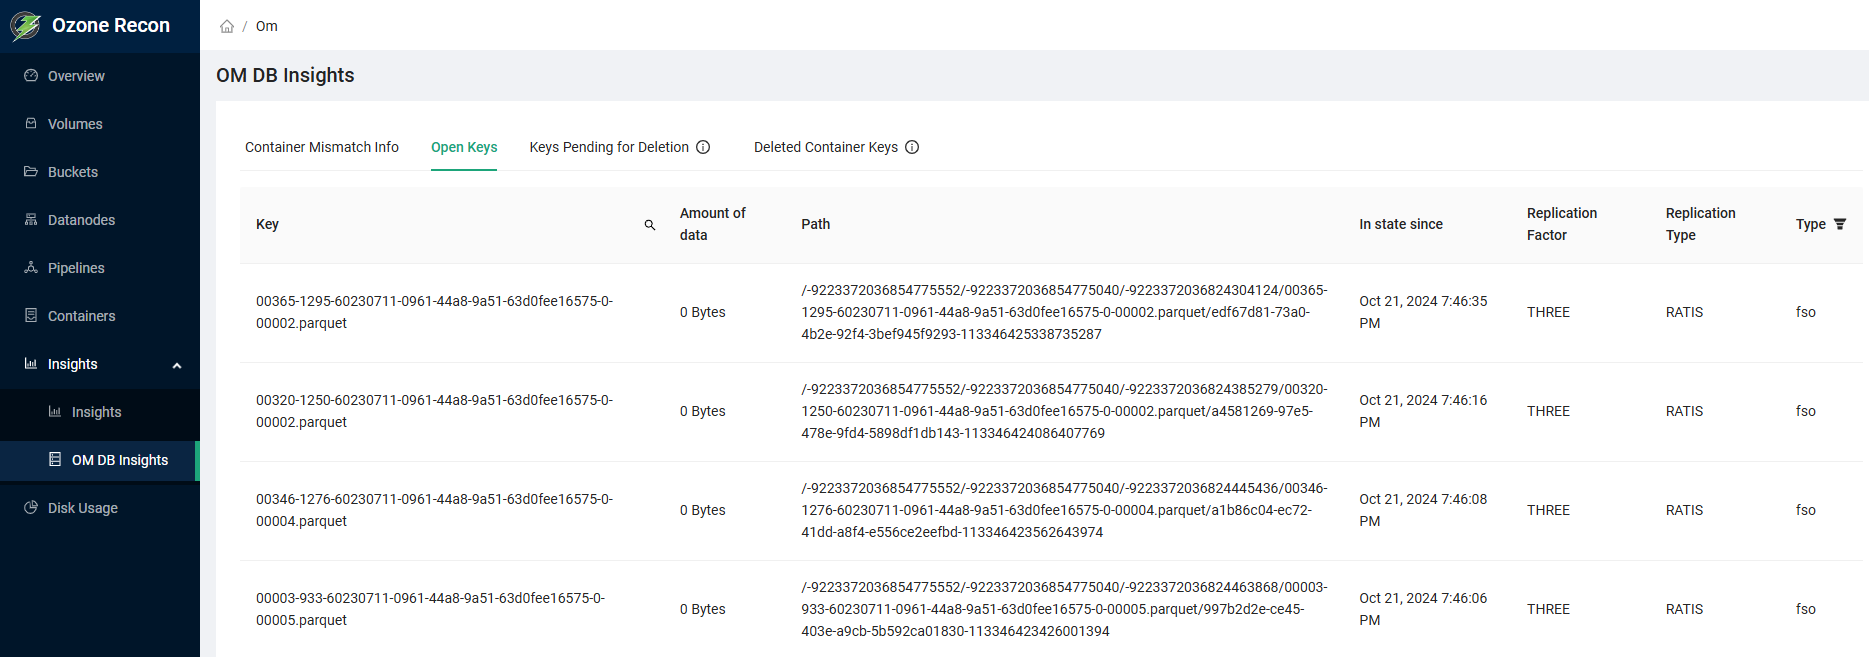
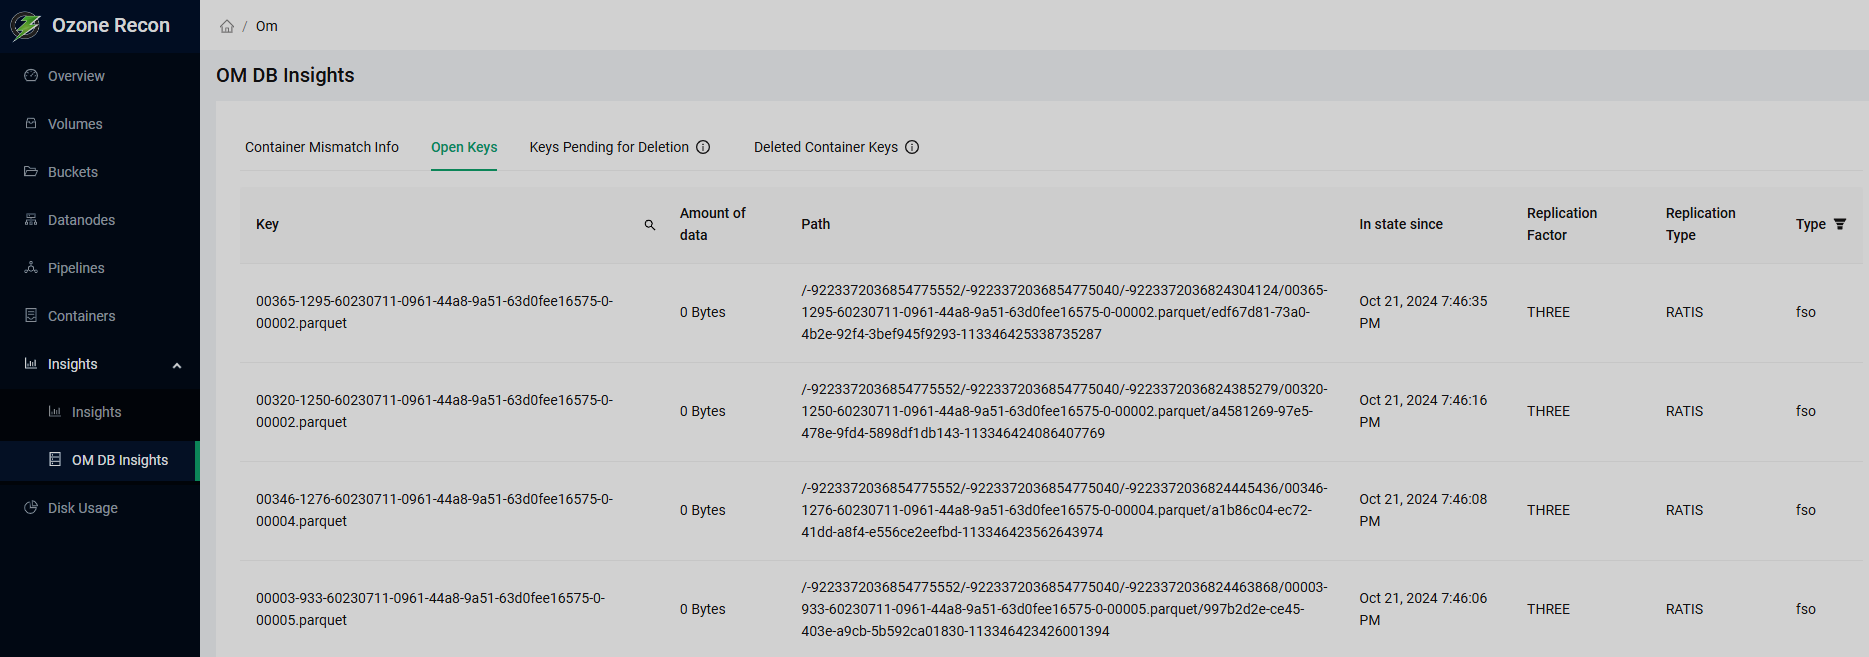
OM DB Insights
The OM DB Insights page contains four tabs:
Containers are supposed to be present in both Ozone Manager and Storage Container Manager databases. This tab contains information on containers that are present only in one of them (mismatched containers). Information is presented as a table that has the following columns:
-
Container ID — ID of the mismatched container.
-
Count Of Keys — number of keys stored in the mismatched container.
-
Pipelines — IDs of pipelines associated with the mismatched container.
-
Exists — database where the mismatched container is present. Possible values:
OMorSCM.
This tab contains information on the open keys in the Ozone Manager database. Information is presented as a table that has the following columns:
-
Key — ID of the key.
-
Amount of data — size occupied by the key contents.
-
Path — path to the key location.
-
In state since — time since the key has been opened.
-
Replication Factor — value of the key replication factor.
-
Replication Type — type of replication of the key. Possible values:
RATISorSTANDALONE. -
Type — type of the key.
This tab contains information on the keys that are awaiting to be deleted. Information is presented as a table that has the following columns:
-
Key Name — name of the key to be deleted.
-
Path — path to the key location.
-
Total Data Size — size occupied by the key data.
-
Total Key Count — number of keys to be deleted.
This tab contains information on the keys mapped to containers that have the DELETED state in the Storage Container Manager database. Information is presented as a table that has the following columns:
-
Container ID — ID of the deleted container.
-
Count Of Keys — number of keys mapped to the container.
-
Pipelines — list of pipelines associated with the container.
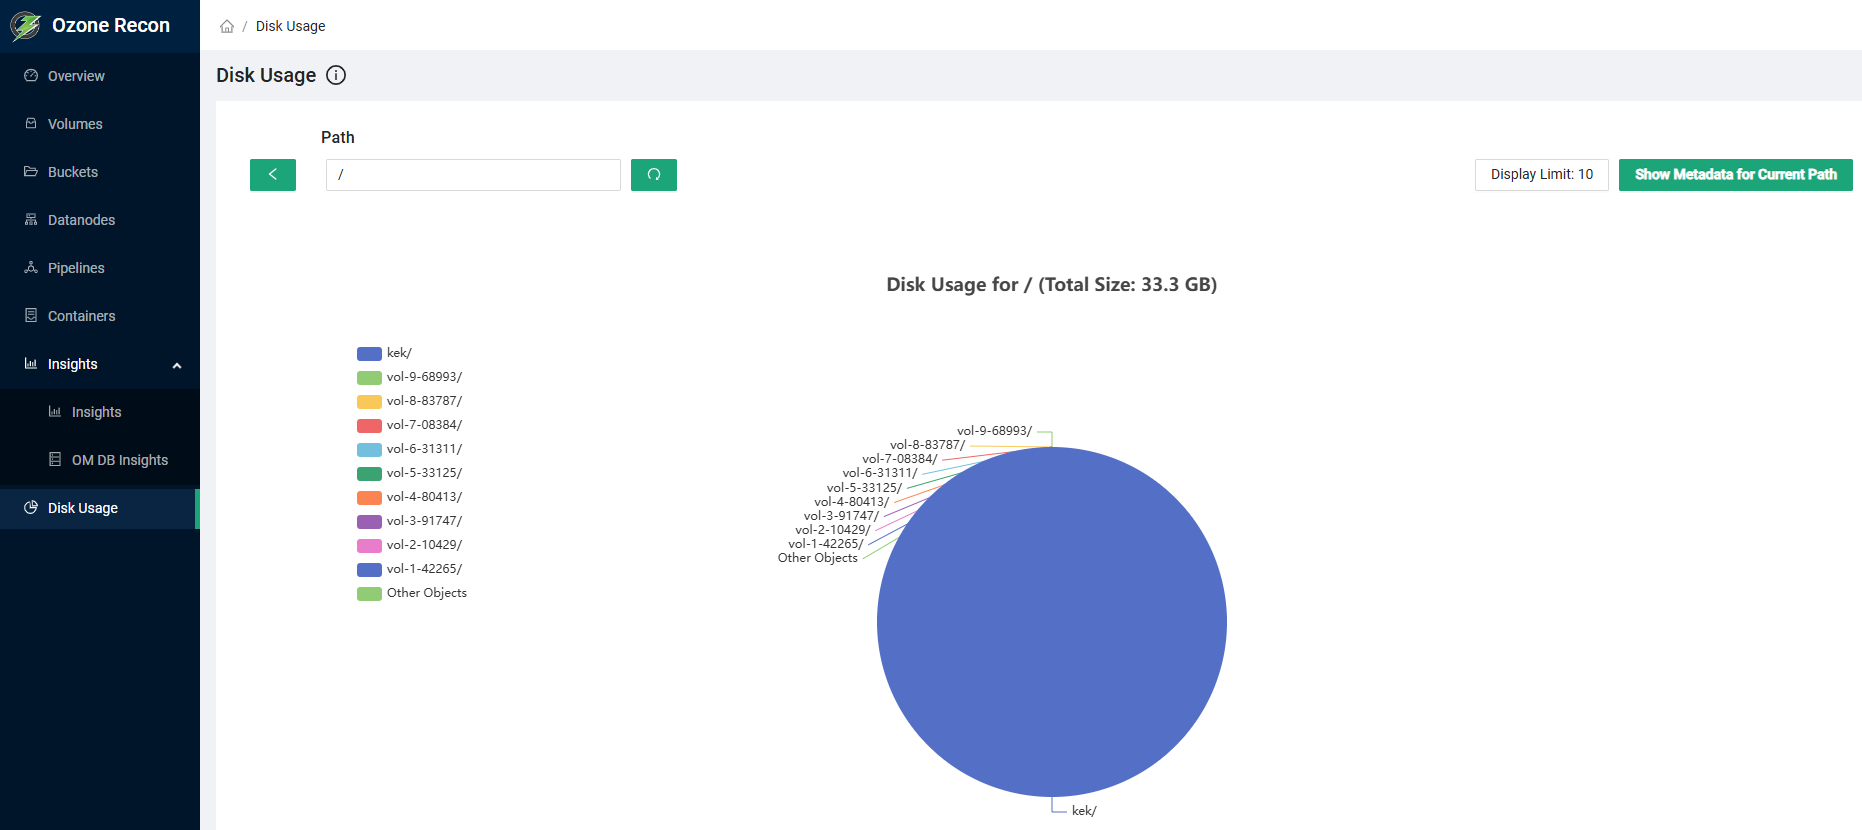
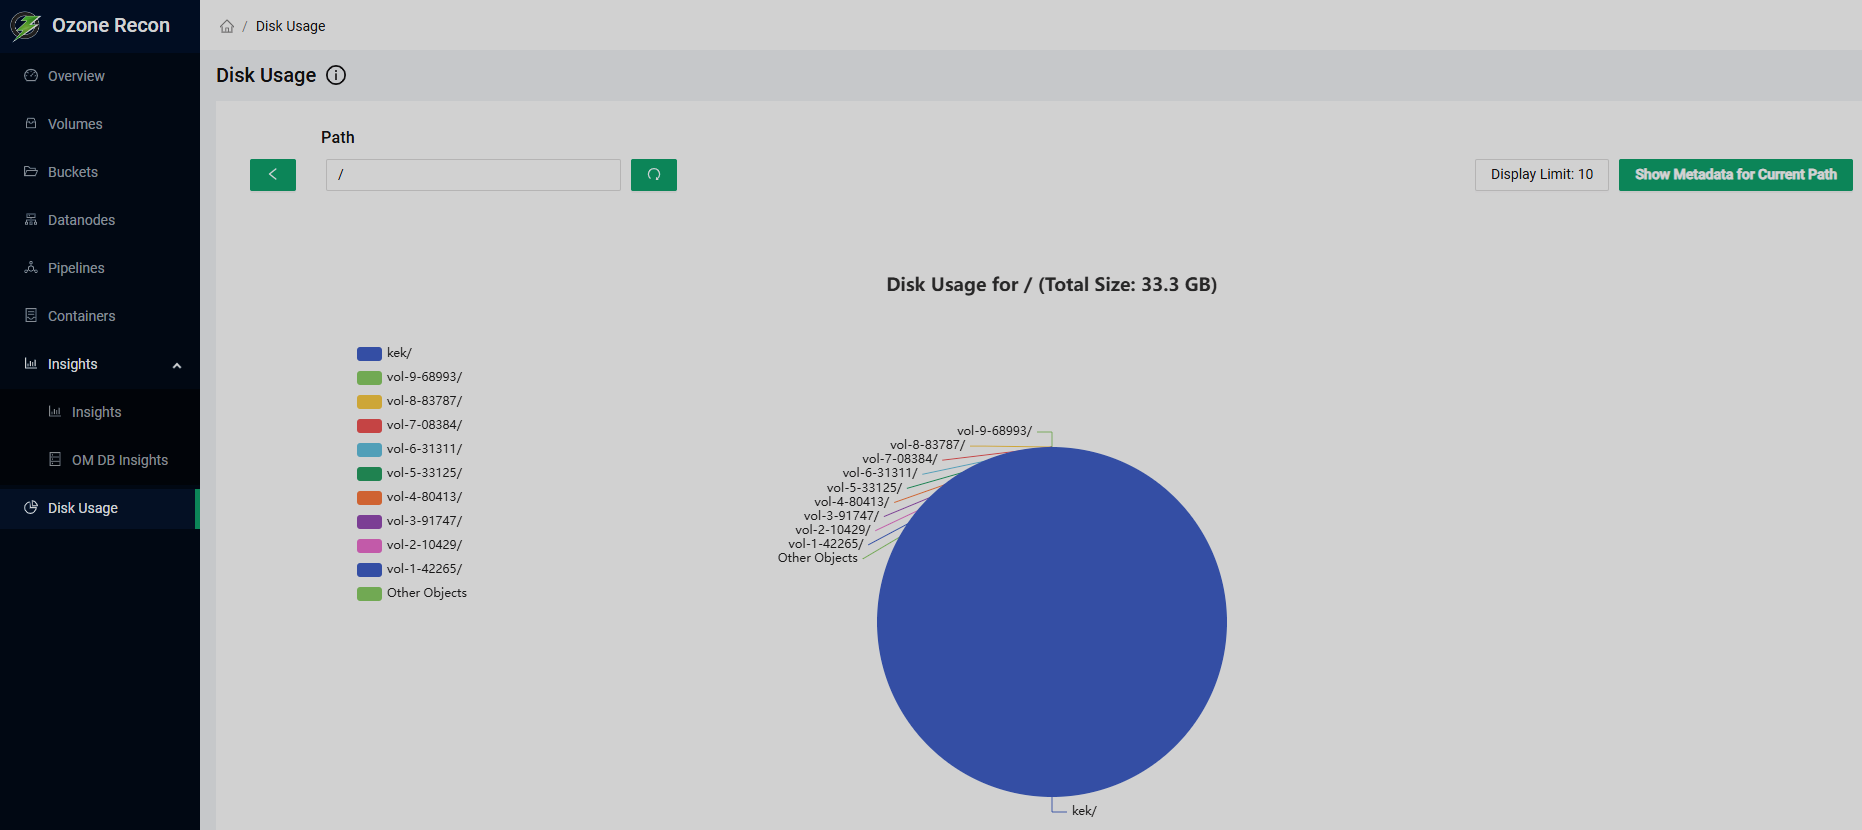
Disk Usage
The Disk Usage page contains the pie chart of disk usage by buckets stored in the Ozone cluster. You can filter the data in the following ways:
-
You can enter a path in the corresponding field to view the statistics for the data contained in the specified directory and all its subdirectories.
-
You can click on any item of the color legend in the left part of the page or on the pie chart sector (or its callout) to view its own statistics. Notice that in this case, the respective path appears in the Path field. This can be done several times until the lowest possible nesting level is reached.
-
You can click on the < button to the left of the Path field to move one directory up.
Also you can choose the limit of items to display and view the metadata of currently specified path by using the respective controls in the top right part of the page.
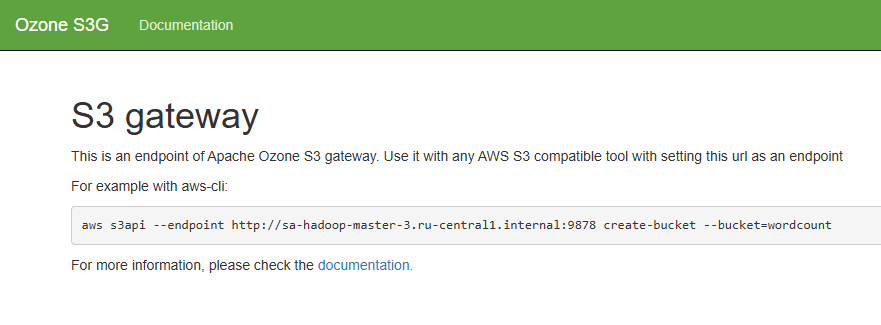
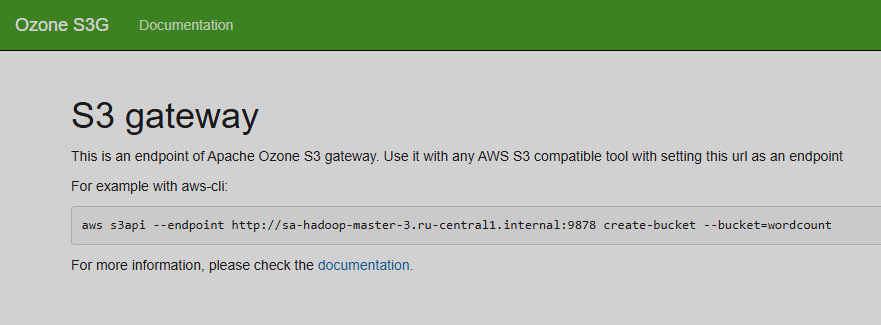
Ozone S3G UI
The Ozone S3G UI only page is essentially a stub. It says that its address is the endpoint of the S3 gateway and that it can be used with any of the AWS S3 compatible tools to compose requests. It also contains a link to the Apache Ozone documentation.
Ozone Storage Container Manager UI
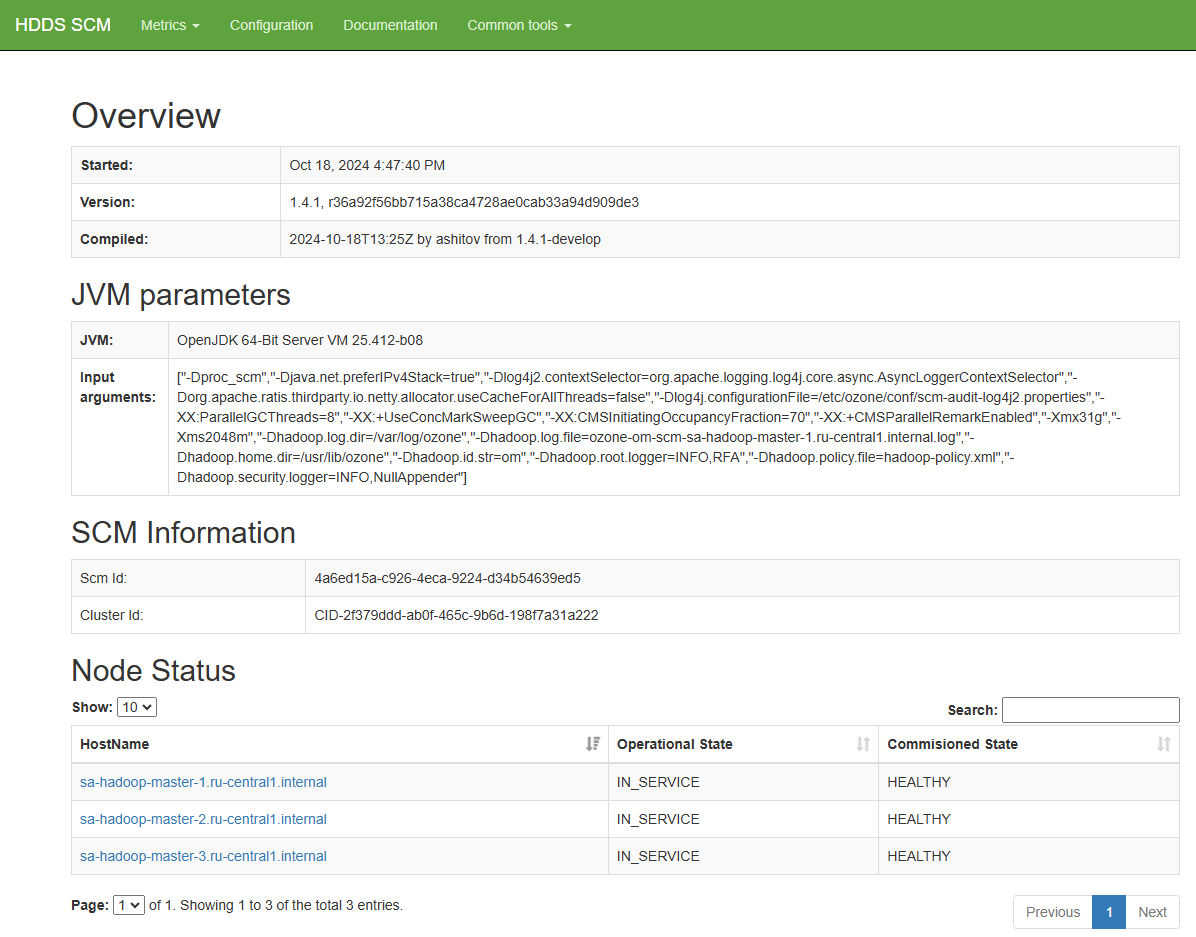
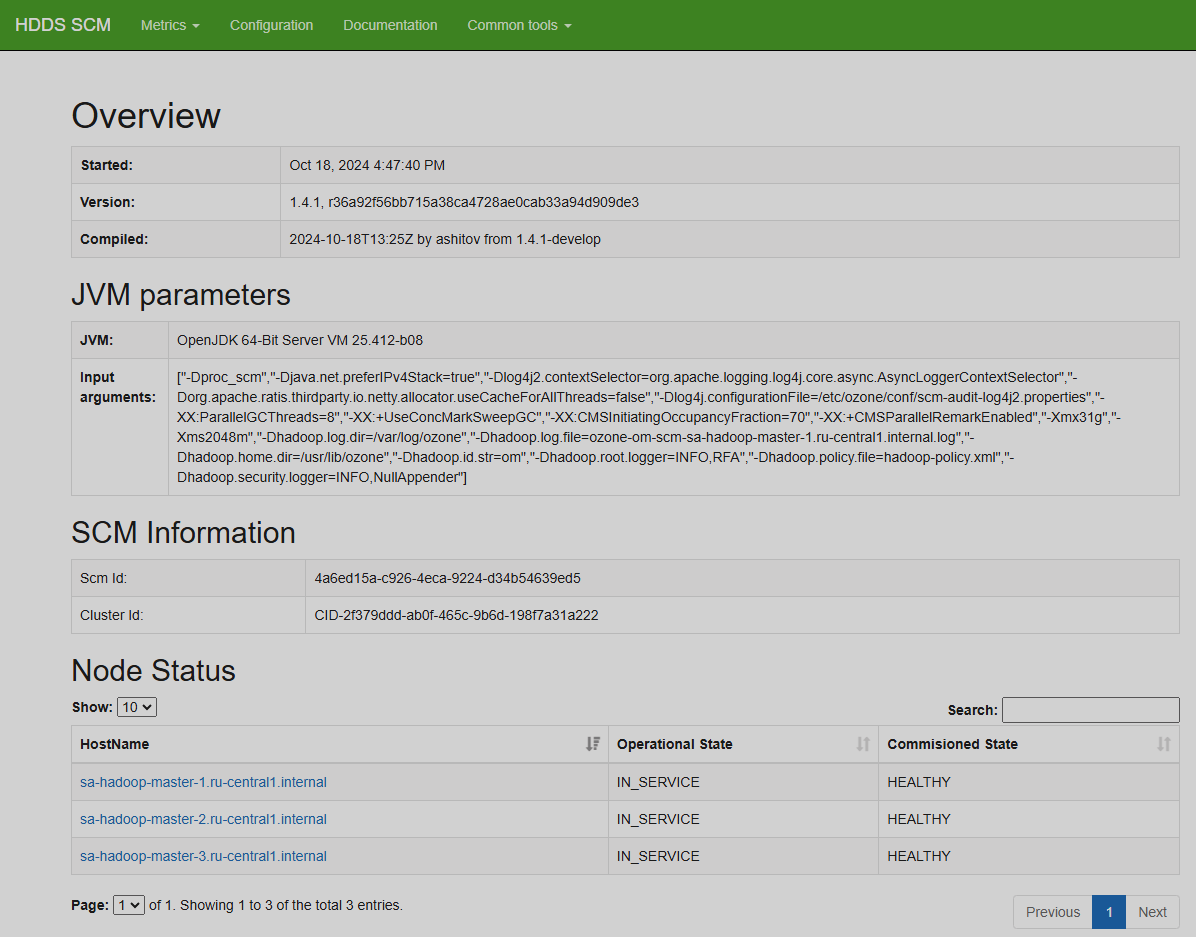
Overview
Start page of the Ozone Storage Container Manager (SCM) UI is the Overview page. It contains the following information:
-
Service details:
-
time started;
-
version and checksum;
-
time compiled, user, and source branch.
-
-
Java virtual machine details: version and input arguments string.
-
SCM information: IDs of the SCM and cluster.
-
Statuses of the nodes participating in the SCM cluster.
-
Status of the high availability mode:
-
client and datanode RPC ports;
-
state of the node manager safe mode;
-
roles of the SCM nodes;
-
name of the primordial SCM node.
-
-
Metadata volume information: home directories for Ratis and RocksDB.
-
Safemode rules statuses: whether the rules intended to ensure safety passed the check.
Metrics
The Metrics page is identical to the Metrics page of the Ozone Datanode UI.
Configuration
The Configuration page is identical to the Configuration page of the Ozone Datanode UI.
Documentation
The Documentation page is identical to the Documentation page of the Ozone Datanode UI.
Common tools
The Common tools group pages are identical to the corresponding pages of the Common tools group of the Ozone Datanode UI.