

StarRocks web UI overview
StarRocks web UI is a built-in web interface, providing administrators with information about the StarRocks cluster, its nodes, running queries and sessions, system variables, high-availability (HA) status, logs, and process performance profiles.
Access web UI
The web UI is provided by Frontend (FE) nodes. You can find the web interface URLs in ADCM under the Services → StarRocks → Components → StarRocks FE → Info tab formatted as http://<FE-host>:<FE-http-port>/. For example, http://starrocks-fe.example.com:18030/.
In ADH, the default FE HTTP port is 18030. It can be changed in the configuration by setting up the Services → StarRocks → Components → StarRocks FE → Custom fe.conf → http_port parameter.
Access to the StarRocks web UI is authenticated using StarRocks user accounts. The web UI does not have a separate set of users.
After ADH installation, you can access the StarRocks web UI using one of the following accounts:
-
The
rootuser is intended for administrative access. The account is initialized with an empty (blank) password, which ADH does not manage. After the cluster is created, set up a password for therootuser manually as described in StarRocks documentation. -
The
service_useraccount is a StarRocks user with limited privileges for accessing sensitive information and functions in the web UI. You can set a password for this account in Services → StarRocks → Credentials → Service_user password.
Additional users can be created and granted access to the web UI.
Web UI navigation
The web UI consists of the following tabs:
Homepage
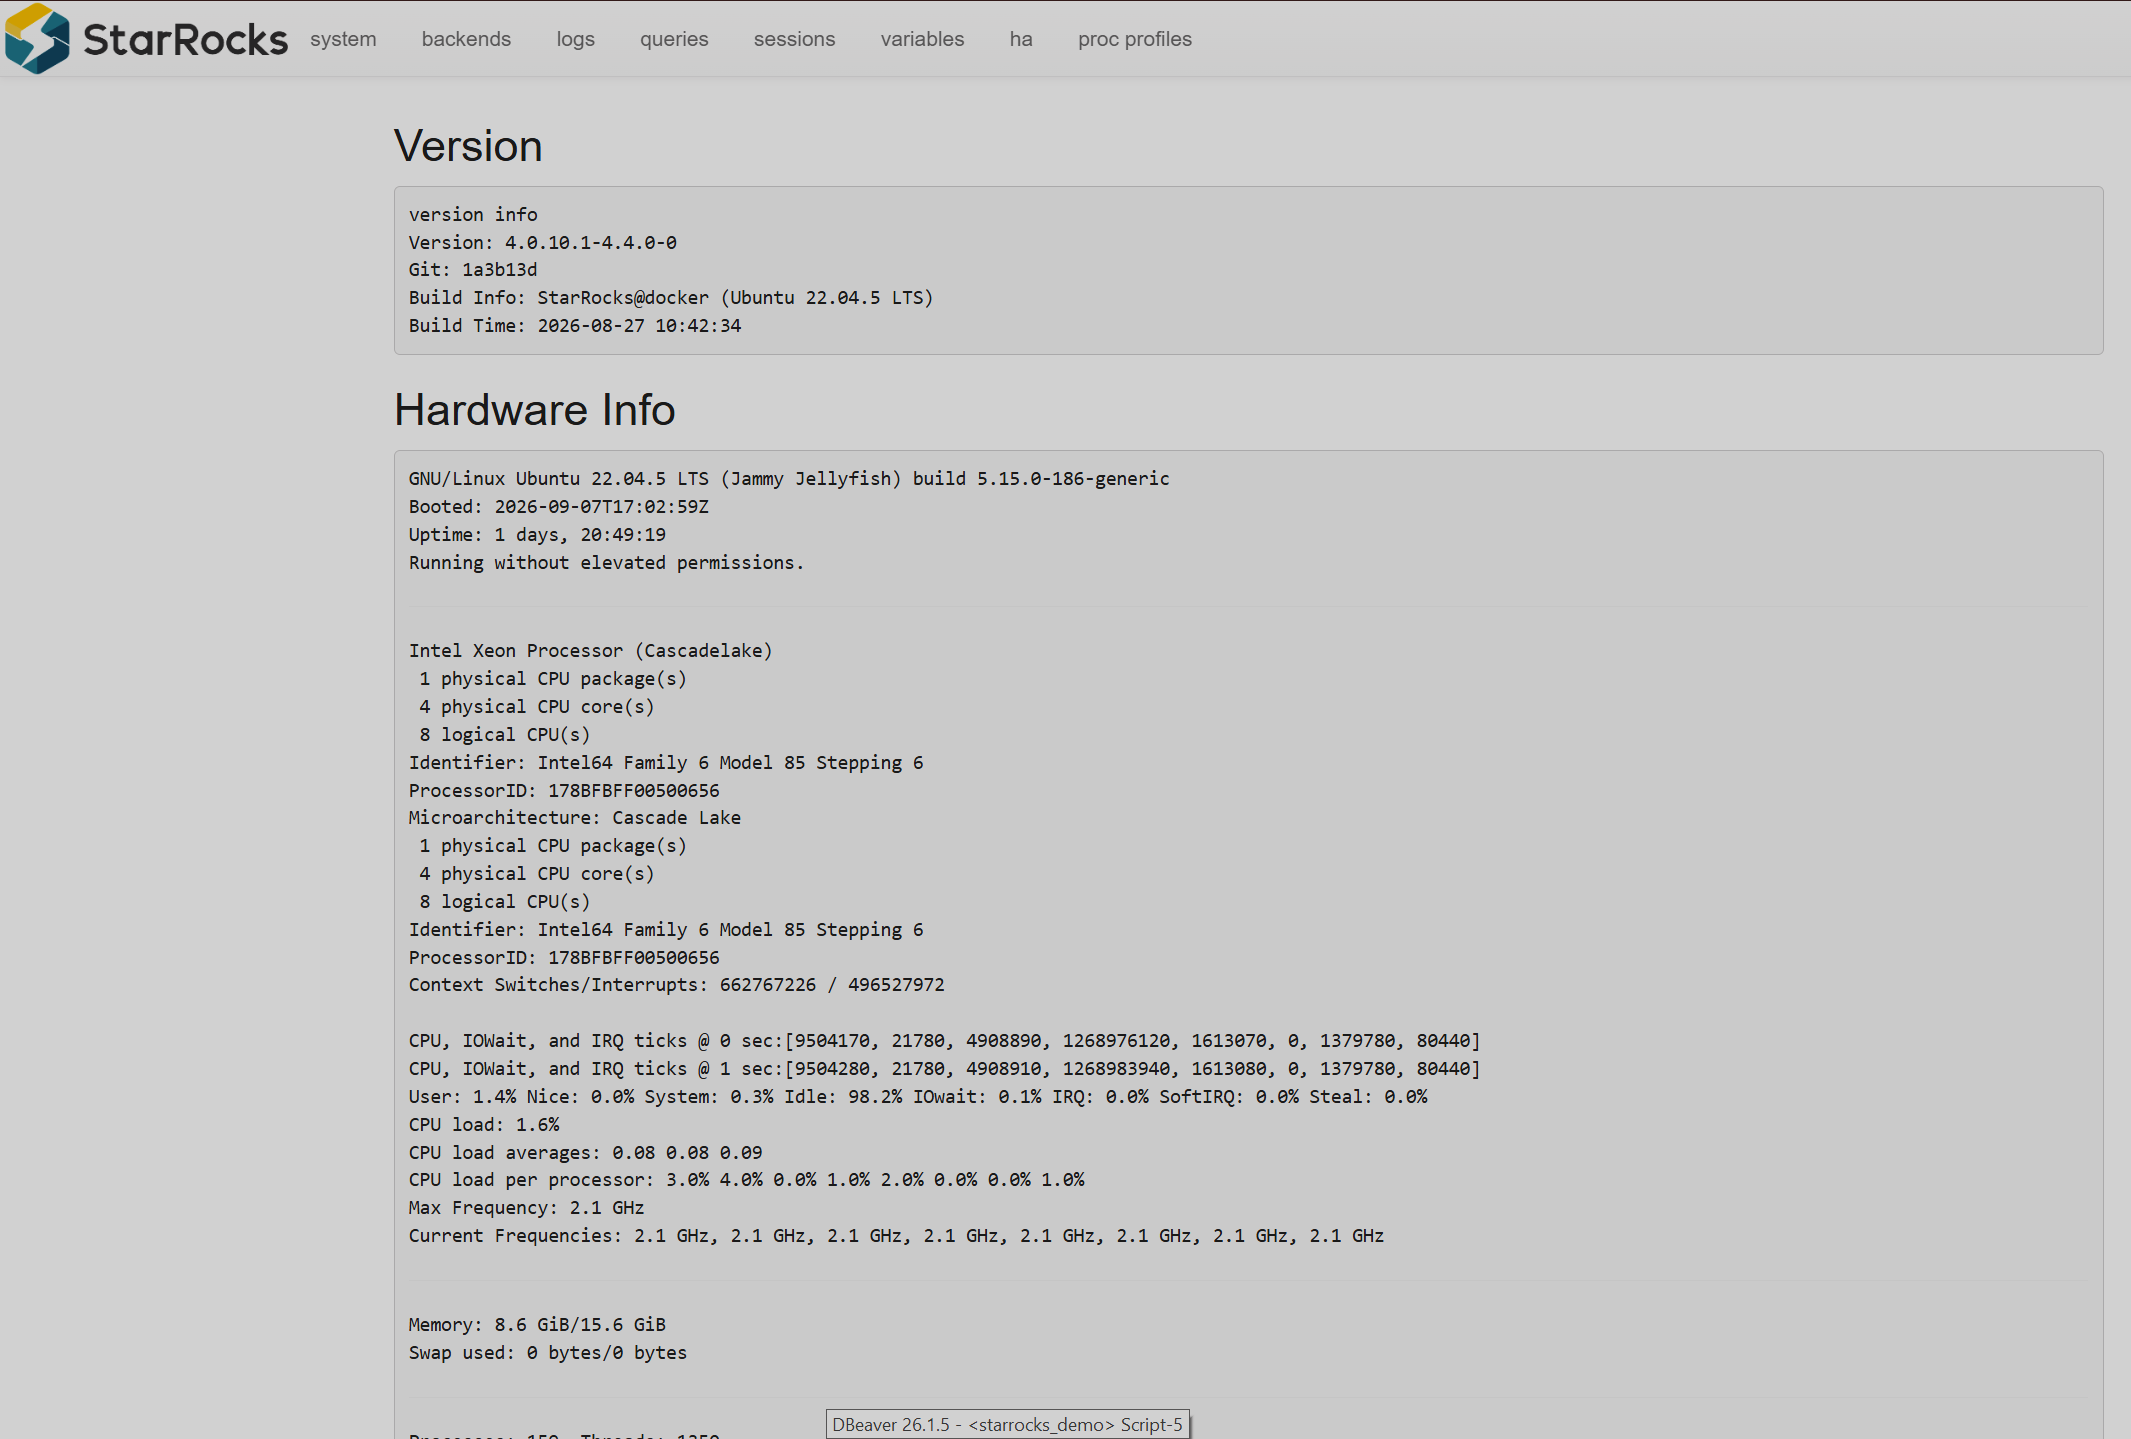
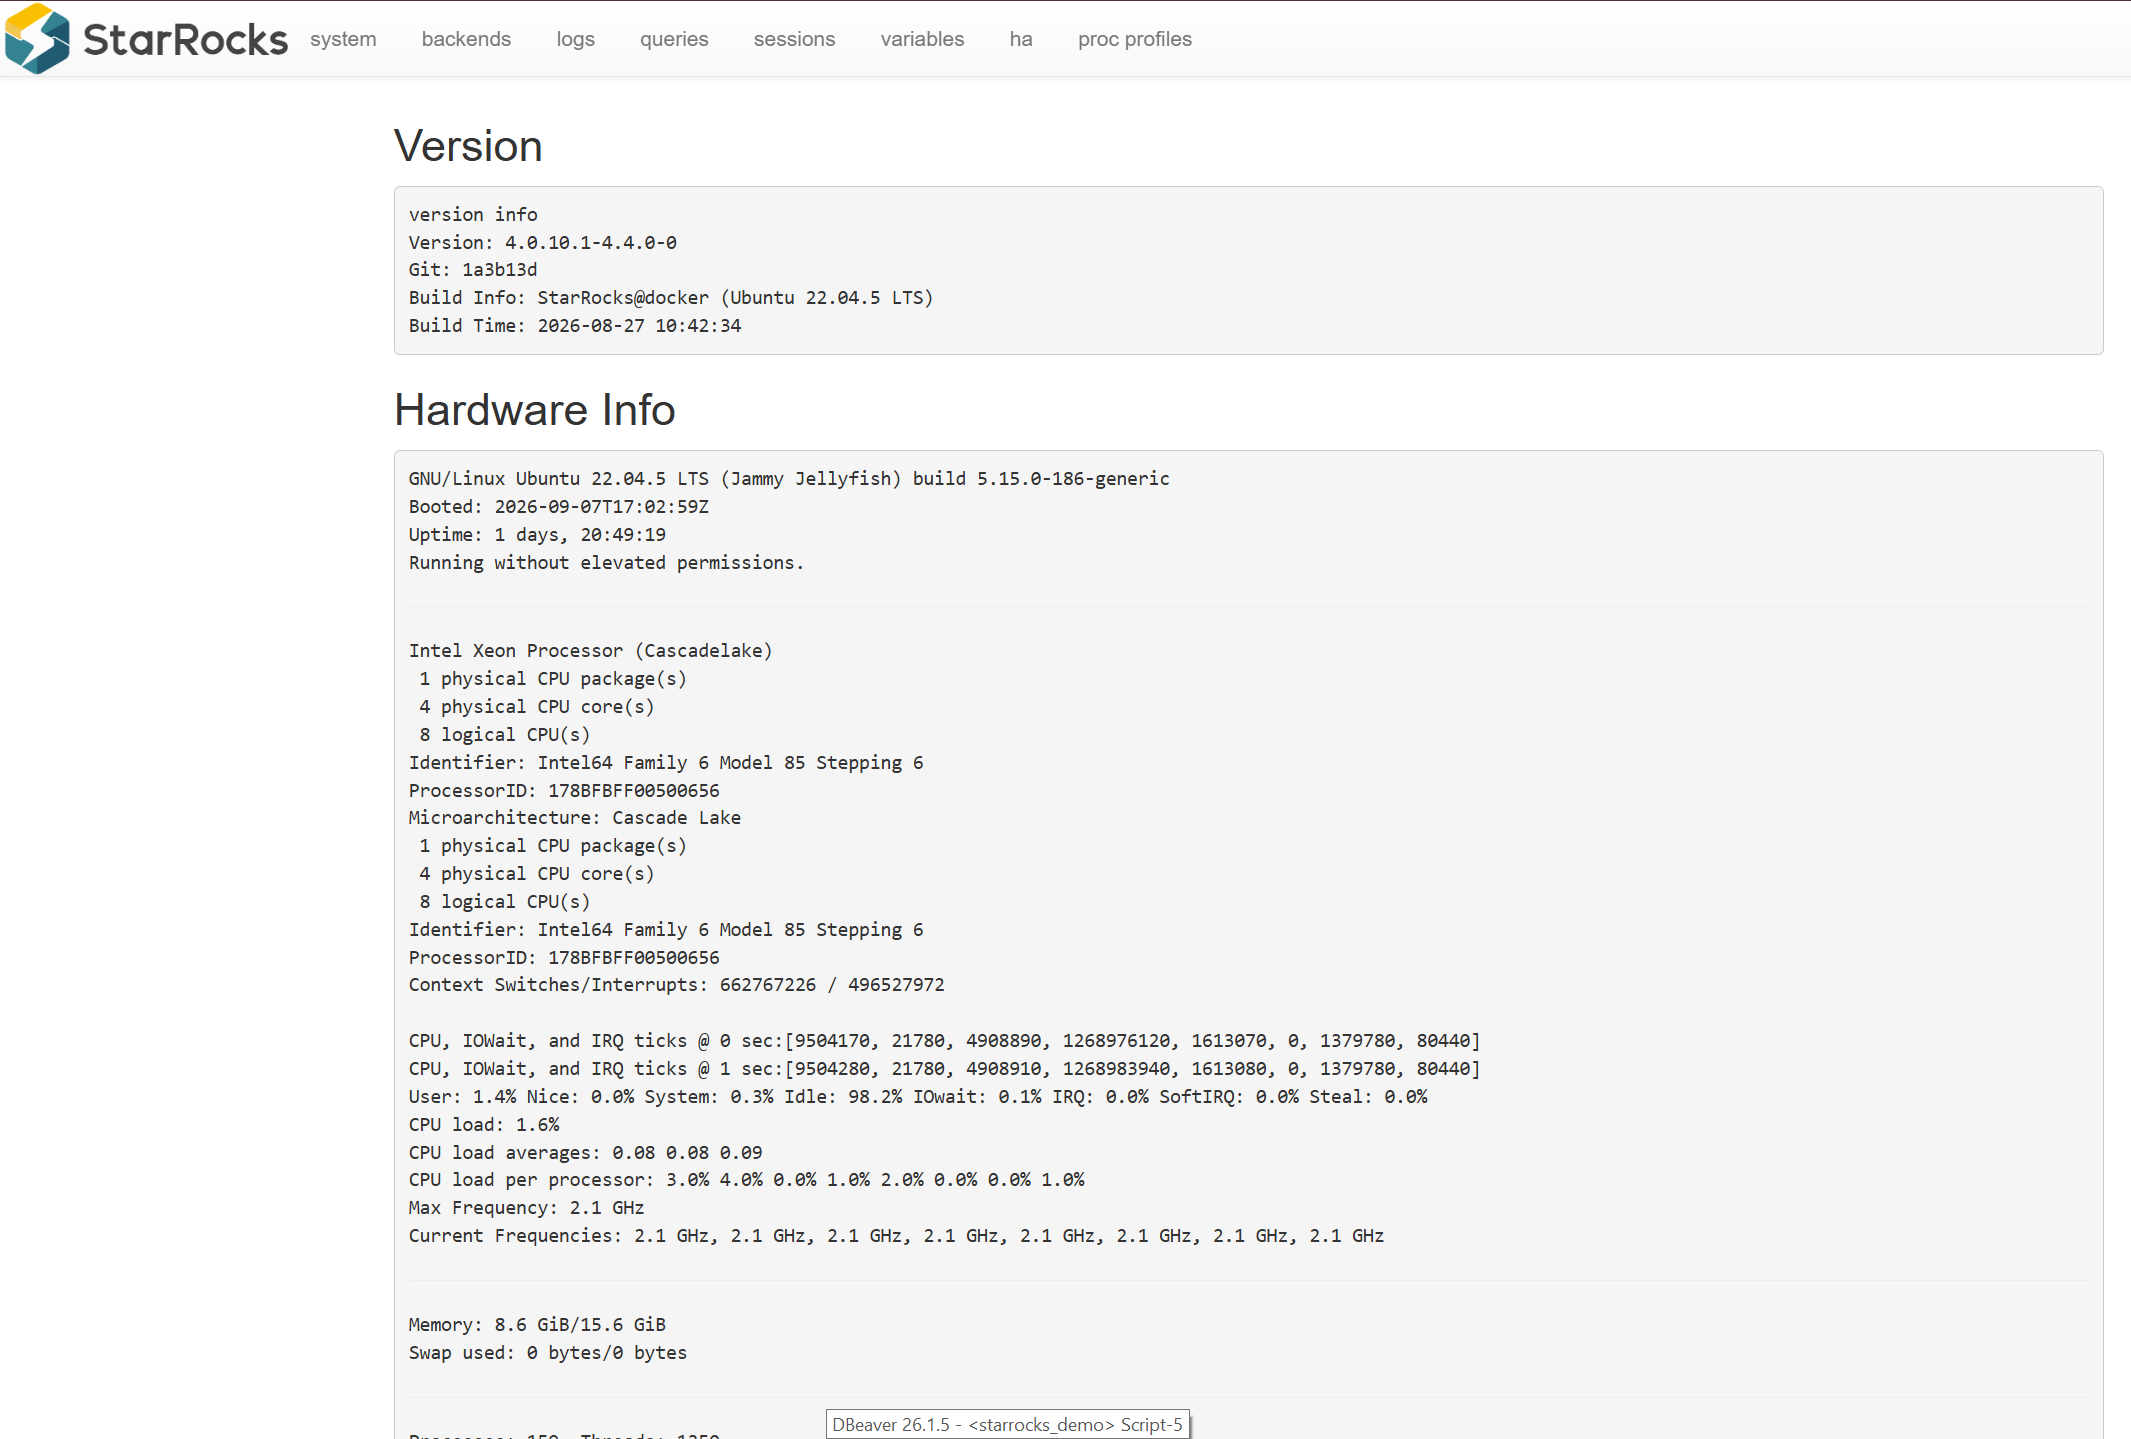
The home page opens upon a successful logon and can also be opened by clicking on the StarRocks logo in web UI. It contains information about the StarRocks version installed and detailed hardware information.
System
The System tab provides general information about the StarRocks FE process and the environment in which it is running.
This tab is useful as a first diagnostic point when investigating the state of a StarRocks installation. It can be used to verify that the FE process is available and to inspect basic system information.
| Info item | Description |
|---|---|
brokers |
Registered Broker nodes, including their addresses, ports, availability, and error messages. SQL equivalent: |
frontends |
FE nodes, including their IP addresses, ports, roles, availability, heartbeat status, and StarRocks version. SQL equivalent: |
routine_loads |
Routine Load jobs and their execution information, including job status, progress, statistics, and data source properties. SQL equivalent: |
catalog |
Catalogs (native and external) registered in the cluster. SQL equivalent: |
colocation_group |
Colocate Join groups and information about the tables assigned to each group. SQL equivalent: |
cluster_balance |
Cluster load-balancing information, including the current balance state, cluster load, scheduler status, and tablet repair activity. SQL equivalent: |
load_error_hub |
Load Error Hub configuration used to manage error messages generated by loading jobs. SQL equivalent: |
meta_recovery |
Metadata recovery information, including partitions that failed to recover |
global_current_queries |
Queries currently running on all FE nodes in the cluster. SQL equivalent: |
tasks |
Generic cluster tasks, including the total number of tasks and the number of failed tasks. SQL equivalent: |
compute_nodes |
CN nodes in the cluster and their current state. SQL equivalent: |
statistic |
Statistics for each database, including information about tables, partitions, indexes, tablets, and replicas. SQL equivalent: |
jobs |
Jobs in the cluster, including their types and the number of pending, running, finished, and cancelled jobs. SQL equivalent: |
warehouses |
Warehouses configured in the cluster and their current state |
resources |
Resources available in the cluster. SQL equivalent: |
monitor |
Cluster monitoring information, including JVM information. SQL equivalent: |
transactions |
Transactions in the cluster and their current state. SQL equivalent: |
backends |
BE nodes in the cluster and their current state. SQL equivalent: |
current_queries |
Queries currently running on the FE node to which the web UI is connected. SQL equivalent: |
stream_loads |
Stream Load operations and their execution information |
replications |
Data replication tasks, including their status, progress, and errors. SQL equivalent: |
dbs |
Databases, tables, partitions, and tablets in the cluster. SQL equivalent: |
current_backend_instances |
BE nodes currently processing requests in the cluster. SQL equivalent: |
historical_nodes |
Nodes that were previously registered in the cluster |
compactions |
Compaction tasks and their execution information. No direct SQL equivalent is listed in the current |
Backends
The Backends tab is intended to display information about Backend (BE) nodes, including their status and resource utilization.
|
IMPORTANT
BE components are not available in ADH because StarRocks is deployed using the shared-data model. As a result, the Backends tab does not provide useful node information in ADH. To inspect Compute Node (CN) status, use the SHOW PROC '/compute_nodes' statement or the System → compute_nodes section.
|
Logs
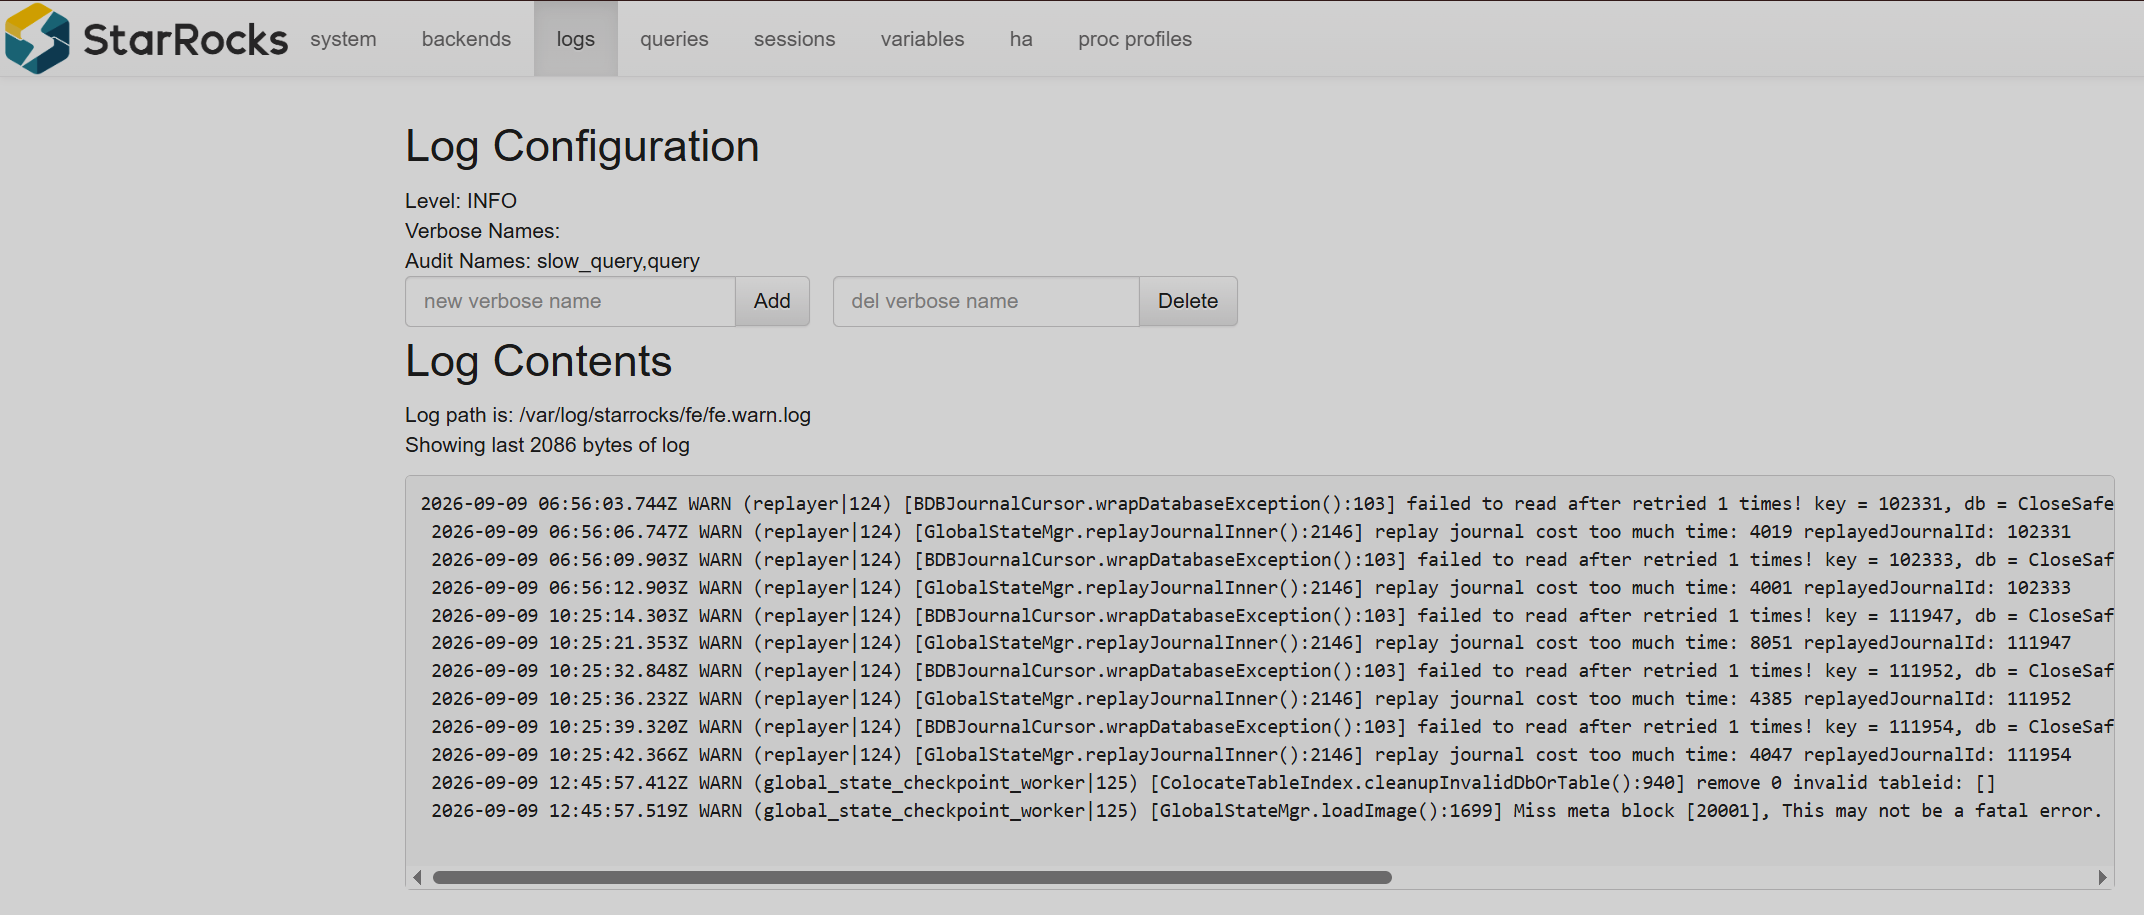
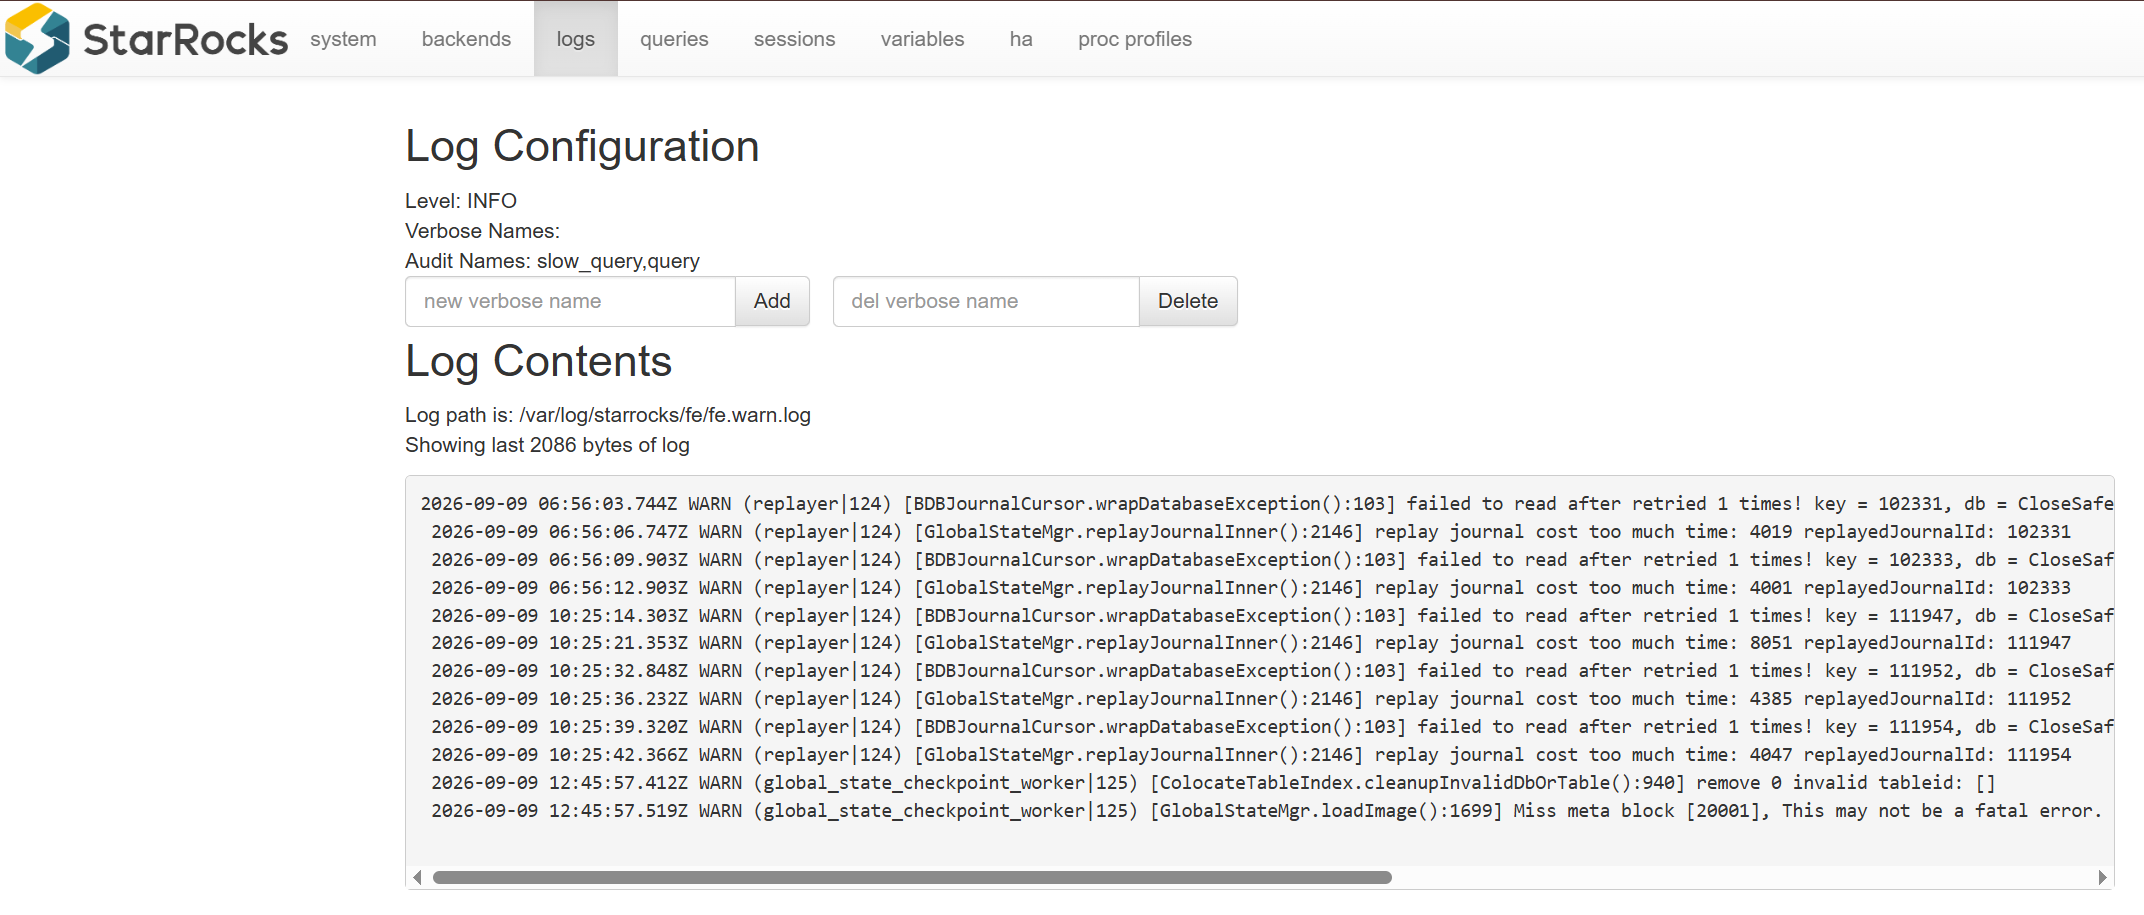
The Logs tab provides access to StarRocks log information. Logs are one of the primary sources of diagnostic information when investigating:
-
FE startup and shutdown problems;
-
cluster state changes;
-
failed requests;
-
query-related errors;
-
scheduling problems;
-
communication errors;
-
configuration problems;
-
abnormal node behavior.
StarRocks maintains separate logs for FE and compute processes. FE logs include information about startup, cluster state changes, DML and DQL requests, and scheduling-related operations.
Queries
The Queries tab is intended to display information about current and completed SQL queries processed by BE nodes.
|
IMPORTANT
BE components are not available in ADH deployment. StarRocks is deployed in the shared-data model, so this tab is always empty in ADH.
|
Sessions
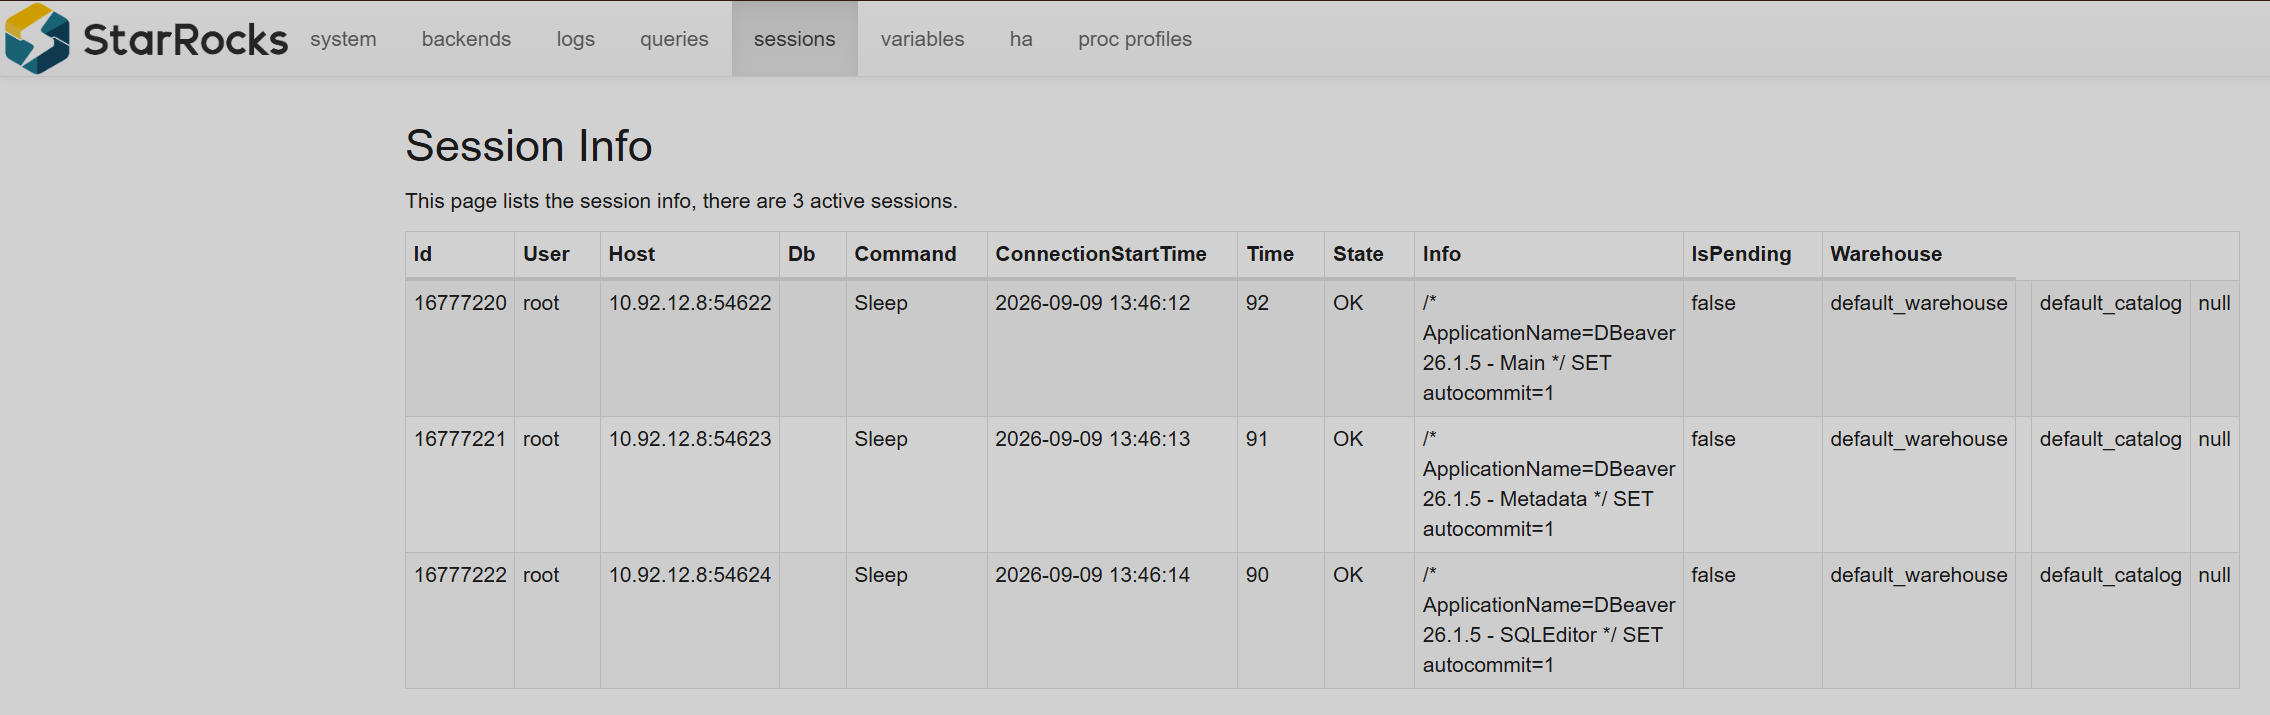
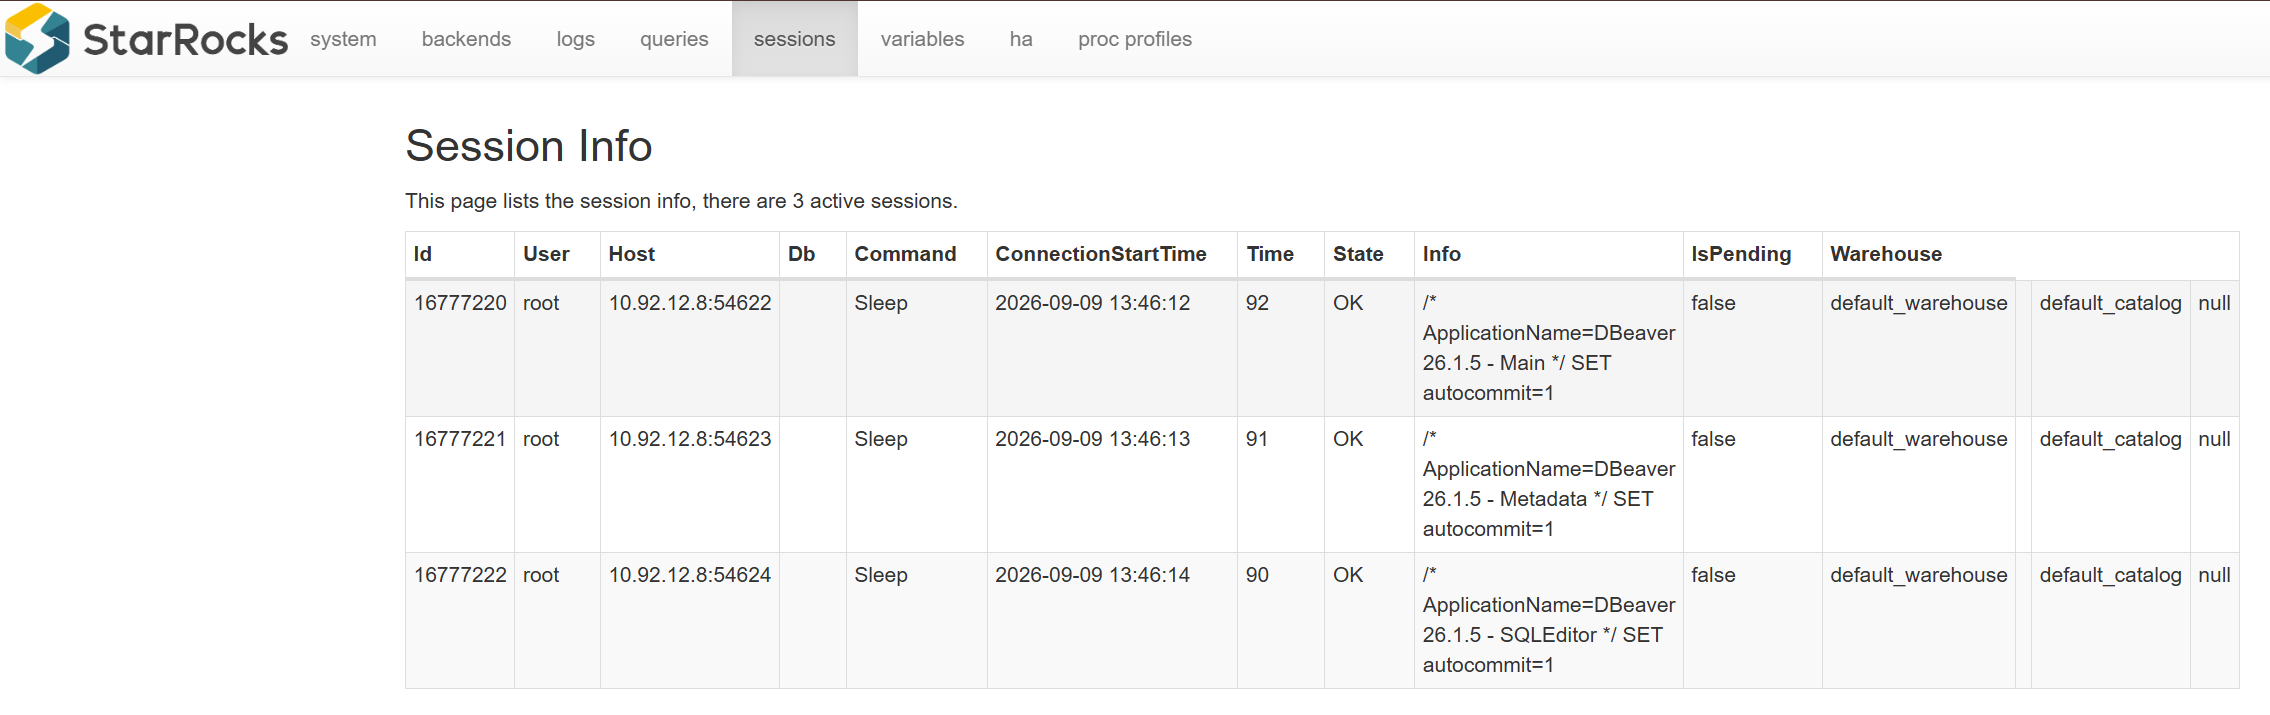
The Sessions tab displays active client sessions connected to StarRocks.
A session represents a client connection to StarRocks through the MySQL-compatible protocol. A single client application can establish one or more sessions.
The tab provides information about:
-
active client connections;
-
users connected to the cluster;
-
client addresses;
-
connection duration;
-
sessions associated with running queries;
-
long-lived or potentially abandoned connections.
Variables
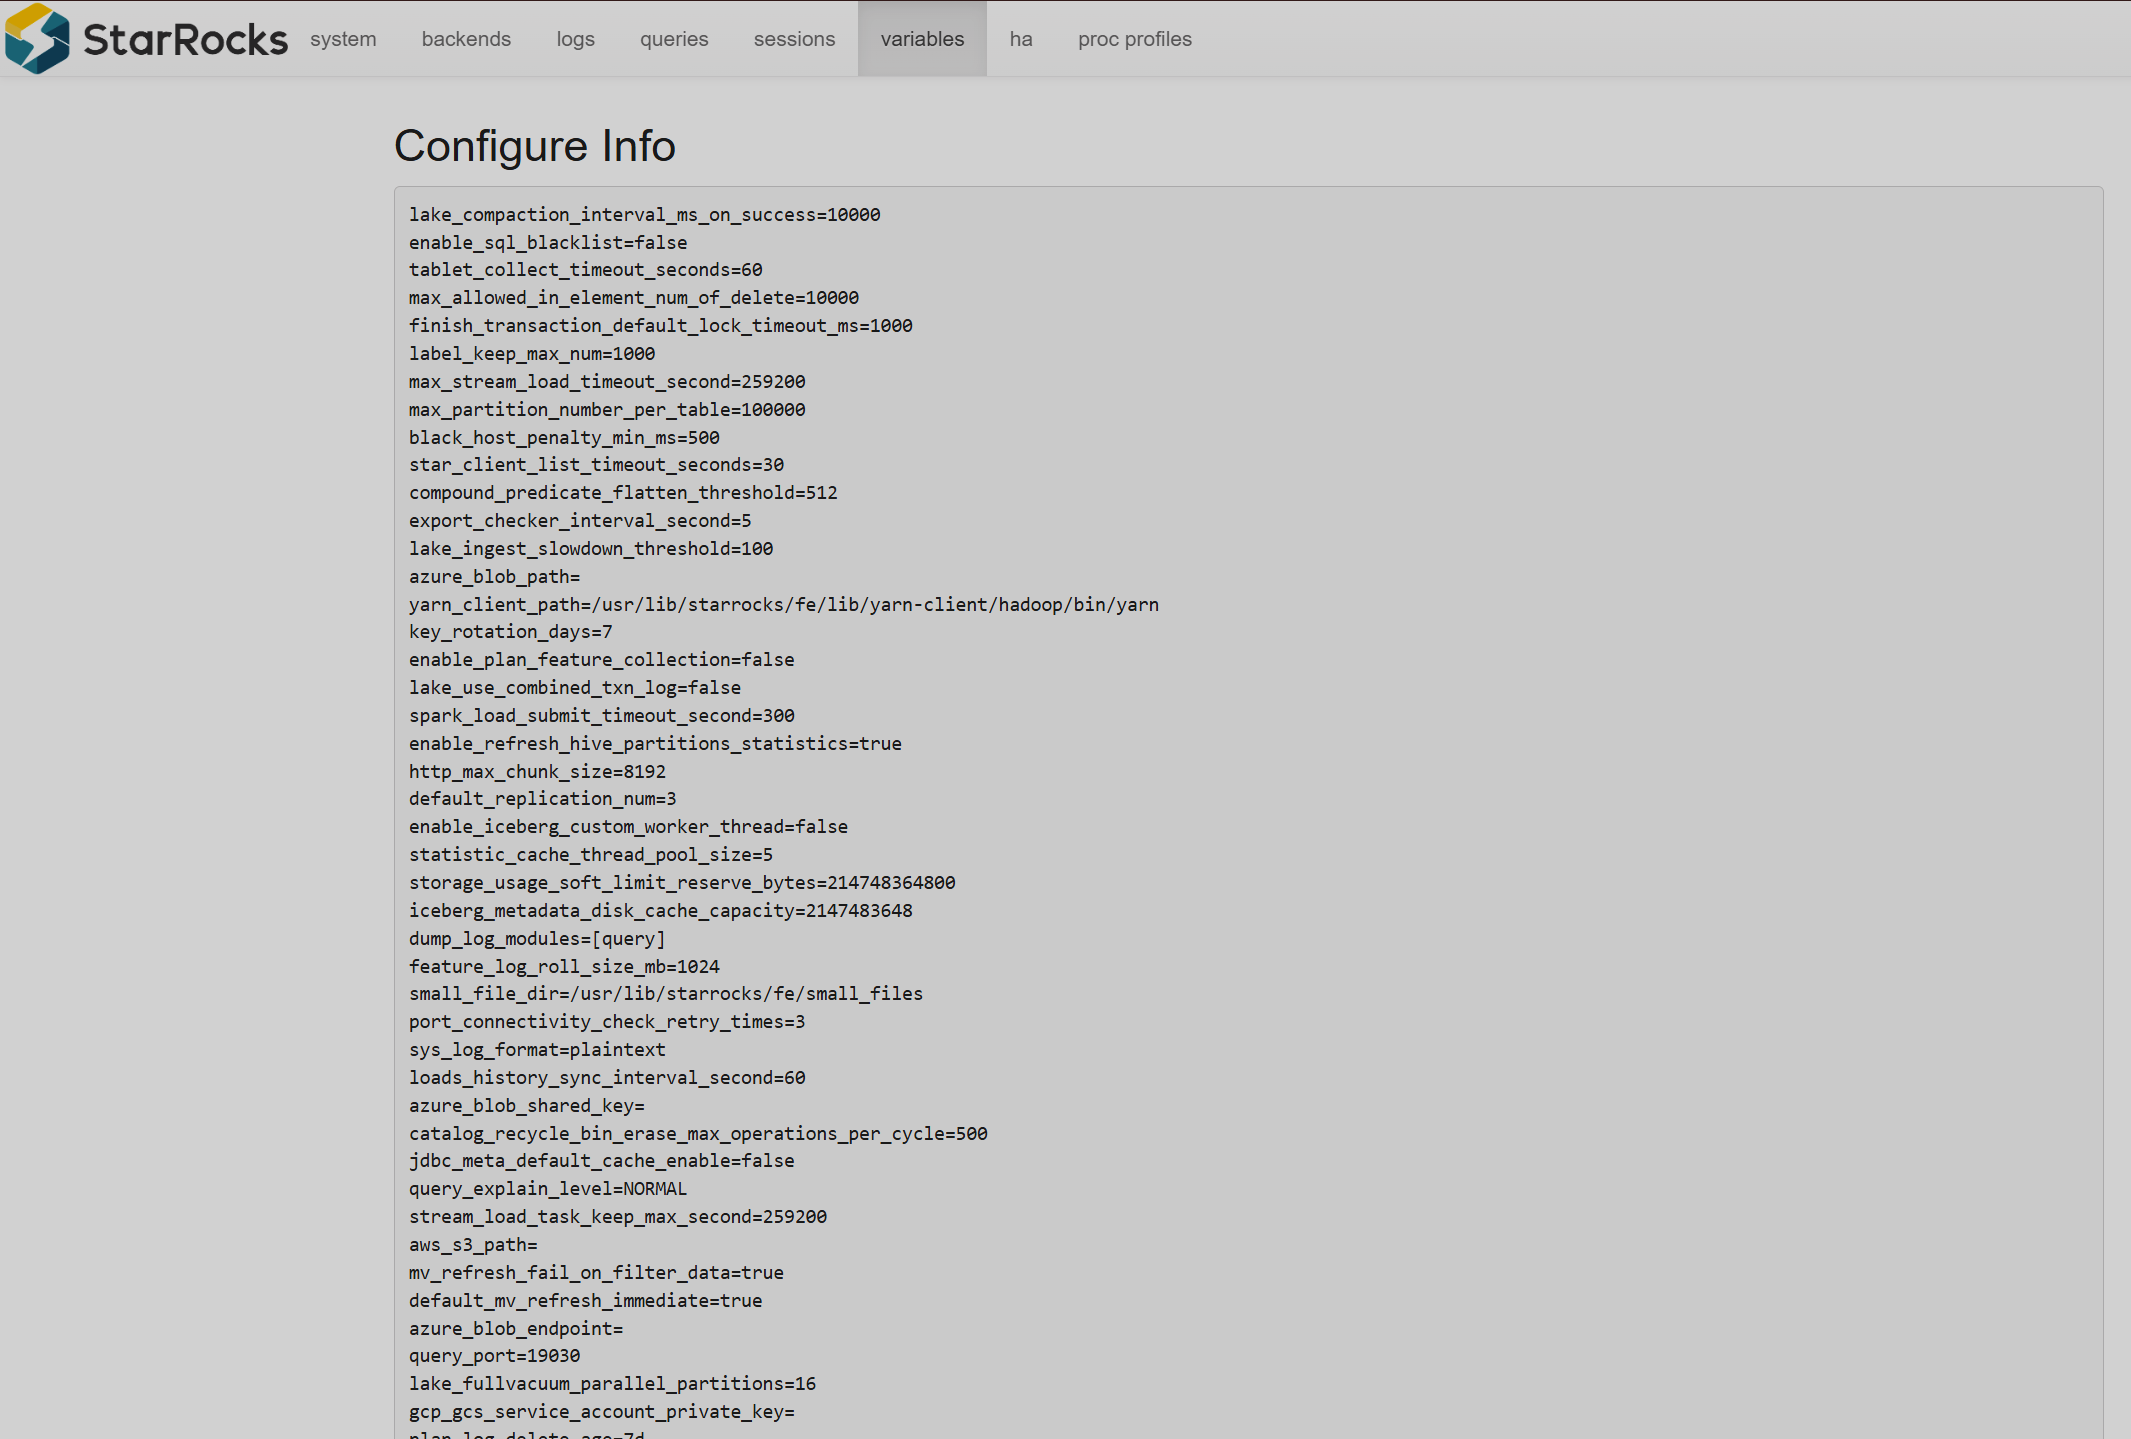
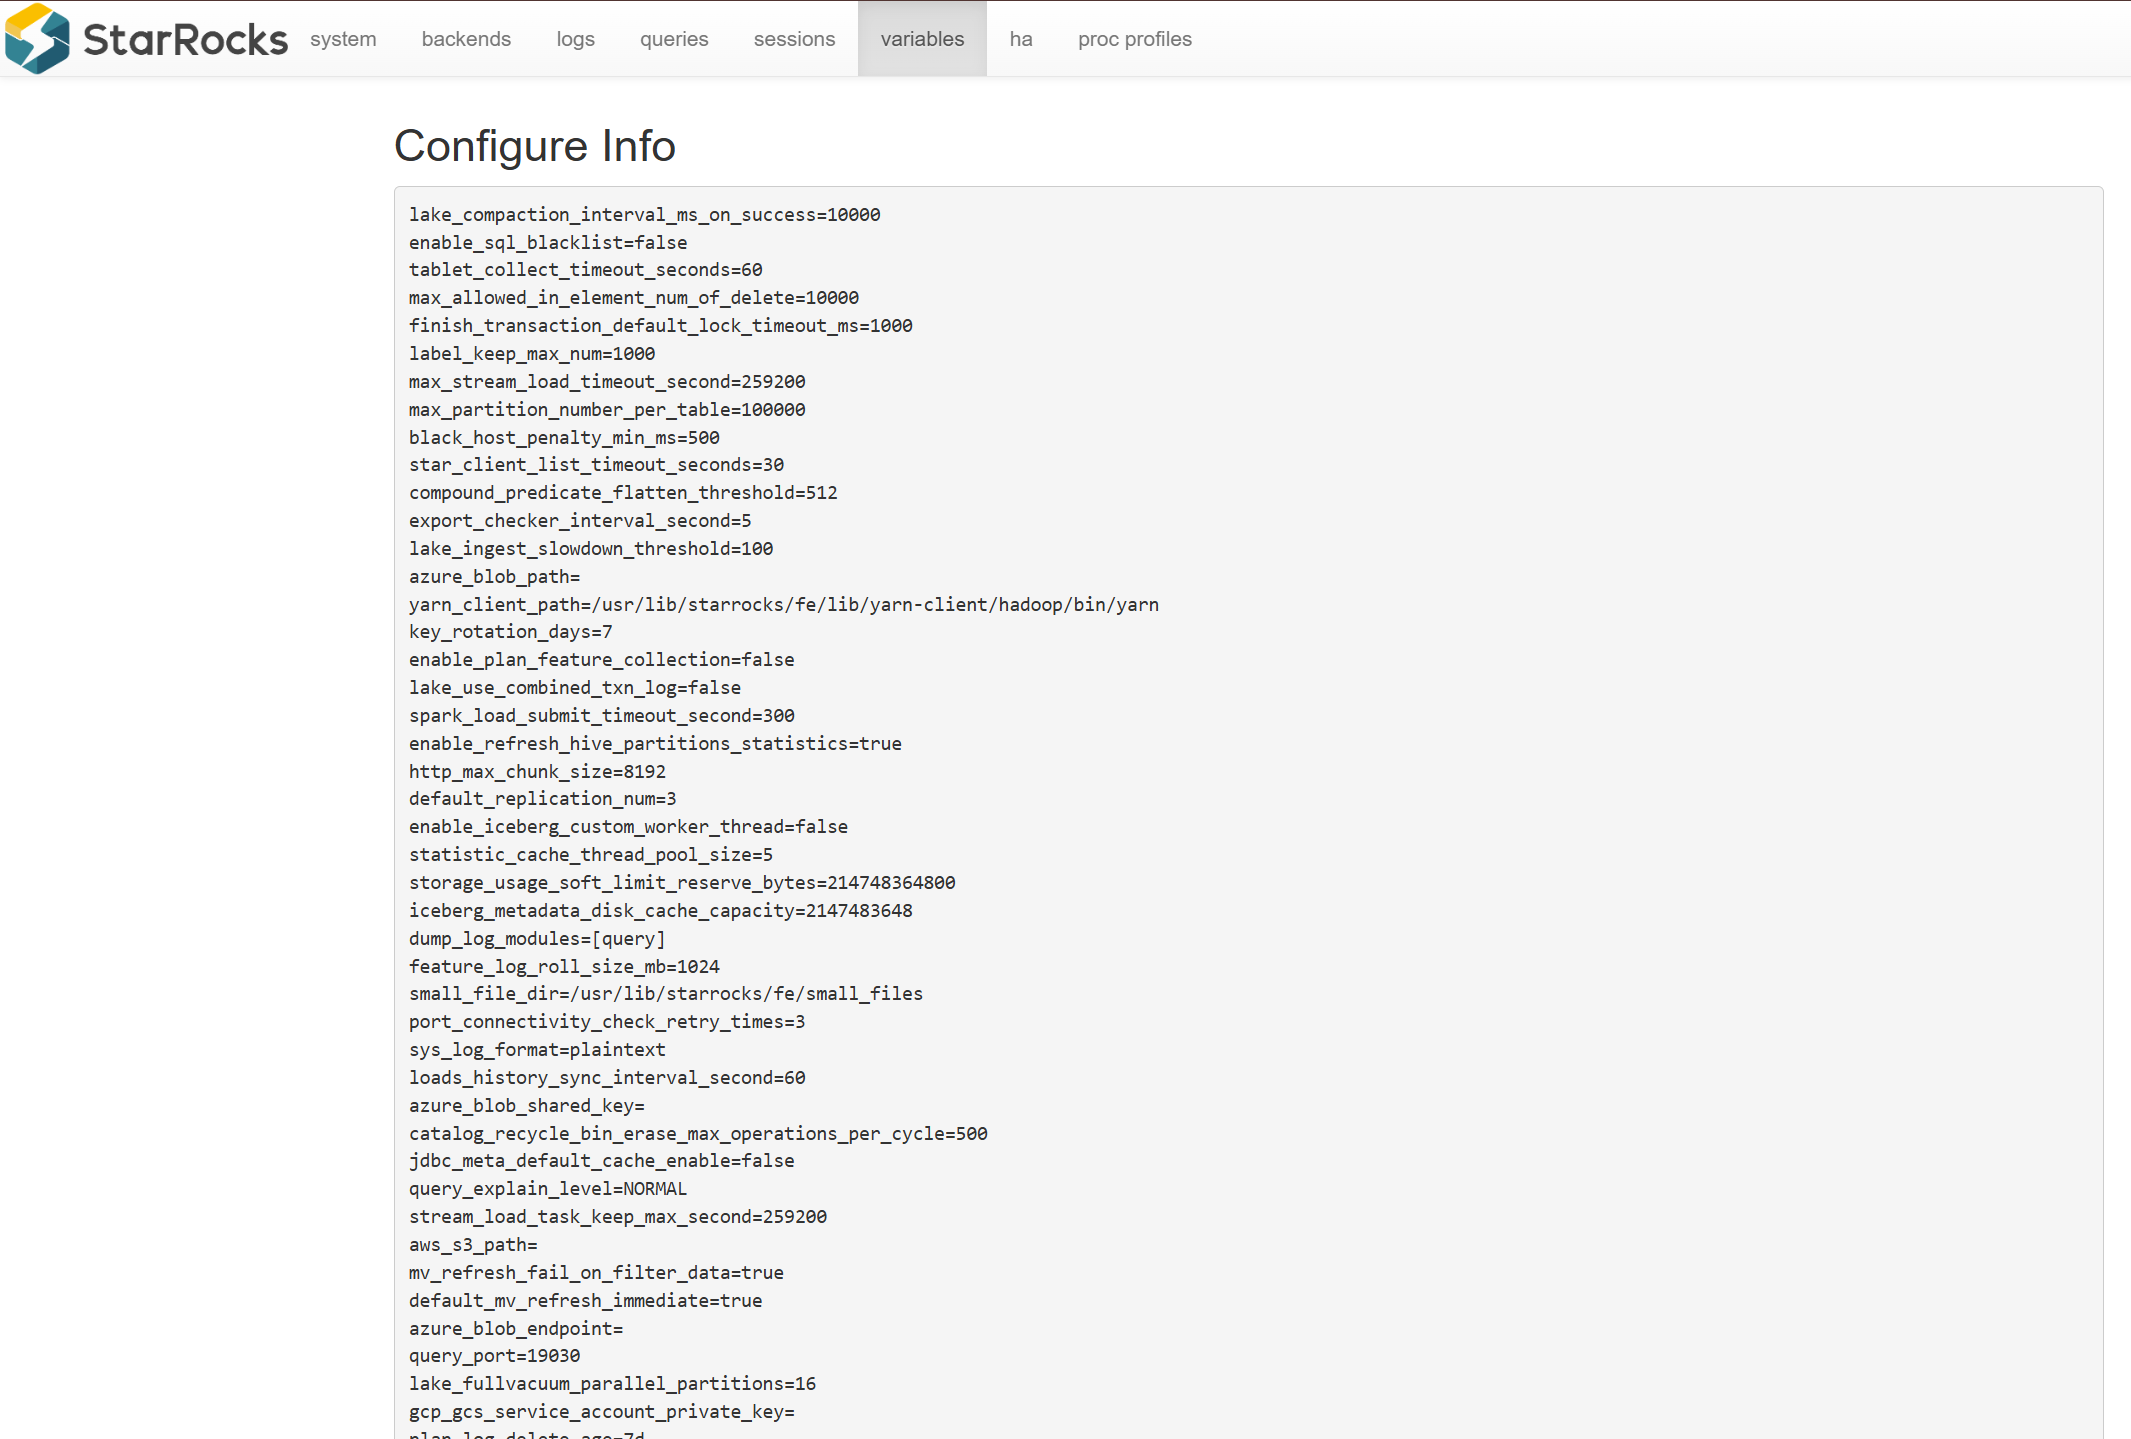
The Variables tab displays StarRocks system configuration, variables, and their current values.
HA
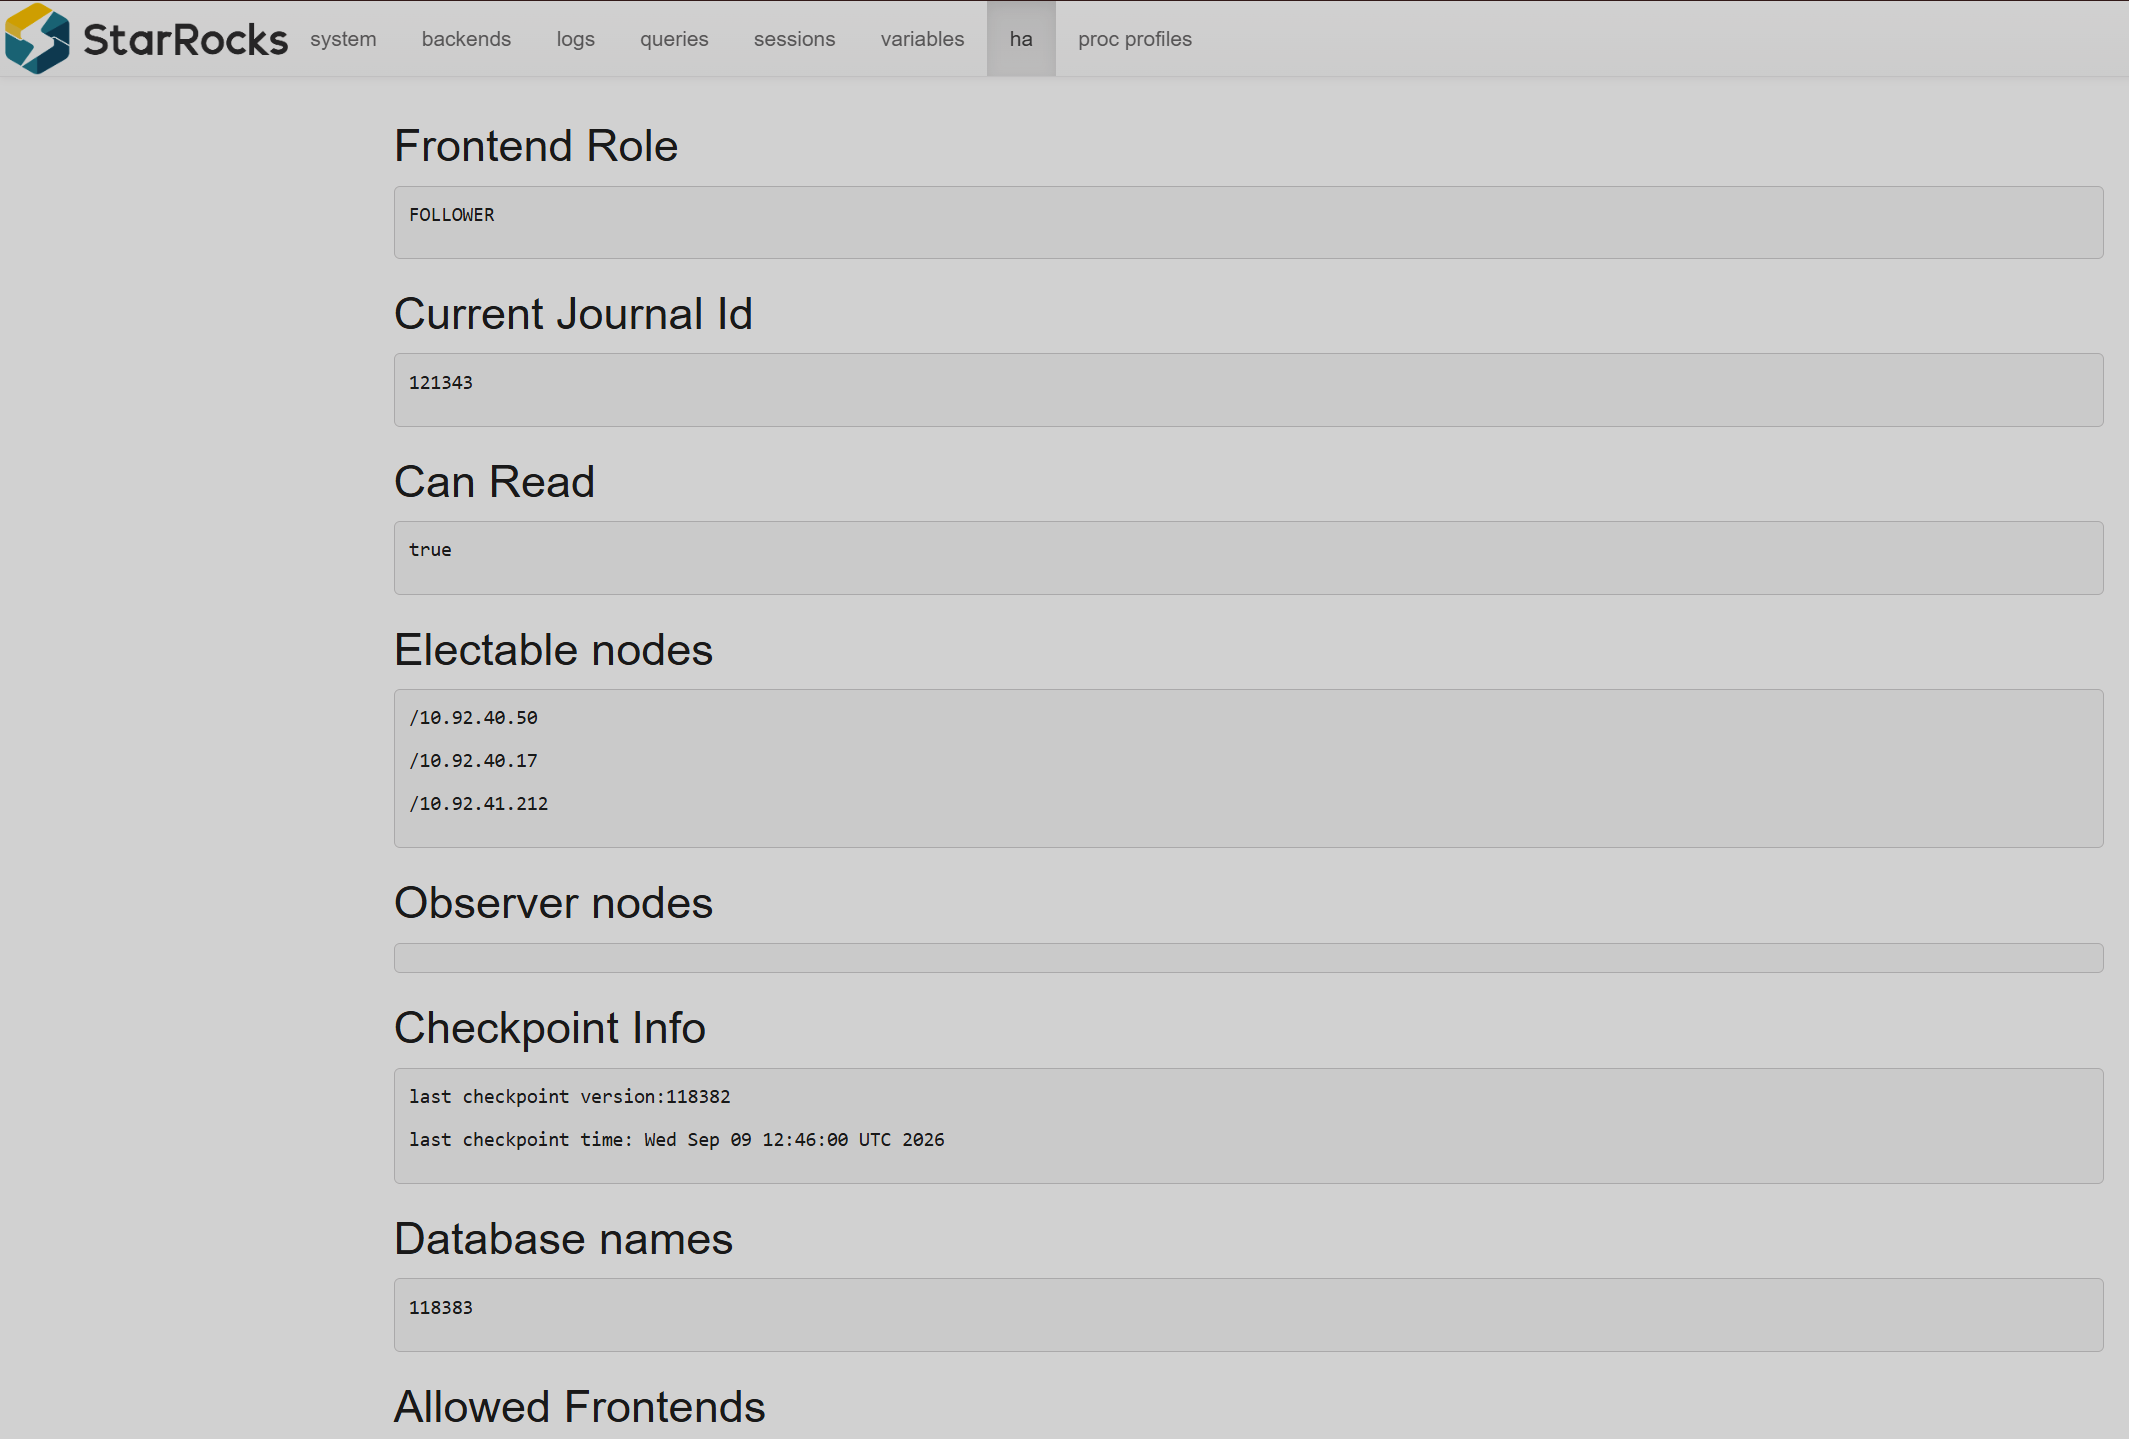
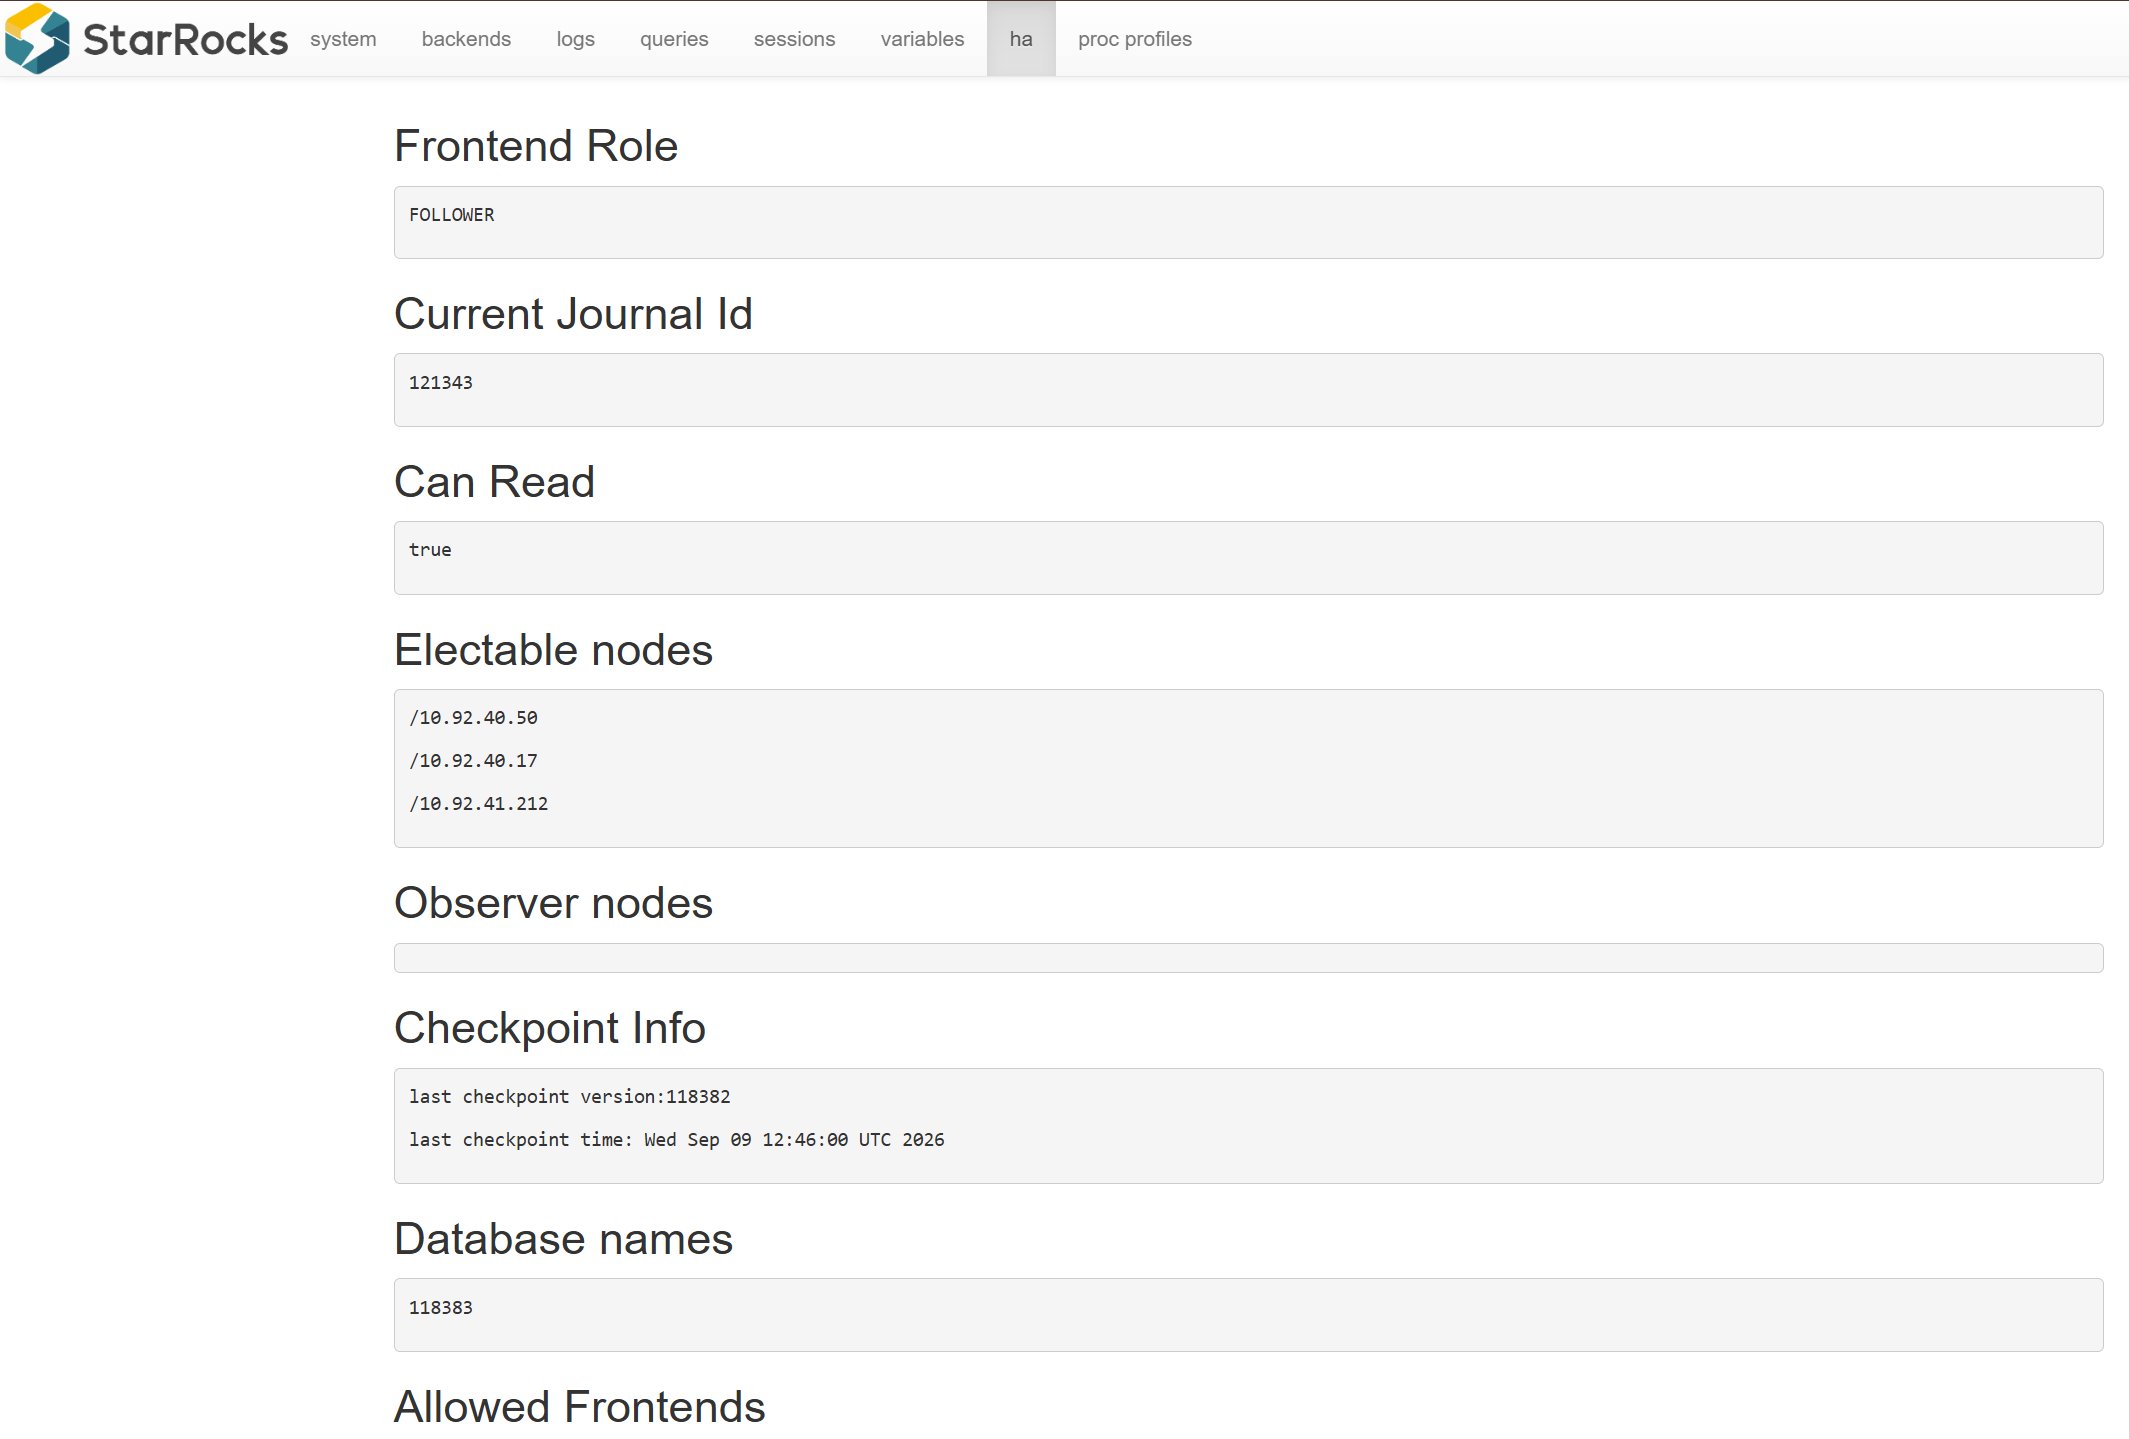
The HA tab provides information about the high-availability state of the StarRocks FE layer.
It displays information about the FE address, HTTP port, query port, role, liveness, heartbeat information, and version.
The FE nodes can have the following roles:
-
LEADER— the active FE responsible for metadata write operations; -
FOLLOWER— an FE that participates in metadata synchronization and elections; -
OBSERVER— an FE that synchronizes metadata but does not participate in elections.
You can also use the SHOW FRONTENDS; statement to view the current state of FE nodes.
Proc profiles
The Proc profiles tab provides process-level performance profiles for StarRocks. It can therefore reveal resource consumption caused by background tasks, metadata processing, synchronization, and other internal operations.
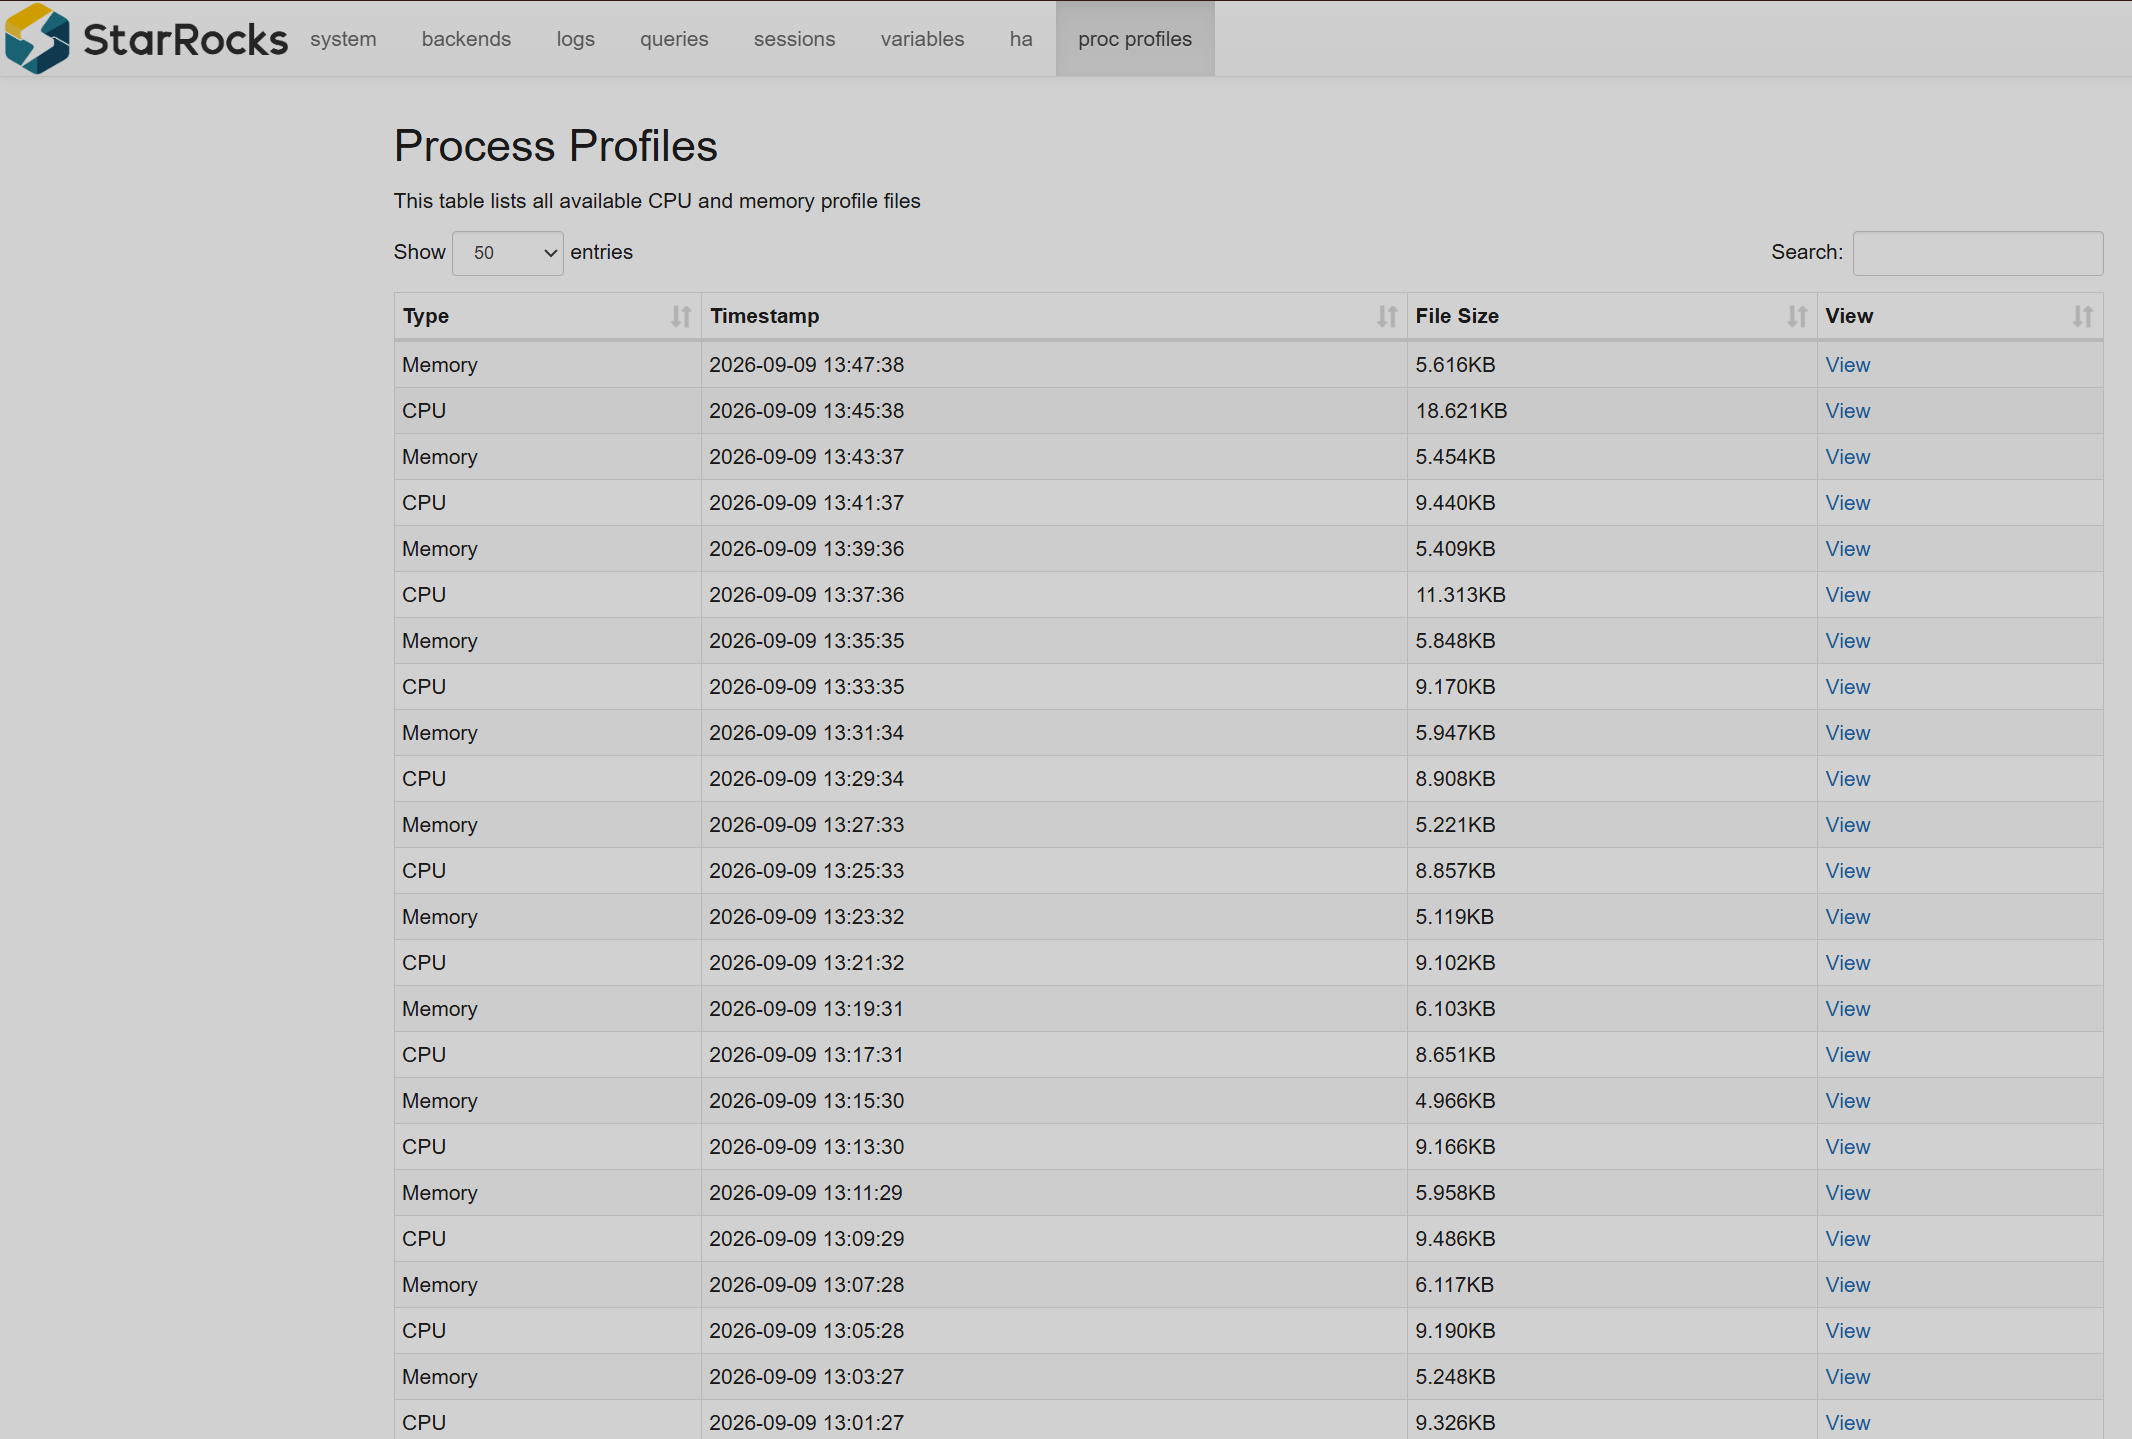
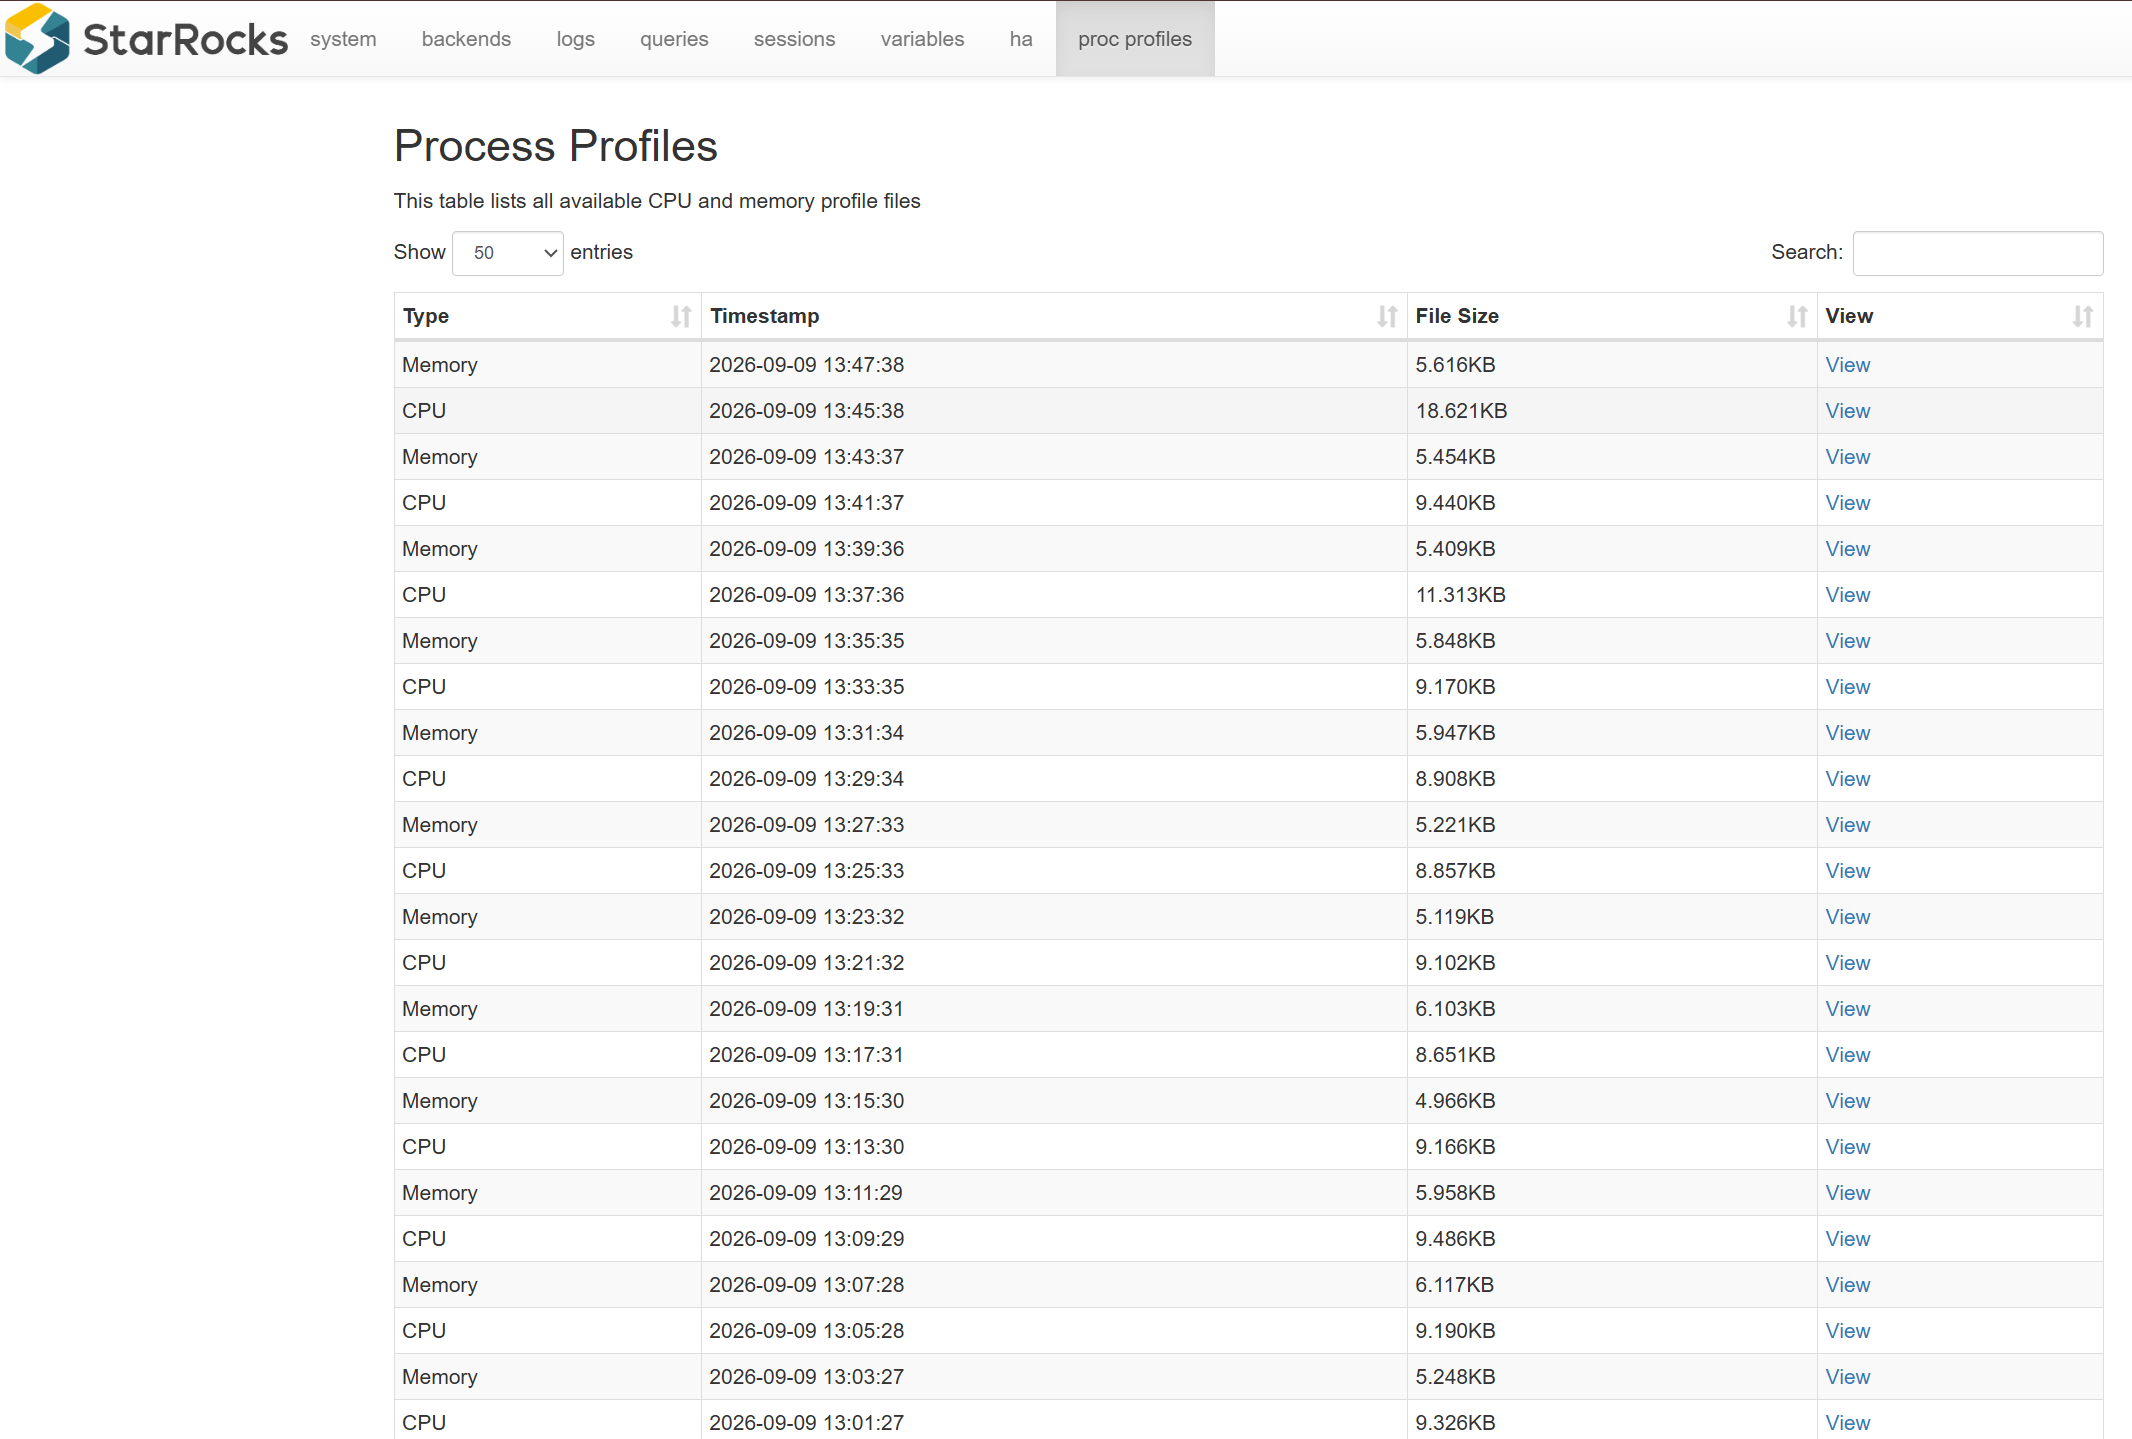
Process profiles can provide flame graphs for CPU and memory allocation. A flame graph represents the call hierarchy of a process and shows the relative amount of resource consumption associated with individual functions or call paths.
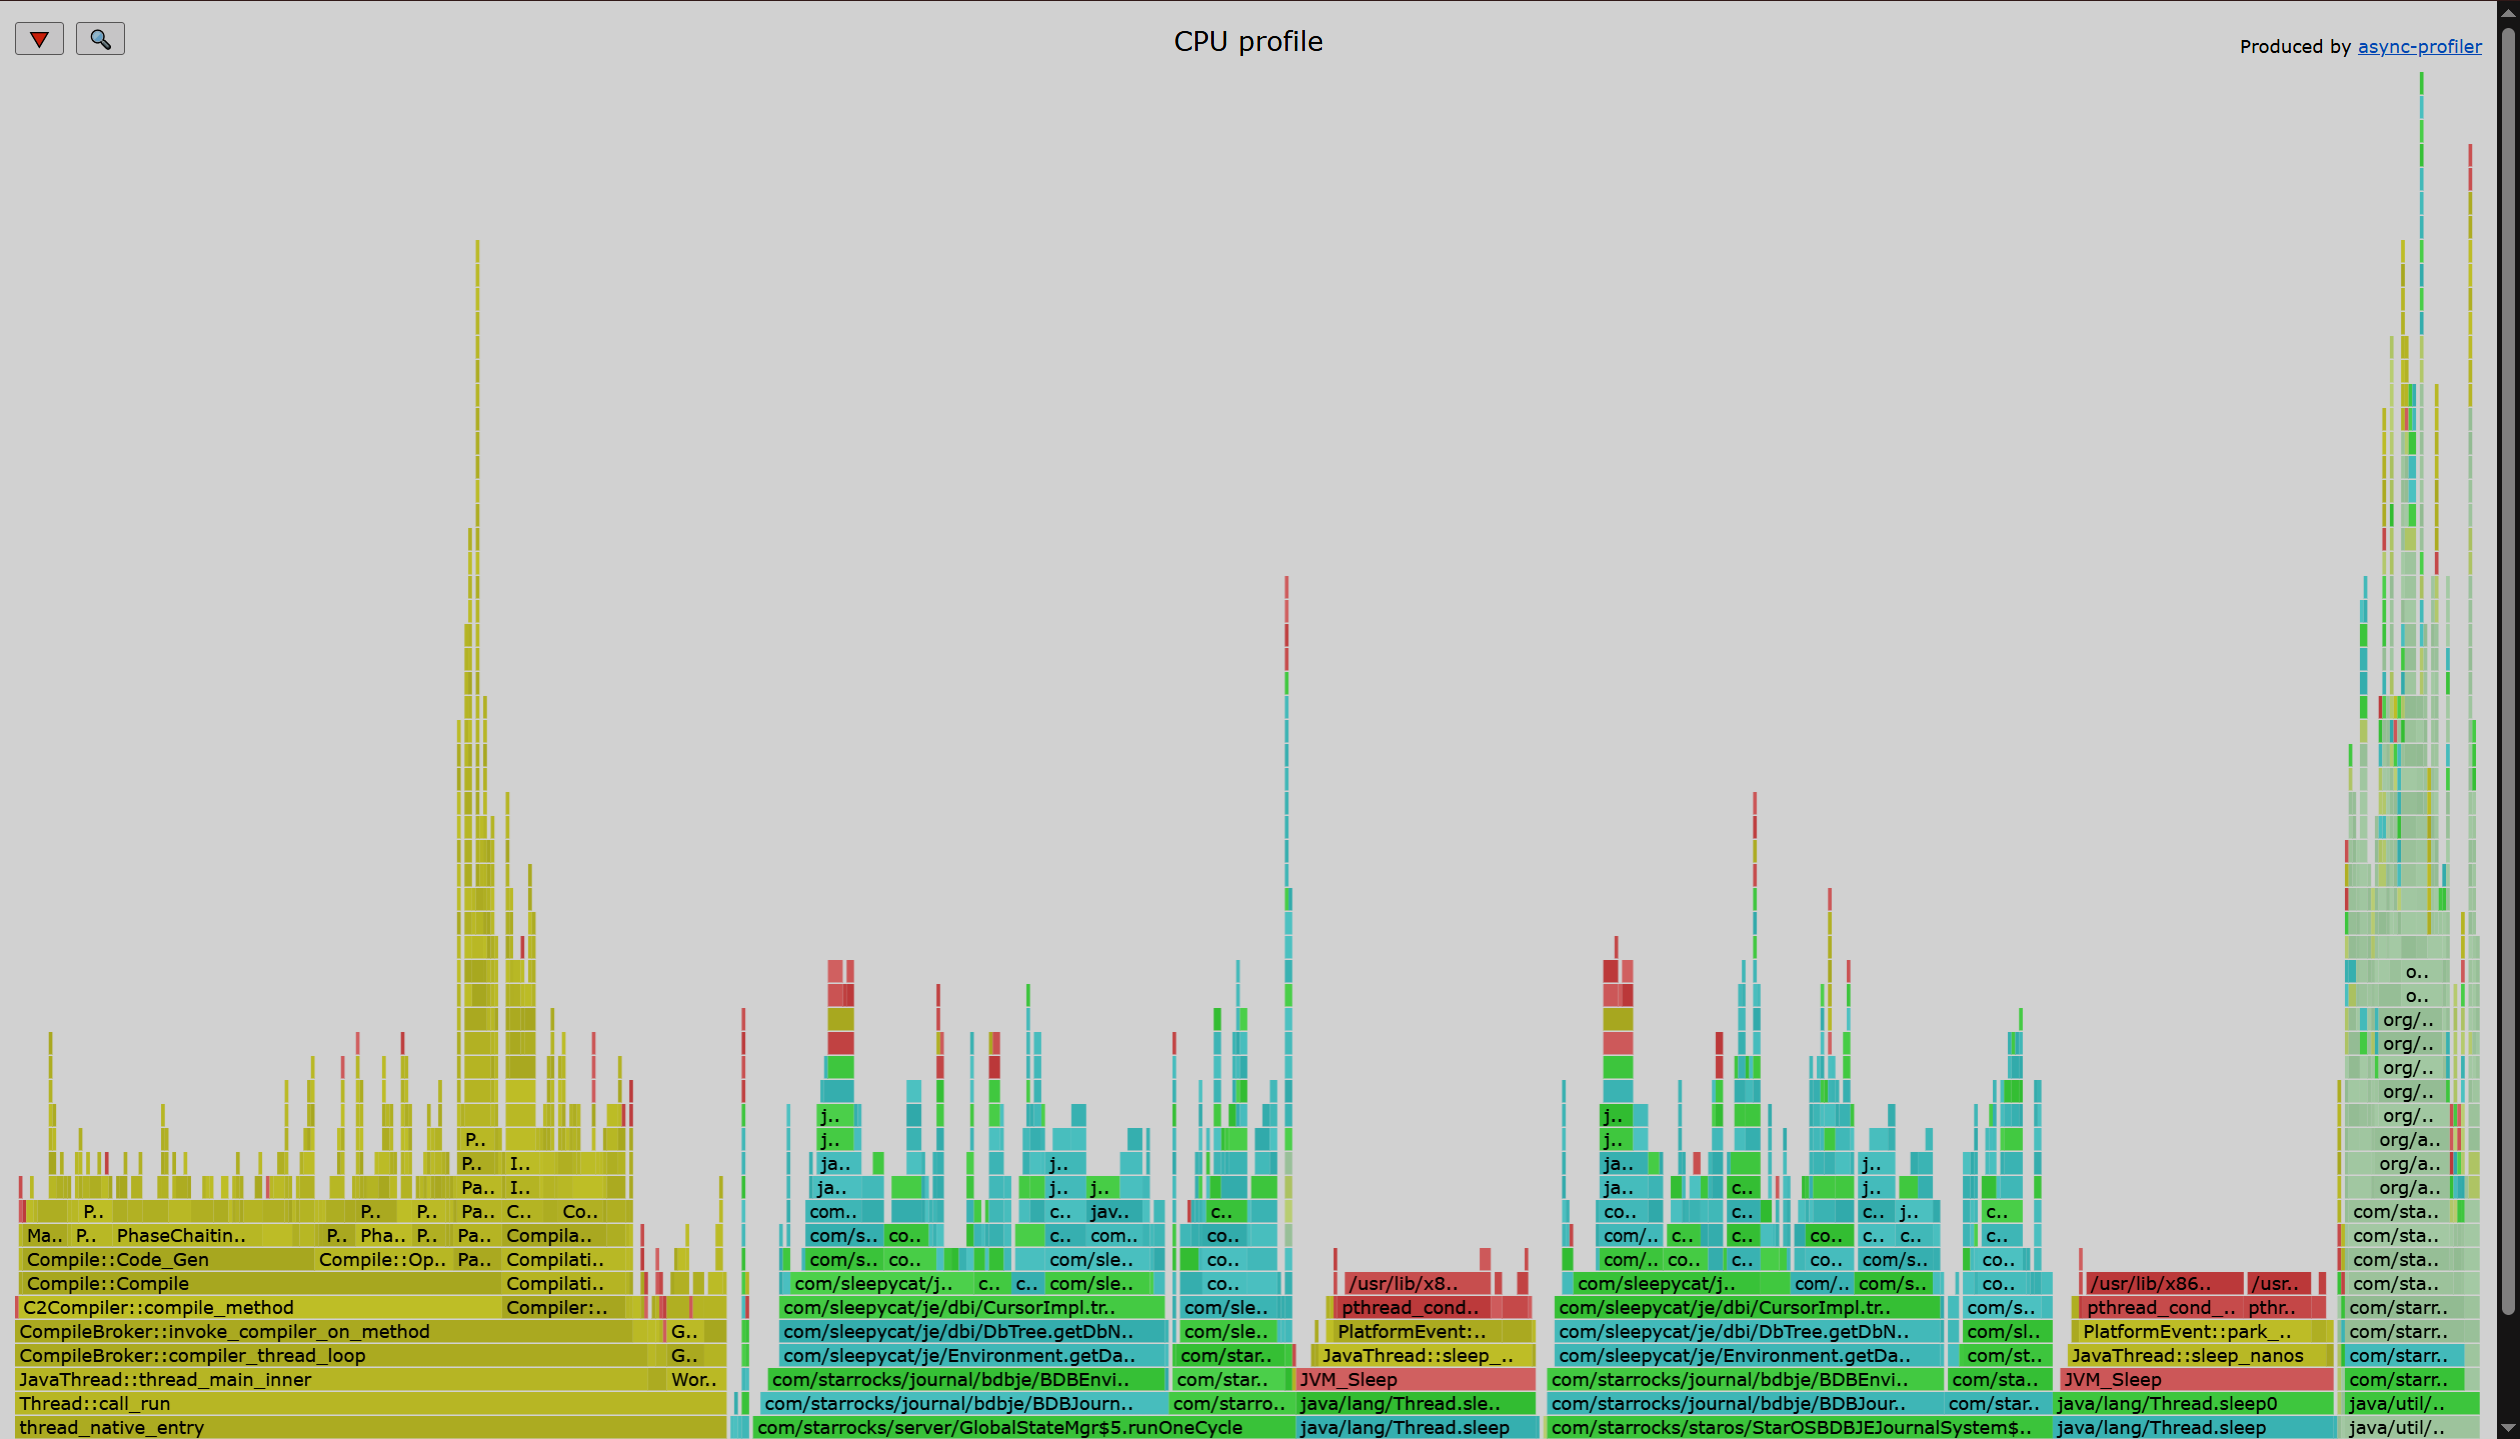
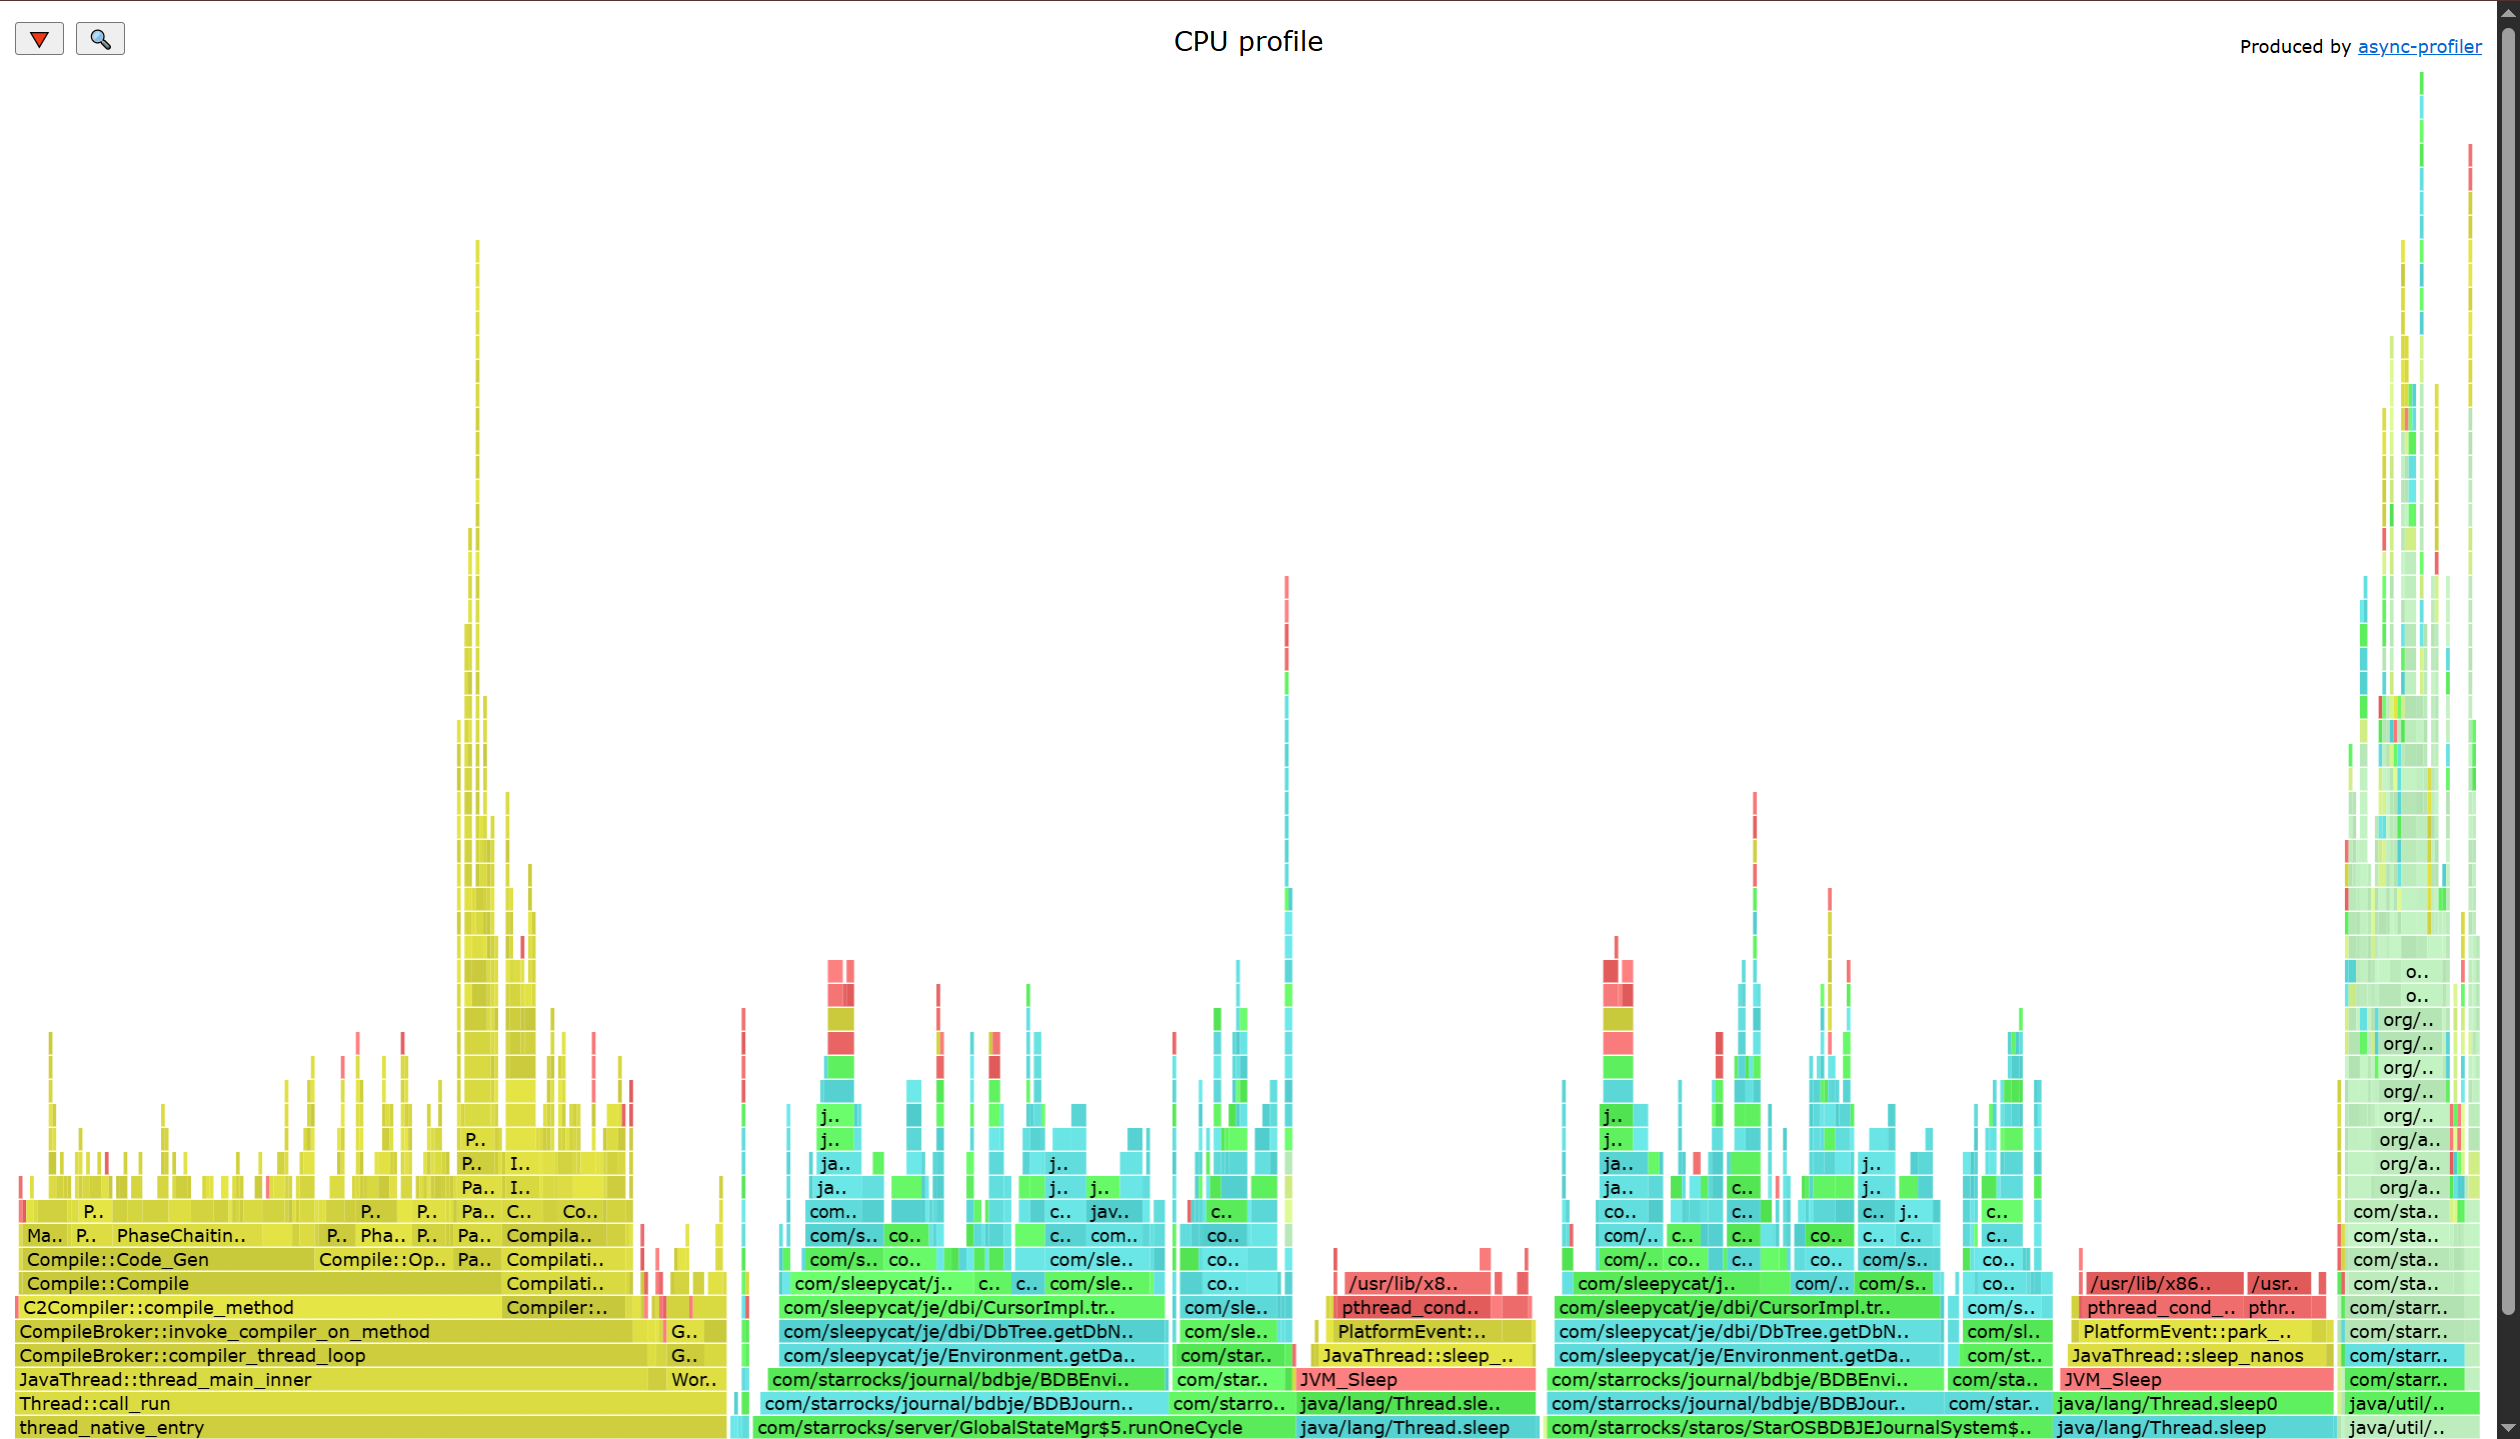
The tab can be used for:
-
CPU load analysis;
-
memory allocation analysis;
-
investigation of high resource consumption;
-
analysis of complex runtime problems;
-
investigation of performance regressions.
Security considerations
The web UI provides access to operational information about the StarRocks cluster and should be protected from unauthorized access. Restrict access to the FE HTTP port to trusted networks and authorized administrators. Use the authentication and access-control mechanisms configured for the StarRocks deployment.