

Monitoring architecture in ADH
Overview
Monitoring is an ADH service designed to collect, store, and visualize cluster and service-specific metrics. It provides a single pane of glass to monitor the health, performance, and resource utilization of all nodes and cluster components.
The ADH Monitoring service is built on a popular open-source software stack:
-
Prometheus. A monitoring and alerting system that collects and stores metrics from applications and infrastructure.
-
Grafana. A visualization and monitoring platform for visualizing metrics received from various data sources.
-
Metric exporters. Lightweight agents responsible for sharing kernel-level and service-specific metrics with Prometheus.
Key principles of ADH Monitoring:
-
Centralized collection. Prometheus acts as a central hub for collection and storage of metrics.
-
Decentralized data sources. Metric exporters work as part of the corresponding ADH service (for example, there are exporters for HDFS, YARN, Zookeeper, etc.). The Monitoring server pulls metrics from the exporters.
-
Ready-made dashboards. The service includes preconfigured informative Grafana dashboards for key ADH services.
-
Scalability. A flexible architecture allows you to define new metrics to be reported and build custom dashboards without having to wait for a new release.
Components
The service architecture is a classic implementation of the Grafana/Prometheus stack that includes the following components deployed on one or more monitoring servers.


|
NOTE
Although it is acceptable to install Monitoring components on ADH hosts along with other ADH services, in production, it is recommended to allocate a dedicated ADH host for Monitoring components.
|
The main components of the Monitoring service are described below.
Prometheus
Prometheus is the backbone of the Monitoring service, an open-source monitoring and notification system. It is responsible for collecting, storing, and processing metrics.
Key features:
-
Multidisciplinary data model. Metrics are identified by a name and a set of key/value pairs (labels).
-
HTTP pull model. Prometheus pulls metrics from target endpoints over HTTP.
-
Powerful PromQL query language. Allows running complex aggregations and metrics analysis.
-
ADH configuration. The Prometheus distribution that comes with the Monitoring service is preconfigured to collect metrics from main ADH services and Node Exporters.
Grafana
Grafana is an open-source analytics and monitoring platform designed for data visualization. It is responsible for visualization of metrics stored in Prometheus through informative dashboards.
Key features:
-
Support for multiple data sources. Grafana can work not only with Prometheus but also with other sources of metrics.
-
Rich visualization features. It provides preconfigured graphs, charts, tables, heatmaps, etc.
-
Interactive dashboards. Allows you to create dynamic dashboards with variables and switches.
-
Rich customization options. You can edit provided dashboards and create new that suit your needs.
-
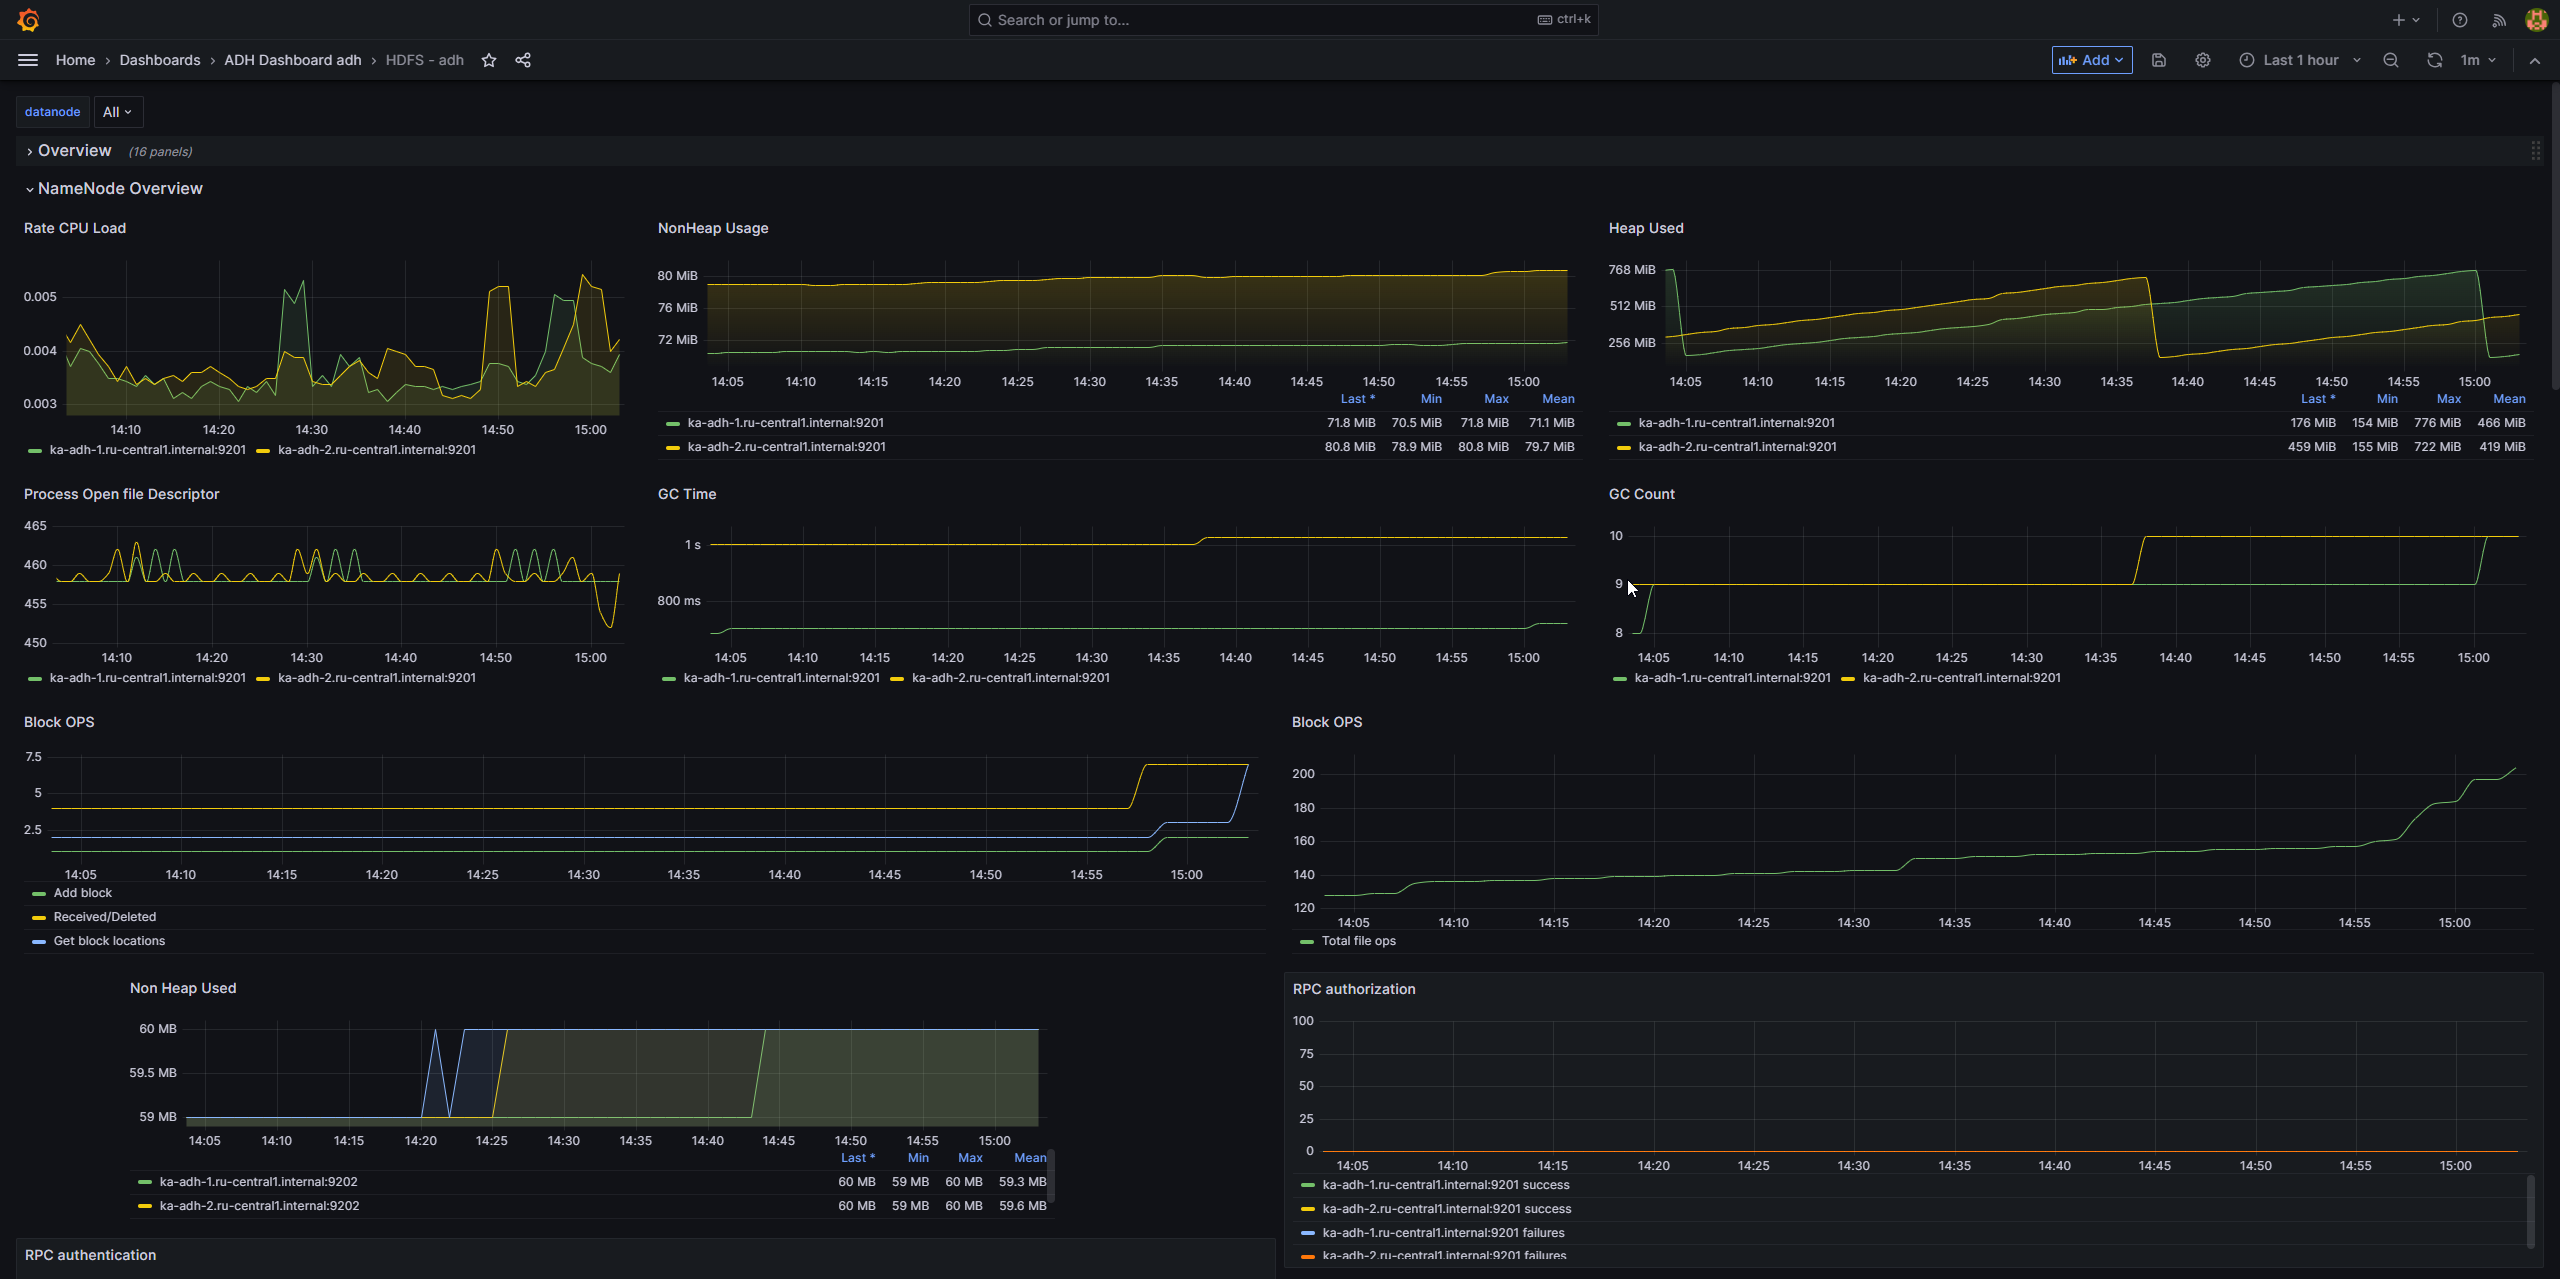
ADH configuration. The Grafana distribution bundled with ADH includes a set of preconfigured dashboards for monitoring key services (HDFS, YARN, Zookeeper, etc.), as well as dashboards for monitoring the state of ADH hosts.
Grafana web UI is presented below. The up-to-date web UI link is available in ADCM (Services → Monitoring → Info).
Node Exporter
Node Exporter is the official Prometheus exporter for collecting hardware and operating system metrics. Node Exporters run on every host of an ADH cluster as tiny agents and report kernel-level metrics.
Key features:
-
Collecting OS metrics. Node Exporter provides metrics on CPU usage, memory, disk I/O, disk space usage, network traffic, and many more.
-
API access. Serves metrics to external systems through an HTTP endpoint.
-
Extensibility. You can configure a Node Exporter to collect specific metrics by using pluggable collectors.
-
Deployment in ADH. Node Exporters run as system daemons on each node of the ADH cluster, ensuring uniformity in the collection of host metrics.
Service exporters
A service exporter is an agent that works as part of an ADH service (HDFS, YARN, Hive, etc.) and is responsible for providing the metrics specific to that service in a Prometheus-compatible format. Some ADH services come with a JMX exporter, which shares metrics directly from the service JVM via JMX. Other services share metrics through a fixed HTTP endpoint.
Unlike Node Exporters, service exporters are not part of the Monitoring service, but are critical to its operation. Service exporters are installed and configured automatically when an ADH service is added to a cluster. For example, when installing HDFS NameNode/DataNode components, HDFS exporter is deployed and configured too.
|
NOTE
After adding a new ADH service, the Monitoring service needs to restart to get metrics from the new service.
|
Below is a list of preconfigured exporters for ADH services.
| ADH service | Exporter type | Configuration location (ADCM) |
|---|---|---|
HDFS |
jmx-exporter |
The Monitoring configuration group for DataNode, JournalNode, and NameNode service components |
Ozone |
Exposes metrics in the Prometheus format through a REST endpoint |
Services → Ozone → Primary Configuration → ozone-site.xml → hdds.prometheus.endpoint.enabled |
Impala |
Exposes a custom HTTP endpoint (/metrics_prometheus) with metrics in the Prometheus format |
— |
Trino |
jmx-exporter |
The Monitoring configuration group for each component of the service |
Hive |
jmx-exporter |
The Monitoring configuration group for Hive HiveServer2 and Hive Metastore components of the service |
YARN |
jmx-exporter |
The Monitoring configuration group for Node Manager and Resource Manager components of the service |
HUE |
Exposes a custom HTTP endpoint with metrics in the Prometheus format |
Services → HUE → Components → HUE Server → Primary Configuration → hue.ini → desktop.enable_prometheus |
Zeppelin |
Exposes a custom HTTP endpoint with metrics in the Prometheus format |
Services → Zeppelin → Primary Configuration → zeppelin-site.xml → zeppelin.metric.enable.prometheus |
HBase |
jmx-exporter |
The Monitoring configuration group for each component of the service |
Solr |
solr-exporter |
All exporter settings are located on the Solr prometheus exporter component |
Kyuubi |
Exposes a custom HTTP endpoint with metrics in the Prometheus format |
The following parameters are available in Services → Kyuubi → Components → Kyuubi Server → kyuubi-defaults.conf:
|
Zookeeper |
Exposes a custom HTTP endpoint with metrics in the Prometheus format |
The following parameters are available in Services → Zookeeper → Primary configuration → zoo.cfg:
|
Workflow details
-
Node Exporters run on every physical or virtual node of an ADH cluster and collect OS metrics (CPU, RAM, disk and network I/O).
-
On every ADH host where ADH services are running, the corresponding service exporters are launched (for example, a JMX exporter for the HDFS DataNode component).
-
Prometheus, which is running on a dedicated host, periodically polls (scrapes) all metrics exporters by sending HTTP requests to their endpoints (for example, http://<ADH_host_name>>:9100/metrics for Node Exporter).
-
Prometheus receives metrics in a text format, encodes and stores them in a database on a local disk.
-
Grafana connects to the Prometheus API to receive and visualize metrics data.
-
Visualized metrics are presented to the end user in the form of informative dashboards in Grafana web UI.
Usage recommendations
For better stability and performance of the Monitoring service, consider the following recommendations:
-
Separation of roles. To increase fault tolerance and improve the performance in large clusters, it is recommended to install the Monitoring service on dedicated ADH nodes that do not host main computing services.
-
Setting up alerts. Use the built-in Prometheus Alertmanager to set up alert rules. You can integrate alerts with popular notification channels like email, Slack, etc. to quickly react to incidents. These components are not included in the ADH distribution and require a standalone configuration.
-
Storage Management. Keep track of the amount of disk space allocated for Prometheus data storage. Set up retention policies to meet your requirements on the size of the metrics stored.
-
Customization of dashboards. By using preconfigured Grafana dashboards bundled with ADH as a base, you can create custom dashboards to monitor specific parameters, which are critical for your workloads and business processes.
-
Track the Monitoring service health. Do not forget to monitor the health and performance of the Monitoring service. For this, you can use metrics that Prometheus collects about itself.
-
Service configuration. When changing the configuration of service exporters (adding new ADH services, changing service topologies, etc.), it is mandatory to restart the Monitoring service to apply the new configuration.