ADB monitoring metrics
- Overview
- View metrics in Prometheus
- Grafana dashboards
- Open Grafana
- Greengage - Backup Monitoring (gpbackup)
- Greengage - Cluster Overview
- Greengage - Database Health
- Greengage - Exporter Monitoring
- Greengage - Host & Resource Group Resources
- Greengage - Query Performance
- Greengage - Replication & Segments
- Node Exporter statistics
- Process exporter metrics
- PXF Service Dashboard
This article describes metrics for monitoring an ADB cluster. For information on how to install monitoring, refer to Install monitoring.
Overview
The Monitoring service consists of the following components:
-
Node Exporter — exposes hardware- and OS-related metrics, such as memory and CPU usage or filesystem space. These metrics are available on the port and endpoint specified in the Node Exporter settings section of the Monitoring service configuration (
11203/metricsby default). -
Process Exporter — collects metrics for the specified processes. In ADB, these are the processes related to ADBM and ADB Control agents. The Process Exporter metrics are available on the port specified in the Process exporter settings section of the Monitoring service configuration (
9256by default). The Process Exporter component is available in the Enterprise edition of ADB. -
Greengage Exporter — collects cluster- and database-related metrics, such as segment health or active connections. These metrics are available on the port and endpoint specified in the Greengage Exporter settings section of the Monitoring service configuration (
9080/metricsby default). -
Prometheus — scrapes and stores metrics from the configured data sources: Node Exporter, Process Exporter, and Greengage Exporter. These metrics are available in the Prometheus web interface on the port specified in the Prometheus settings section of the Monitoring service configuration (
11200by default). -
Grafana — uses Prometheus as a data source and visualizes its metrics as graphs and charts organized into dashboards. These dashboards are available in the Grafana web interface on the port specified in the Grafana settings section of the Monitoring service configuration (
11210by default).
Additionally, the PXF service exposes built-in Prometheus metrics.
They provide information about active read and write operations, fragment processing, the number of records and bytes transferred, as well as JVM and Tomcat metrics.
On each host where PXF is installed, these metrics are available on port 5888 and endpoint /actuator/prometheus, for example, 192.0.2.5:5888/actuator/prometheus.
ADB configures a Prometheus server to scrape these metrics and provides the PXF Service Dashboard in Grafana for their visualization.
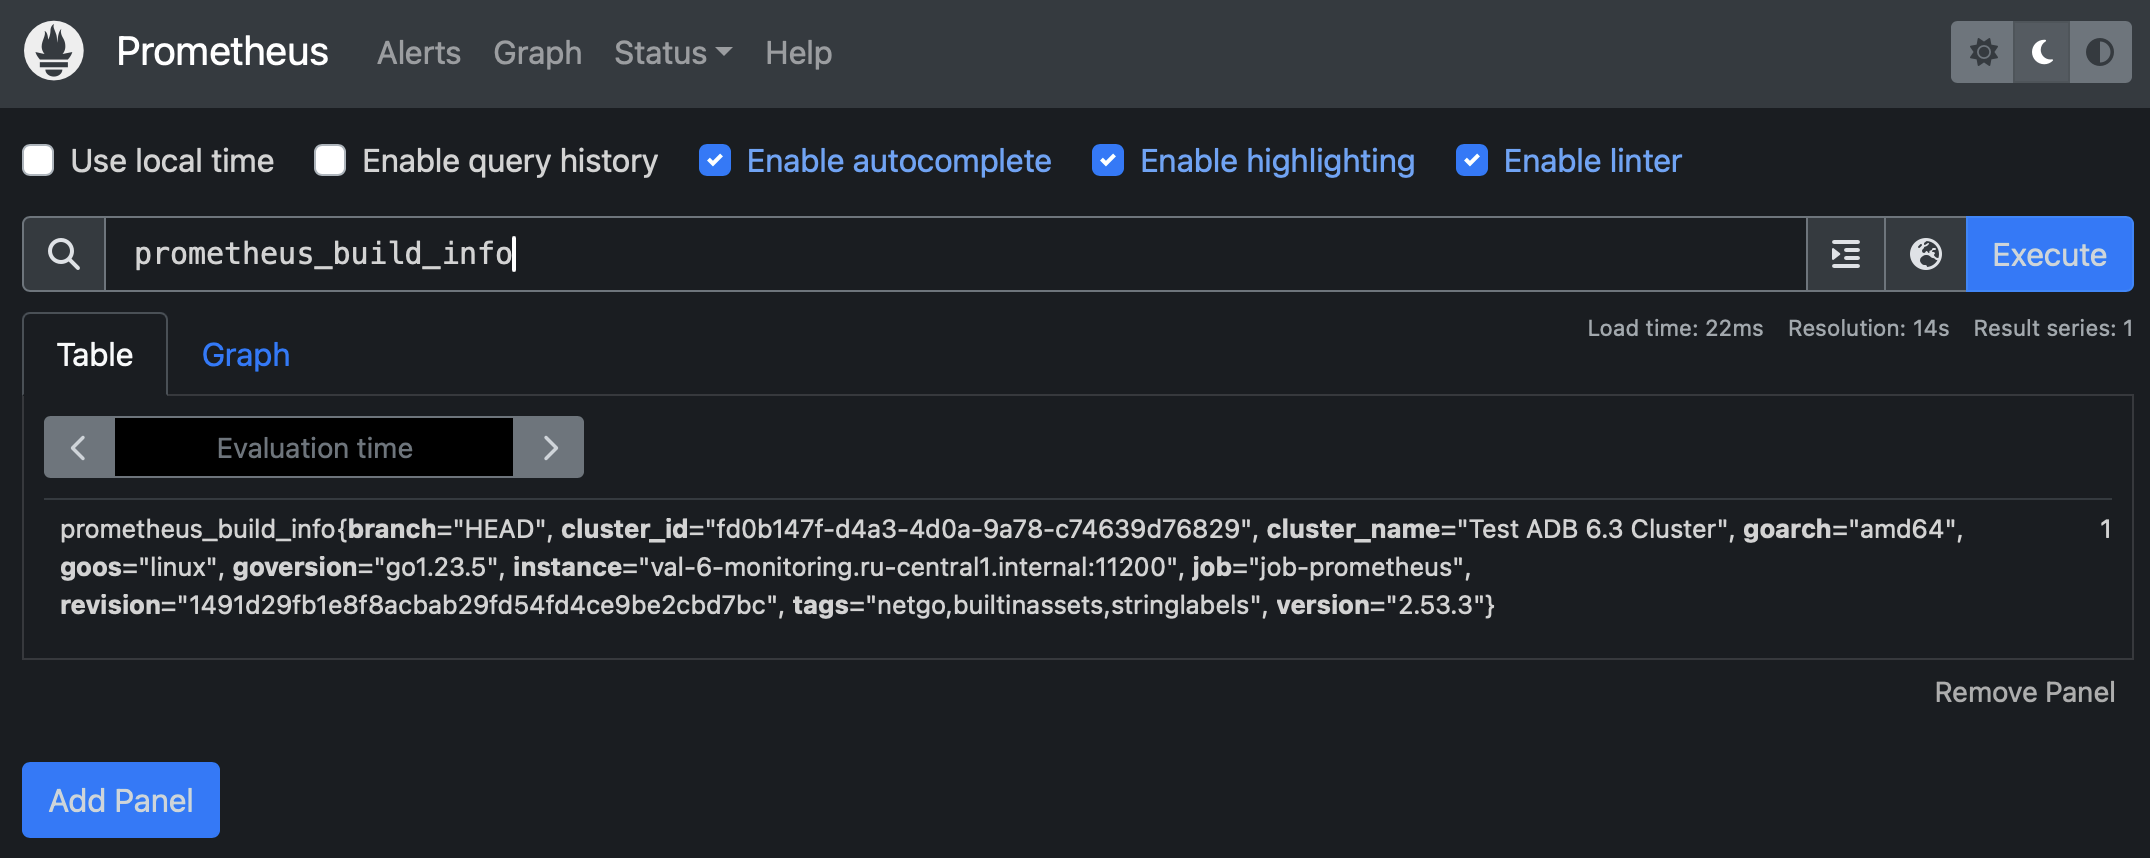
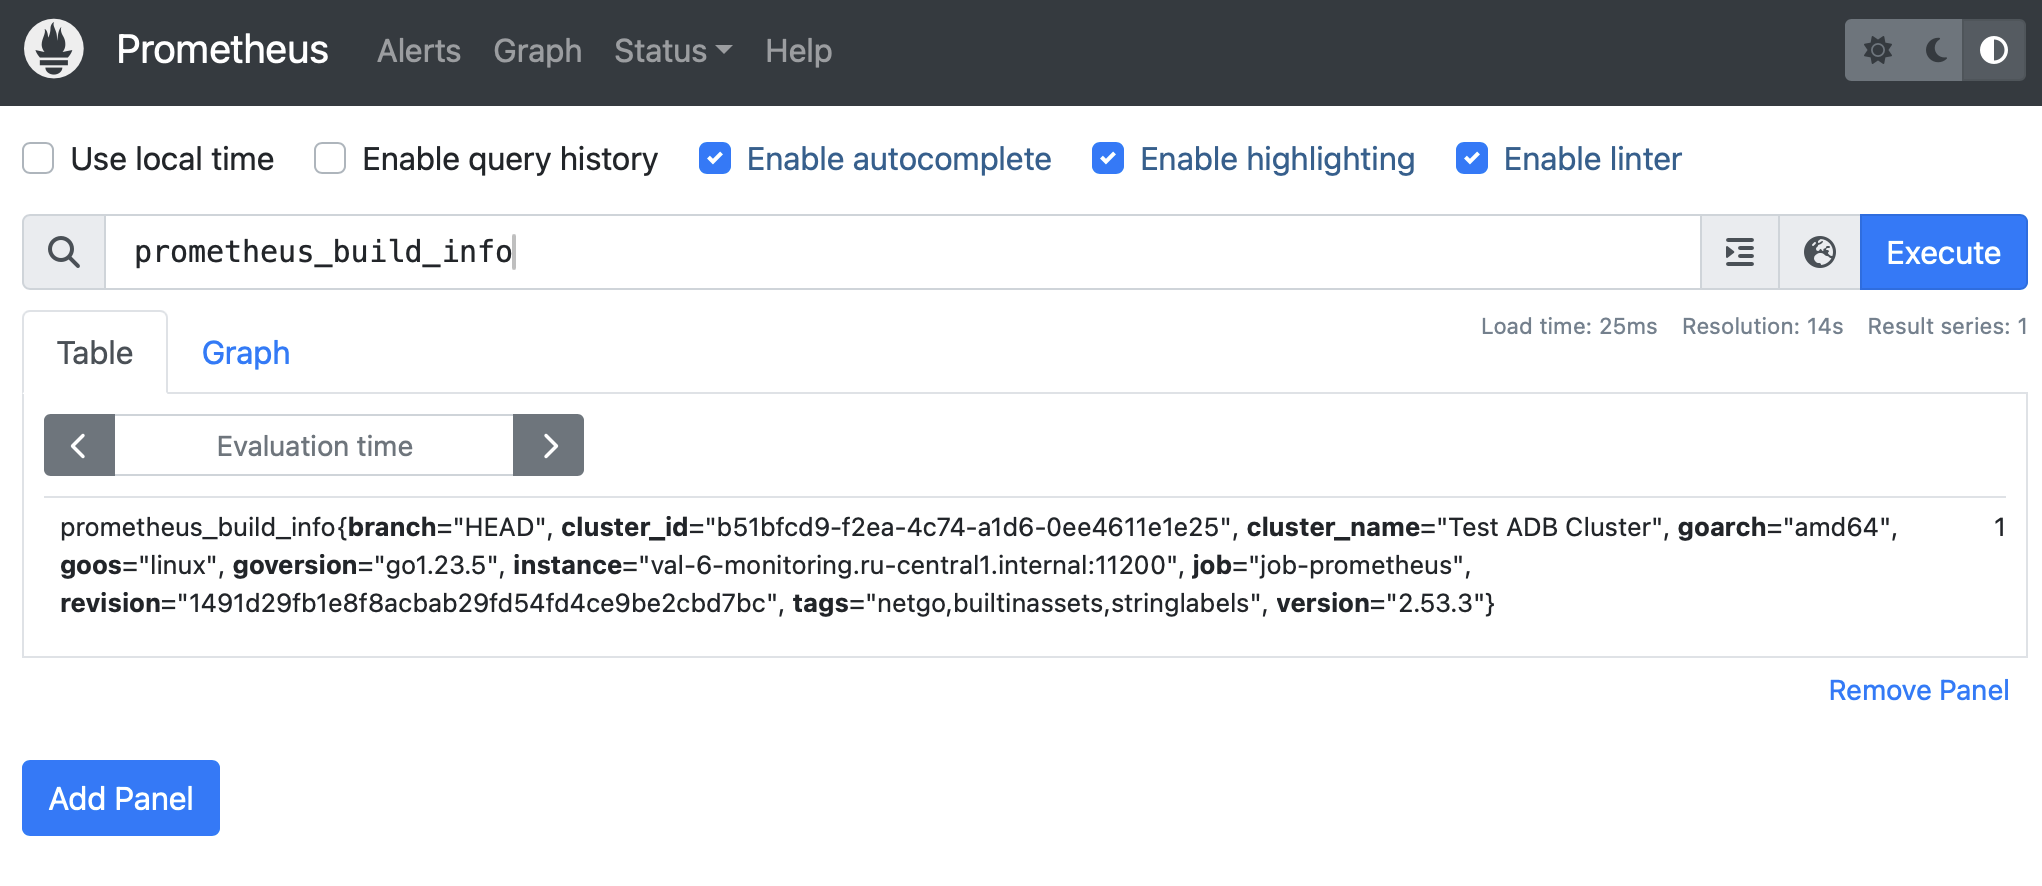
View metrics in Prometheus
Prometheus is a monitoring and alerting toolkit. Prometheus collects metrics from exporters, and Grafana sends requests to Prometheus to collect data for its dashboards. If Grafana dashboards show empty panels or unexpected values, checking Prometheus helps determine whether the issue is related to metric collection or dashboard configuration:
-
In your browser, enter
<IP address of monitoring server>:<port>. The default port is11200, and it can be changed in the Prometheus settings section in the Monitoring service configuration.The IP address, port, and hostname of Prometheus are also available on the Info tab of the Monitoring service.
-
In the window that opens, enter the user name and the password that you have configured in the Prometheus users to login/logout to Prometheus field in the Monitoring service configuration.
In the Prometheus web interface, you can check its configuration and the state of the exporters (on the Targets page). You can also use the Prometheus Query Language (PromQL) to check specific metrics.
Grafana dashboards
Grafana allows you to visualize metrics stored in Prometheus, create your own dashboards, or modify existing ones.
Open Grafana
-
In your browser, enter
<IP address of monitoring server>:<port>. The default port is11210, and it can be changed in the Grafana settings section in the Monitoring service configuration.The IP address, port, and hostname of Grafana are also available on the Info tab of the Monitoring service.
-
In the window that opens, in the Email or username field, enter
adminand in the Password field enter the password that you have configured in the Grafana administrator’s password field in the Monitoring service configuration.
By default, the following dashboards are available in Grafana:
|
NOTE
If your cluster has a standby master, its metrics work as follows:
|
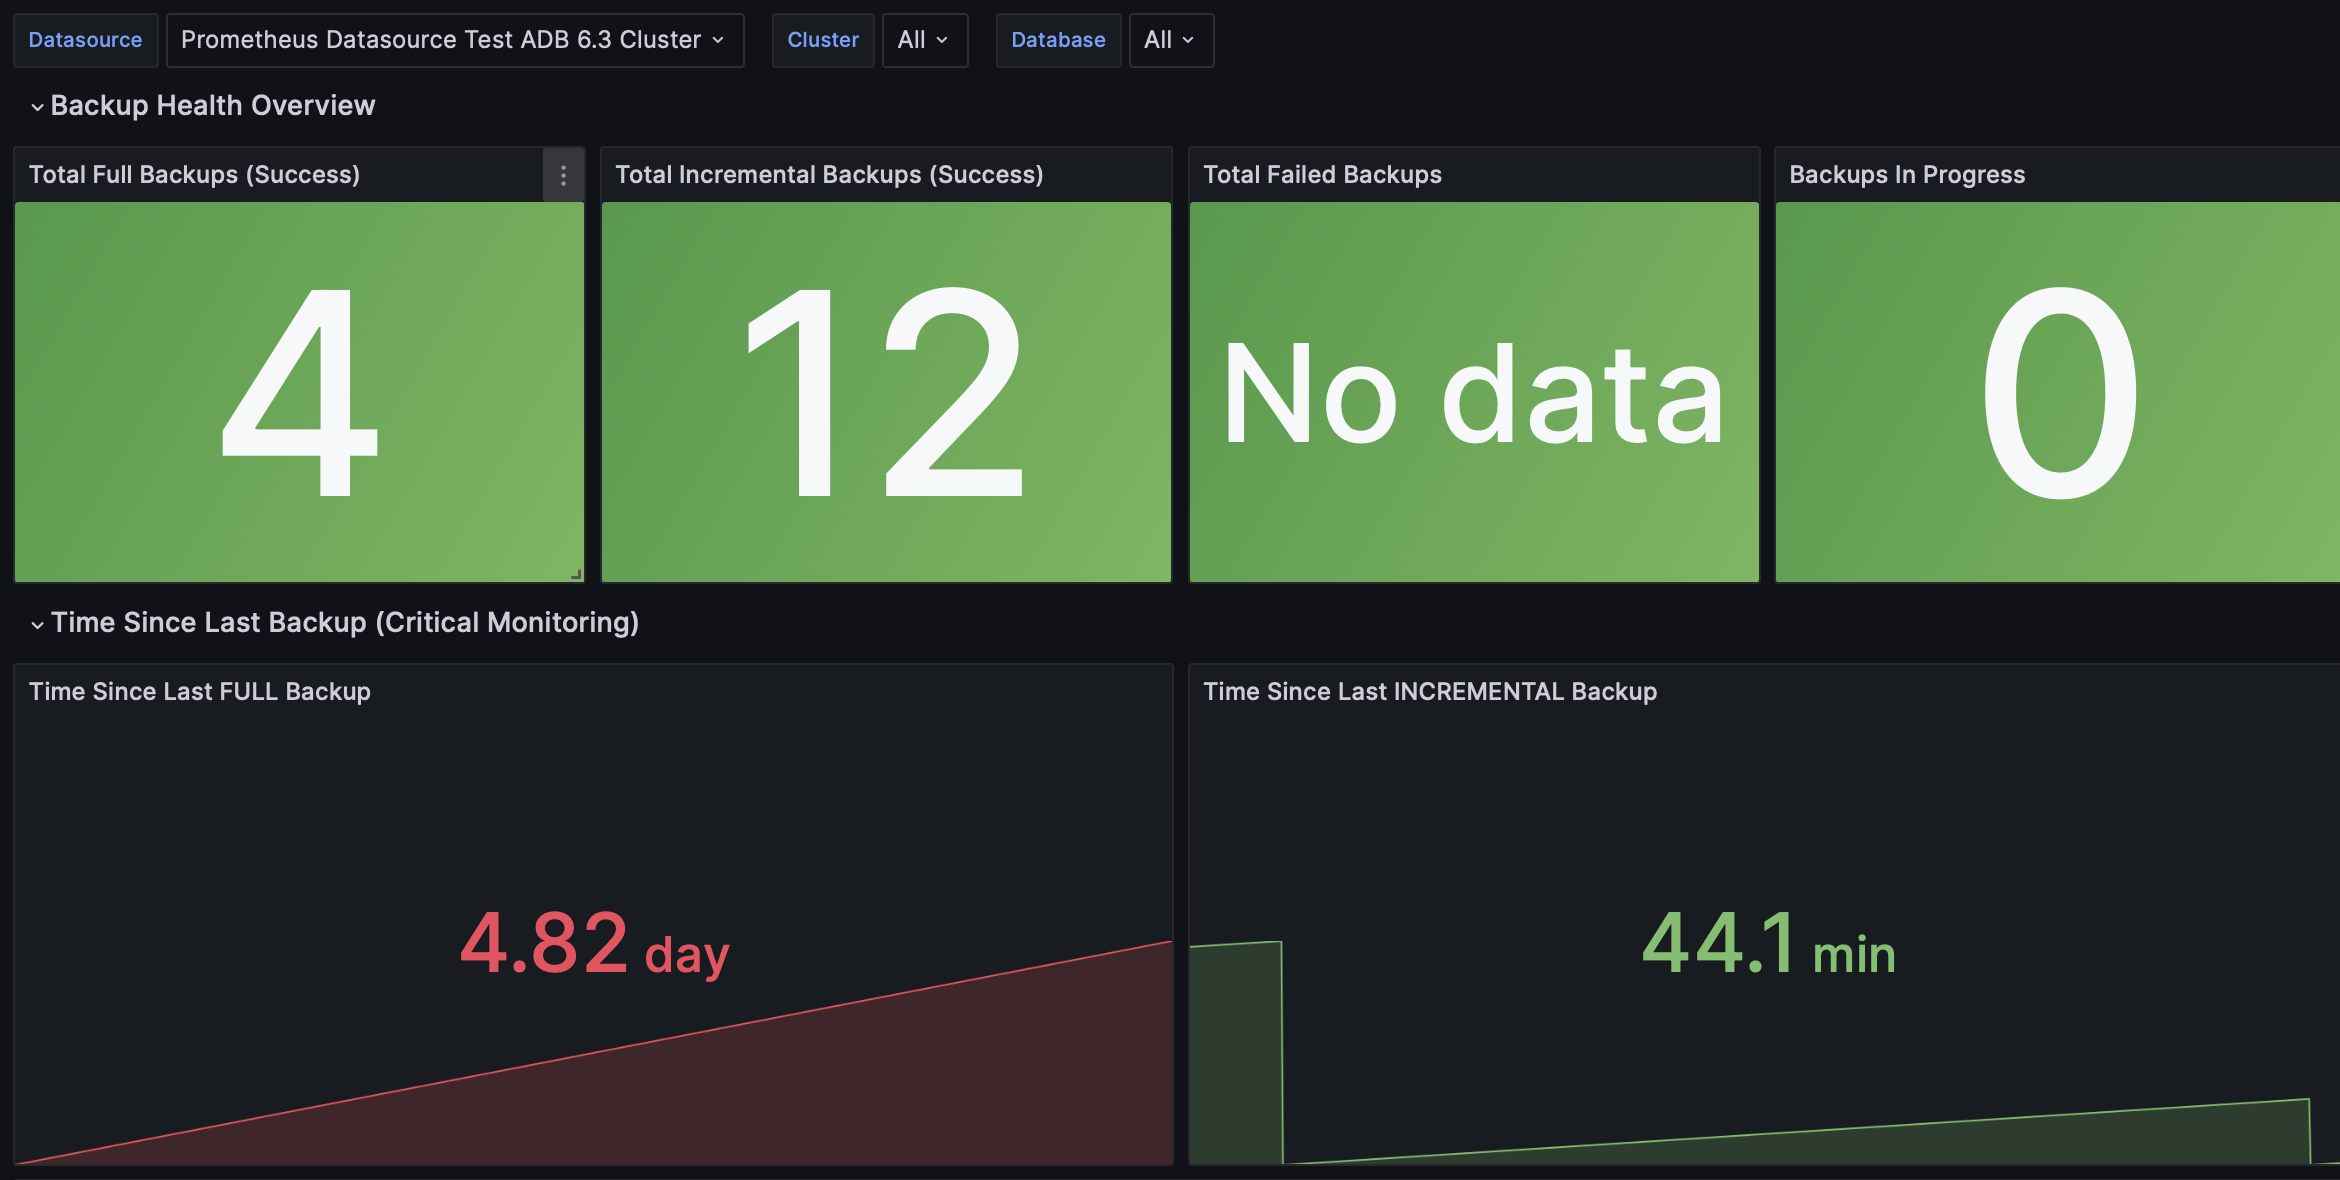
Greengage - Backup Monitoring (gpbackup)
This dashboard provides monitoring for ADB database backup operations using gpbackup. Greengage Exporter retrieves information about performed backups from the SQLite database located at $MASTER_DATA_DIRECTORY/gpbackup_history.db.
|
NOTE
By default, the gpbackup_history.db database does not exist.
It is created automatically when gpbackup is run for the first time.
|
| Panel name | Description |
|---|---|
Total Full Backups (Success) |
Total number of successful full backups across selected clusters and databases |
Total Incremental Backups (Success) |
Total number of successful incremental backups across selected clusters and databases |
Total Failed Backups |
Total number of failed backups across selected clusters and databases |
Backups In Progress |
Current number of backups in progress |
Time Since Last FULL Backup |
Time elapsed since the most recent successful full backup completion |
Time Since Last INCREMENTAL Backup |
Time elapsed since the most recent successful incremental backup completion |
Time Since Last Backup Over Time |
Time elapsed since the last backup completion for full and incremental backups per database |
Last Full Backup Duration |
Duration of the most recent successful full backup in seconds |
Last Incremental Backup Duration |
Duration of the most recent successful incremental backup in seconds |
Incremental vs Full Backup Time Ratio |
Ratio of the last incremental backup duration to the last full backup duration. Incremental backups are typically faster than full backups, so the ratio should ideally be below 100% |
Backup Duration Over Time |
Graph of backup durations for full and incremental backups per database |
Backup Type Distribution (Success) |
Shows the proportion of successful full versus incremental backups |
Backup Count Over Time (Stacked) |
Graph showing the count of successful full, successful incremental, and failed backups over time |
Backup Details Table |
The table lists backup counts per database, type (full/incremental), and status ( |
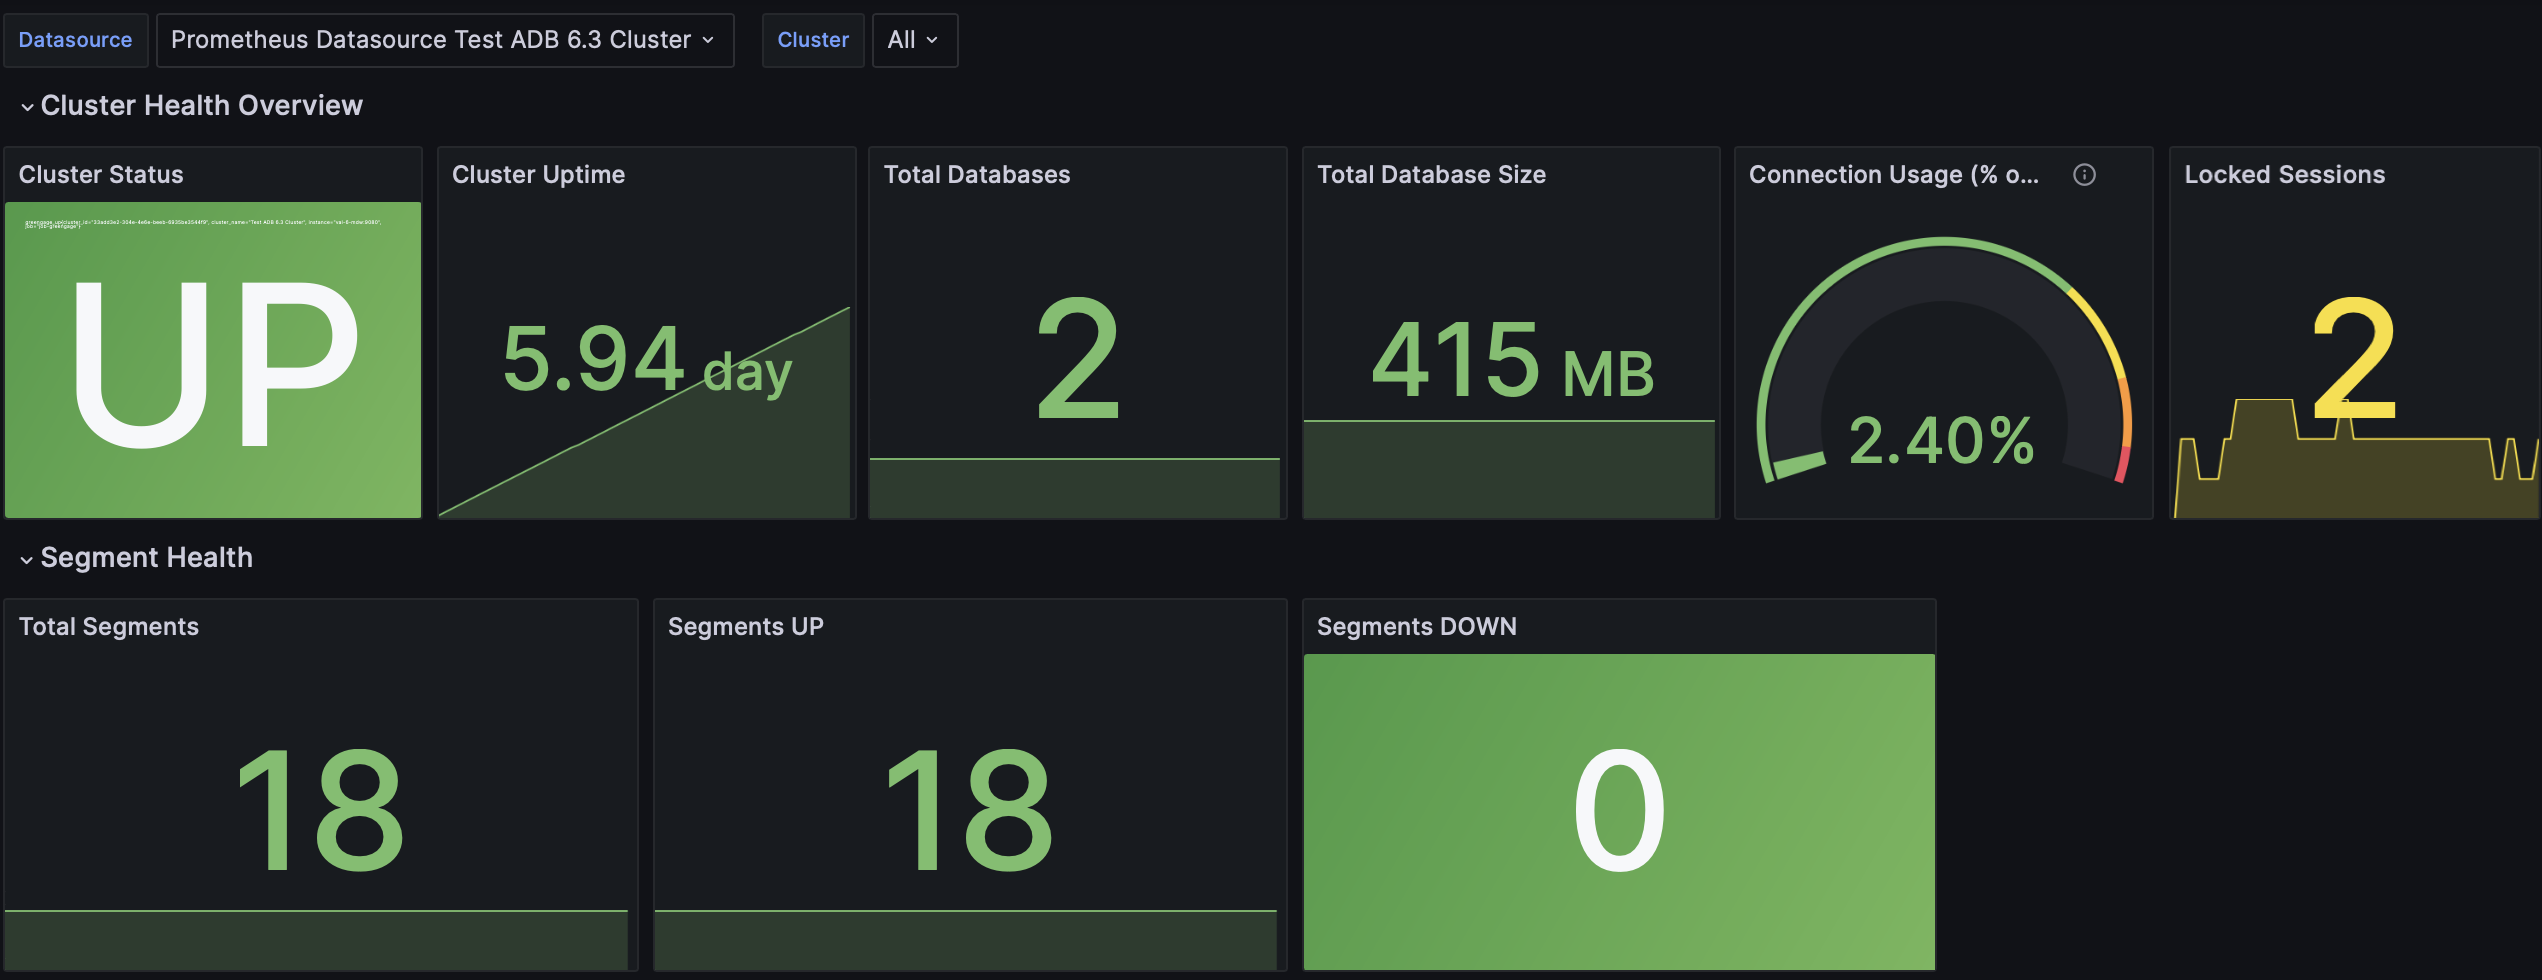
Greengage - Cluster Overview
This dashboard provides a view of your ADB cluster health and performance including cluster status, segment health, and connection usage.
| Panel name | Description |
|---|---|
Cluster Status |
Indicates whether the cluster is running and reachable ( |
Cluster Uptime |
Total uptime of the cluster since the last restart |
Total Databases |
Total number of databases present in the cluster |
Total Database Size |
Total size of all databases on the cluster |
Connection Usage (% of Max) |
Current connections as a percentage of the connection limit (defined in the max_connections server configuration parameter). Shows how close the cluster is to connection exhaustion |
Locked Sessions |
Number of sessions currently locked, indicating potential contention issues. To further analyze locks, see the Query Performance dashboard |
Total Segments |
Total number of segments (primary and mirror) configured in the cluster |
Segments UP |
Number of segments currently up and running |
Segments DOWN |
Number of segments currently down |
Segment Status by Host |
Graph showing the status ( |
Connections by State |
Graph showing the number of connections grouped by state (active, idle, idle in transaction) over time |
Query Activity |
Distribution of queries by state:
|
Active Queries by Duration Bucket |
Distribution of active queries by their duration buckets. The buckets categorize queries by their execution time: 0-10 seconds, 10-60 seconds, 60-180 seconds, 180-600 seconds, and over 600 seconds |
Replication Lag (Replay) |
Replication lag in bytes for each segment, representing the amount of WAL data to be replayed on mirrors |
Max Replication Lag |
Maximum replication lag across all segments, shown as a single value with thresholds for warning and critical levels |
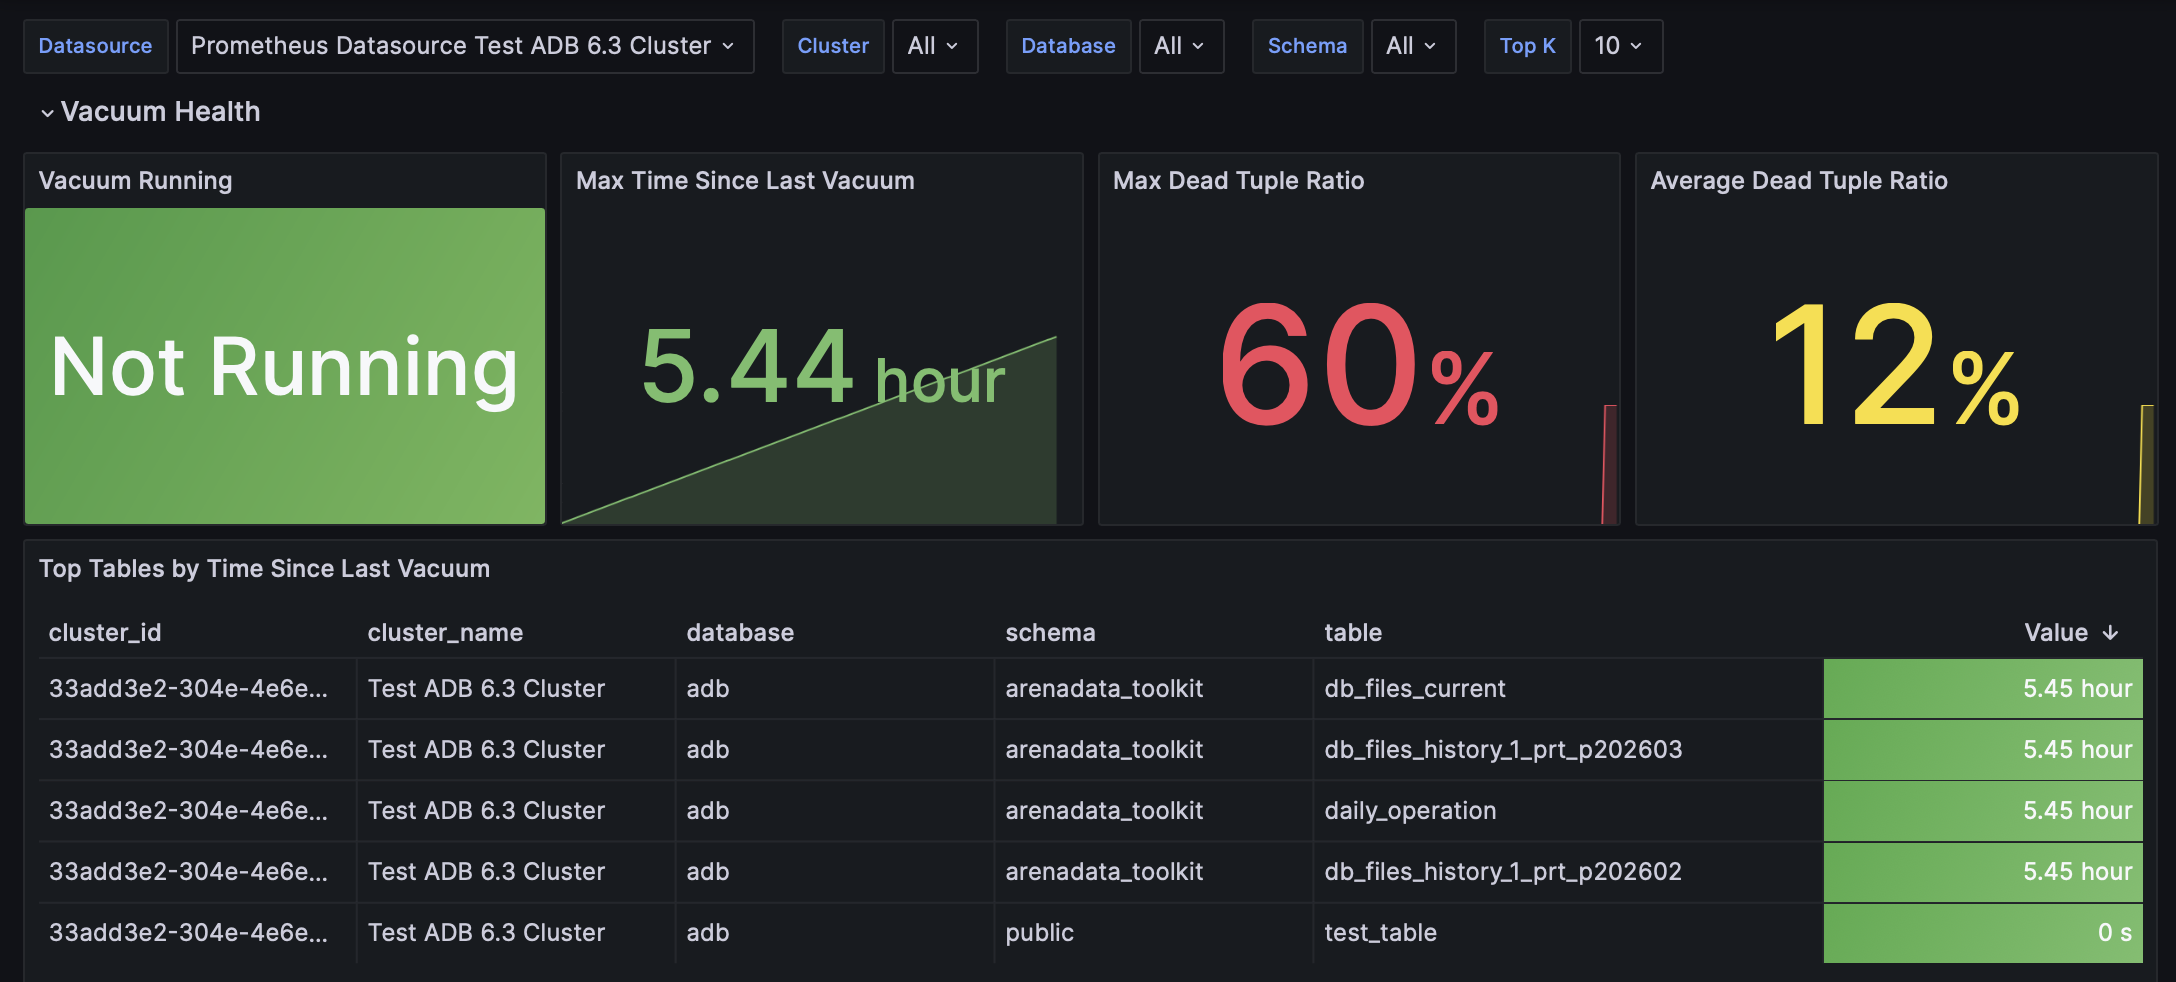
Greengage - Database Health
This dashboard monitors database-level health metrics: vacuum operations, table bloat, and data distribution skew.
| Panel name | Description |
|---|---|
Vacuum Running |
Indicates whether a vacuum process is currently running |
Max Time Since Last Vacuum |
Maximum time elapsed since any table in the database was last vacuumed. Greengage Exporter compares the timestamps of the last vacuum operation (manual or autovacuum) on every table and shows the largest interval found across all tables |
Max Dead Tuple Ratio |
Maximum ratio of dead tuples to live tuples across all tables, indicating potential vacuum need |
Average Dead Tuple Ratio |
Average dead tuple ratio across all tables, showing the overall table bloat level |
Top Tables by Time Since Last Vacuum |
The list of tables with the longest time since their last vacuum, sorted by time descending. The Value column shows the time elapsed since the last vacuum was performed on this table. During each metric collection, only tables where the sum of dead and live tuples exceeds a configured threshold (COLLECTOR_TABLE_VACUUM_TUPLE_THRESHOLD) are included. This means that after a successful vacuum, a table may no longer satisfy this condition and will be absent from the metric query; in this case, new data from this table will not be reflected in this list |
Vacuum & Autovacuum Count |
Graph showing the cumulative count of manual and automatic During each metric collection, only tables where the sum of dead and live tuples exceeds a configured threshold (COLLECTOR_TABLE_VACUUM_TUPLE_THRESHOLD) are included. This means that after a successful vacuum, a table may no longer satisfy this condition and will be absent from the metric query; in this case, new data from this table will not be reflected in this graph |
Top Tables by Dead Tuple Ratio |
Graph tracking the top tables with the highest dead tuple ratio over time |
Table Bloat State (0=none, 1=moderate, 2=severe) |
Graph displaying the bloat state of tables over time |
Top Tables by Skew Factor (>1.5 is significant) |
Graph showing how the skew factor changes over time for the top tables exceeding the 1.5 threshold |
Tables with Bloat |
Shows tables currently experiencing bloat, with bloat state (1 — moderate, 2 — severe) |
Tables with High Skew Factor |
Shows the current top tables ordered by skew factor |
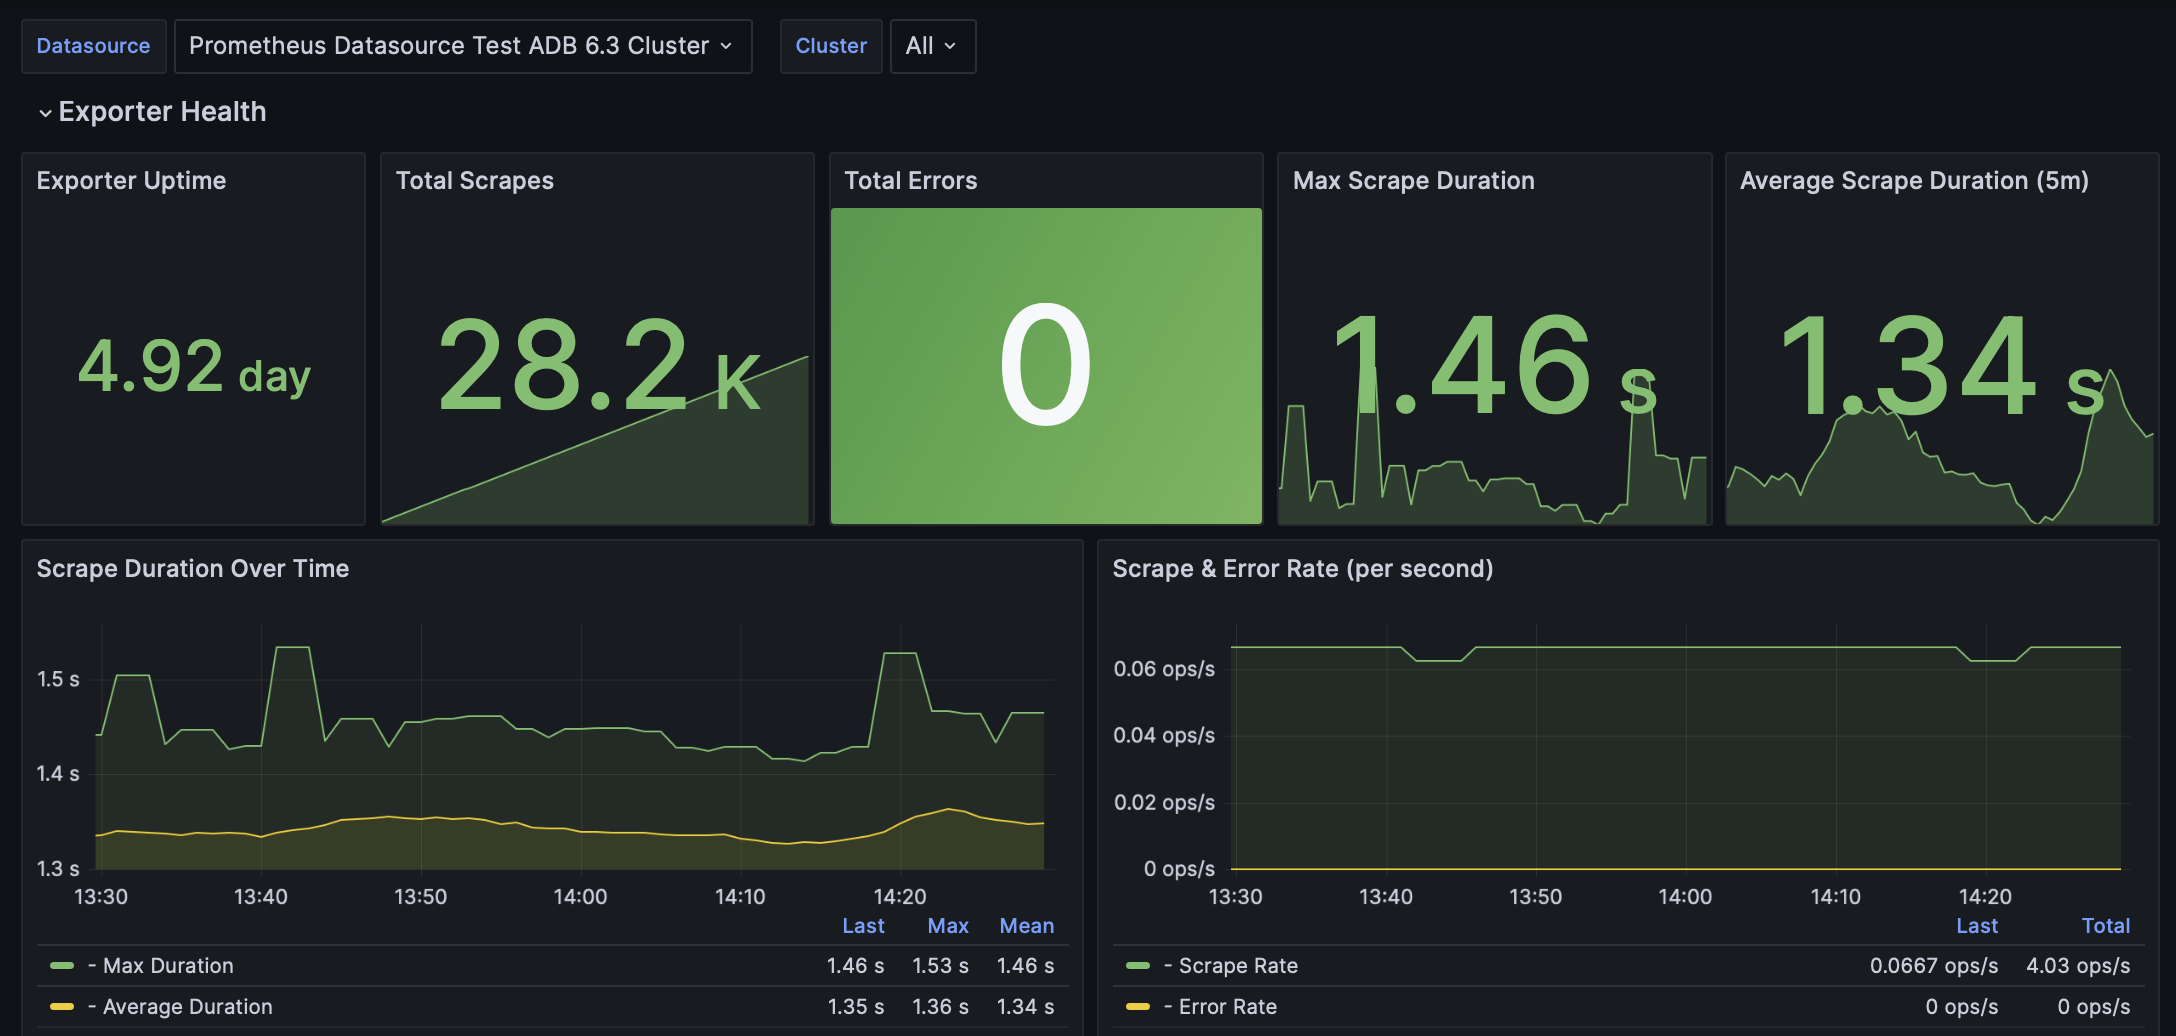
Greengage - Exporter Monitoring
This dashboard monitors the health and performance of the Greengage exporter itself.
| Panel name | Description |
|---|---|
Exporter Uptime |
Total uptime of the exporter process |
Total Scrapes |
Total number of scrapes — that is, the number of times Prometheus successfully collected metrics from Greengage Exporter |
Total Errors |
Total number of errors encountered during scrapes |
Max Scrape Duration |
Maximum duration of a single scrape operation in seconds, with thresholds |
Average Scrape Duration (5m) |
Average scrape duration over the last 5 minutes |
Scrape Duration Over Time |
Graph showing max and average scrape duration over time |
Scrape & Error Rate (per second) |
Rate of scrape operations and errors per second over 5-minute windows |
Collector Durations |
Duration of each collector execution over time. In Greengage Exporter, collectors are components responsible for gathering specific types of metrics, such as the collector for table vacuum statistics or the one for memory usage |
Circuit Breaker State |
Current state of the internal circuit breakers:
|
Circuit Breaker Opened Count (5m increase) |
Number of times circuit breakers opened in the last 5 minutes |
Circuit Breaker Calls Rate (per second) |
Rate of calls to circuit breakers per second |
Timeout Calls Rate (per second) |
Rate of timeout-protected method calls per second, labeled by whether they timed out |
Timeout Execution Duration (Average) |
Average execution duration of methods |
Retry Calls Rate (per second) |
Rate of retry-protected method calls per second, labeled by retry status and result |
Total Retry Attempts (5m increase) |
Total number of retry attempts across all methods over the last 5 minutes |
Method Invocation Rate (per second) |
Rate of all method invocations per second.
Invocations are split by their results, for example |
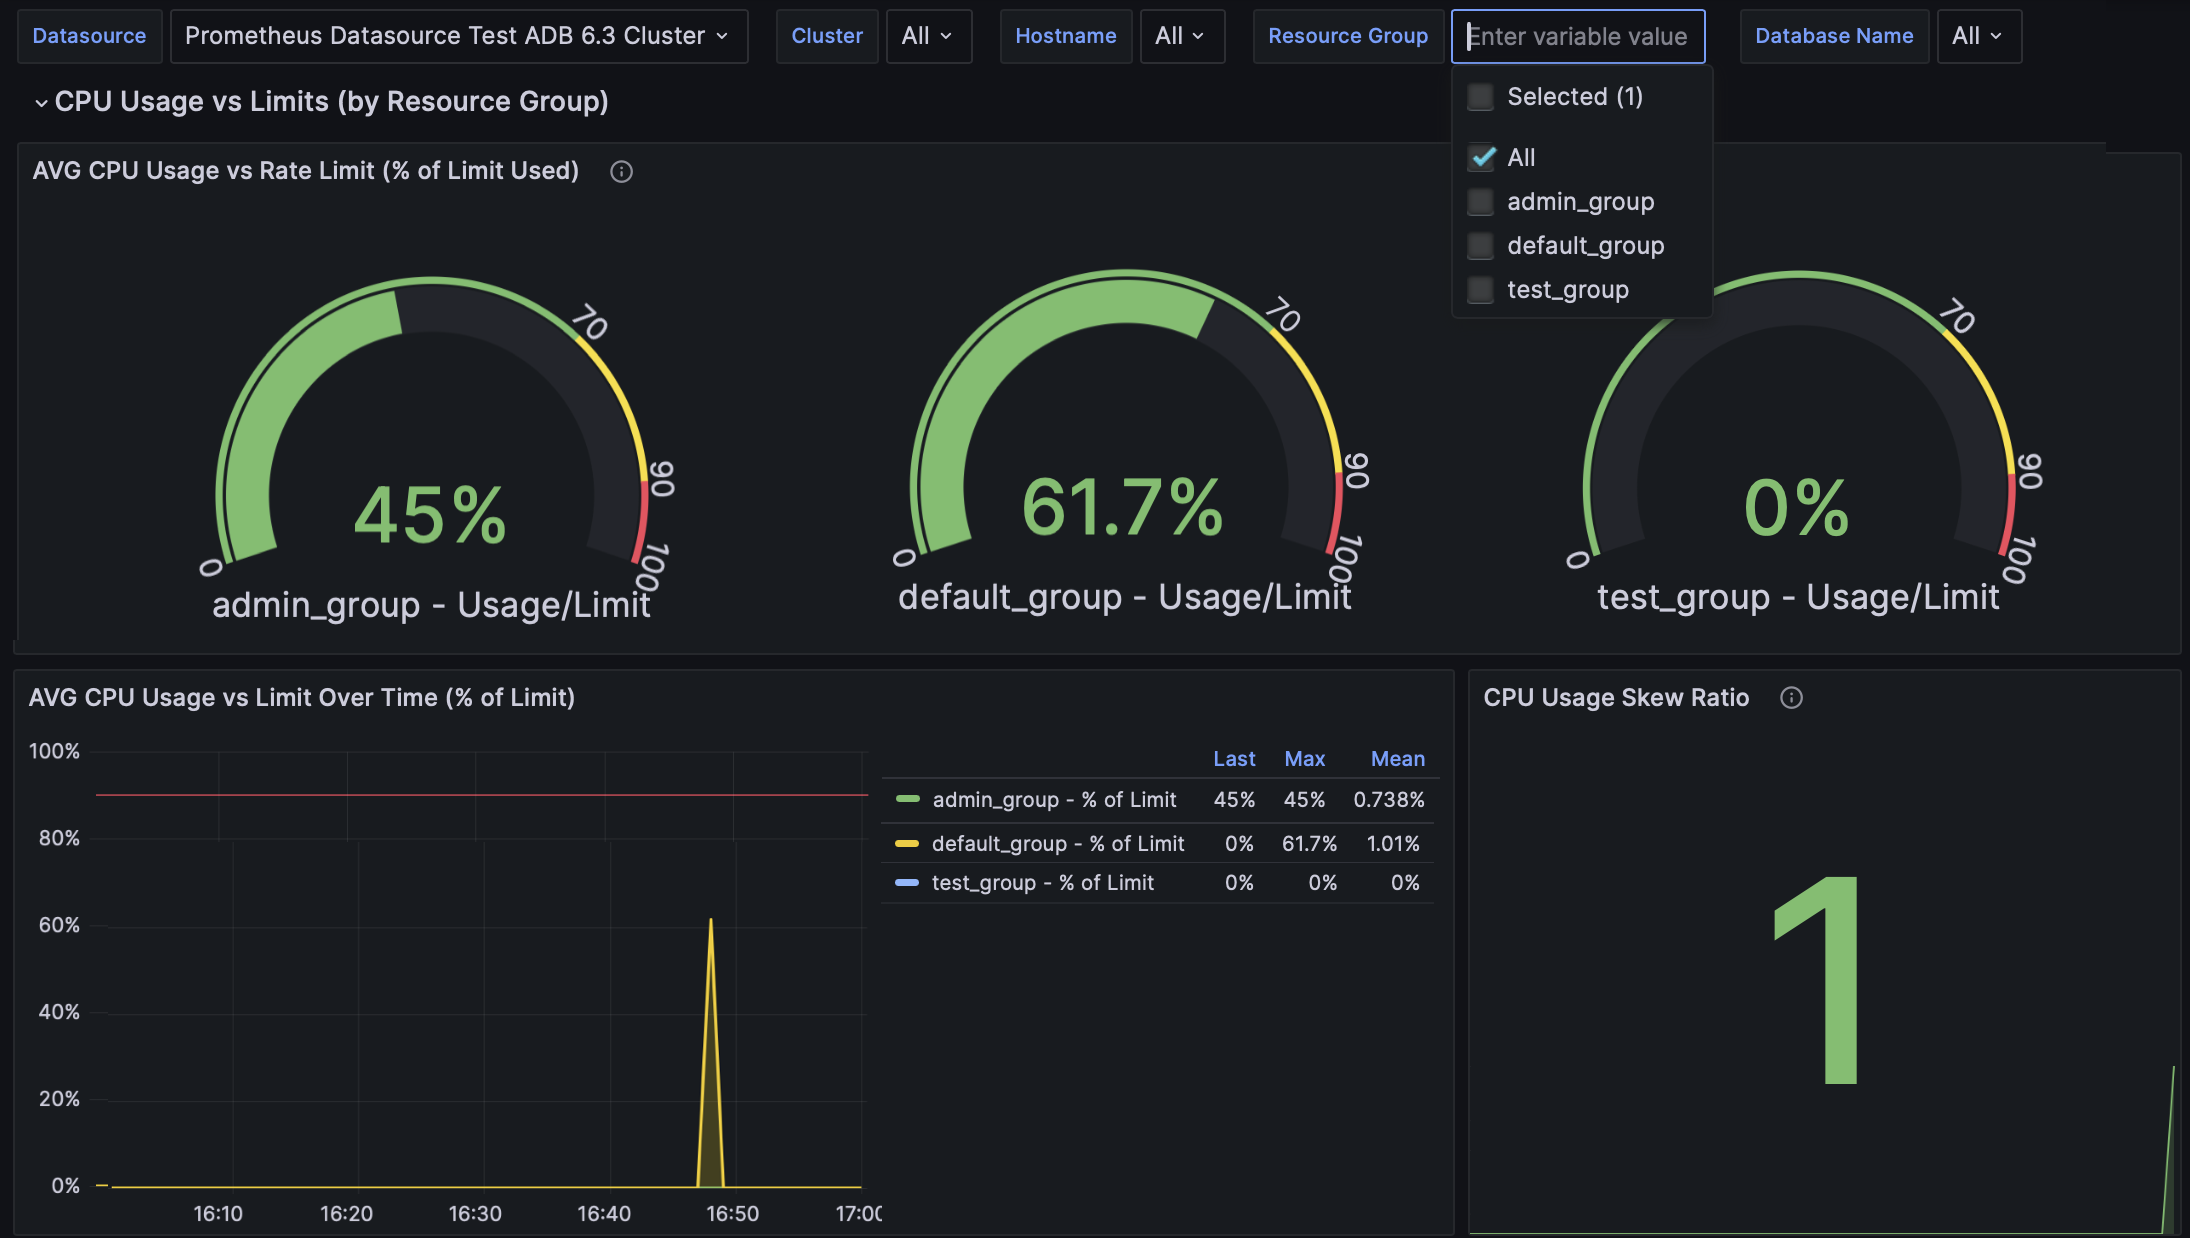
Greengage - Host & Resource Group Resources
This dashboard provides a view of resource utilization in an ADB cluster on the host-level and resource group-level.
To view data for a specific host or resource group, use the Hostname and Resource Group filters at the top of the dashboard.
| Panel name | Description |
|---|---|
AVG CPU Usage vs Rate Limit (% of Limit Used) |
Average CPU usage as percentage of CPU rate limit for each resource group, showing how close each group is to its configured limit |
AVG CPU Usage vs Limit Over Time (% of Limit) |
Graph of average CPU usage relative to limit, expressed as percentage of limit over time |
CPU Usage Skew Ratio |
Ratio of maximum to average CPU usage across hosts; values greater than 1.3 indicate uneven CPU distribution |
Absolute CPU Usage by Host and Resource Group |
Graph of absolute CPU usage percentage per host and resource group, with limit annotation |
Memory Usage vs Limit (% of Limit Used) - LIMITED GROUPS ONLY |
Memory usage as percentage of memory limit for resource groups with finite limits (unlimited groups excluded) |
Memory Usage Skew Ratio |
Ratio of maximum to average memory usage across hosts; values greater than 1.3 indicate uneven memory distribution |
Average Memory Usage |
Average memory usage across all hosts in the cluster |
Max Memory Usage |
Maximum memory usage observed on any host in the cluster |
Memory Usage by Host and Resource Group (with Limits) |
Graph of absolute memory usage per host and resource group, showing configured limits |
Running Sessions by Resource Group |
Number of currently running (active) sessions per resource group; high values indicate high workload |
Queueing Sessions by Resource Group (Resource Saturation Indicator) |
Number of sessions queueing due to resource limits in a resource group |
Running vs Queueing Sessions Over Time |
Graph comparing running and queueing sessions per resource group over time |
Average Disk Total |
Average total disk space across all hosts |
Average Disk Used |
Average used disk space across all hosts |
Disk Usage Skew Ratio |
Ratio of maximum to average disk used across hosts; values >1.3 indicate uneven disk usage distribution |
Max Disk Usage Percent |
Maximum disk usage percentage observed on any host |
Disk Usage Percent by Host |
Graph of disk usage percentage per host |
Disk Usage by Host (Total/Used/Available) |
Graph showing total, used, and available disk space per host |
Database Size by Name |
Shows database sizes in MB for selected databases |
Max Spill Usage |
Maximum spill (temp file) usage observed on any host |
Average Spill Usage |
Average spill usage across all hosts |
Spill Usage Skew Ratio |
Ratio of maximum to average spill usage |
Spill Usage by Host |
Shows spill usage per host |
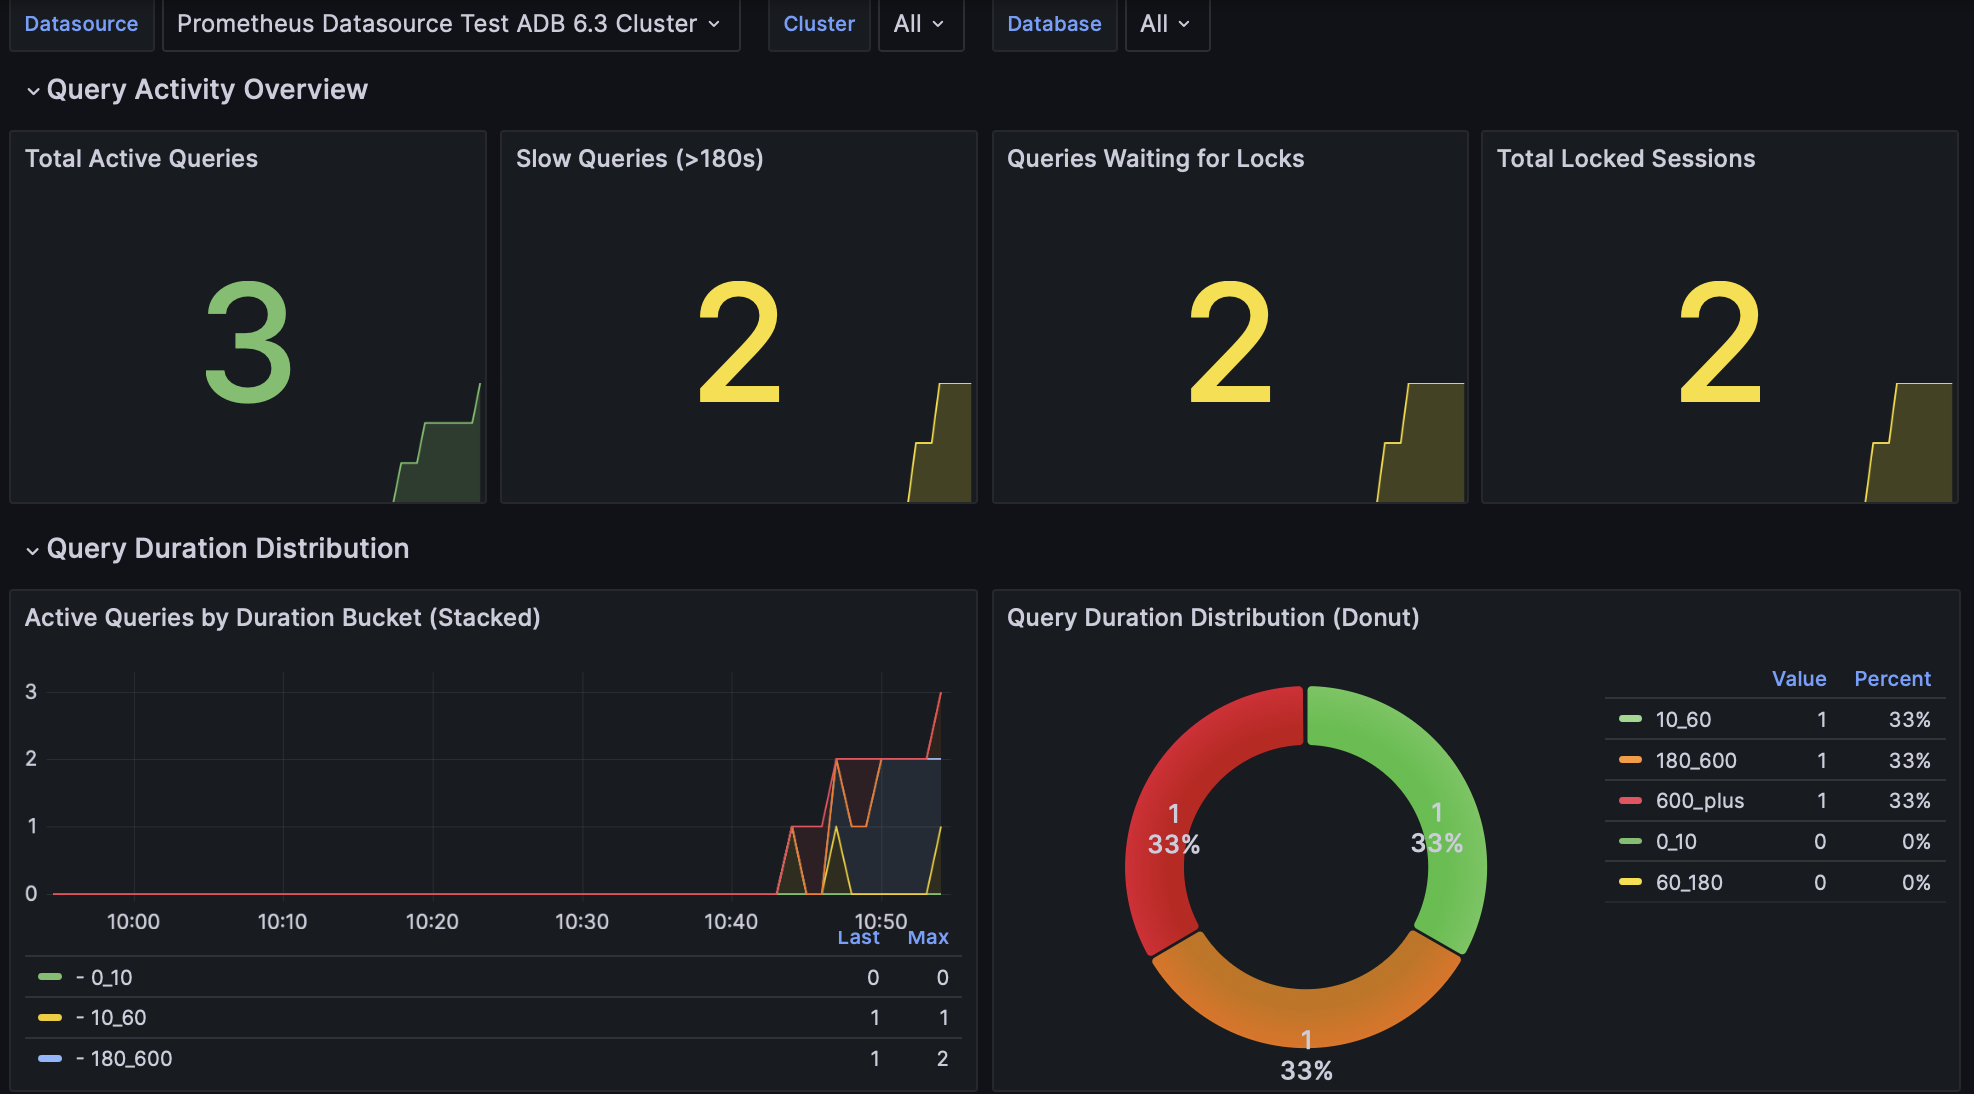
Greengage - Query Performance
This dashboard provides monitoring of query performance: active queries, slow queries, lock contention, and connection statistics.
| Panel name | Description |
|---|---|
Total Active Queries |
Current number of active (running) queries across the cluster, with thresholds for normal, elevated, and high activity |
Slow Queries (>180s) |
Number of queries currently running that have exceeded 180 seconds (3 minutes) of execution time, indicating potential performance issues |
Queries Waiting for Locks |
Number of active queries blocked while attempting to acquire a lock.
Reflected by entries in the |
Total Locked Sessions |
Total number of sessions currently waiting for locks |
Query Activity Over Time |
Distribution of queries by state for the selected time range:
|
Active Queries by Duration Bucket (Stacked) |
Distribution of active queries across predefined duration buckets. The buckets categorize queries by their execution time: 0-10 seconds, 10-60 seconds, 60-180 seconds, 180-600 seconds, and over 600 seconds |
Query Duration Distribution (Donut) |
Current distribution of active queries across duration buckets, with absolute counts and percentages |
Total Connections (All States) |
Total number of connections to the database in all states |
Active Connections |
Number of connections currently executing queries |
Idle Connections |
Number of connections that are idle (waiting for client activity) |
Connections by State Over Time |
Shows connections grouped by state ( |
Queries Waiting for Locks Over Time |
The number of queries blocked waiting for locks, with thresholds for warning and critical levels |
Locked Sessions Over Time |
Total locked sessions over time |
Max Lock Wait Time by Type and Mode |
Maximum wait time for locks grouped by lock type and mode. When locks are released, metrics disappear from this panel (no stale data shown) |
Waiting Queries by Lock Type and Mode |
Number of queries waiting for locks, grouped by lock type and mode. When locks are released, metrics disappear from this panel (no stale data shown) |
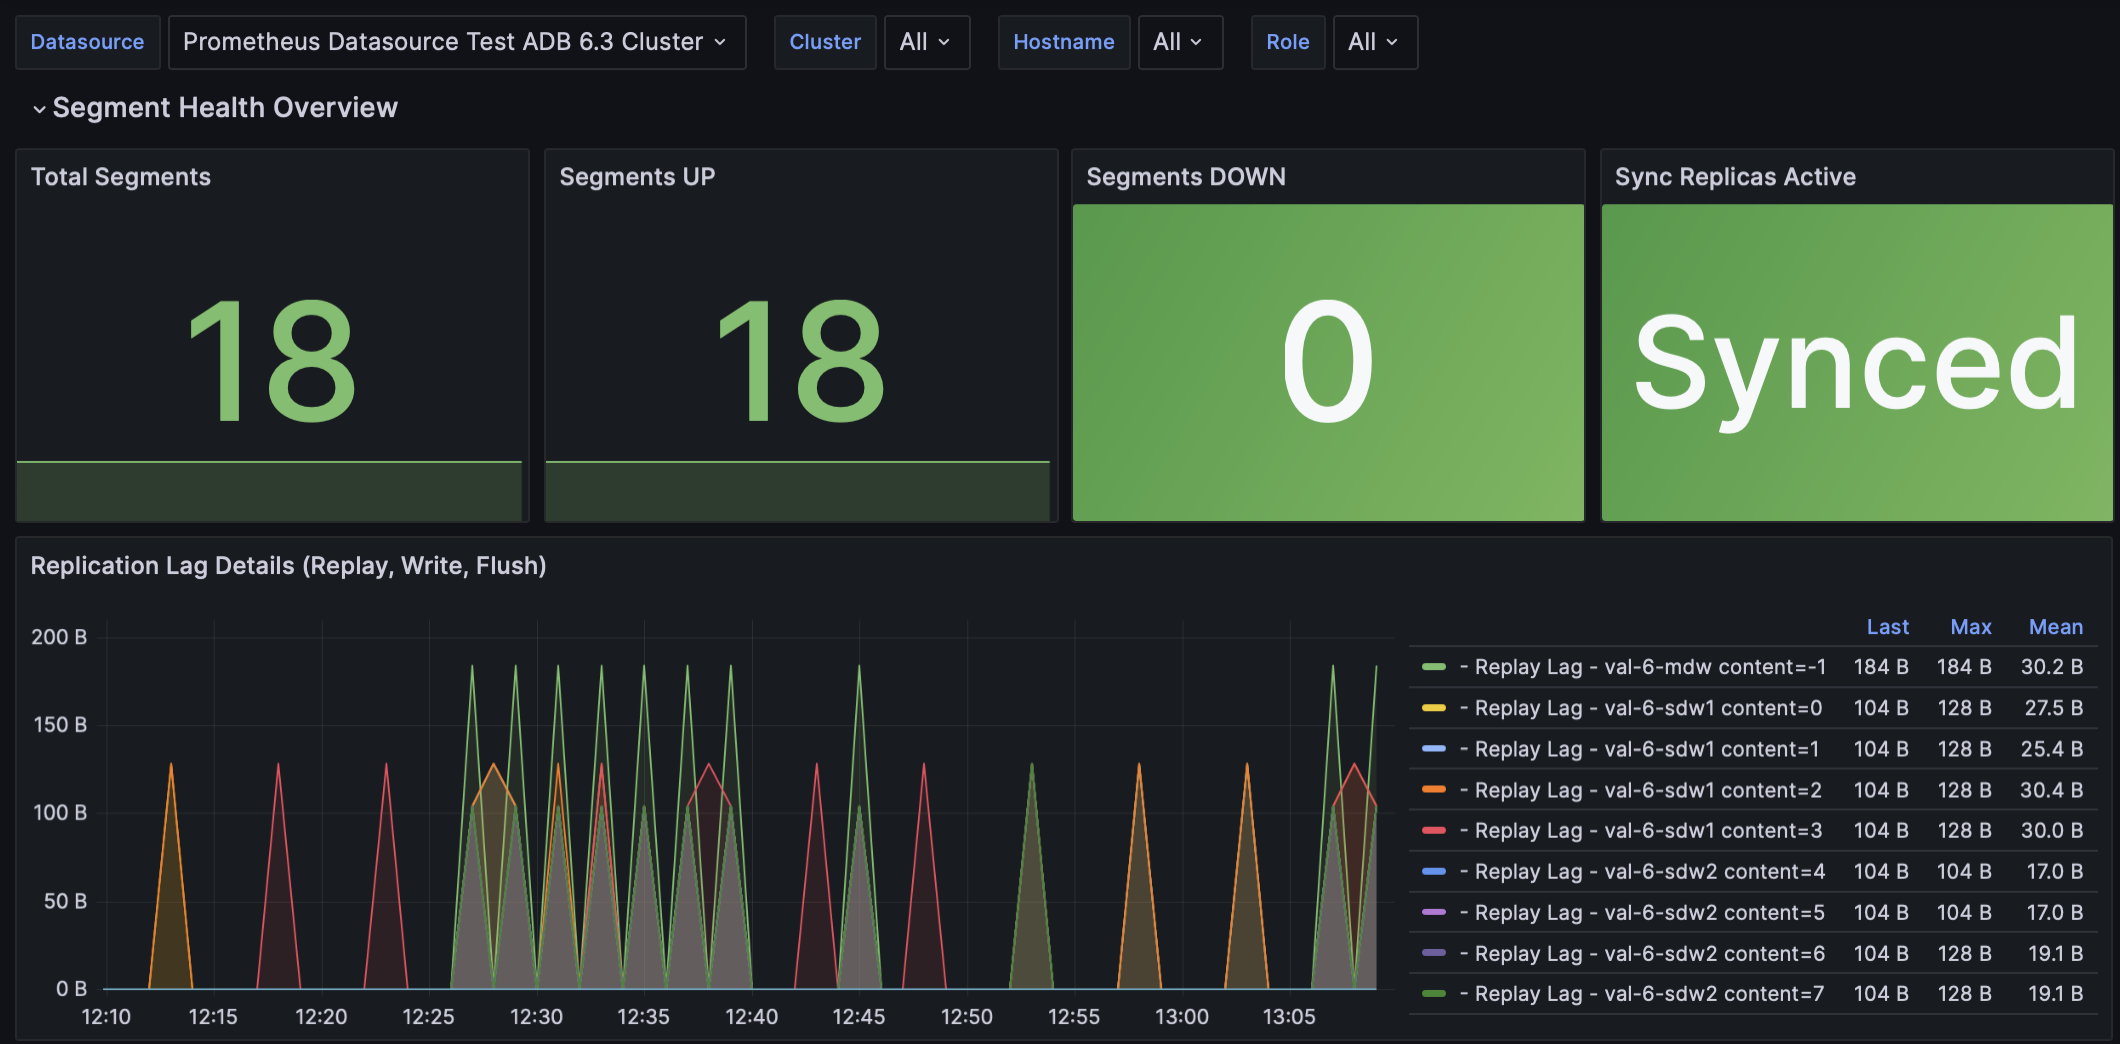
Greengage - Replication & Segments
This dashboard provides monitoring of segment health and replication state.
| Panel name | Description |
|---|---|
Total Segments |
Total number of segments (primary and mirror) configured in the cluster |
Segments UP |
Number of segments currently up and running |
Segments DOWN |
Number of segments currently down |
Sync Replicas Active |
Indicates whether synchronous replication is active |
Segment Status |
Graph showing segment status over time, identified by hostname, port, content ID, and role |
Segment Role (1=Primary, 2=Mirror) |
Graph displaying segment role (primary or mirror) over time |
Segment Mode (1=Sync, 2=Resync, 3=Change Track, 4=Not Sync) |
Graph of segment replication mode over time |
Max Replication Lag |
Maximum replication lag in bytes across all segments, with thresholds |
Average Replication Lag |
Average replication lag in bytes across all segments, with thresholds |
Minimum Sync State (2=sync, 1=async, 0.5=potential, 0=unknown) |
Minimum sync state among replication connections, indicating the worst‑case sync status |
Replication Lag Details (Replay, Write, Flush) |
Graph of replication lag in bytes for each segment, broken down by replay lag, write lag, and flush lag |
Replication State (1=streaming, 2=catchup, 3=backup, 0=unknown) |
Graph of replication state for each mirror |
Replication Sync State (2=sync, 1=async, 0.5=potential, 0=unknown) |
Graph indicating the synchronization policy over time:
|
Segment Details Table |
The table lists all segments with their current status, hostname, port, content ID, role, and preferred role |
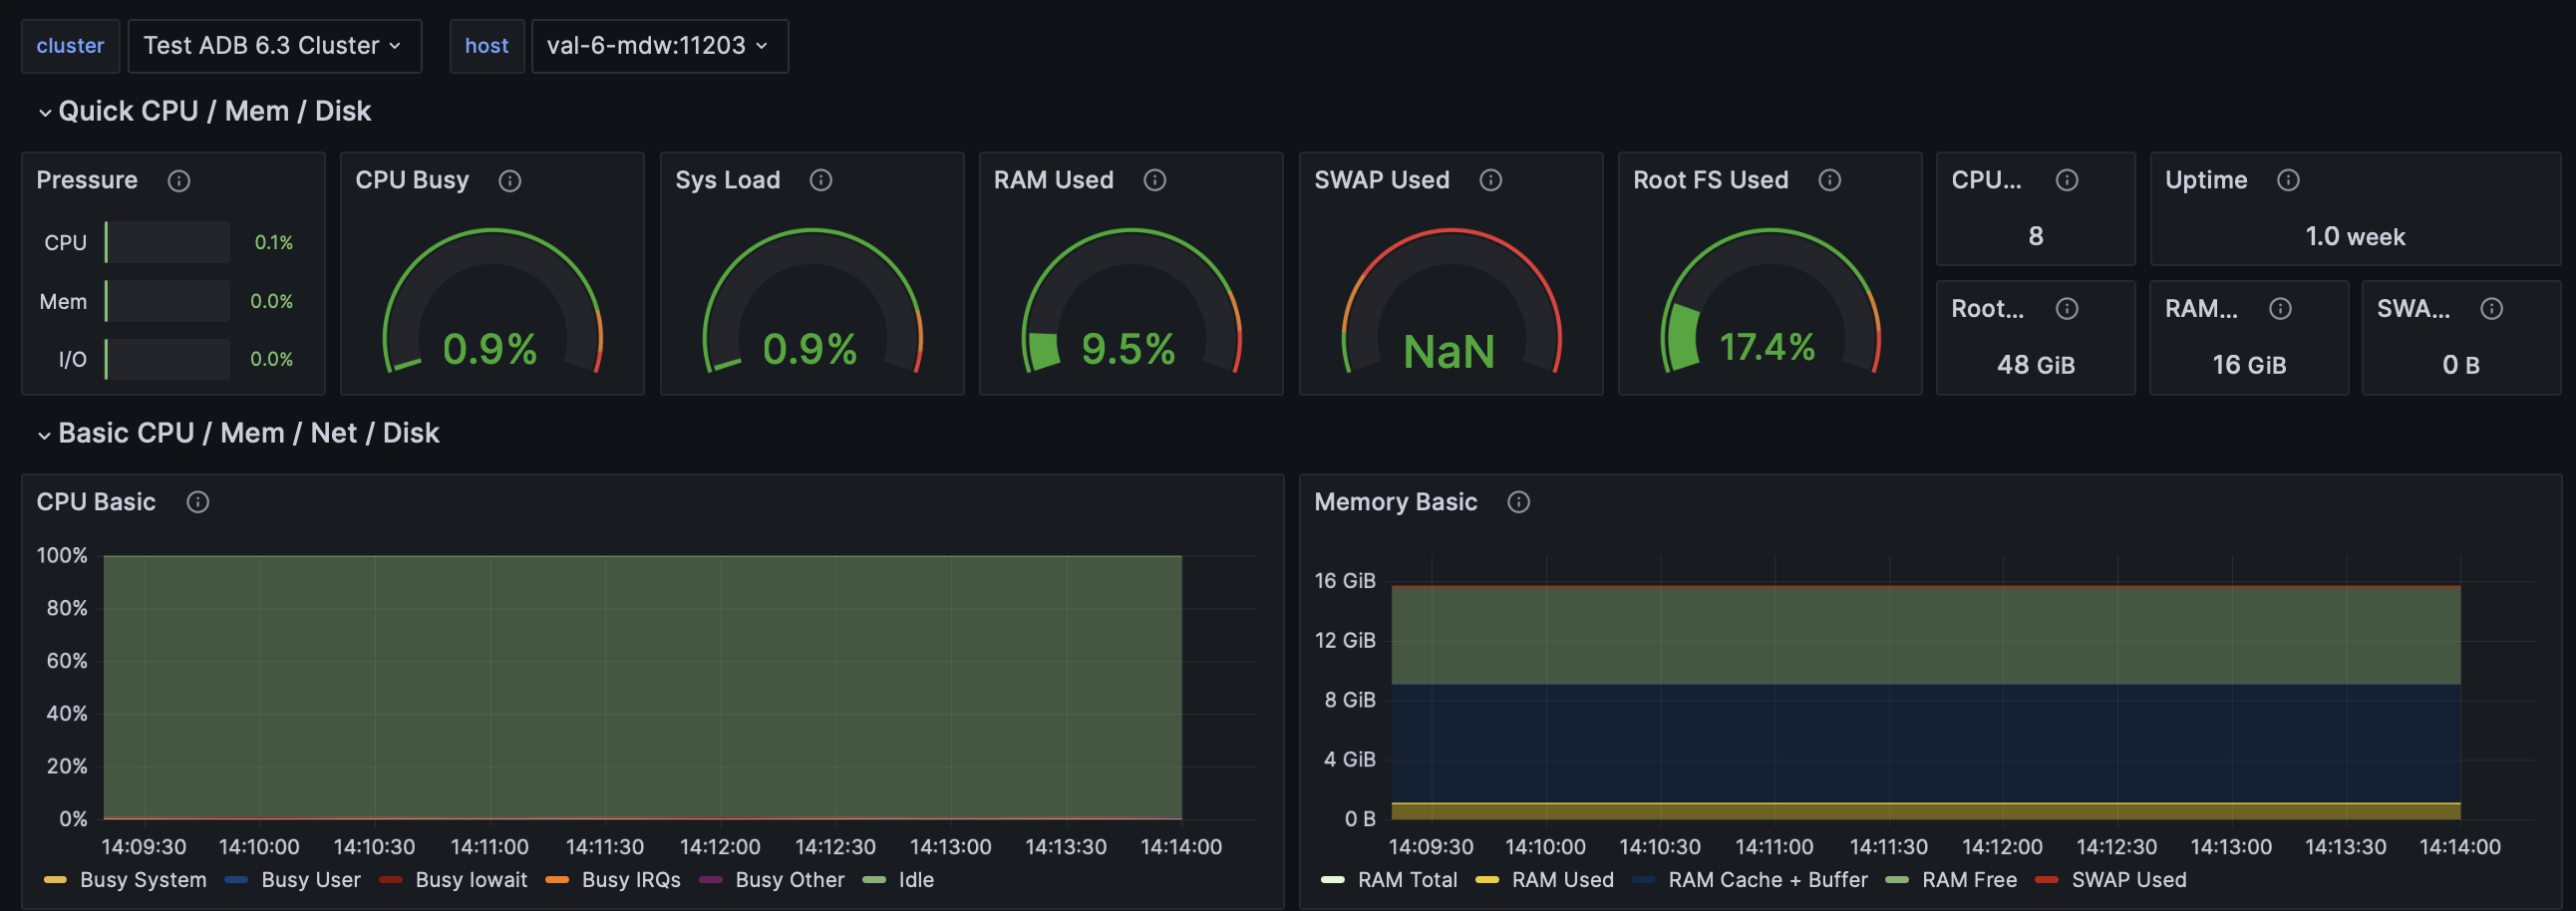
Node Exporter statistics
The Node Exporter statistics dashboard provides system metrics for each host in the cluster where Node Exporter is installed. You can select a host in the host filter at the top of the page.
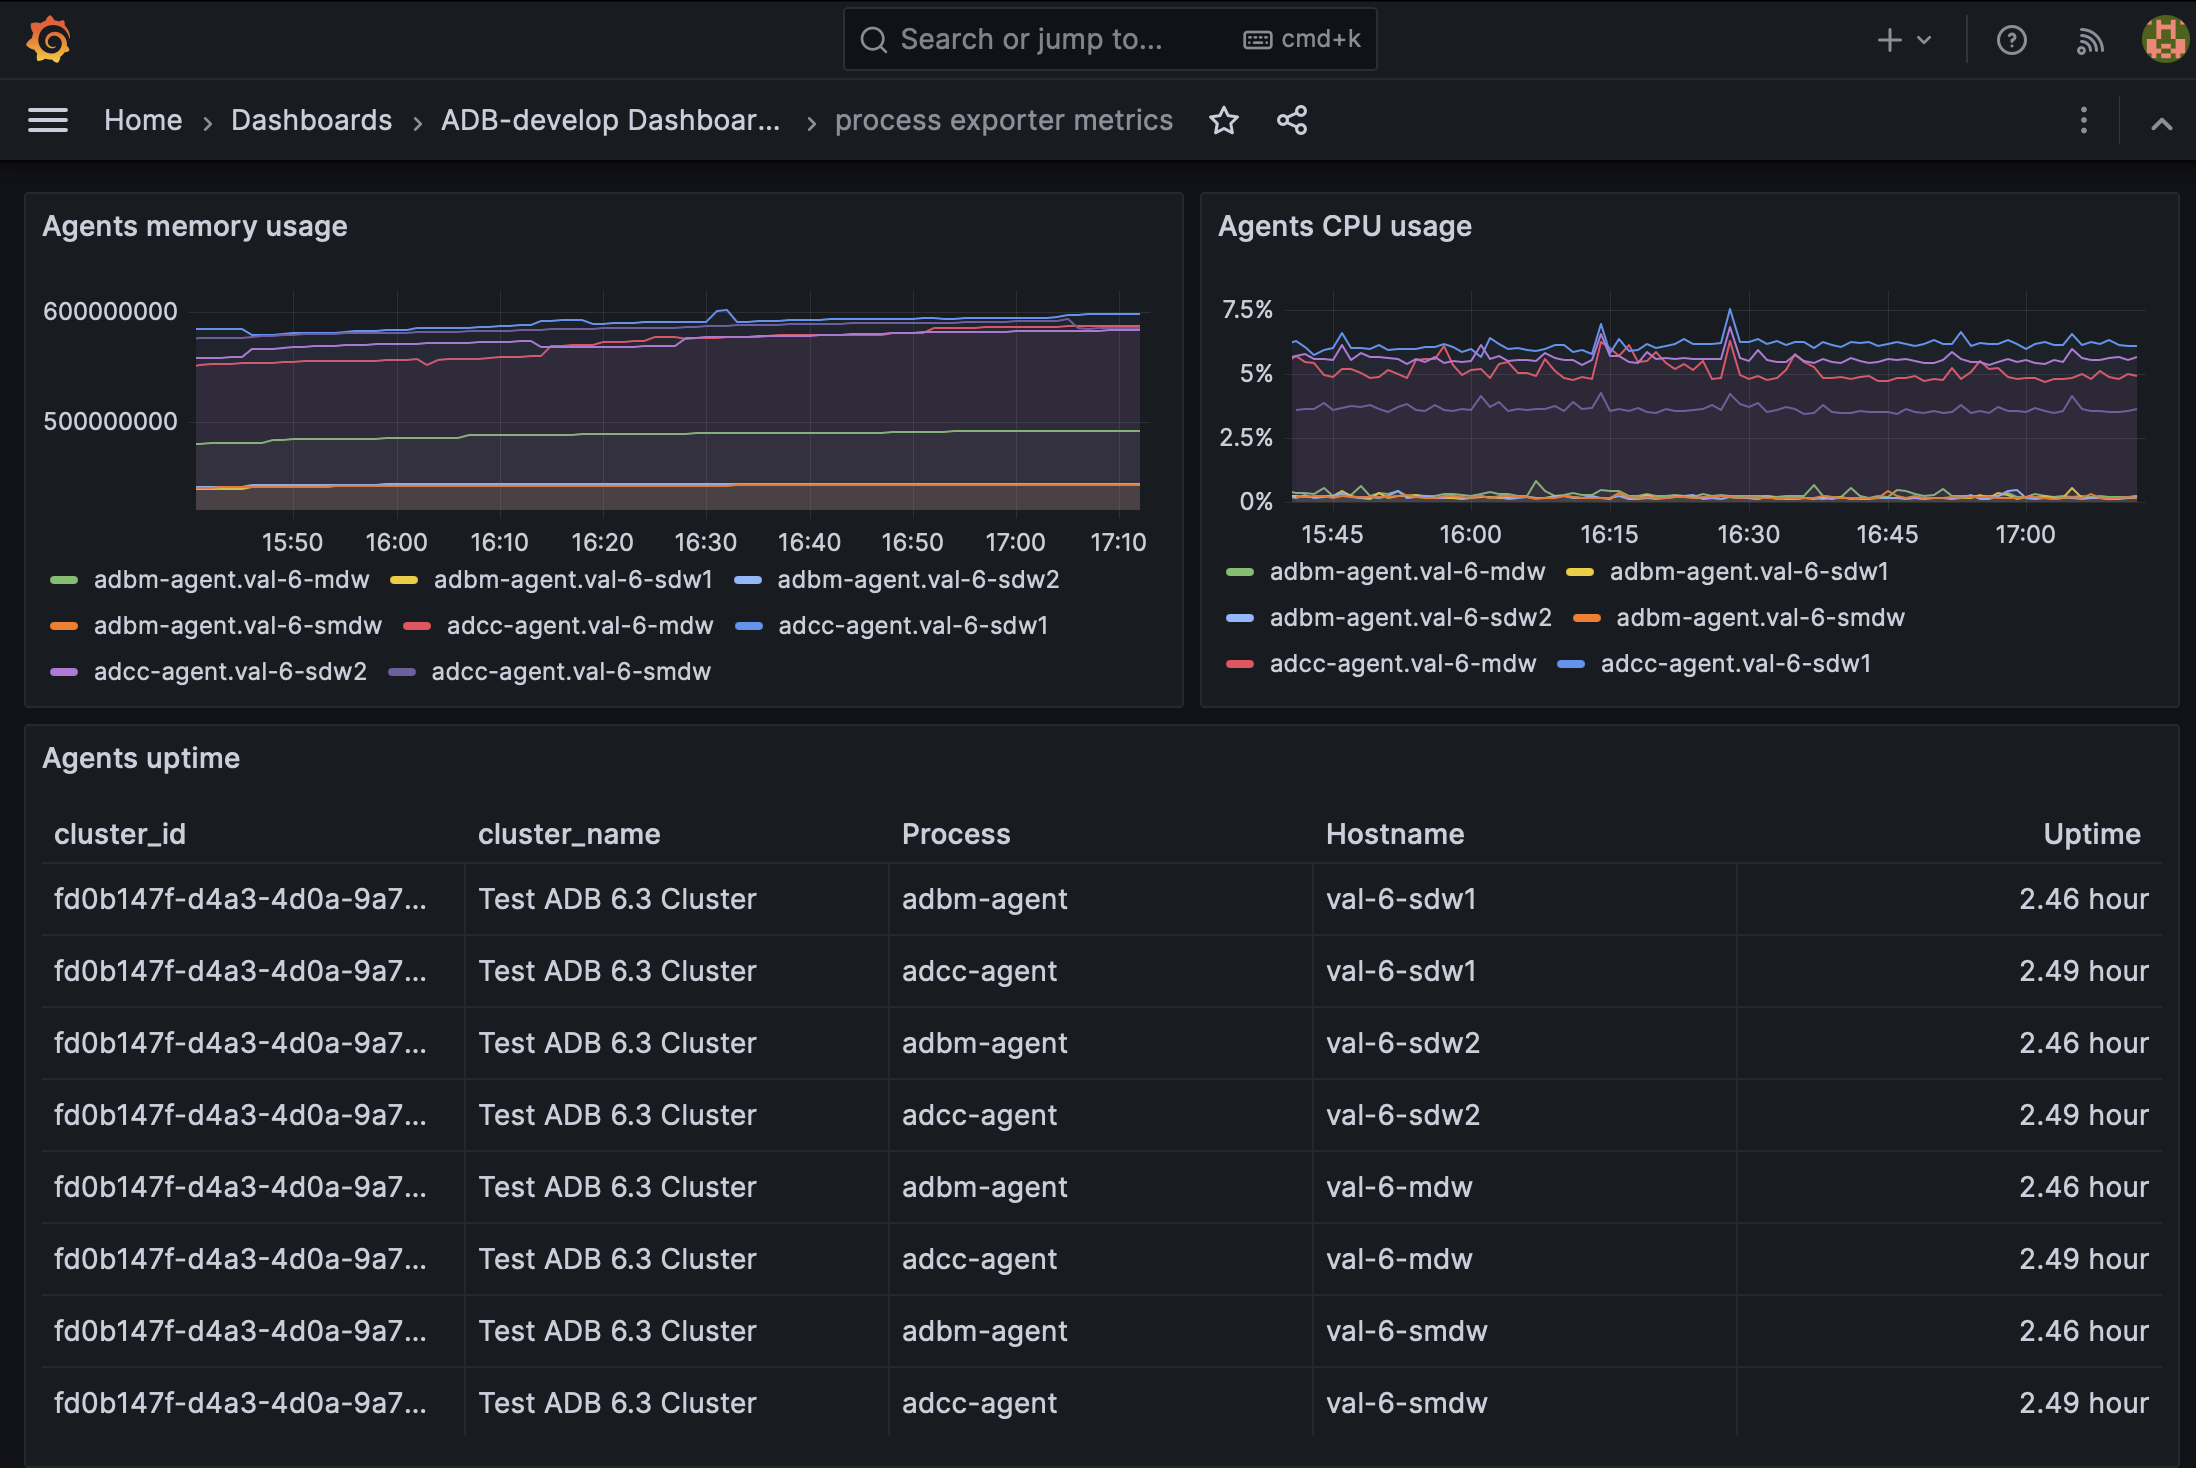
Process exporter metrics
This dashboard provides monitoring of ADB Control and ADBM agents (adcc-agent and adbm-agent processes) using metrics exposed by Process Exporter.
| Panel name | Description |
|---|---|
Agents uptime |
Uptime of each agent instance |
Agents memory usage |
Memory usage of each agent over time |
Agents CPU usage |
CPU usage percentage of each agent over time |
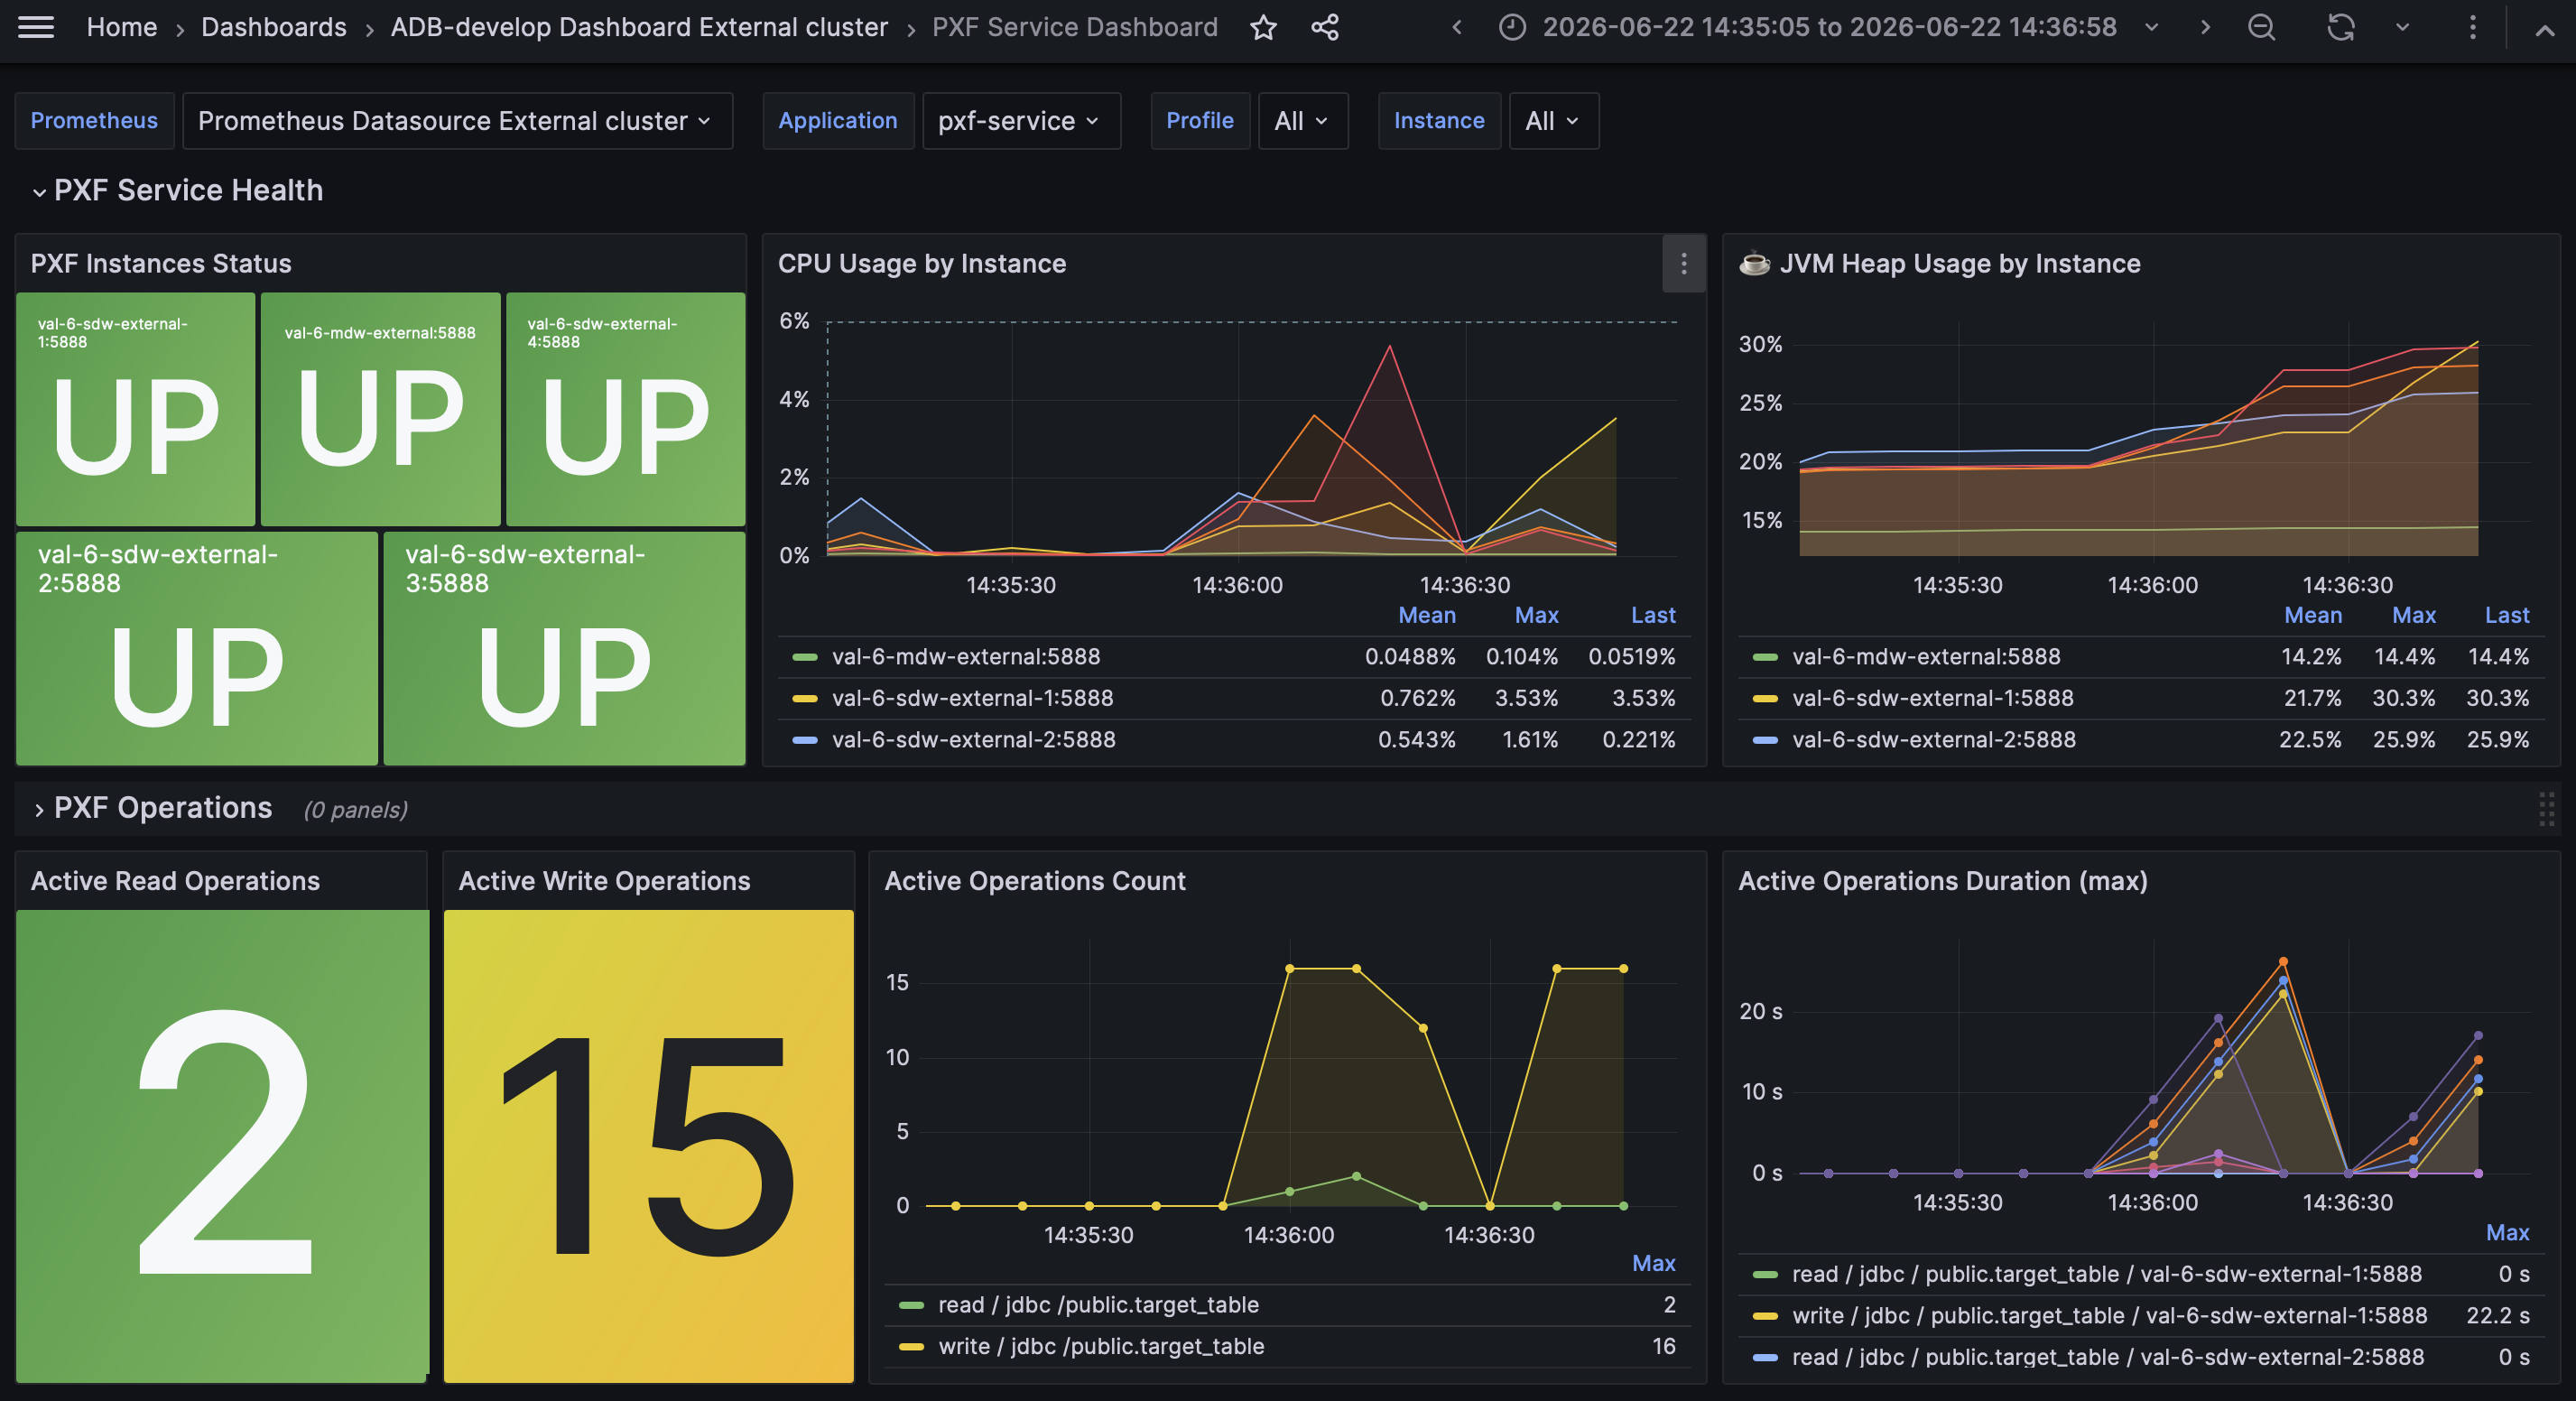
PXF Service Dashboard
This dashboard provides information on the health of PXF instances, PXF operational metrics, JVM memory usage, Tomcat threads and connections, and HTTP request and error rates. For a complete list of all available panels, refer to PXF Grafana Dashboards.
At the top of the dashboard, the following filters are available:
-
Application — the name of the PXF service as configured by
management.metrics.tags.applicationin $PXF_BASE/conf/pxf-application.properties. If not configured,pxf-serviceis used by default. -
Profile — used PXF profiles.
-
Instance — hosts on which PXF instances are installed (as configured by
targetsin /etc/admprom/prometheus/prometheus.yml).