

Dashboard
The Dashboard page in the ADB Control web interface allows you to display charts for tracking the dynamic changes of various metrics over the selected time period in the ADB clusters connected for monitoring.
Each tab on the page corresponds to a separate chart:
-
Commands — a number of SQL commands in the
Runningstatus. -
Transactions — a number of transactions in the
Activestatus. -
CPU — a total CPU consumption in the ADB cluster (percentage).
-
Memory — a total virtual memory allocation in the ADB cluster (percentage).
-
Read — a total data read amount in the ADB cluster (in bytes).
-
Write — a total data write amount in the ADB cluster (in bytes).
To open a full screen view of any of the charts, click the
icon to the right of the cluster name in the top part of the chart.
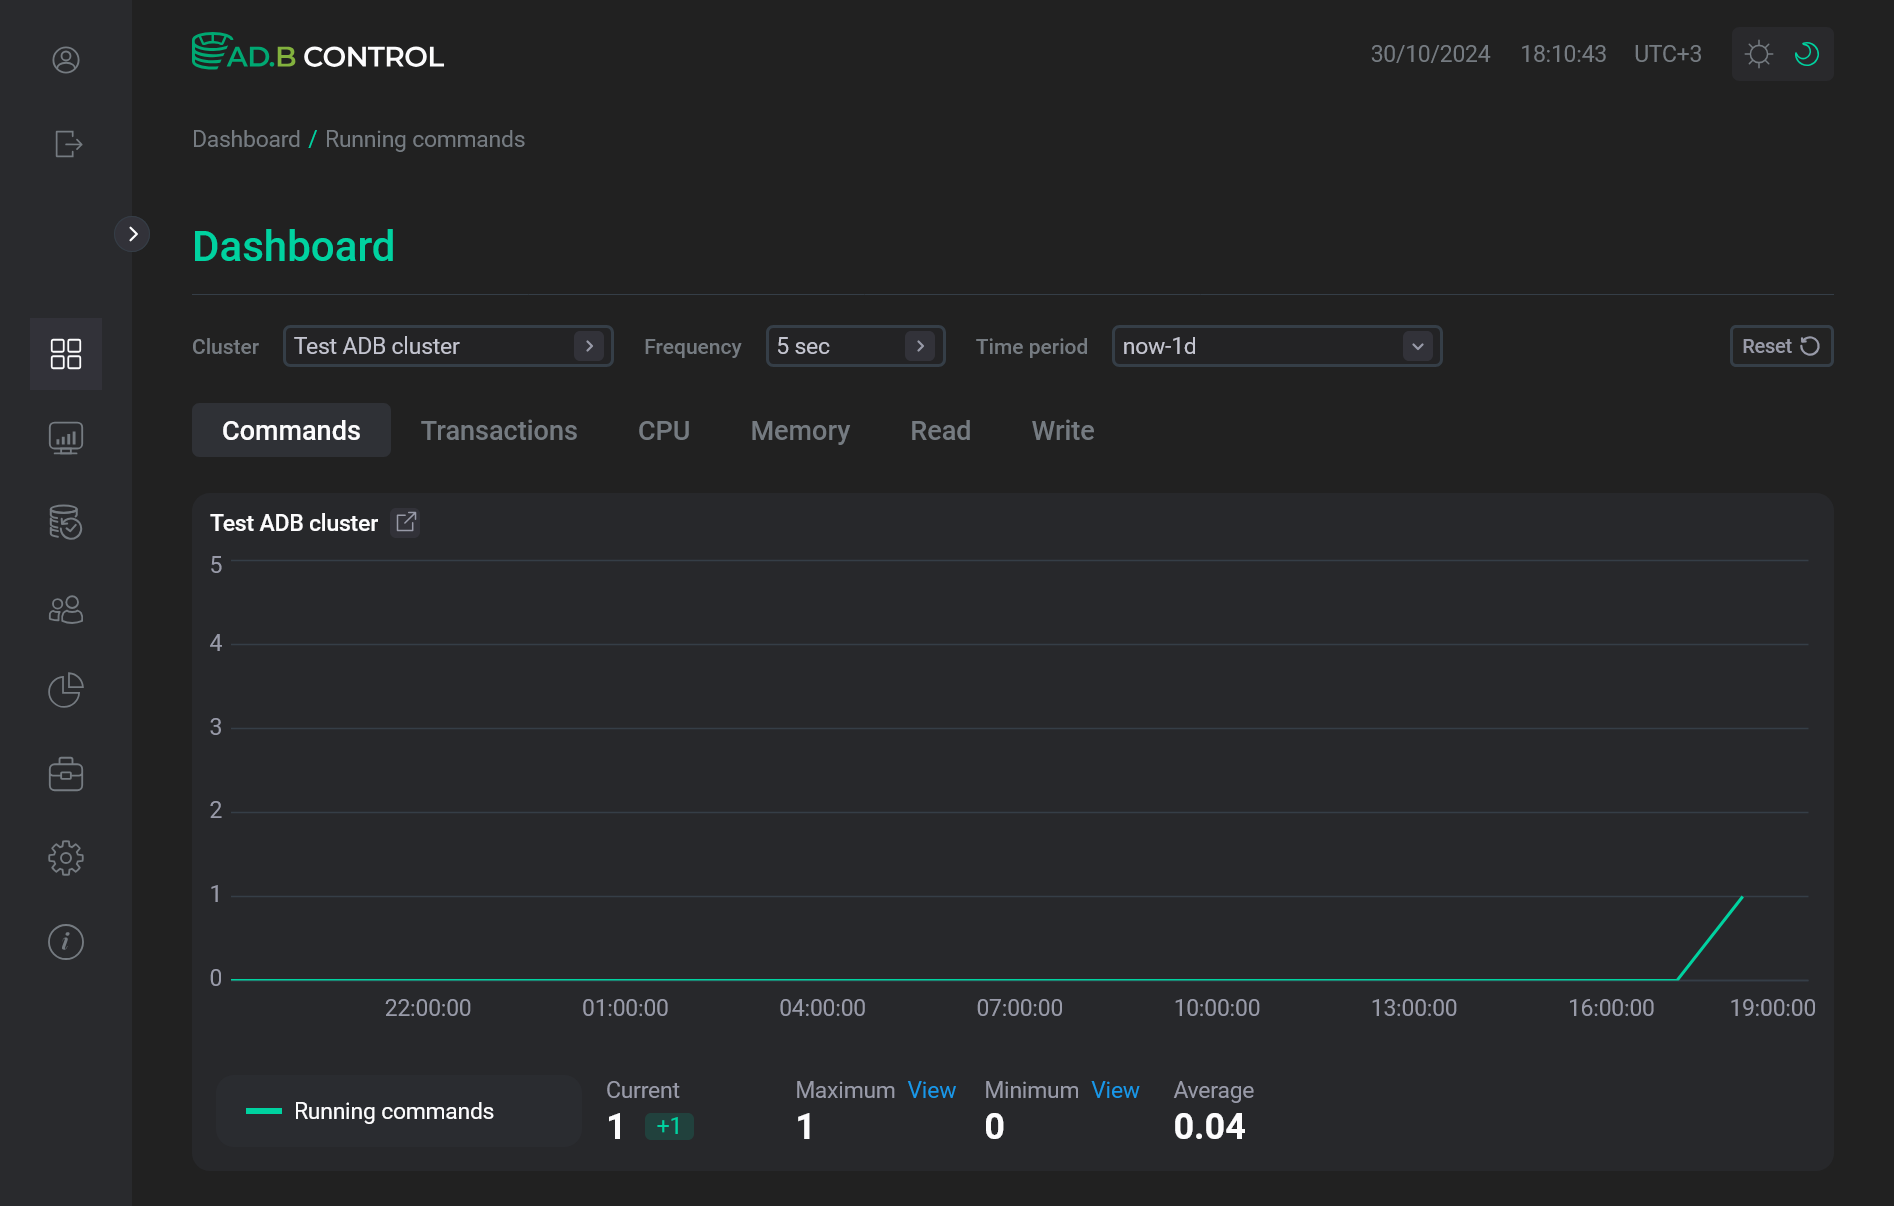
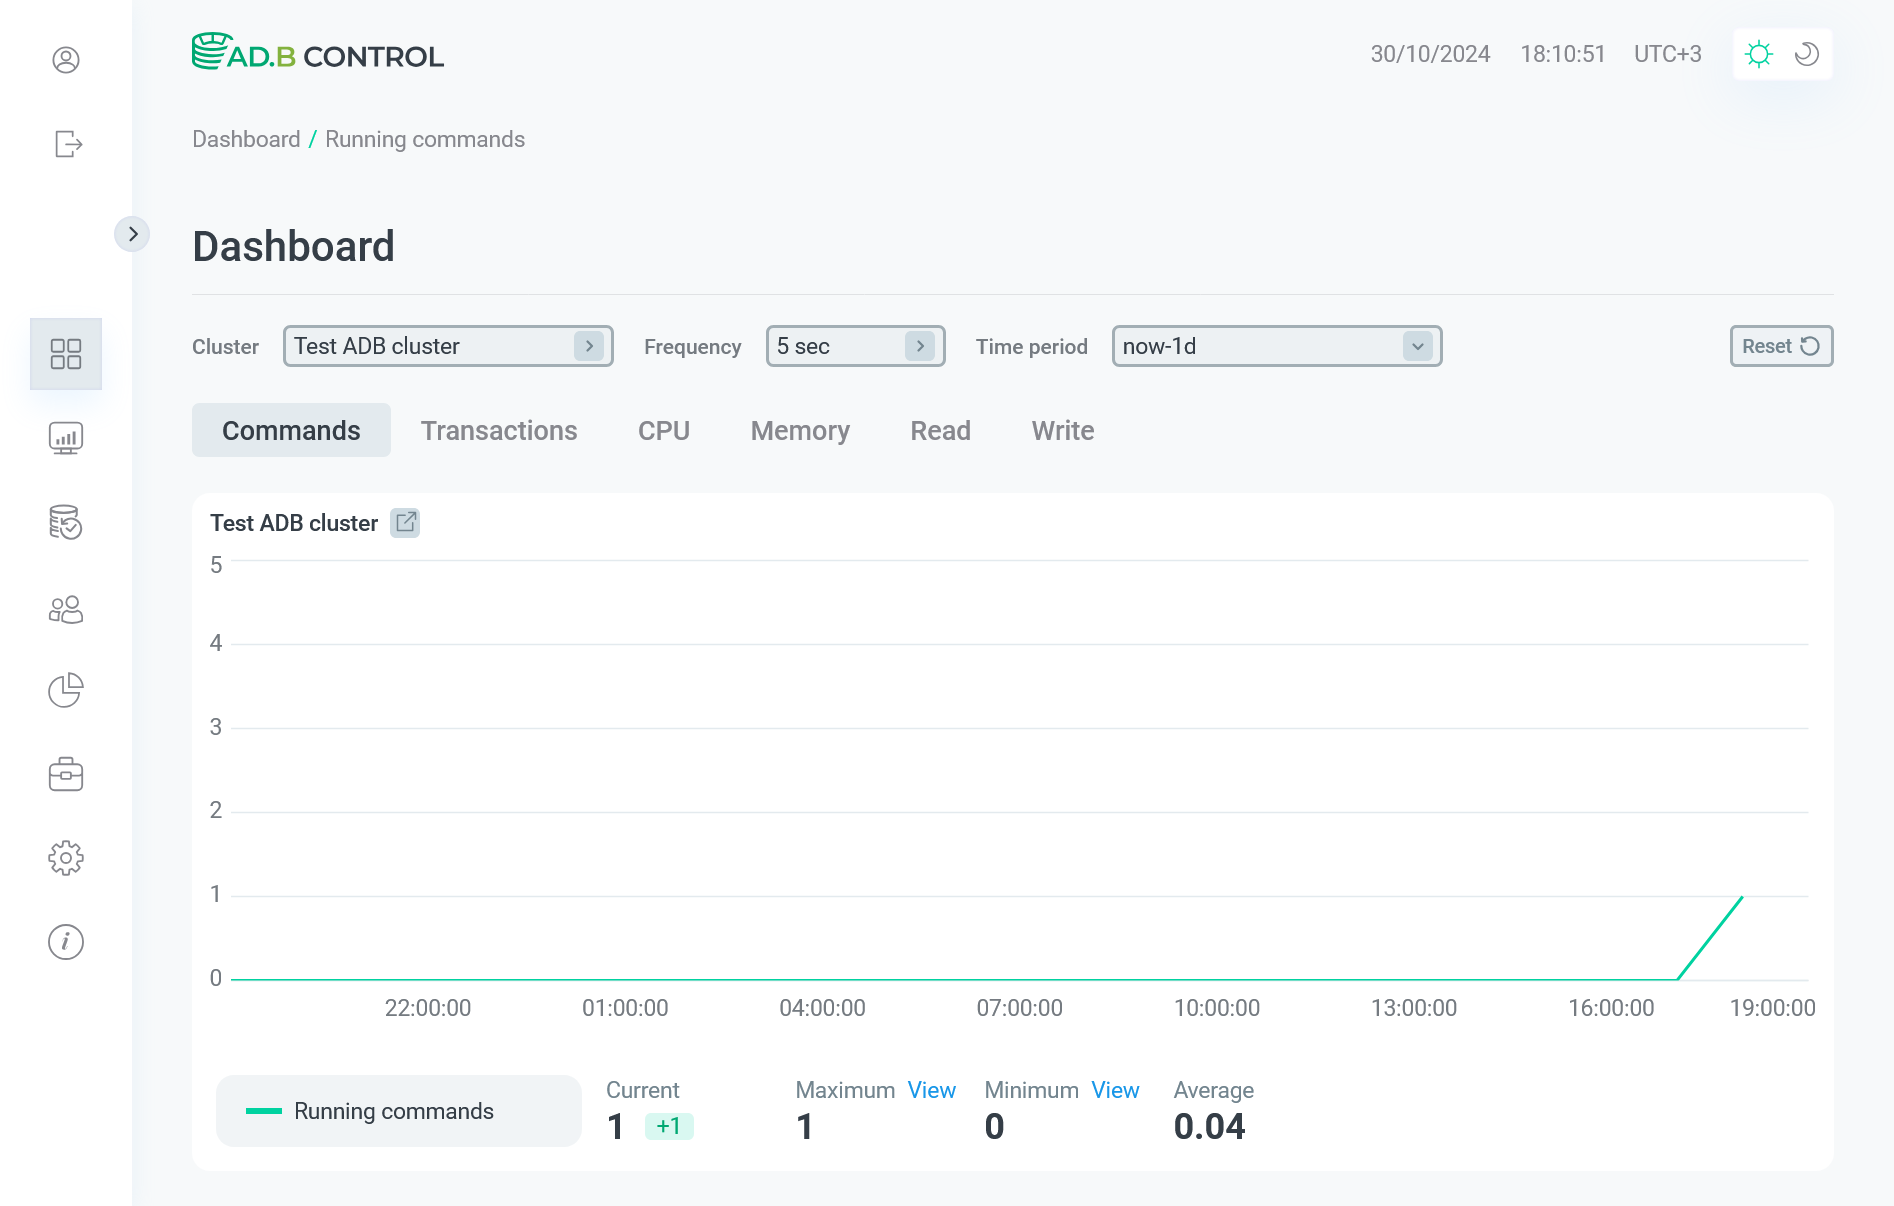
To configure charts, you can use the following fields in the top part of the page:
-
Cluster — the ADB cluster for which all charts should be drawn. The default cluster can be selected in the ADB Control settings.
-
Frequency — defines how often to update charts.
-
Time period — the time period for which a chart is required. In the window that opens after clicking the field, you can select an interval from the offered options or set the custom time range.
-
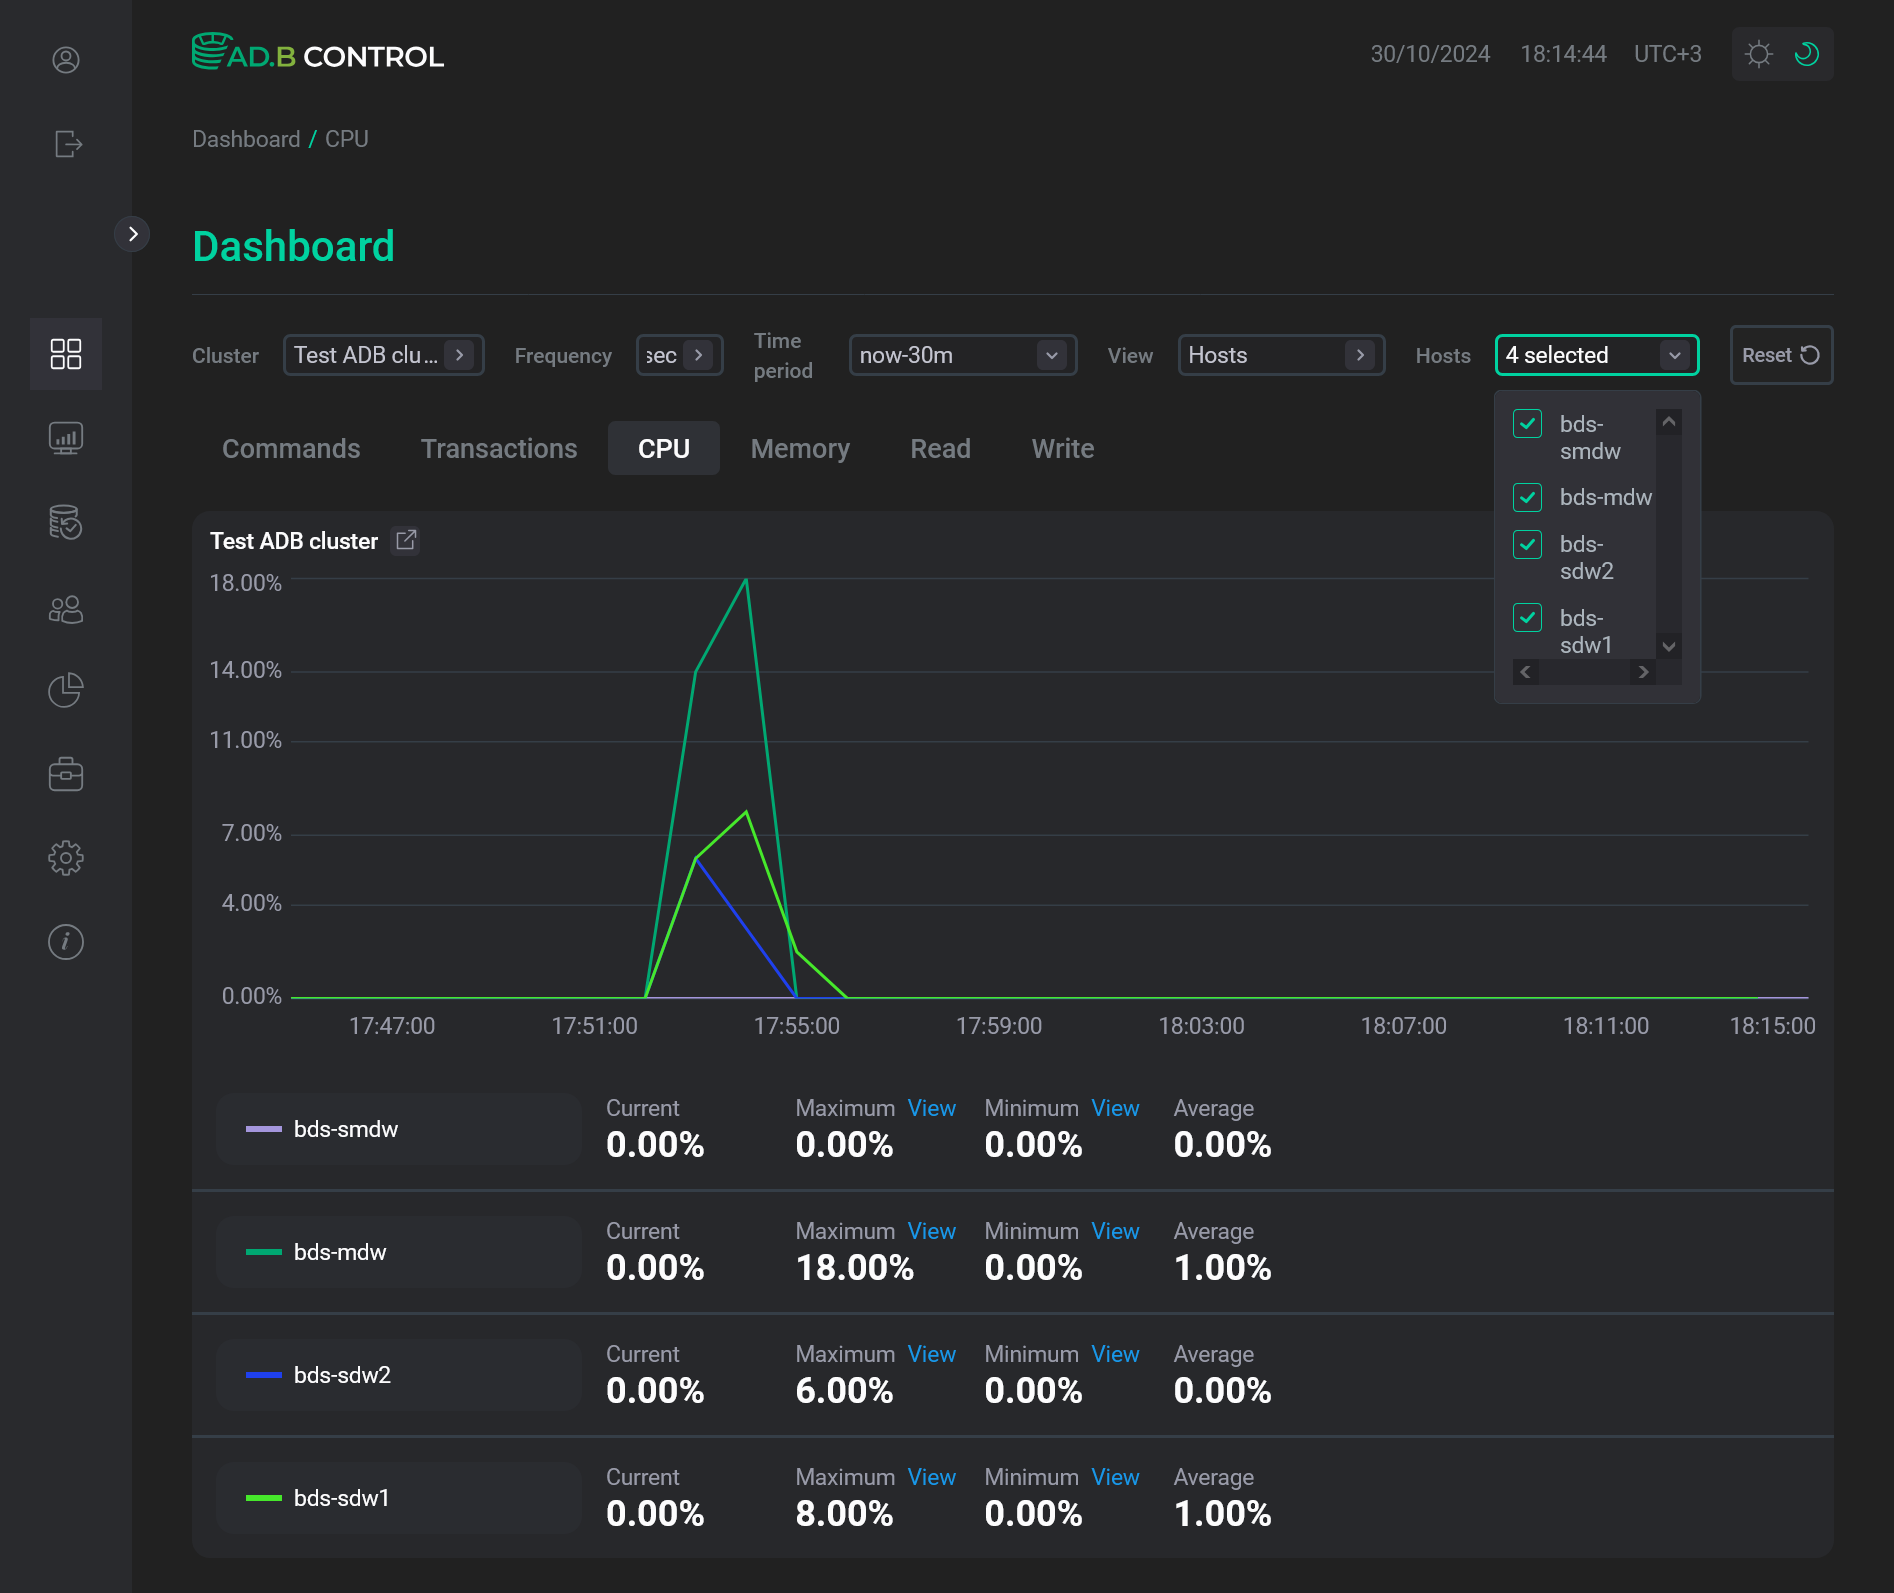
View — defines how to display charts. The field is hidden on the Commands and Transactions tabs. Possible values:
-
Summary— display a summary chart for the whole ADB cluster. -
Hosts— display information for each cluster host in the form of separate charts.
-
-
Hosts — the drop-down list that is used to select cluster hosts. Becomes enabled if the
Hostsvalue is selected in the View field.
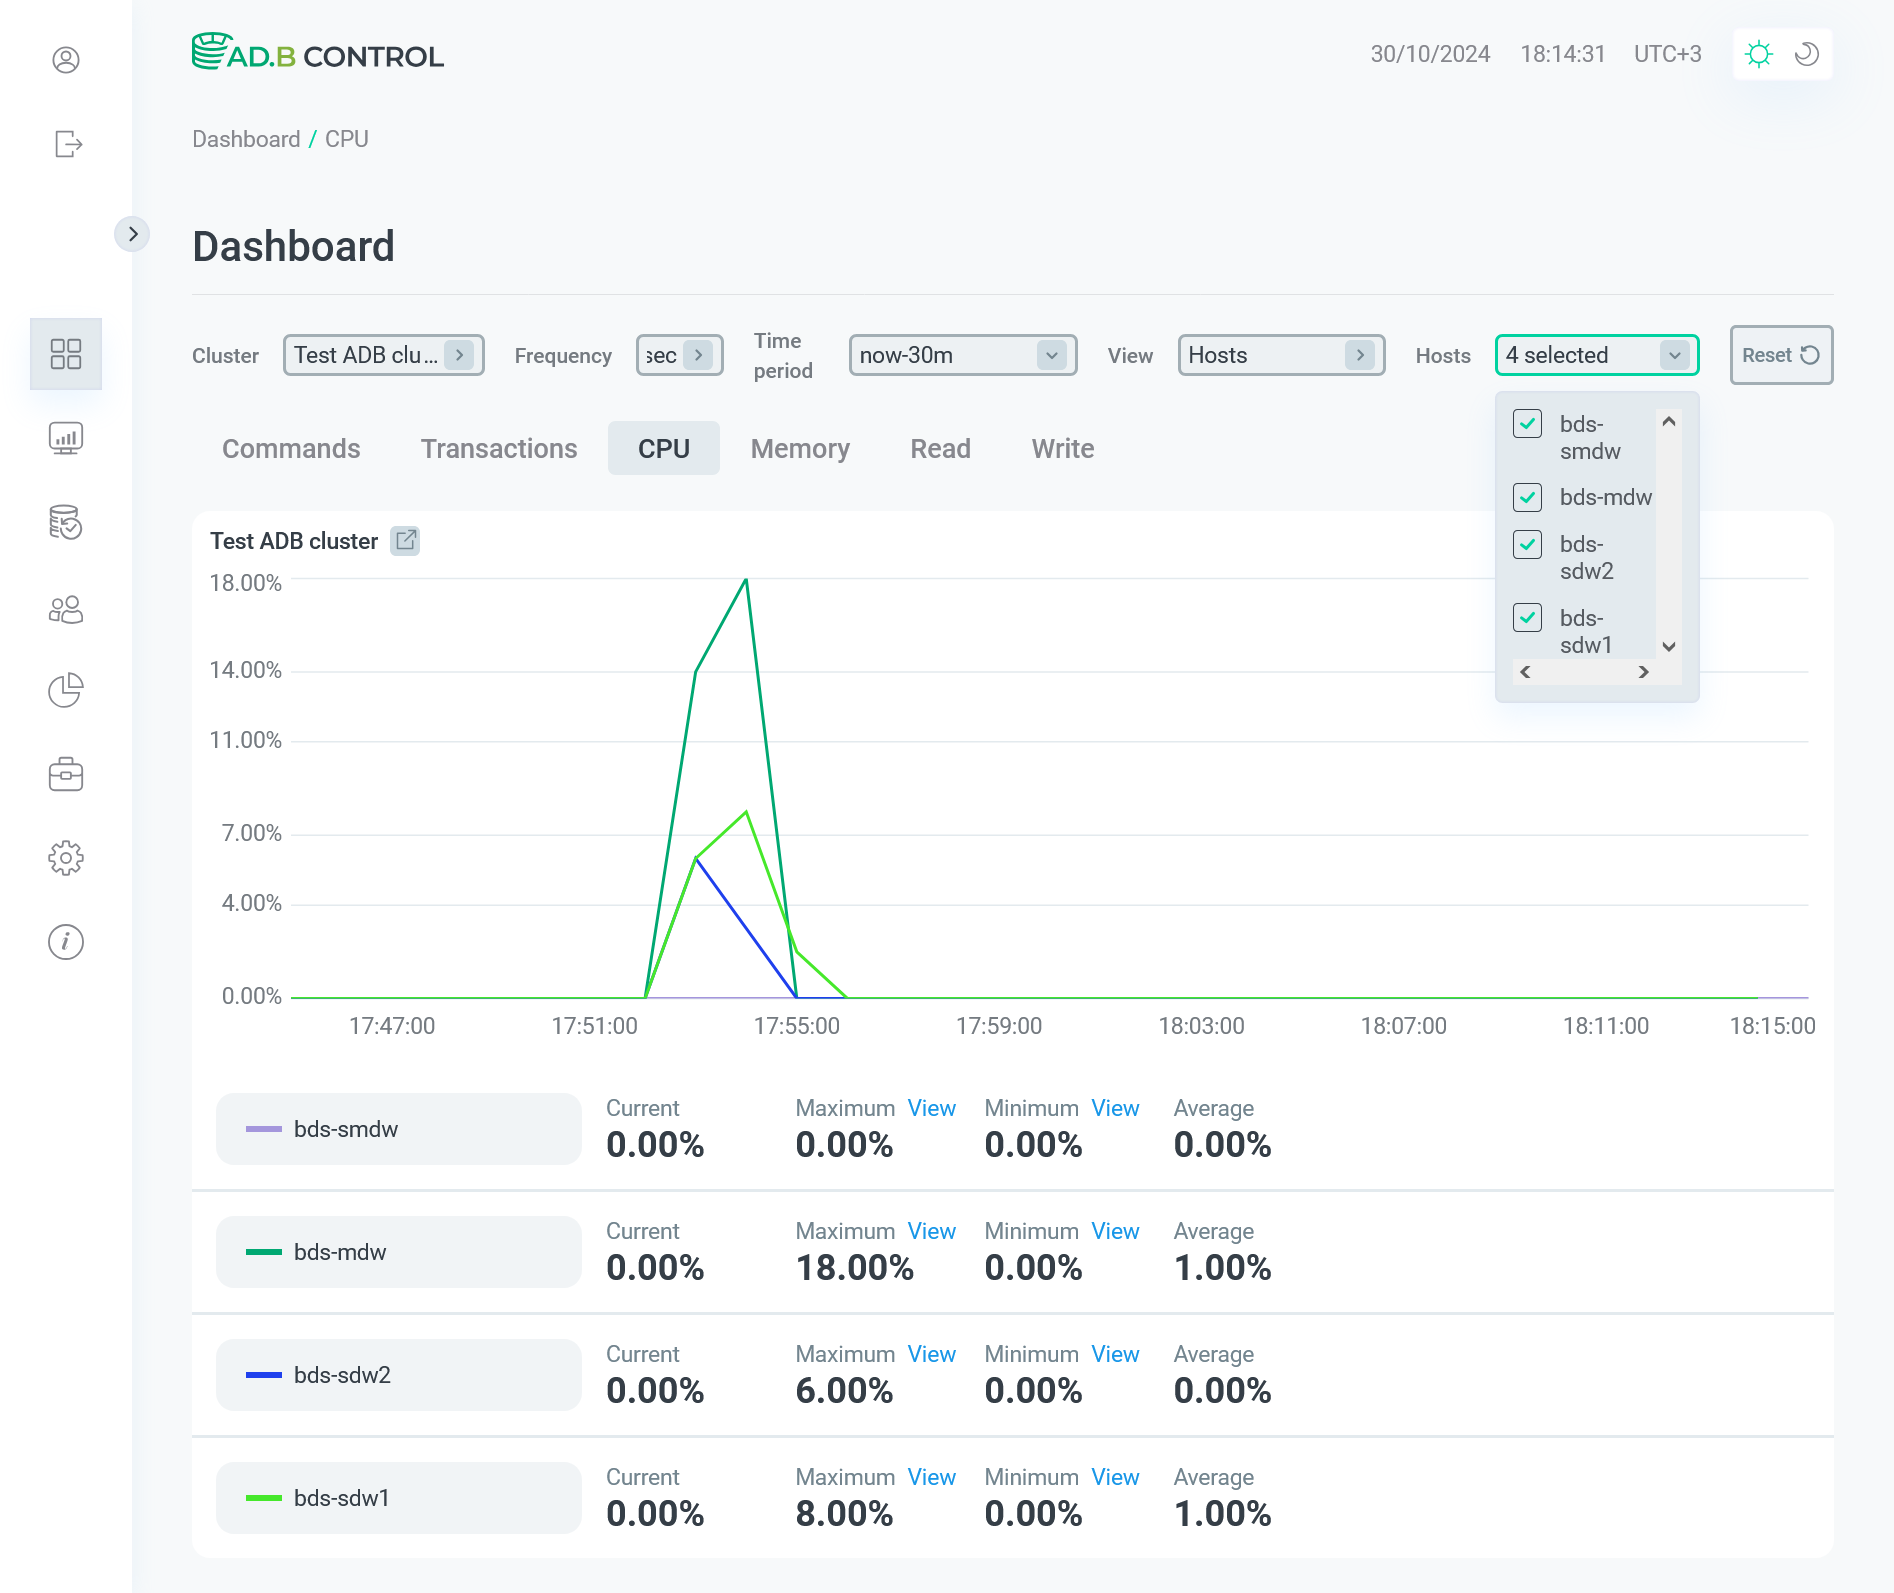
The figure below shows the option of displaying chart information in the context of cluster hosts.
On each tab, you can see the following information under charts:
-
Current — the last metric value received over the selected time period. To the right of the current value, you can see a special indicator that shows the difference between the previous and current metric values (if any).
-
Maximum — the maximum metric value received over the selected time period. By clicking View, you can head to the maximum value on the chart.
-
Minimum — the minimum metric value received over the selected time period. By clicking View, you can head to the minimum value on the chart.
-
Average — the average value, which is calculated based on all metric values received over the selected time period.


Below, you can see how to highlight the maximum or minimum metric value on the chart by clicking View.
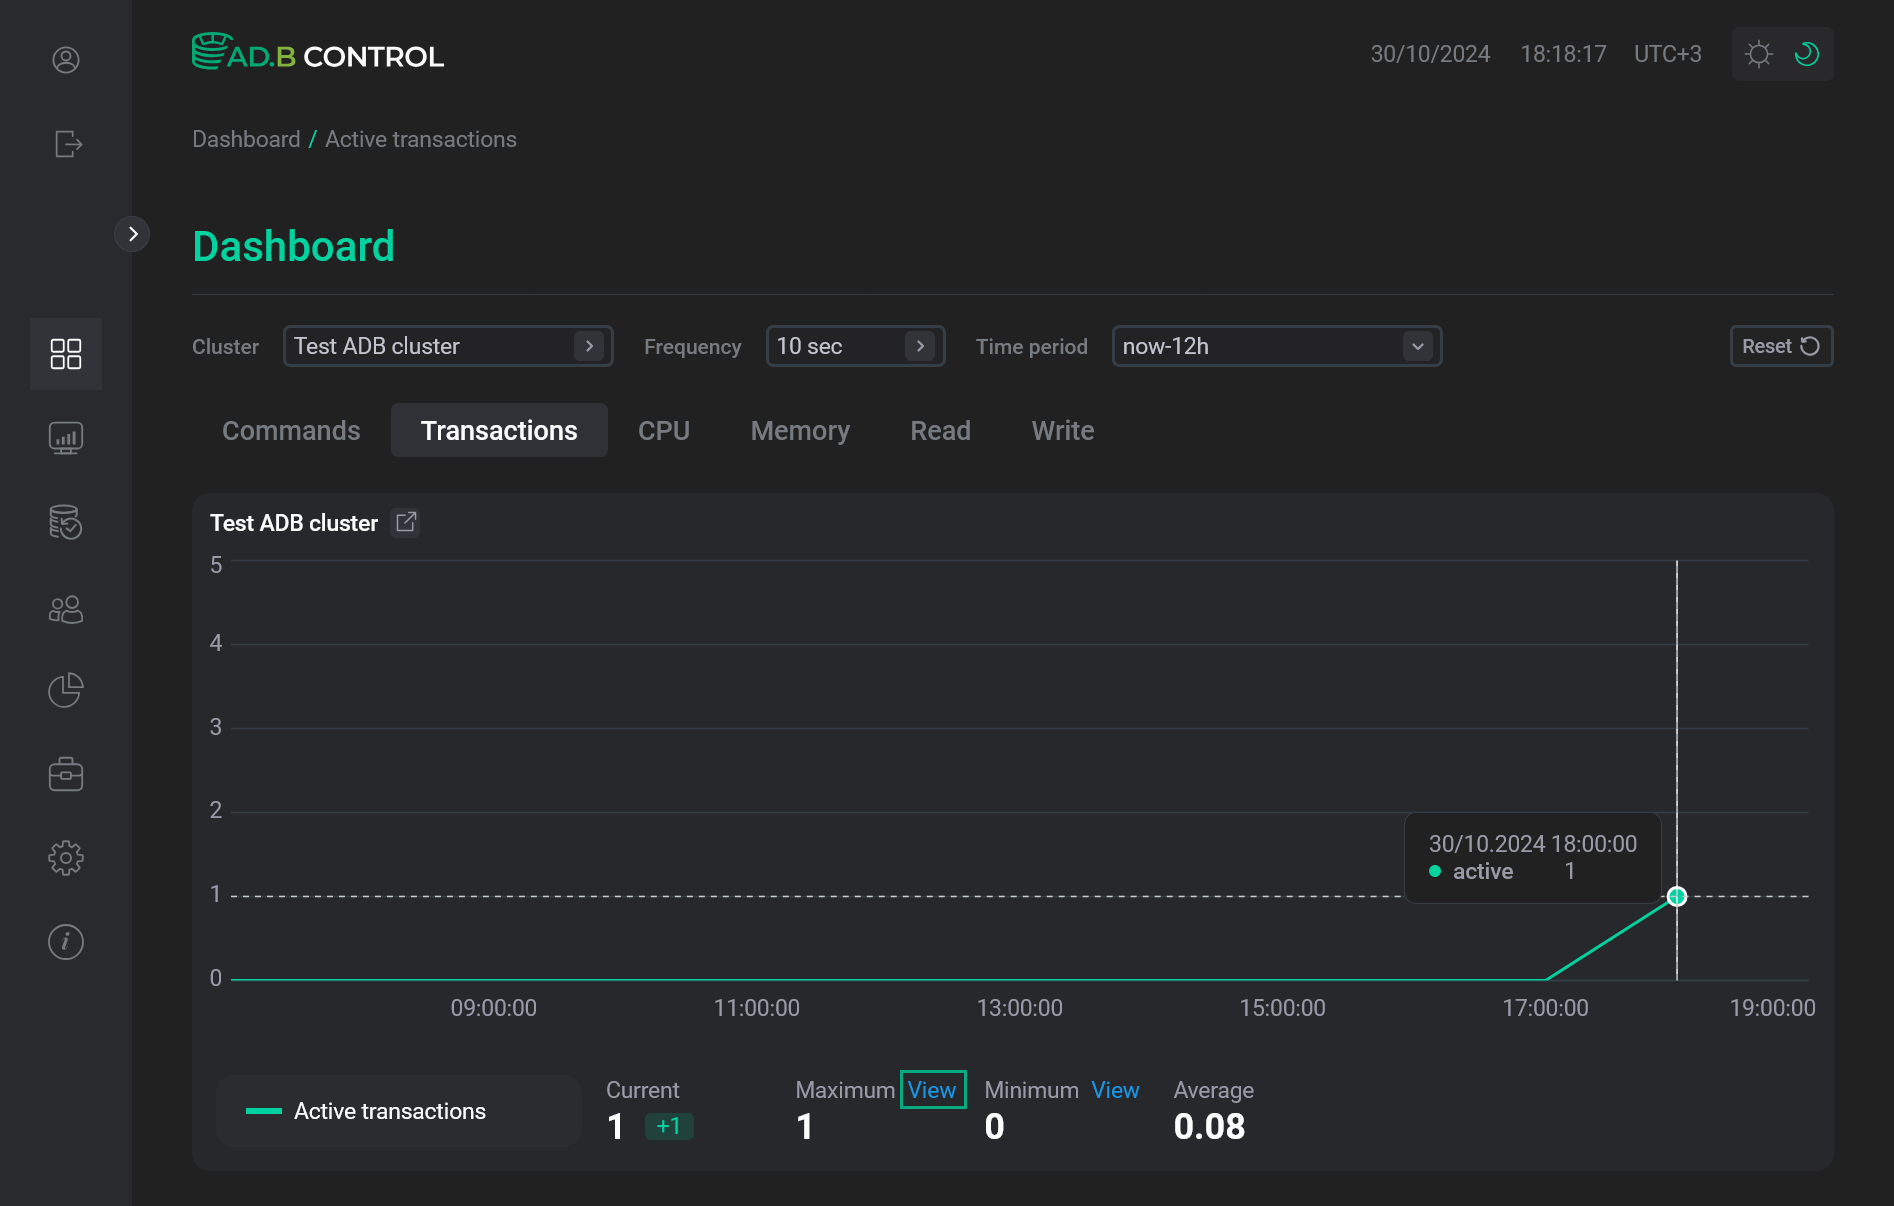
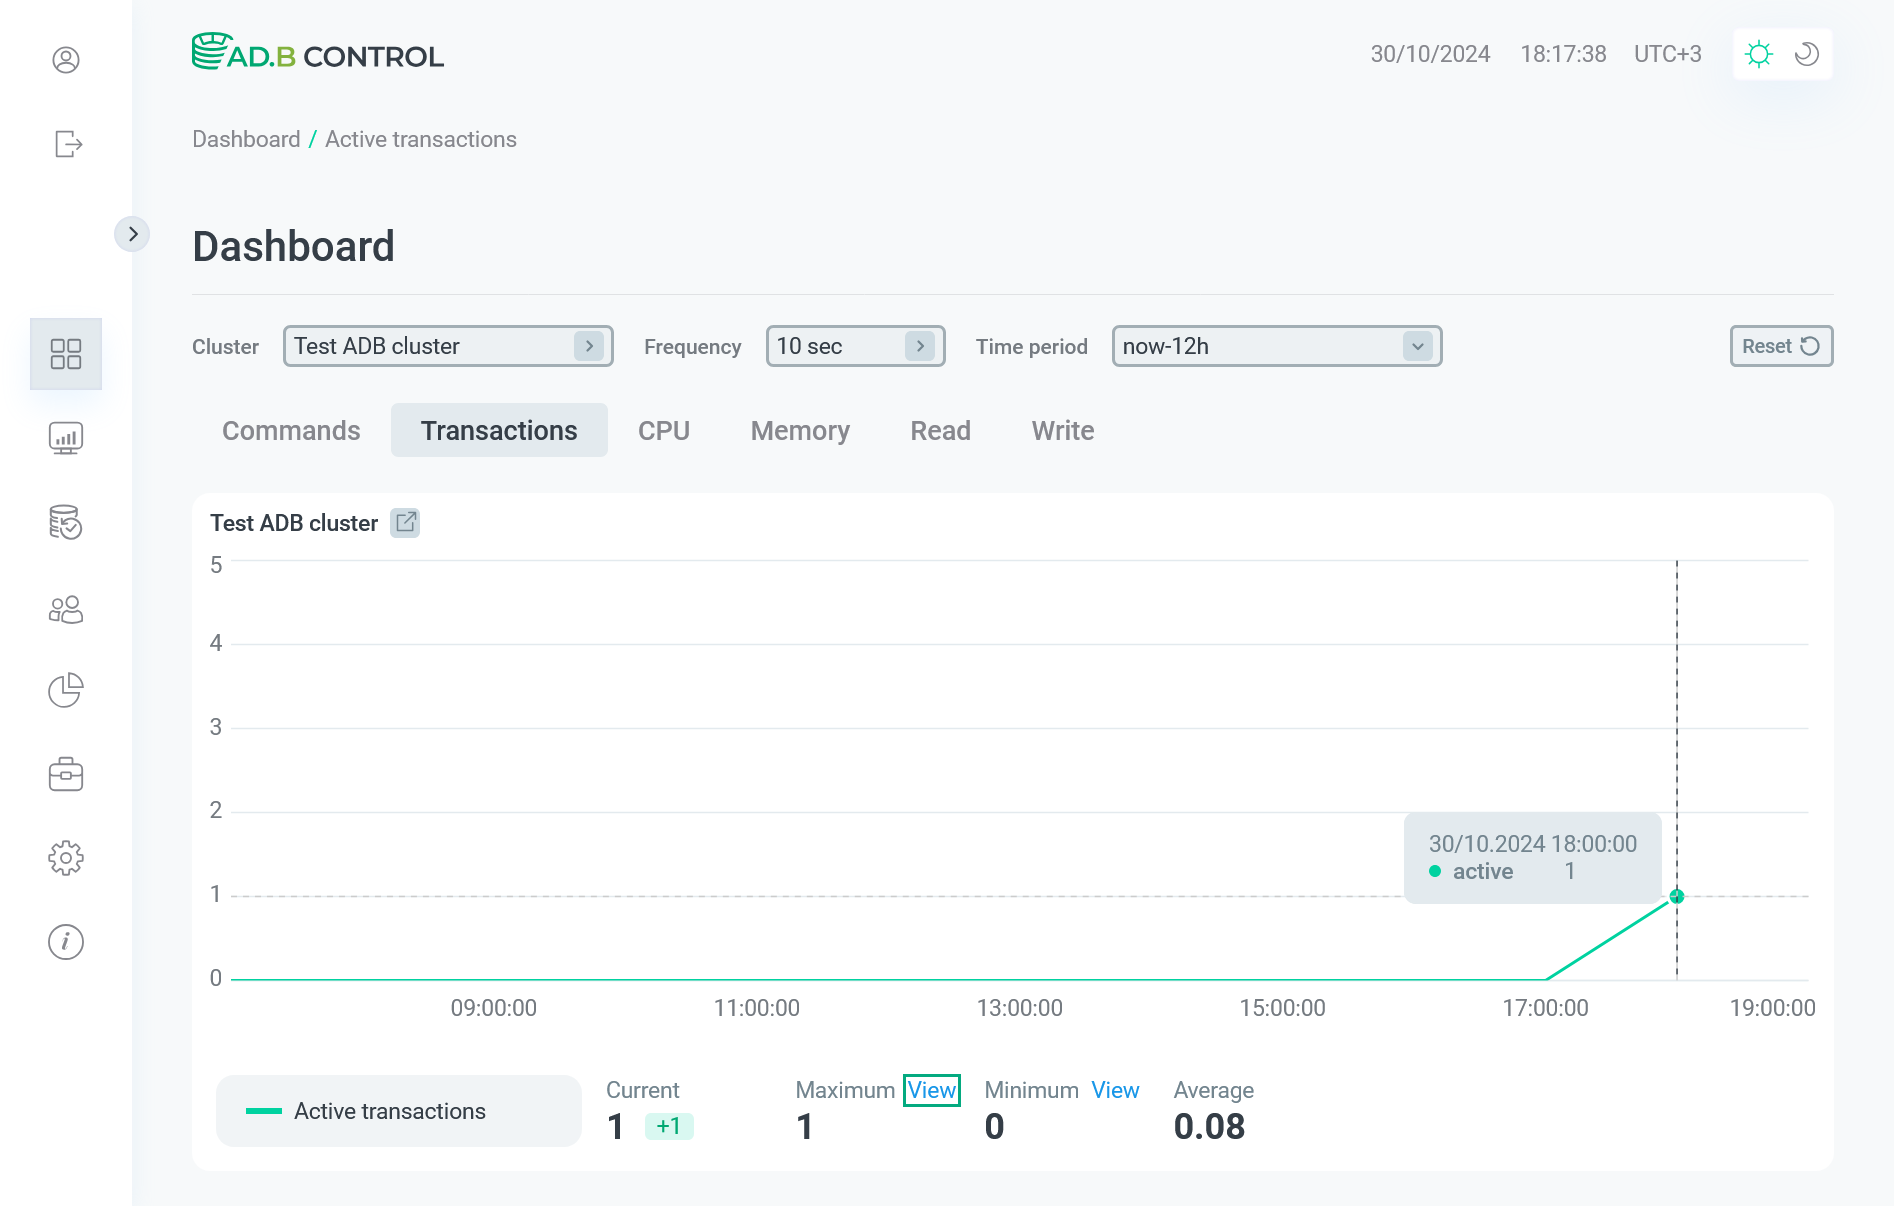
You can also see a metric value for any other time point by hovering the mouse over the chart.