

Monitoring of commands
The Monitoring → Commands page in the ADB Control web interface displays the SQL commands that are performed in the ADB clusters connected to the monitoring system. This page includes two tabs:
Queries
The Queries tab displays SQL commands. It includes two tabs, Online and History, described in detail below.
Online
The Monitoring → Commands → Queries → Online tab displays commands in the following statuses:
-
Queued— the commands on which information about the actual start of execution has not yet received. -
Running— the commands that are currently running. -
Cancelling— the commands that are currently cancelling (as a part of the transaction cancellation or termination).
At the top of the tab, the Current count field is located. It displays a total count of online commands in ADB clusters connected to the monitoring system.
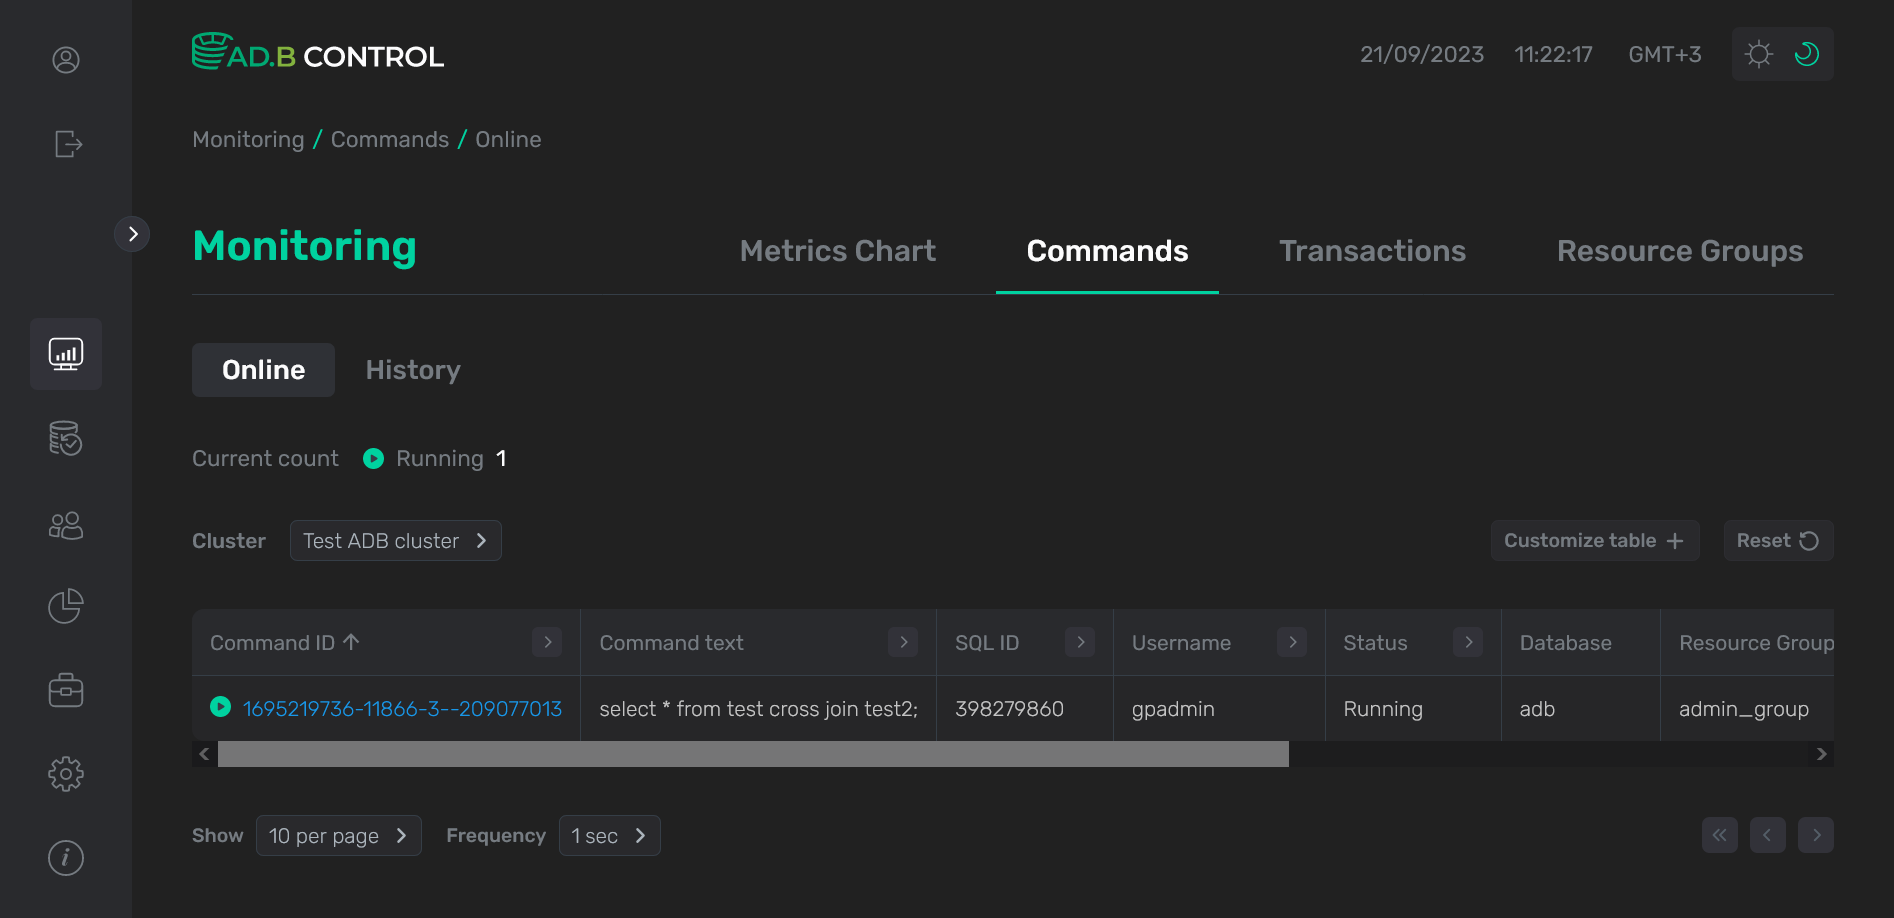
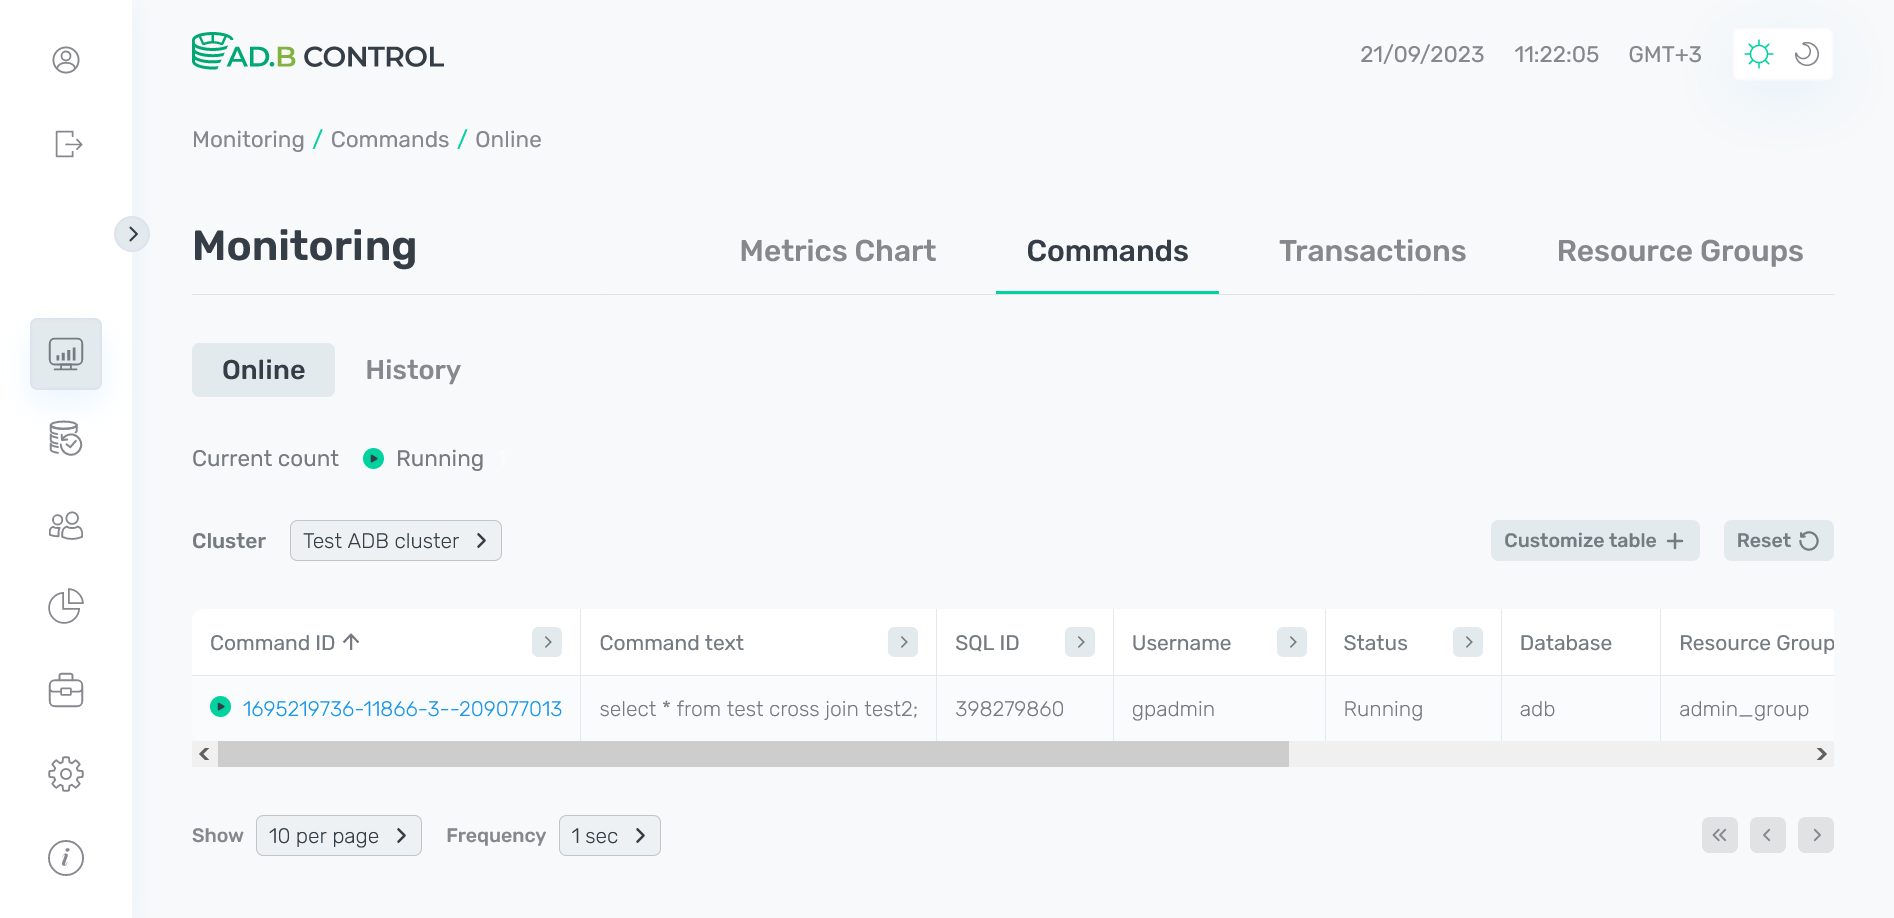
On the Monitoring → Commands → Queries → Online tab, there is a table with the following information on commands.
| Field | Description |
|---|---|
Command ID |
A unique command identifier, which includes:
|
Command text |
The first symbols of a command text. To view the full text (in case of long queries), hover the mouse over the field value |
SQL ID |
A common identifier for SQL commands with the same structure |
Username |
A name of the user who started the command |
Status |
A command status. Possible values are listed above |
Database |
A name of the database where the command is launched |
Resource group |
A name of the resource group that is used for the command |
Cluster |
A name of the ADB cluster where the command is launched |
Planner |
A name of the query optimizer that is used to produce the query execution plan. Possible values:
|
Submitted |
The timestamp when the user submitted the command (in the |
Tags |
The command tags |
Run time |
A total command duration in hours, minutes, seconds |
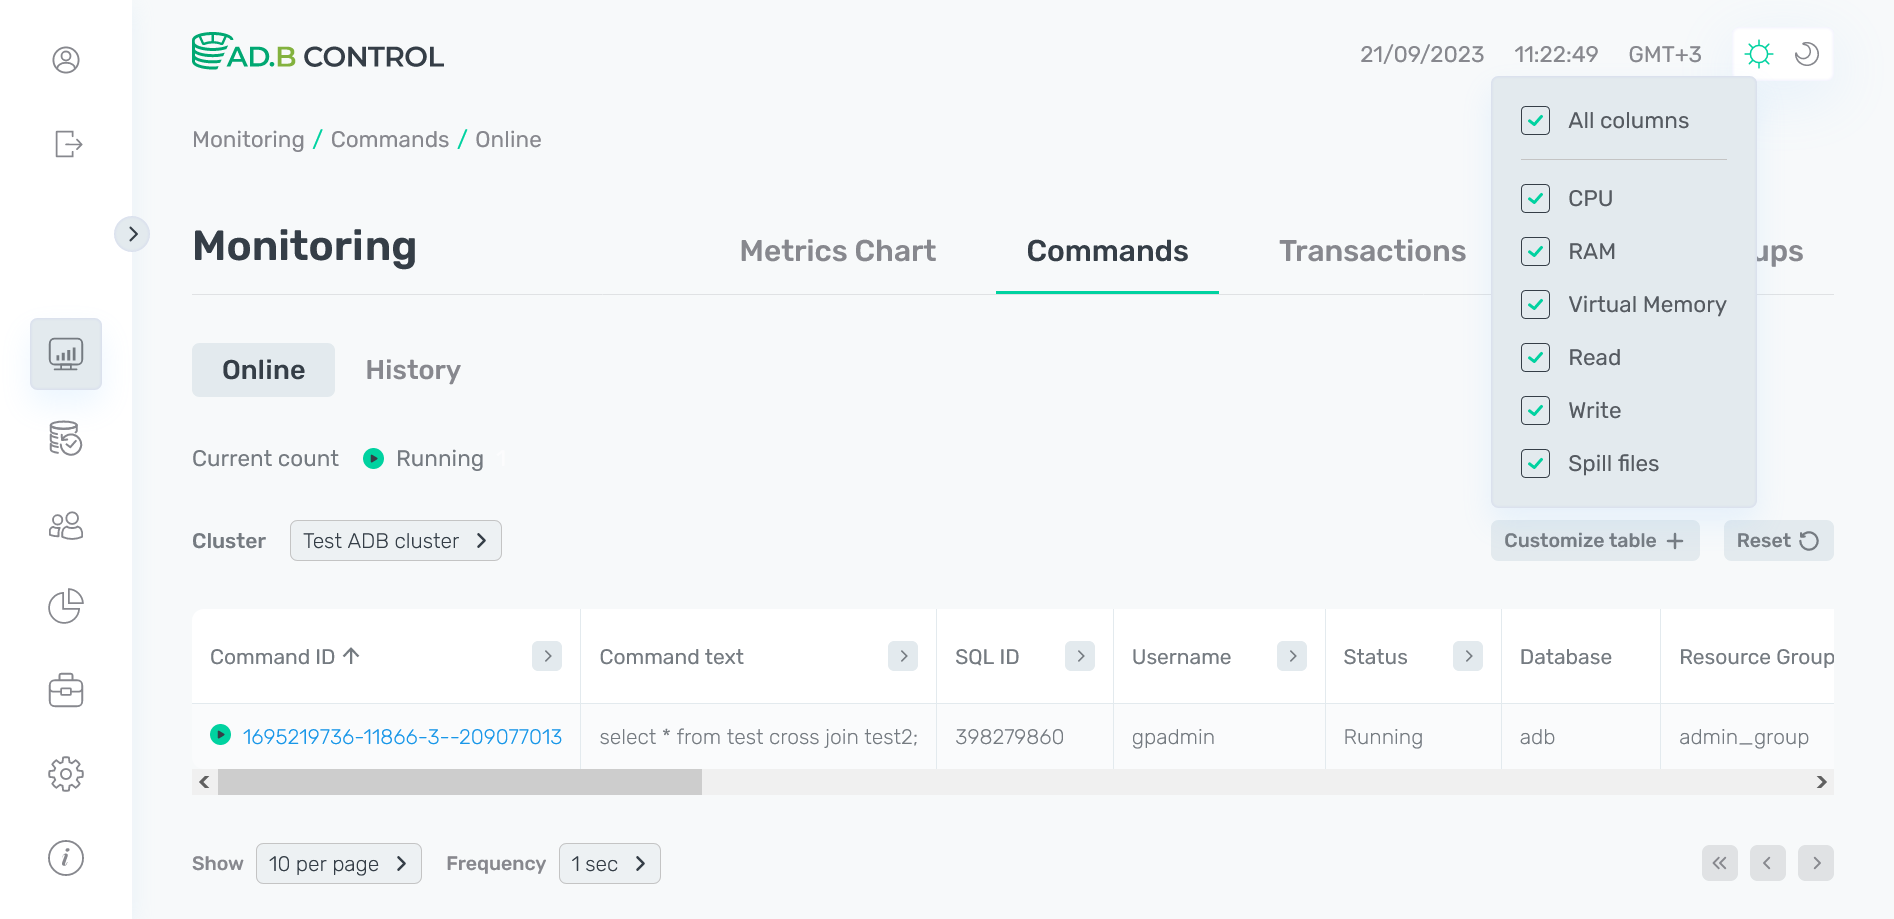
If necessary, you can add columns to the table. To do this, click Customize table and select column names in the section that opens. Currently you can add system metrics that are described below.
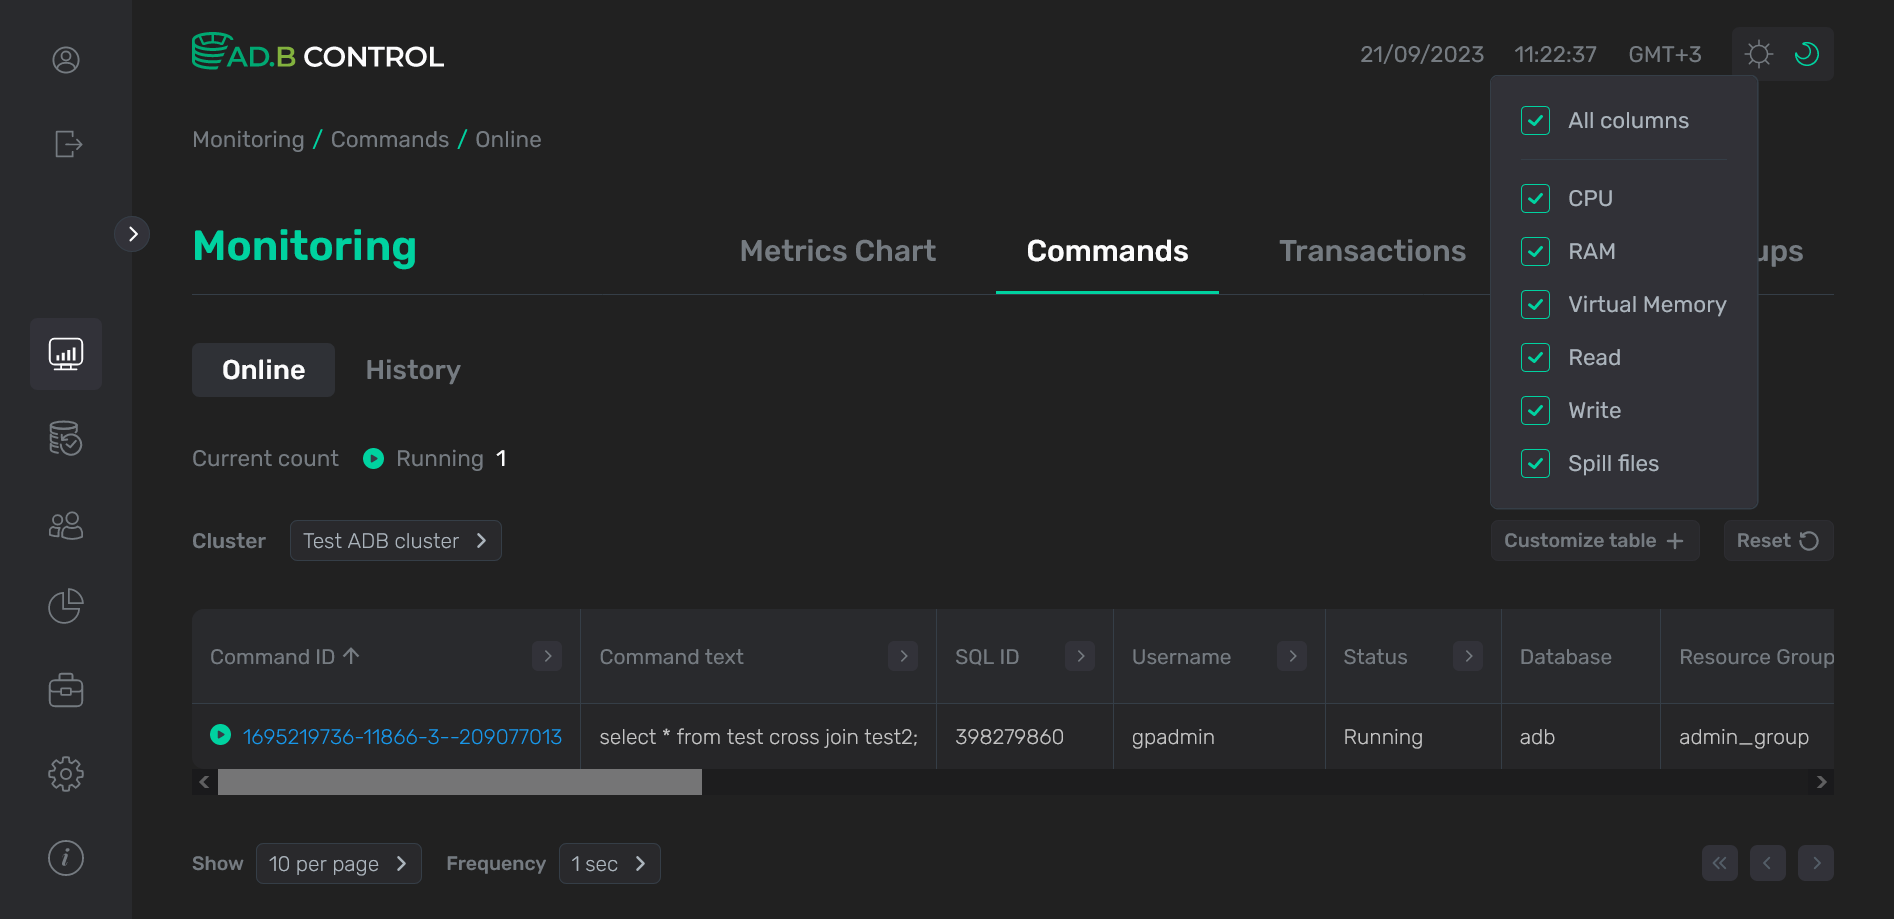
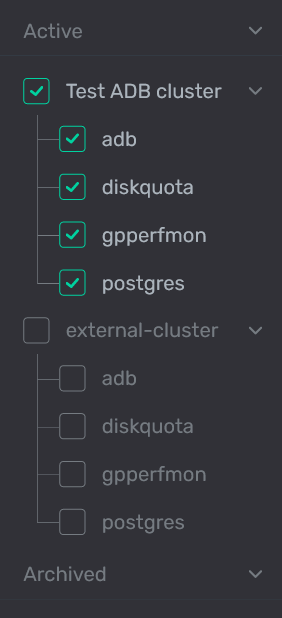
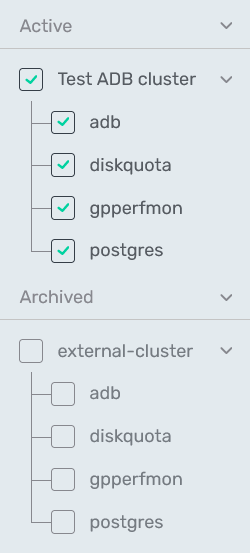
Above the table with a list of commands, the Cluster filter is located. You can use this filter to select the ADB cluster and its databases for which you want to display data in the table. Initially all databases of the default cluster are selected.
In the column headers of the table with a list of commands,
there are filters that you can use to select specific data. To open a filter, click the
icon. For those columns where the set of possible values is limited (e.g. Status), you can select a value from the drop-down list.
For some columns (e.g. Username), the search value should be entered.
For columns that show date and time (e.g. Submitted), the time range can be selected from the calendar.
The
icon means that a filter is defined for the column. To reset all filters, click Reset.
History
The Monitoring → Commands → Queries → History tab displays commands in the following statuses:
-
Done— successfully completed commands. -
Cancelled— cancelled commands (as a part of the transaction cancellation or termination). -
Error— the commands during which some errors occurred. -
Unknown— the commands, the final status of which is undefined. It is set on a timeout for queries in theQueued,Running,Cancellingstatuses, for which there are no corresponding rows in thepg_stat_activityview.
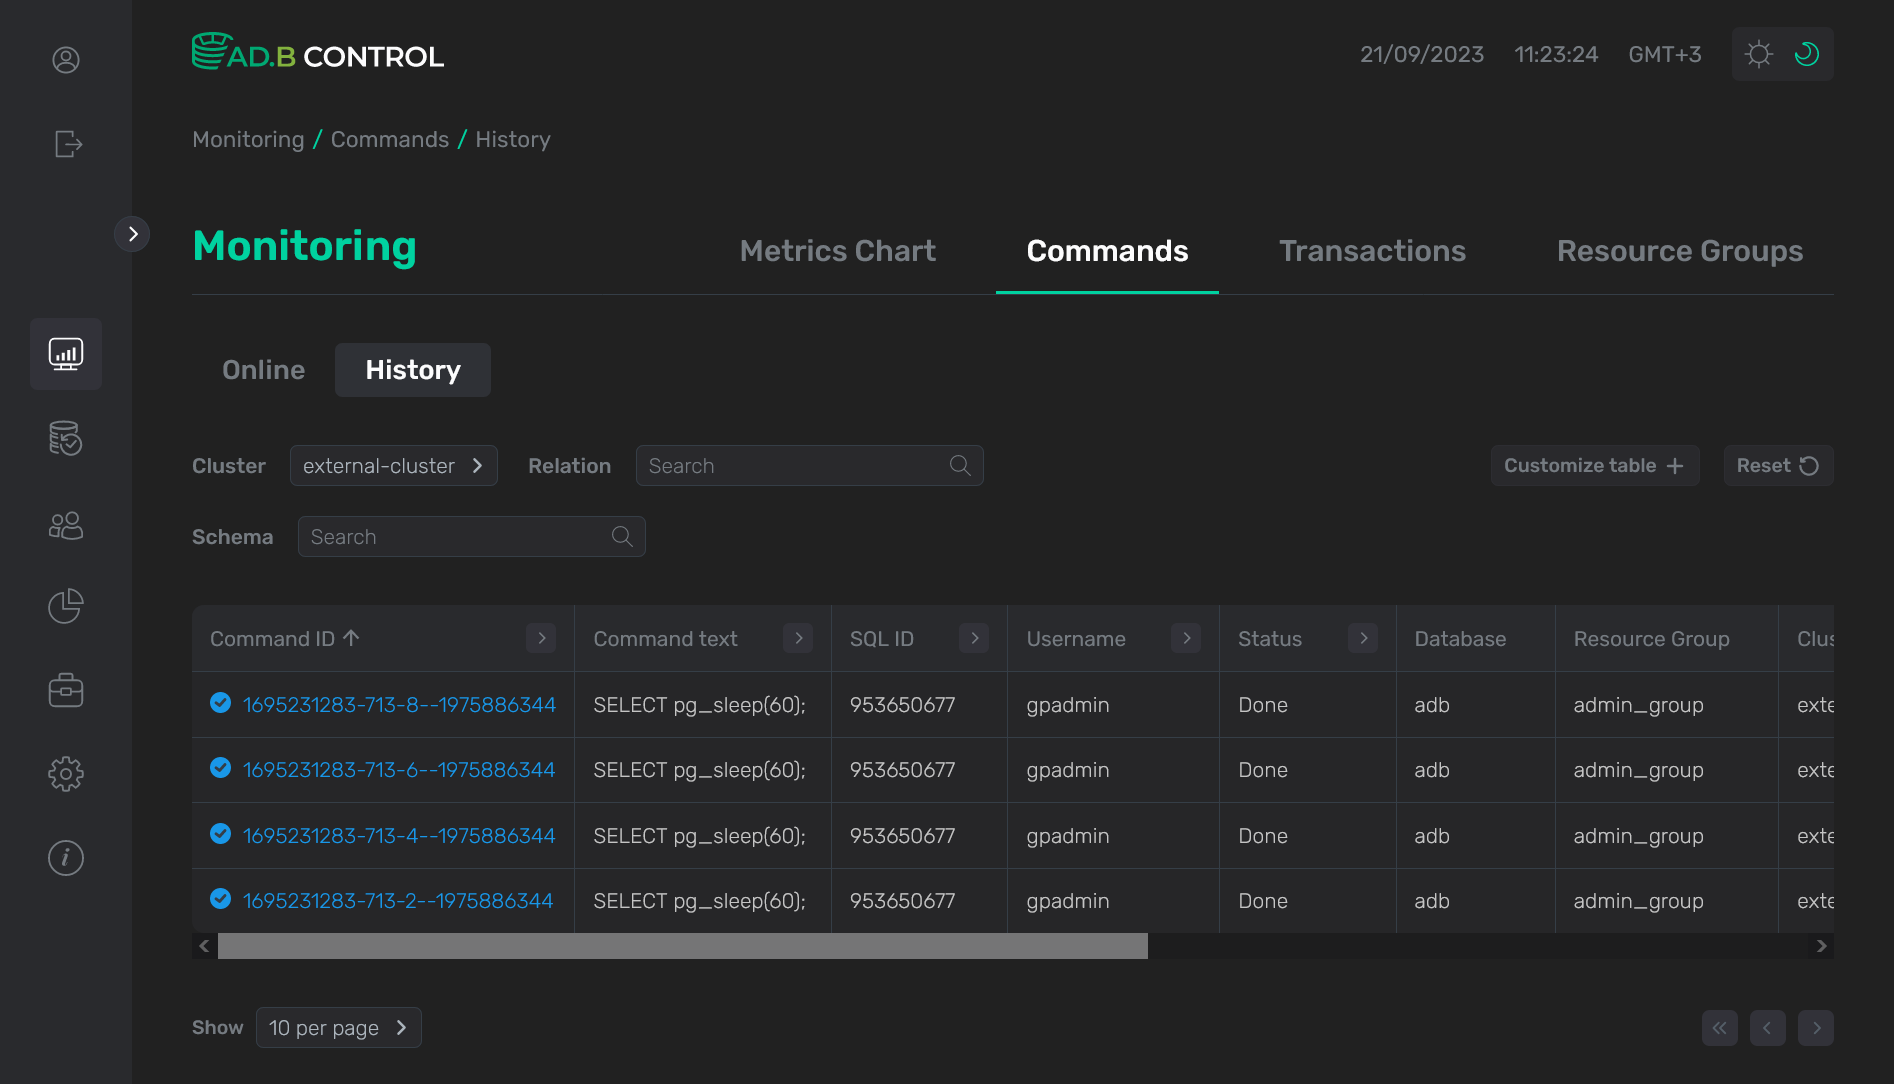
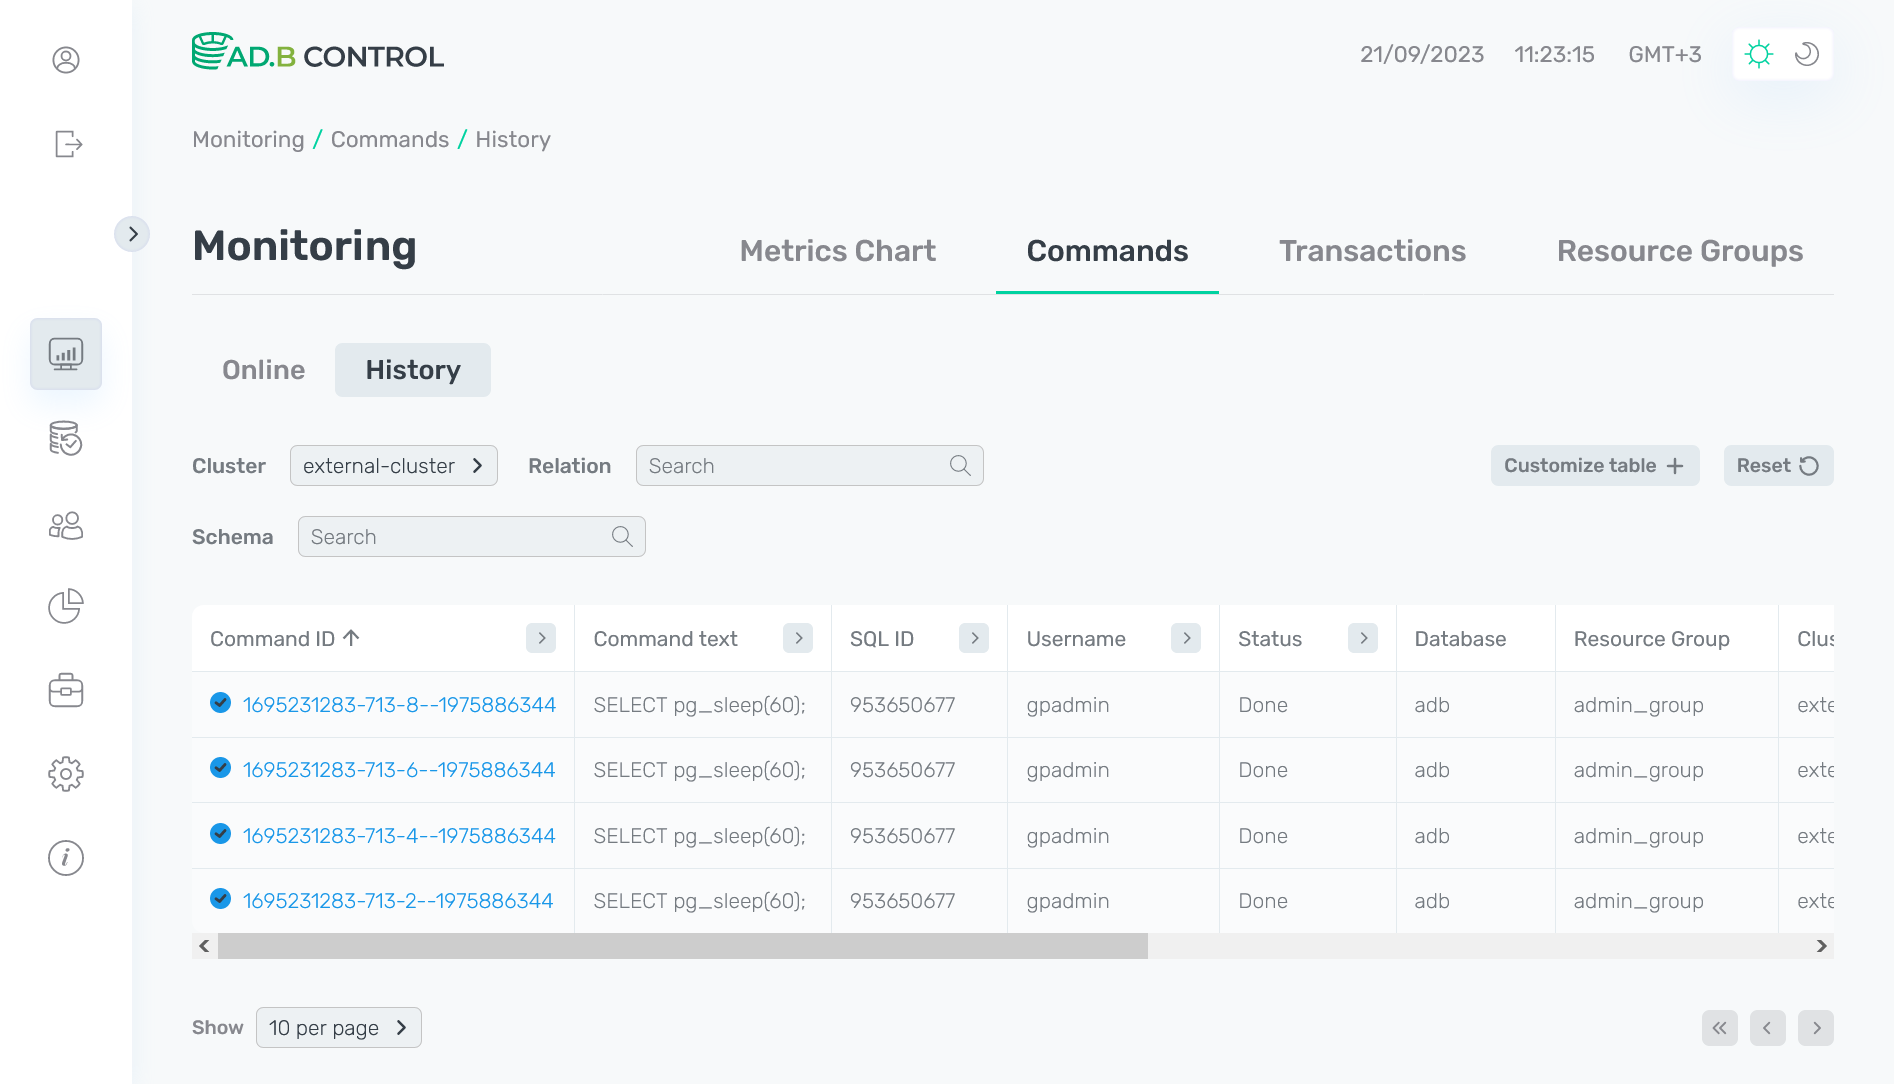
Most of the fields in the table with the list of commands on the History tab match the fields that are described above for the Online tab. Additionally, the following field is available:
-
Ended — a command end timestamp in the
DD/MM/YYYY HH:mm:ssformat. The field is filled in both as a result of successful execution and in case of error or cancellation.
Like on the Online tab, you have the ability to add additional columns to the table by clicking Customize table.
Above the table with a list of commands, there are filters that you can use to select specific data. In addition to the Cluster filter described above, the History tab contains the following filters:
-
Relation — filter by the relations that are used in commands. Enter a full value.
-
Schema — filter by the database schema, to which the relations used in commands belong. Enter a full value.


Command details
To view the command details, click the command identifier (Command ID) in the table on the Monitoring → Commands → Queries → Online or Monitoring → Commands → Queries → History tab.
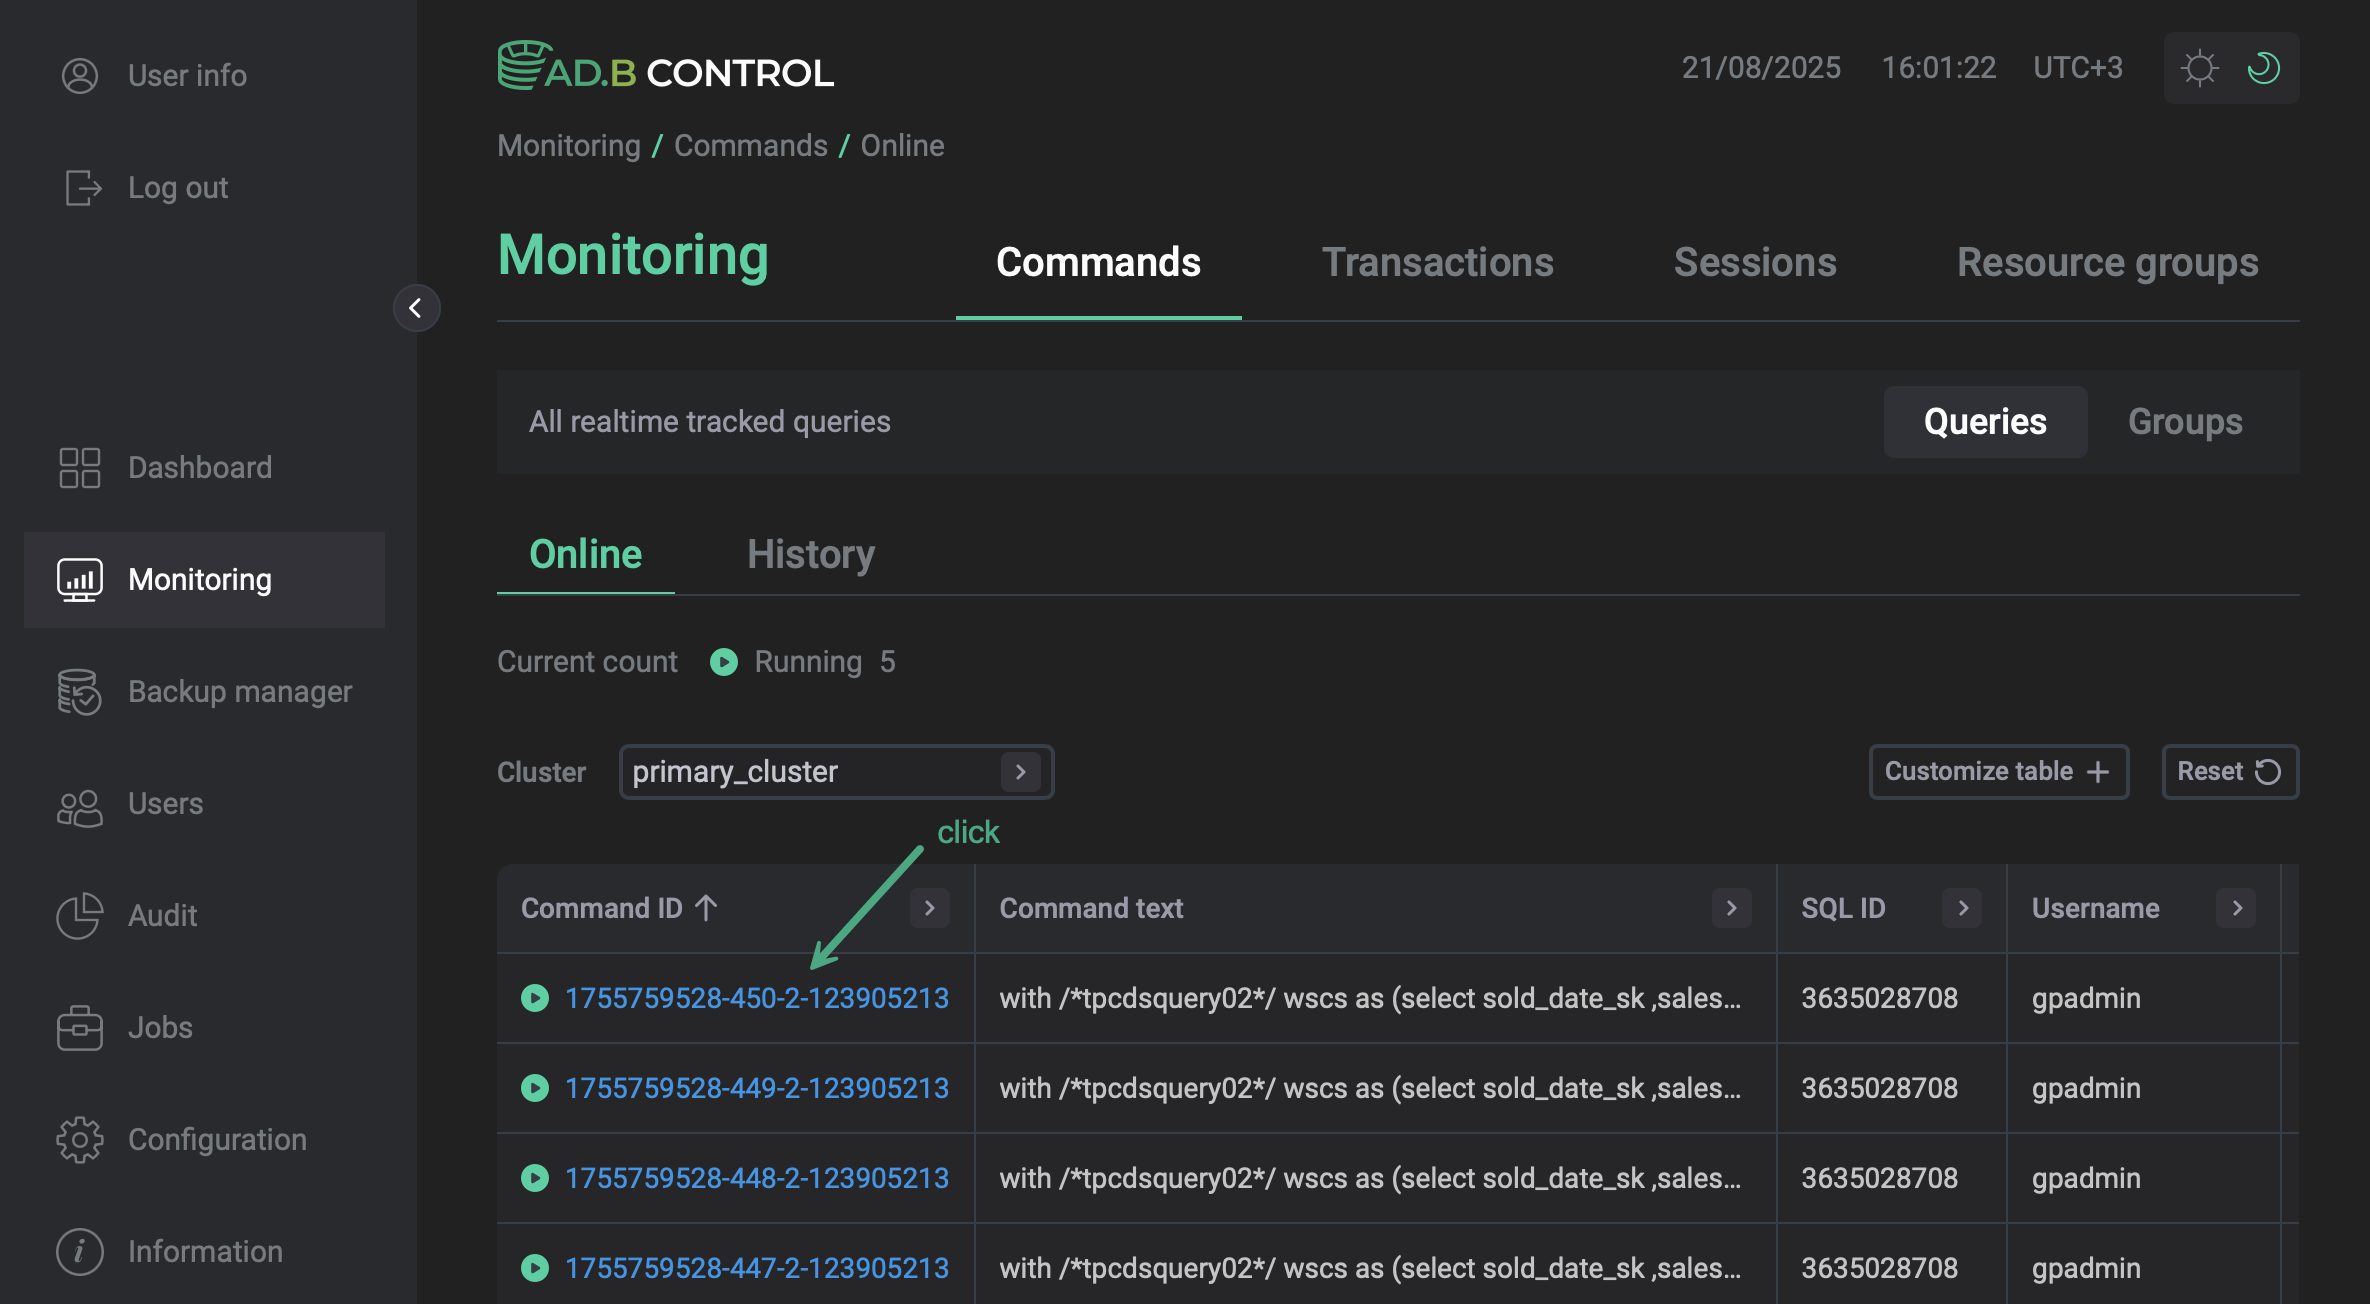
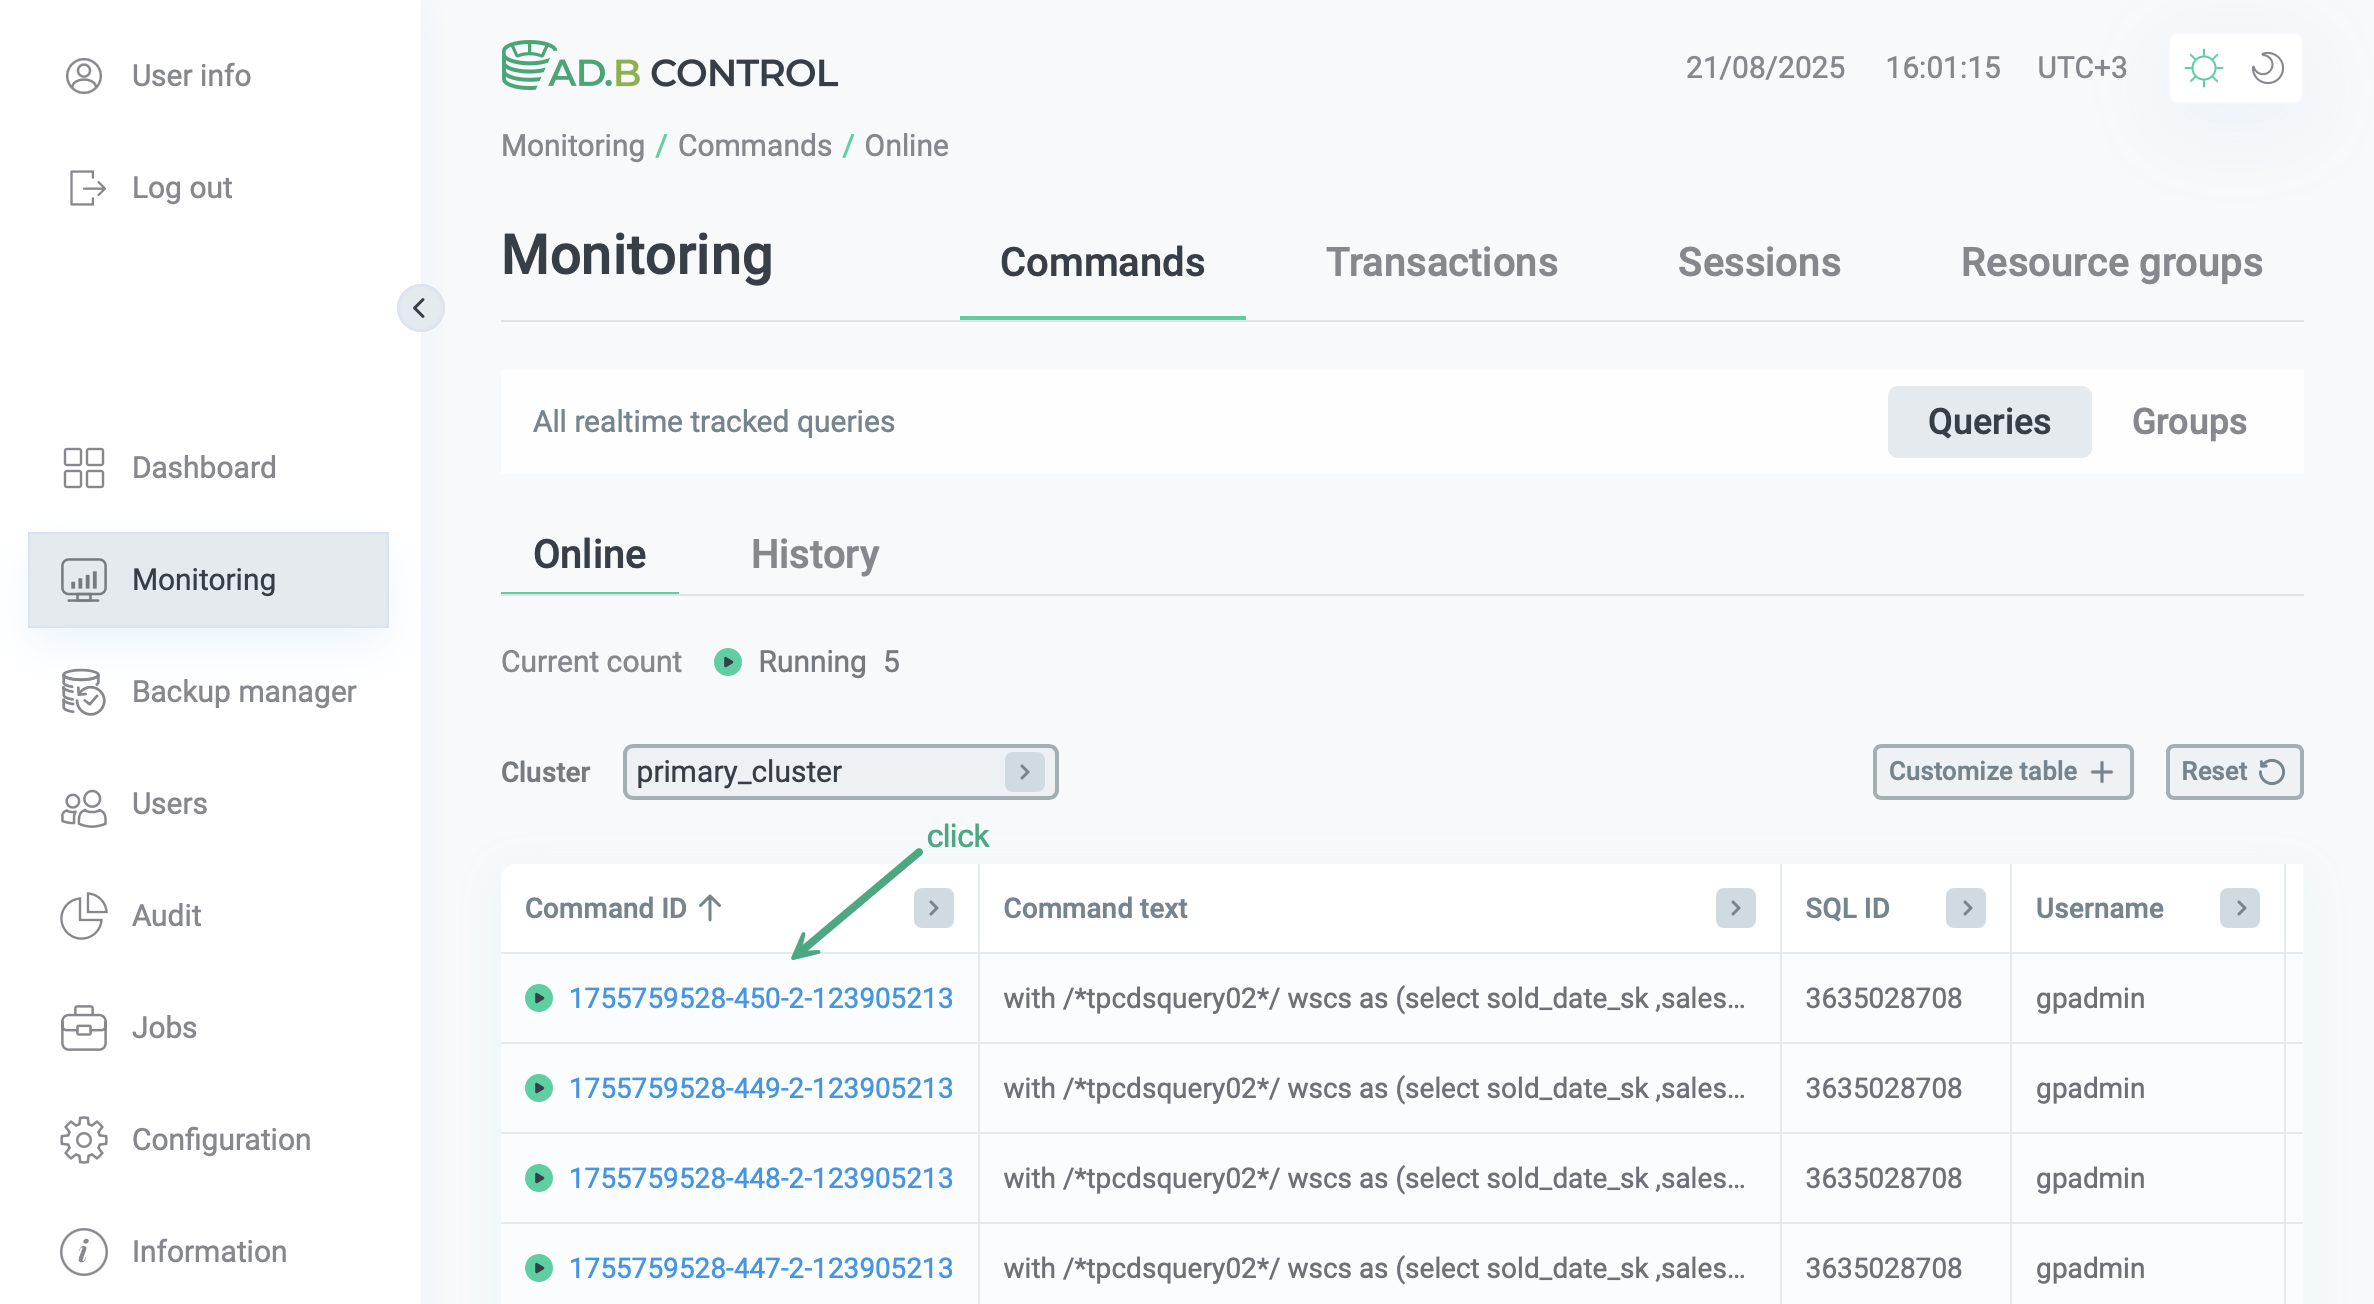
The following page contains multiple sections that are described below.
Header
At the top of the page, the following information is displayed:
-
The command unique identifier (see Command ID above). In the example below —
1695219736-11866-3—209077013. -
The command status (see Status above). In the example below —
Running. -
The command sequence number in ADB Control (starting with
1). The continuous numbering is used across all clusters. In the example below —2683. -
Transaction ID — the transaction identifier. To view transaction details, click the identifier.
-
Run time — the command duration in hours, minutes, seconds.


Overview
The Overview section displays the general command information. In addition to the fields mentioned above, the following information is available:
-
Run time — the command duration in hours, minutes, seconds.
-
Est. progress — the progress of the command execution, which is calculated as a percentage of the time predicted by the query planner. The following formula is used:
where:
-
Est.Cost(x)— the estimate of the plan node cost made by the planner. -
NodeProgress(x)— the progress for each node of the query plan, which is calculated by the following formula:where:
-
ActualRows— an actual number of processed table rows (tuples). -
EstimatedRows— the planner’s assumption of the number of rows (tuples) that will be processed for the current plan node.
-
-


If the command fails (has the Error status), the error message can be found below the Overview section table.


Performance
The Performance section displays the statistics of system resource consumption by the selected command. The metrics available for monitoring are listed in System metrics collected for commands.
At the top of the Performance section, the average metric values with skews for all cluster segments are displayed.
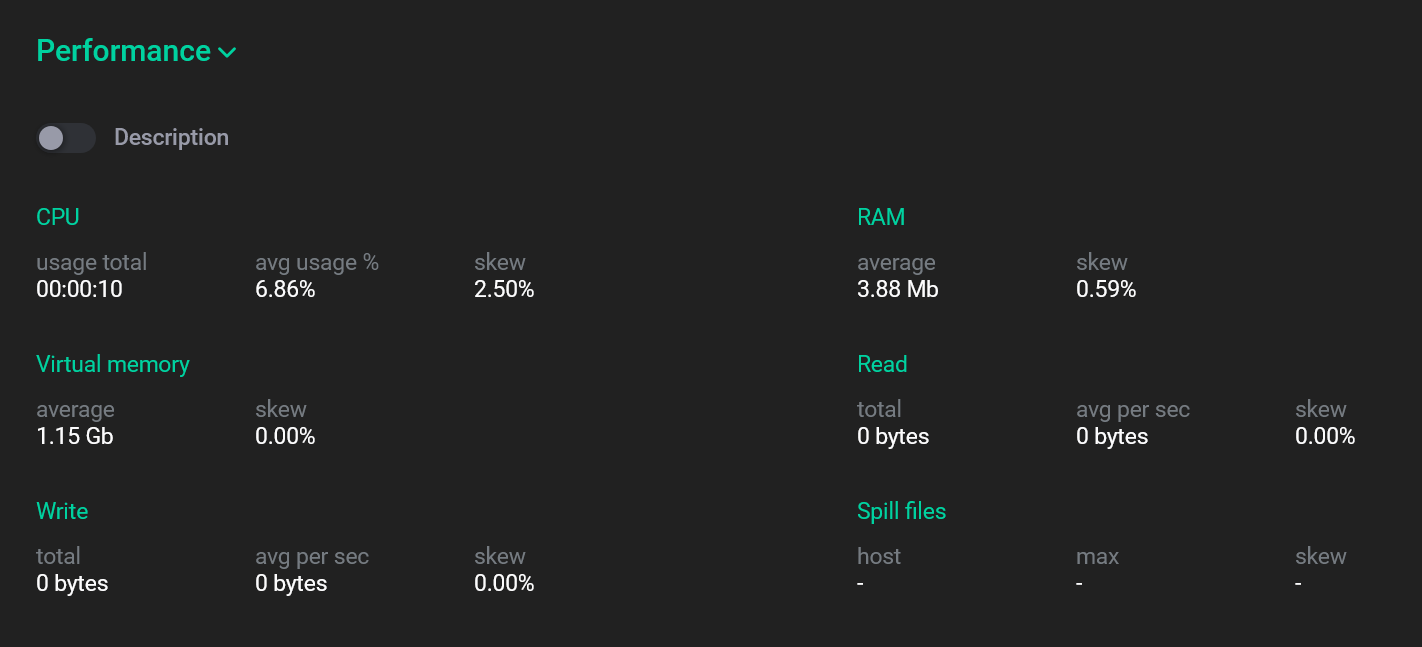
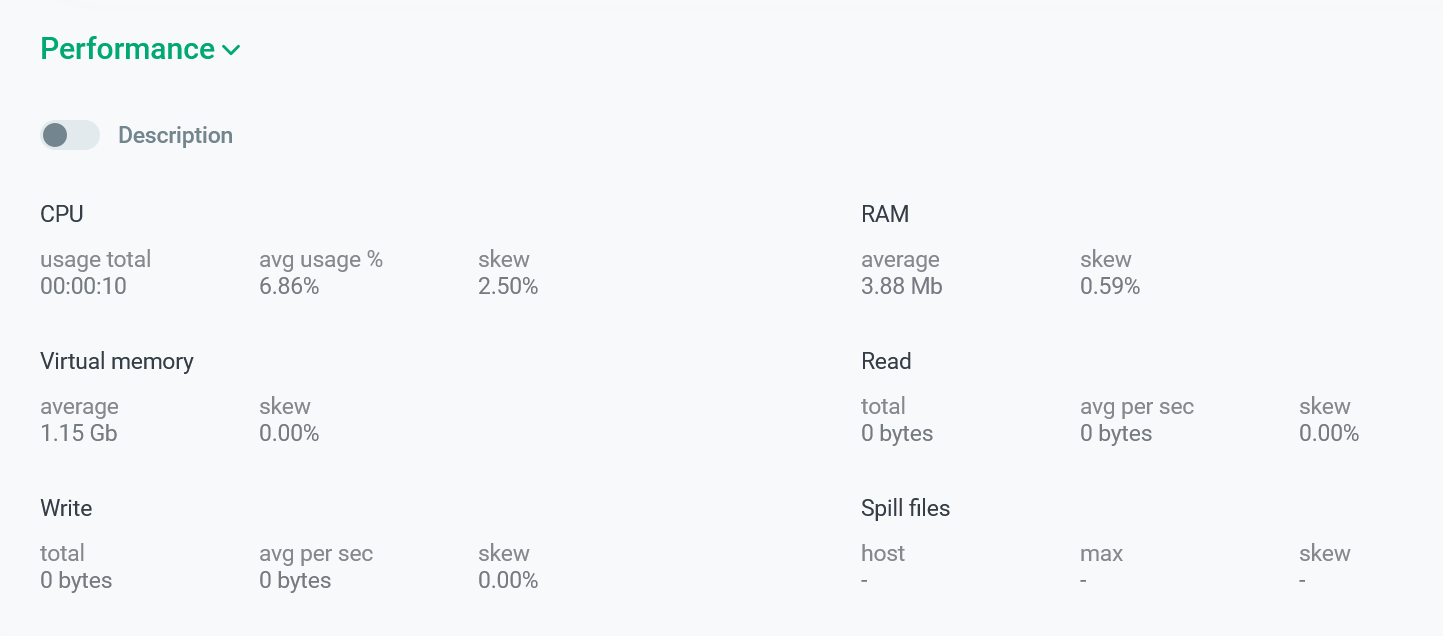
You can select an alternative display of metrics by activating the switcher that is located under the Performance section. The result is a table where not only the current value but also a detailed description is displayed for each metric.
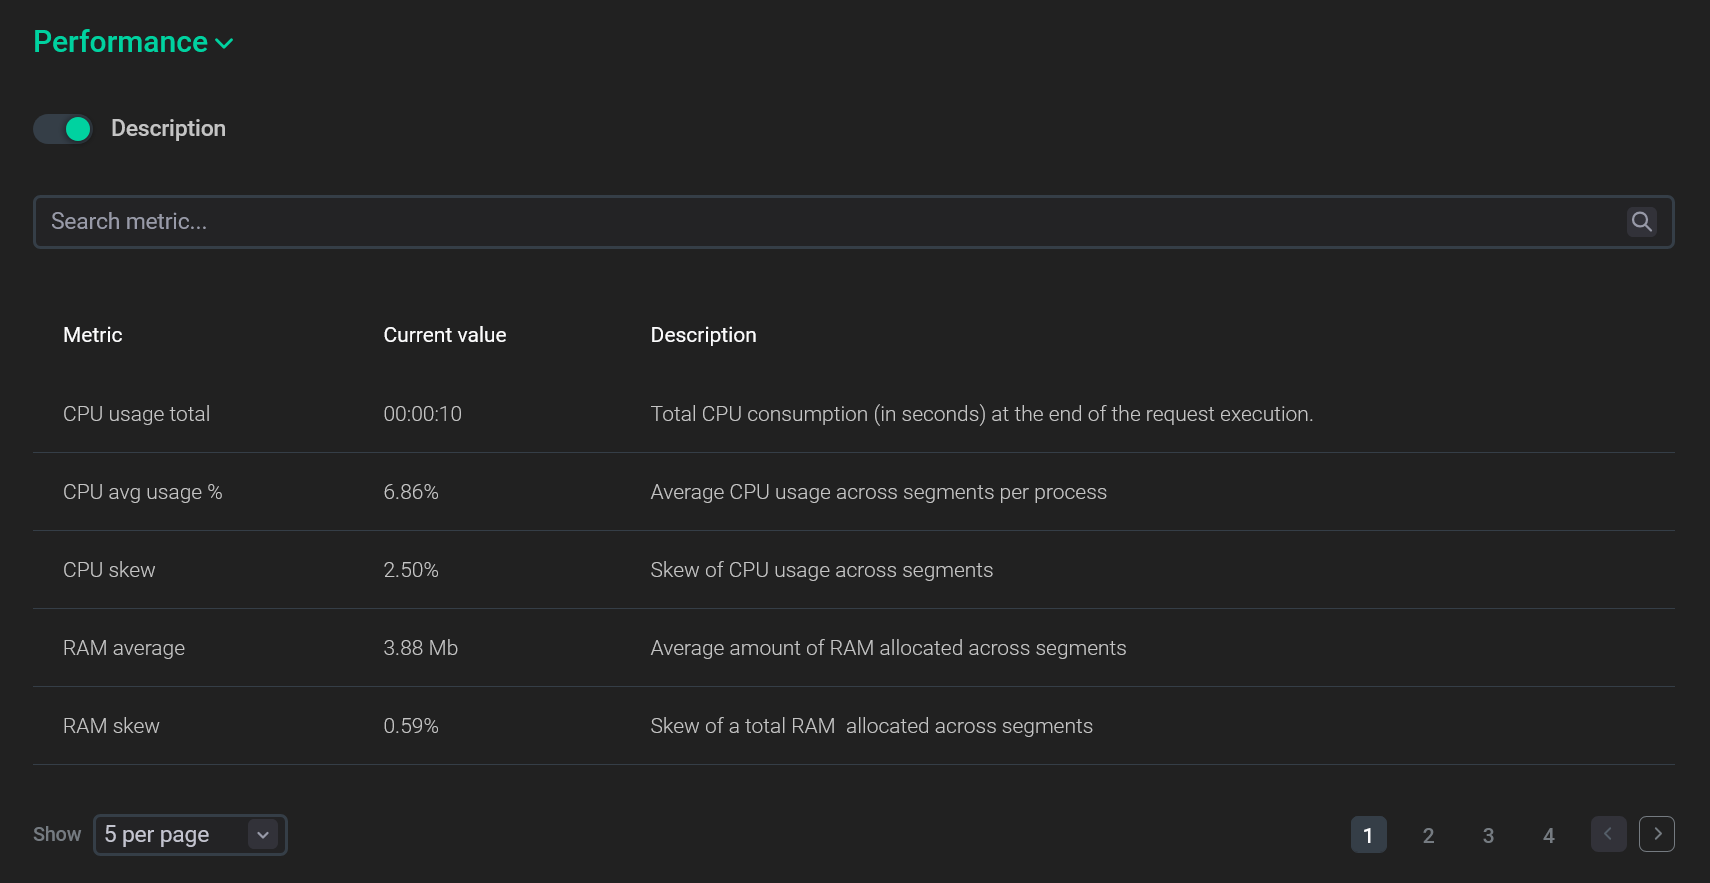
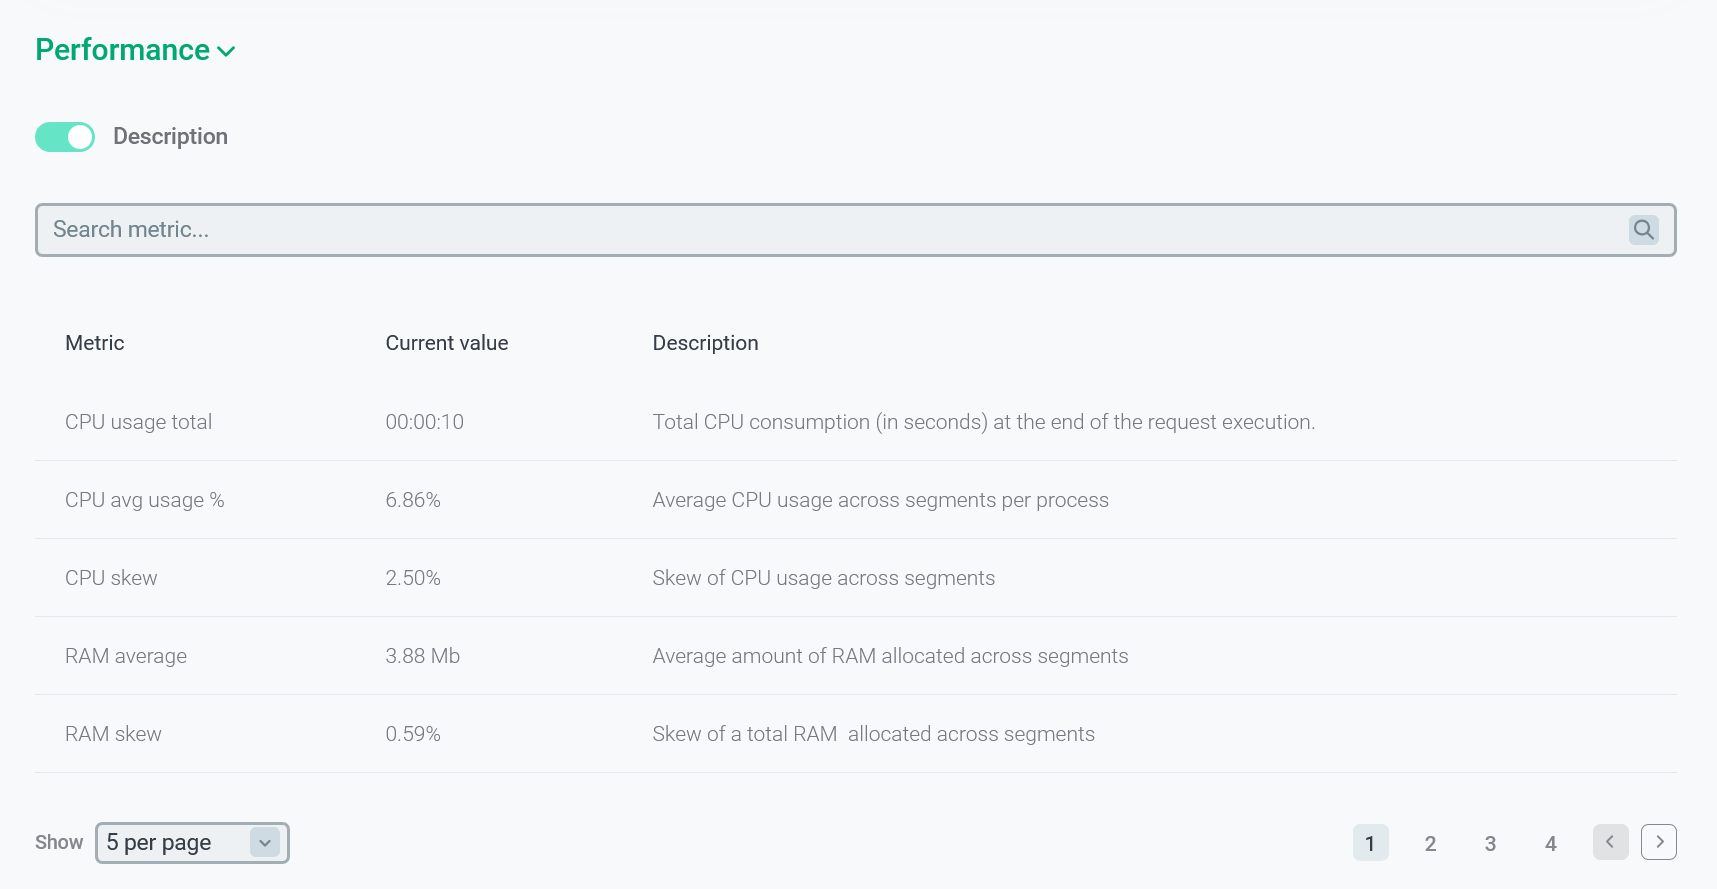
In the bottom part of the Performance section, the metric values are shown separately for each cluster segment, including the coordinator segment seg-1 (where Segment ID equals to -1).
| Field | Description |
|---|---|
Segment ID |
A content identifier for a segment instance. Corresponds to |
Hostname |
A host name |
CPU |
The amount of CPU consumed by the segment (percentage). Based on the metric values for all segments, the average value CPU avg usage % is calculated |
RAM |
The amount of RAM consumed by the segment (in bytes). Based on the metric values for all segments, the average value RAM average is calculated |
Read (per sec) |
The amount of data read per second by the segment (in bytes). Based on the metric values for all segments, the average value Read avg per sec is calculated |
Write (per sec) |
The amount of data written per second by the segment (in bytes). Based on the metric values for all segments, the average value Write avg per sec is calculated |
Virtual memory |
The amount of virtual memory allocated by the segment (in bytes). Based on the metric values for all segments, the average value Virtual memory average is calculated |
Spill size |
Size of spill files (in bytes). Filled in if the Spill metrics collection mode value is set to |
Spill files number |
Number of spill files. Filled in if the Spill metrics collection mode value is set to |
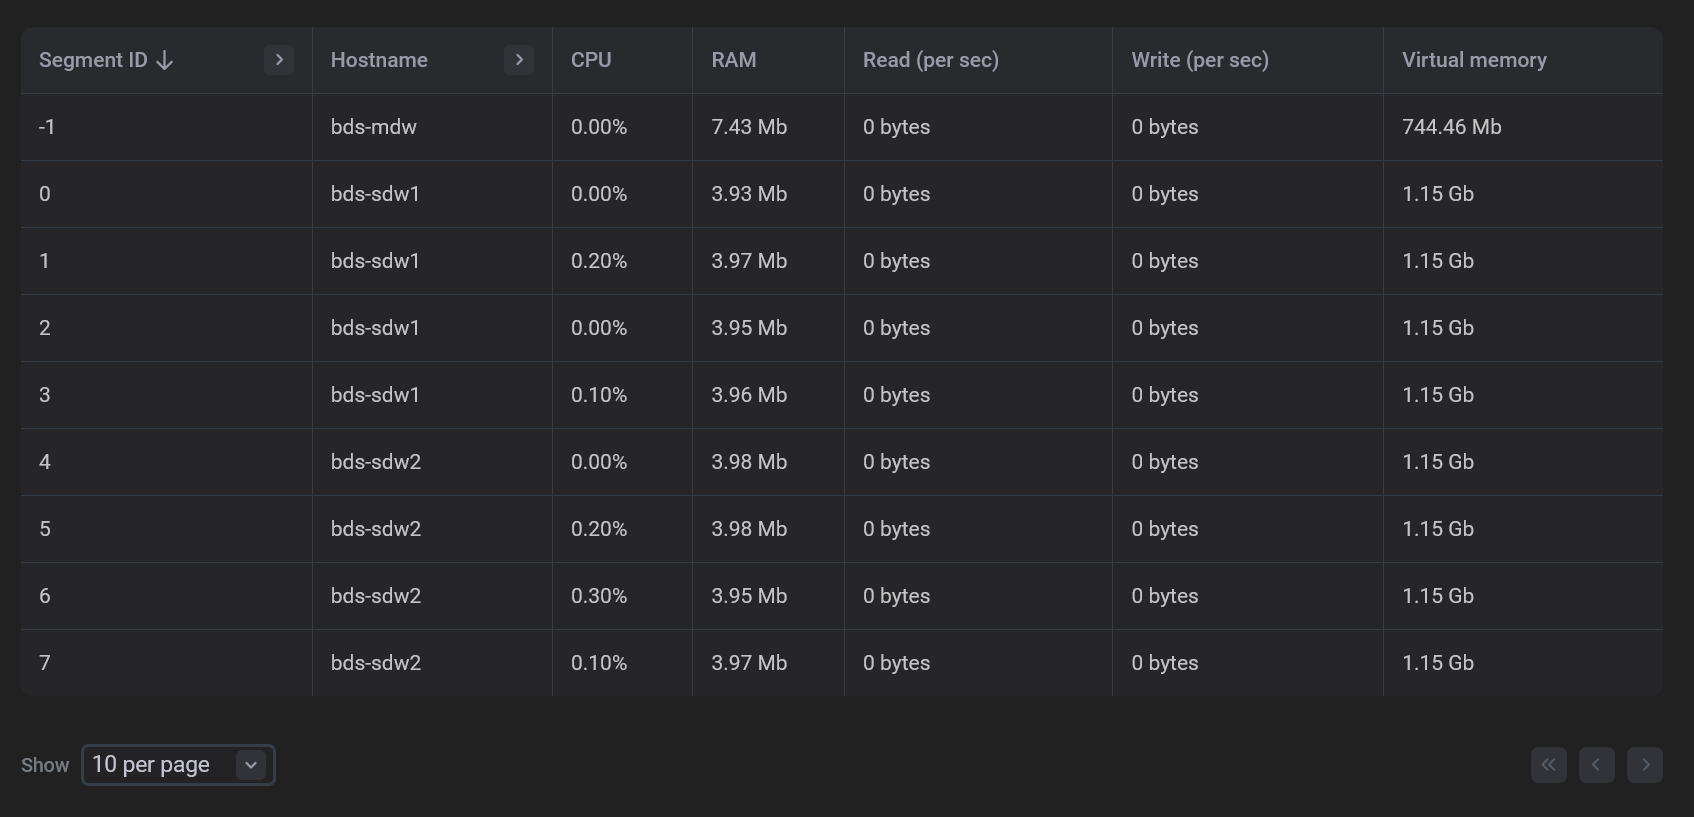
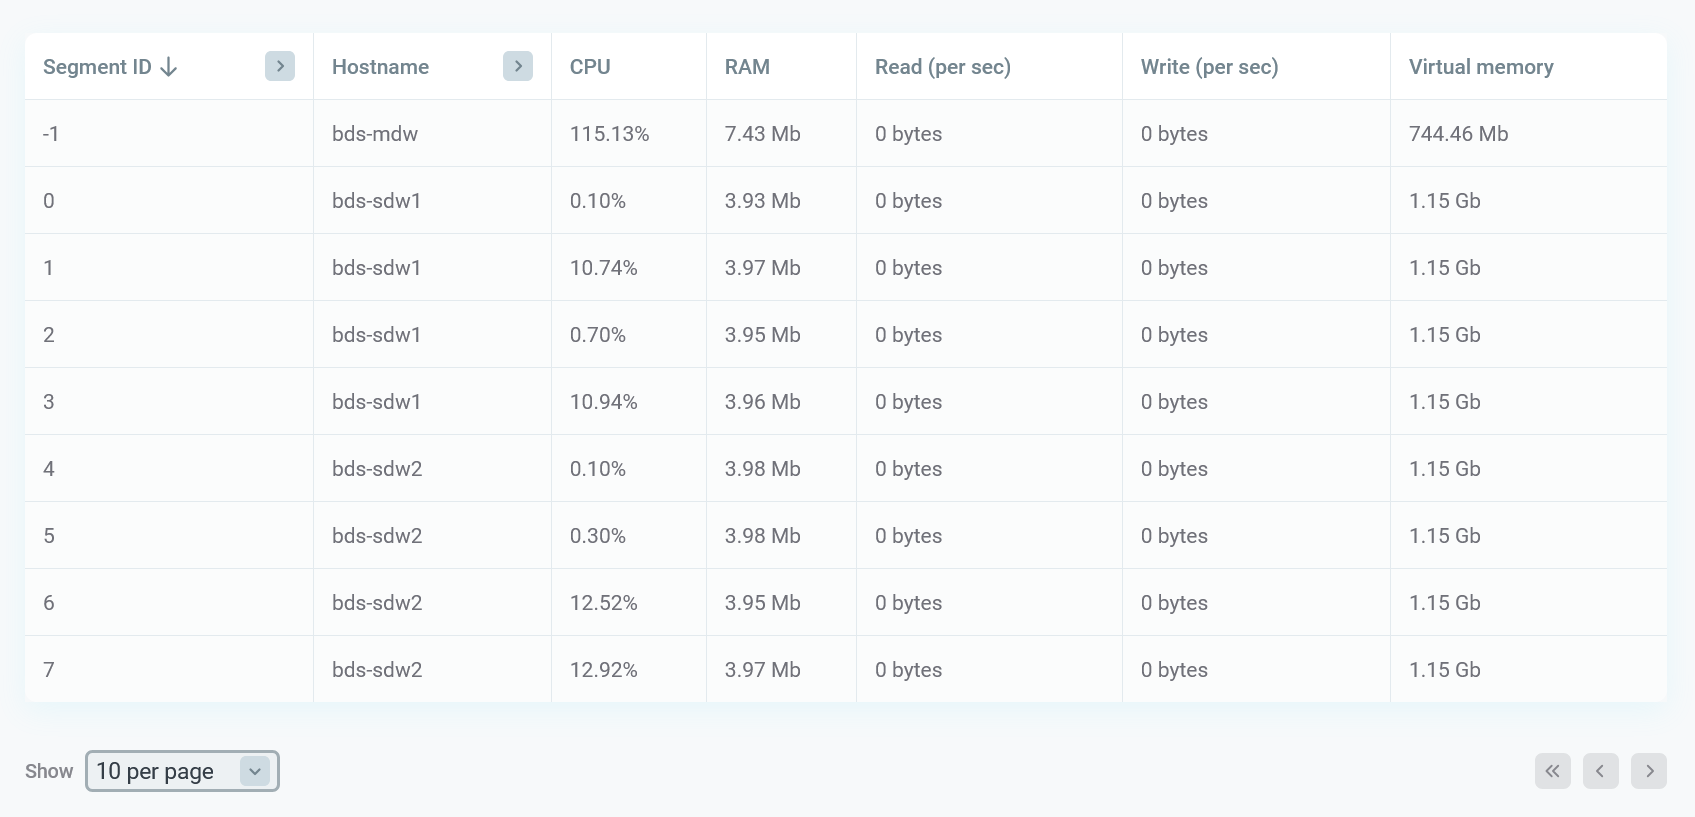
Starting with ADBM 2.1.2 you can filter and sort data in the table displayed above as follows:
-
Filters are available for the Segment ID and Hostname columns. To apply a filter, click the
icon in the column header and enter the value to search. The
icon means that the filter is defined for the column. To reset all filters, click Reset.
-
Data sorting is available for all columns except Hostname. To change a sort order for a column, click the
or
icon in the column header.
|
IMPORTANT
System metrics are collected from ADB segments by ADB Control agents only for commands longer than 15 seconds. Due to this fact, the section with metrics will be empty for the commands that complete faster. |
Command text
The Command text section contains the SQL command text, which you can copy by clicking
in the top right corner of the code sample.


Query plan sections
Below the Command text section, there are several tabs that display query execution details:
-
Plan & progress
-
Text
-
Relations
The first tab Plan & progress contains a graphical view of the query plan in the form of a tree. Execution is done from child nodes to the root. Each plan node displays a type of the performed operation and the following information:
-
For DB queries in progress:
-
The actual number of processed tuples at the current moment. This value is being refreshed.
-
The actual node execution time of a slice (group of nodes) at the current moment. This value is being refreshed and displayed on all nodes that belong to the same slice.
-
-
For finished DB queries:
-
The total node execution time.
-
The total number of processed tuples.
-
The ratio of the node execution time to the total query execution time (in percentage).
-
In the top right corner of each plan node, there is an icon corresponding to its status:
-
— the plan node is being executed.
-
— the plan node is finished.
-
— some error occurred when running the slice that contains the current plan node. The error status is available starting with ADB Control 4.10.3. Plan nodes in the error status are highlighted in red.
-
— the plan node is unreachable. This status is used for plan nodes that are above the error slice in the query plan tree, and also for those nodes whose parent node appeared in the error slice in the initialization status (before execution). The unreachable status is available starting with ADB Control 4.10.3.
Plan nodes that belong to the same slice are highlighted in the same color and have the same status.
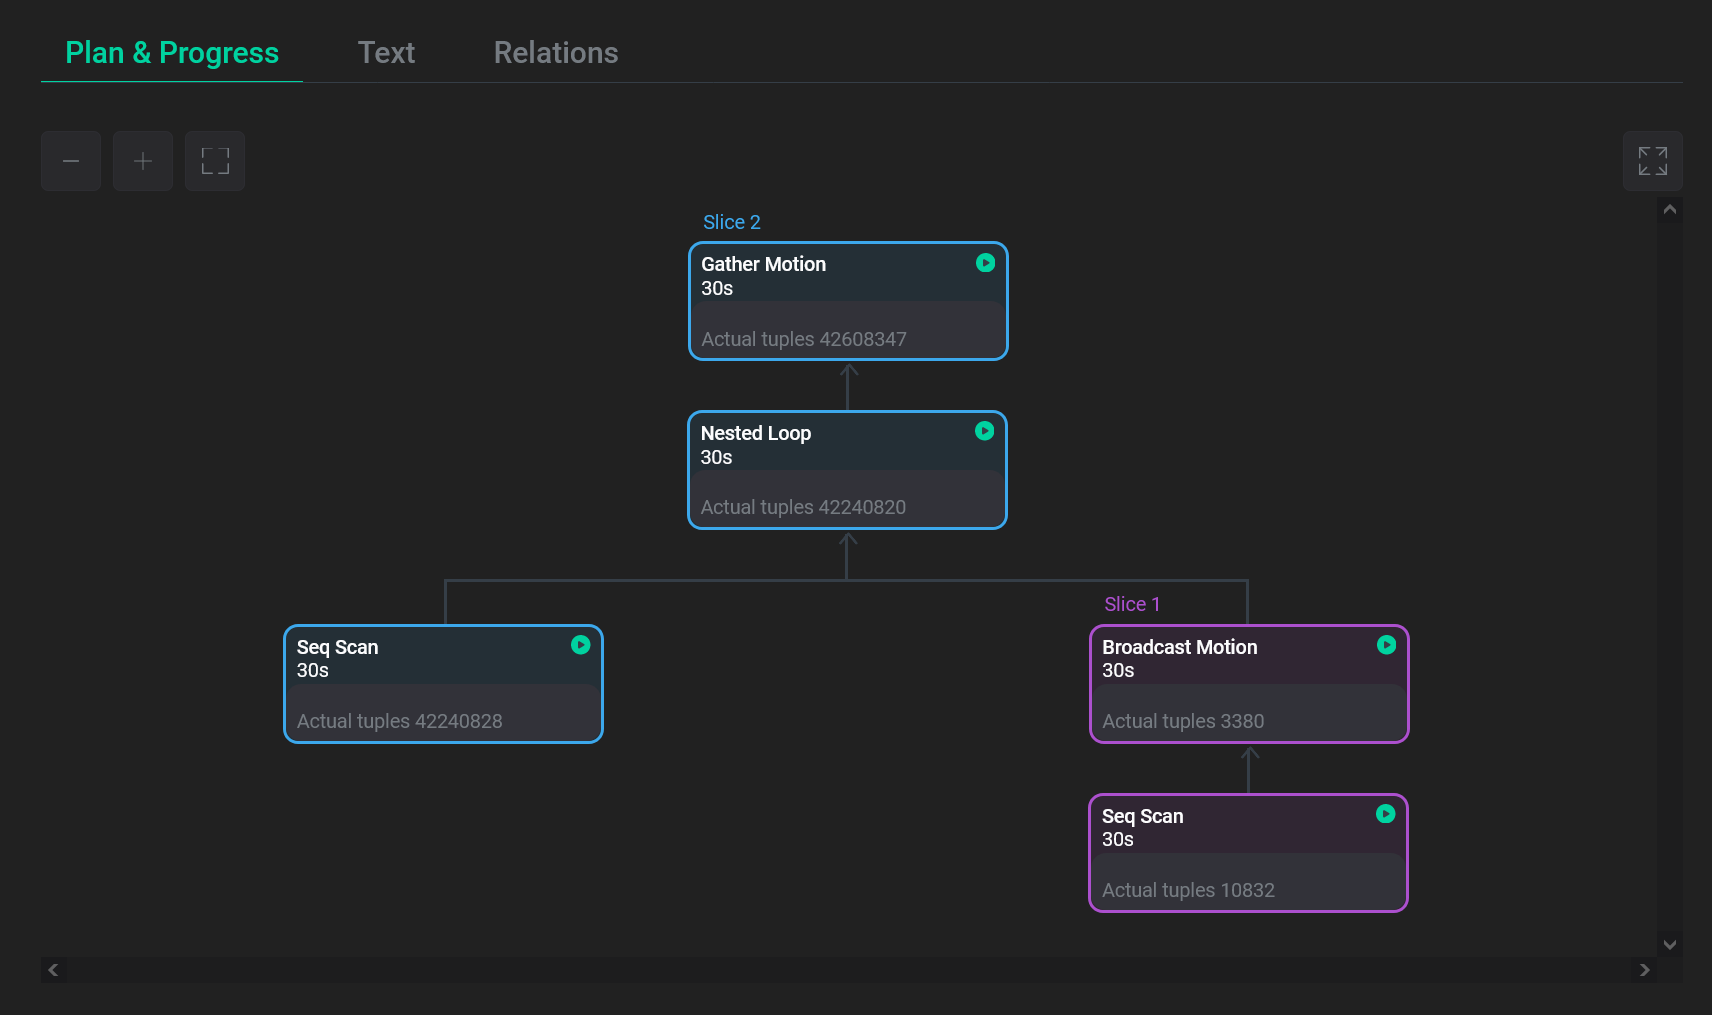
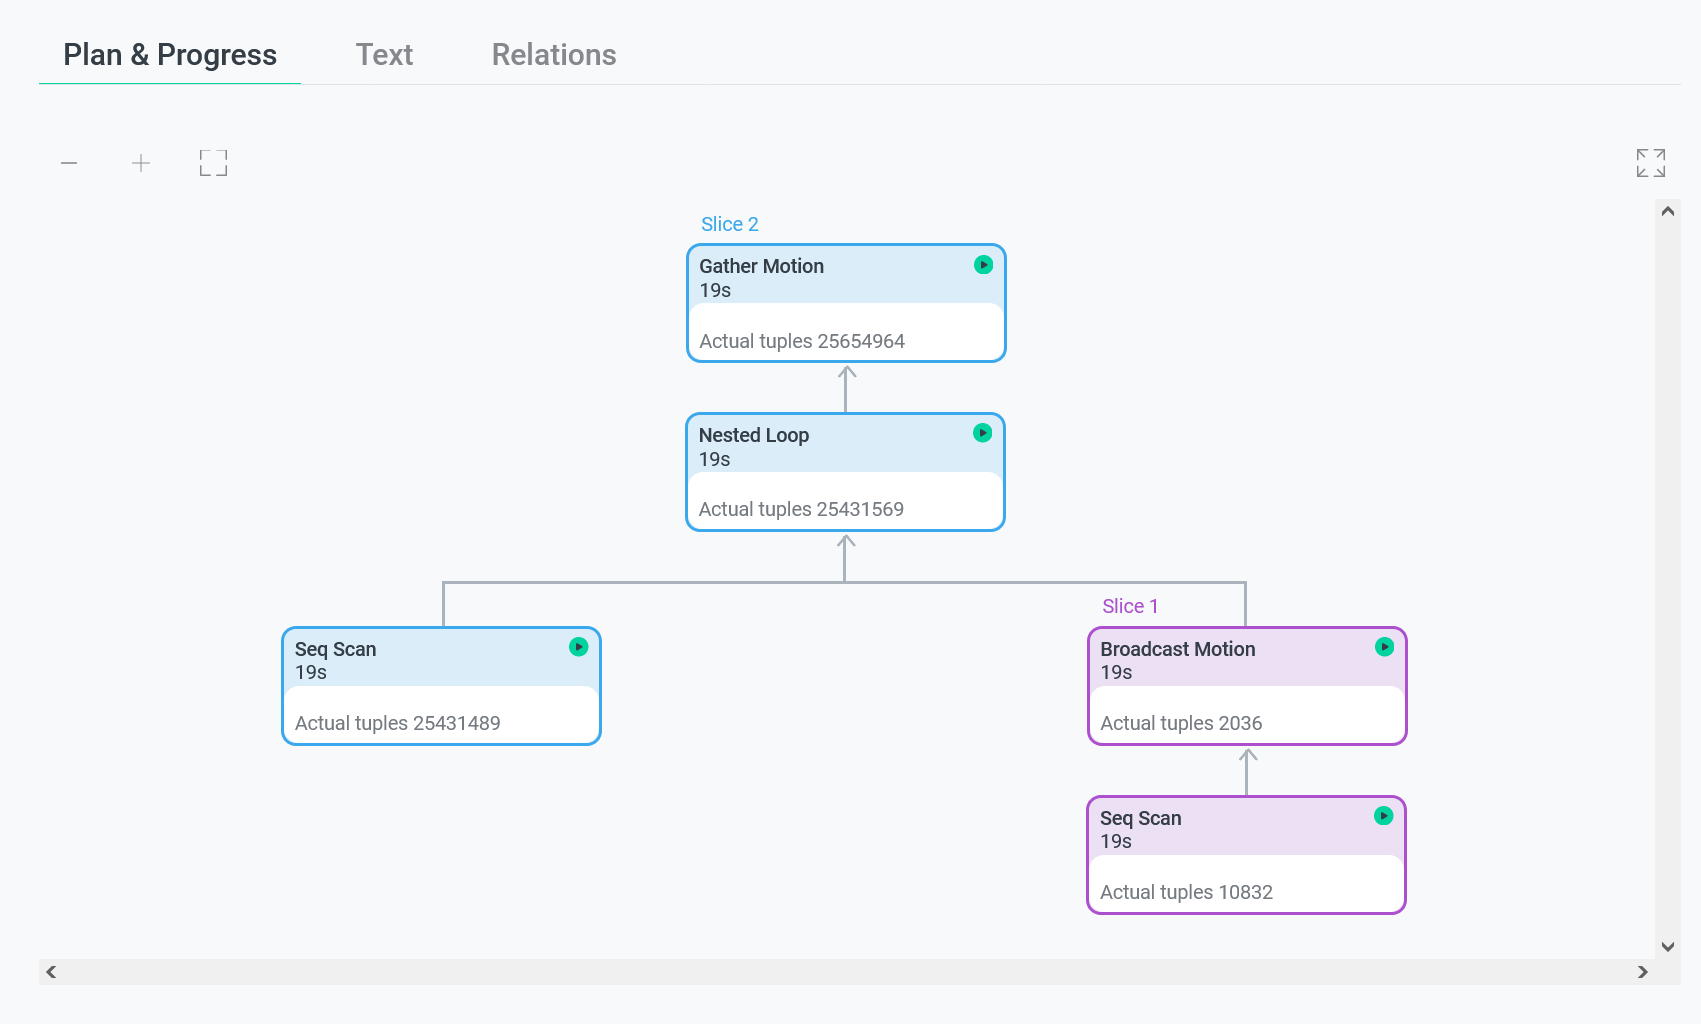
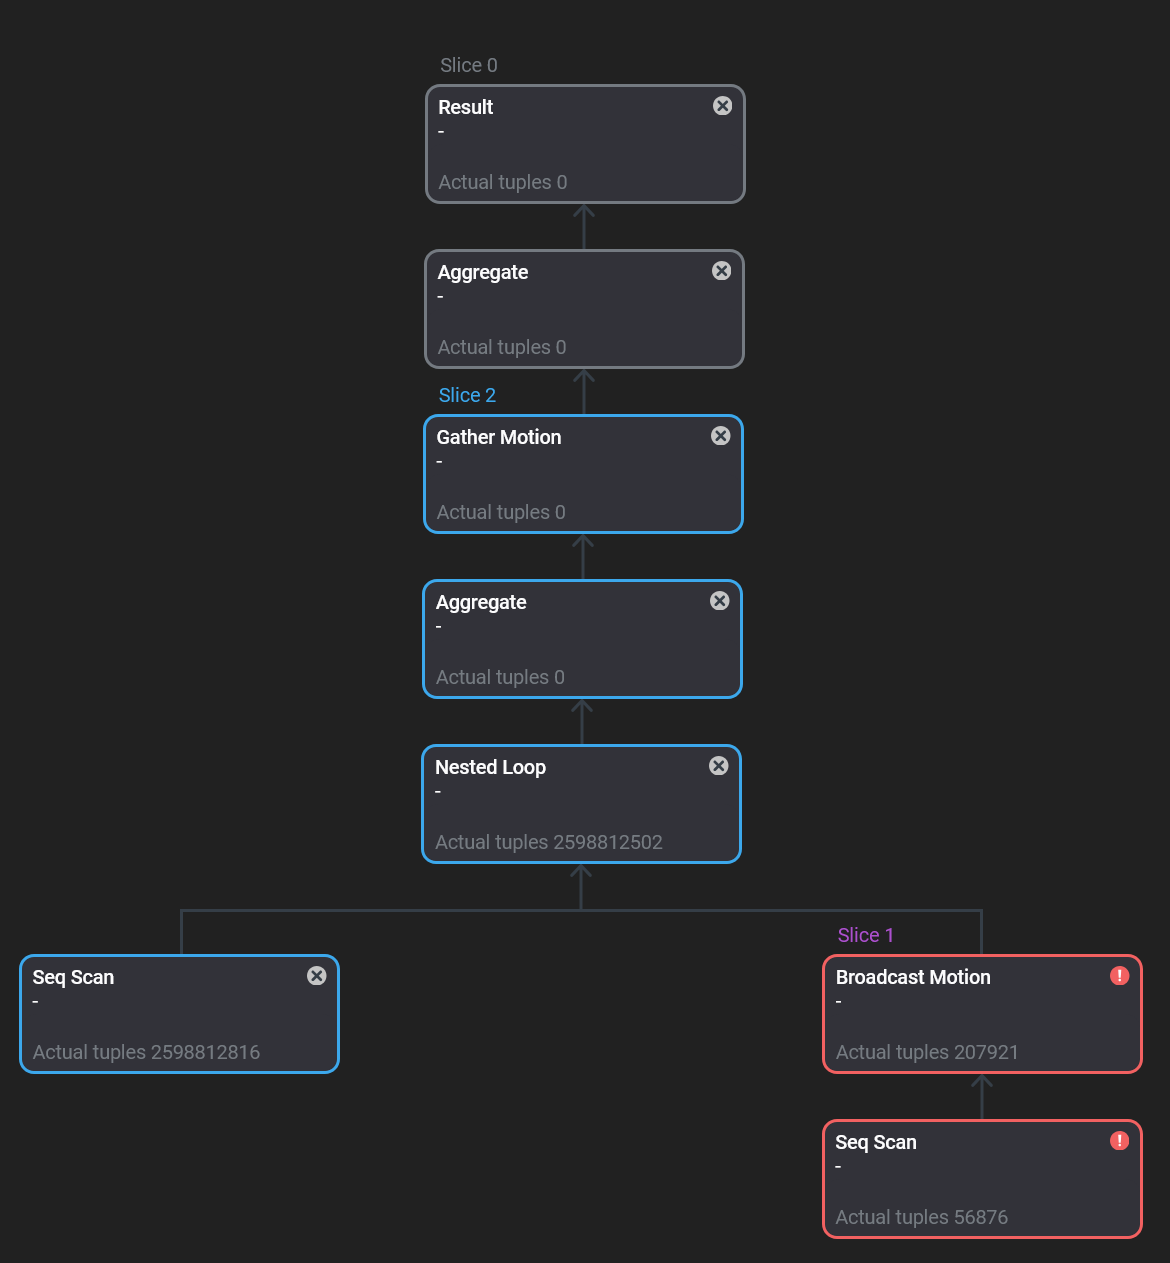
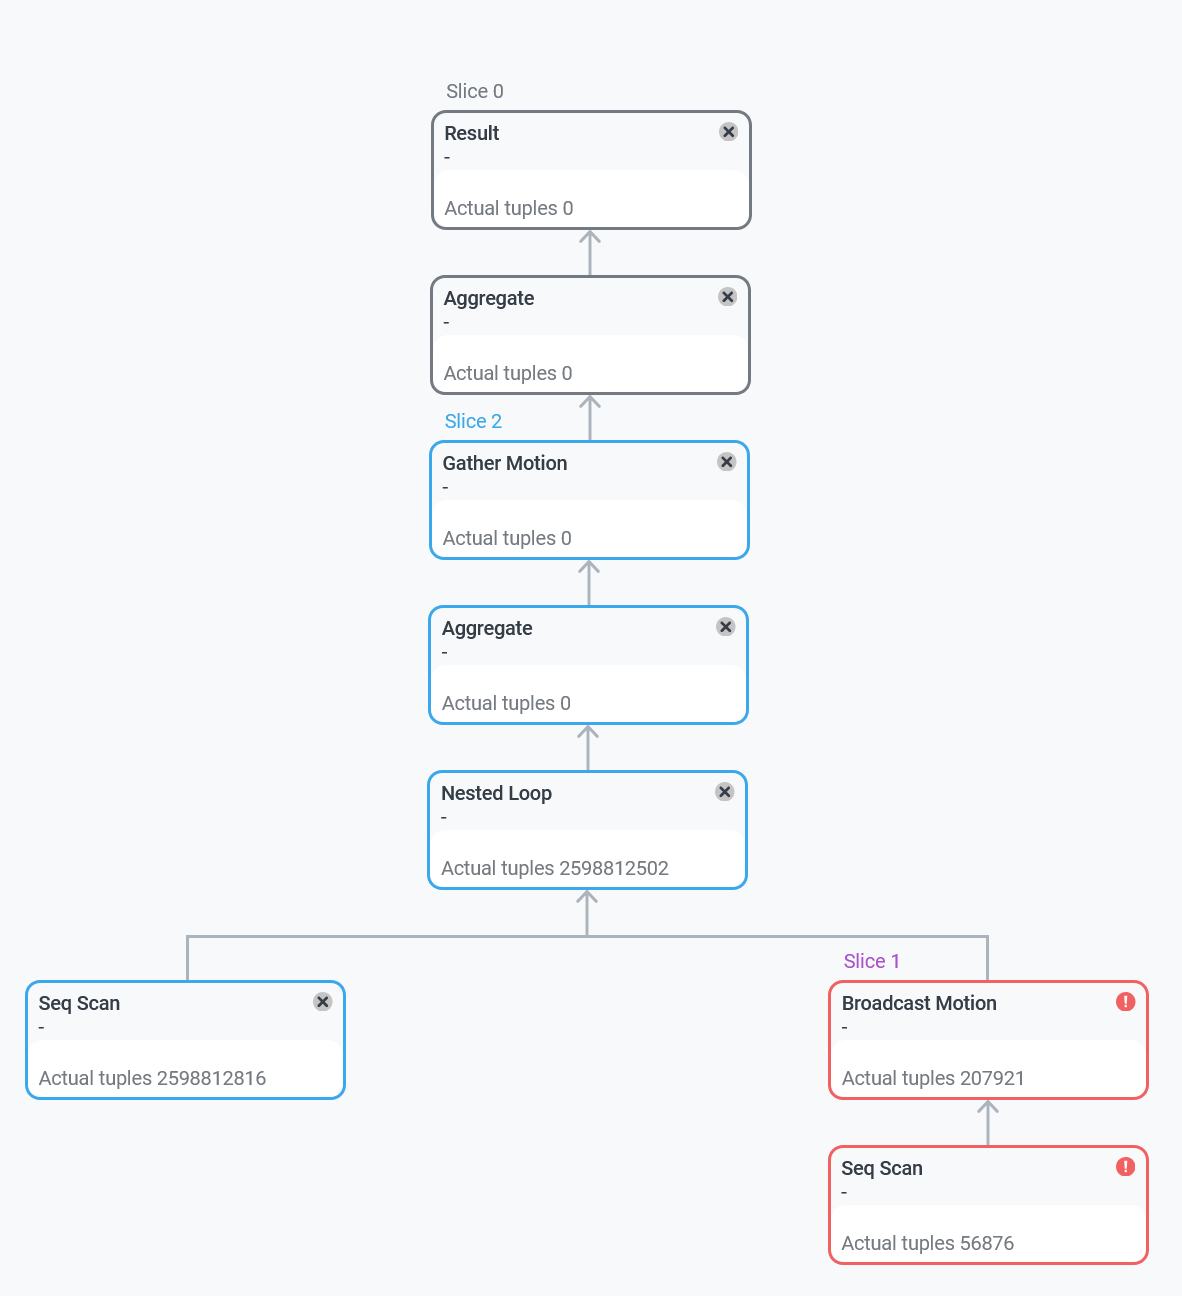
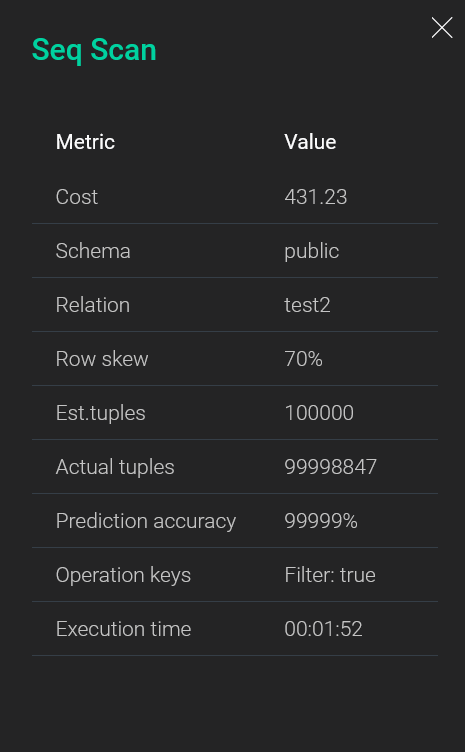
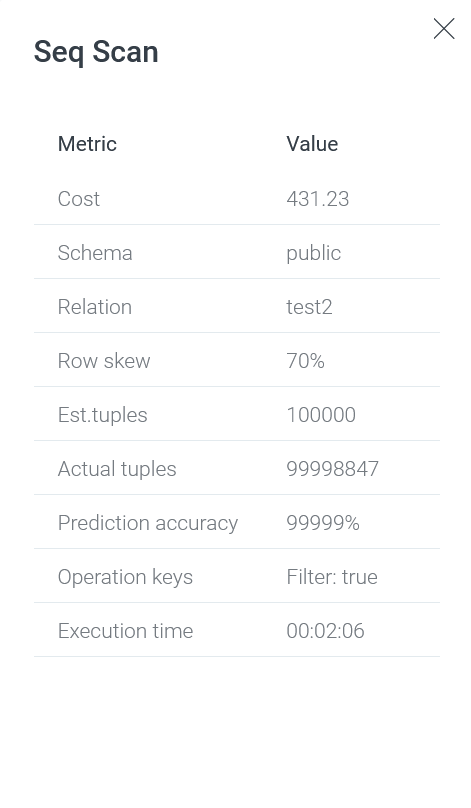
When you click on a query plan node, a panel with additional information appears on the right side of the screen.
| Field | Description |
|---|---|
Cost |
A plan node cost |
Schema |
A schema name. Can be used to distinguish eponymous tables that belong to different schemas |
Relation |
A name of the relation that is used in the current plan node |
Row skew |
A data skew indicator. The difference between |
Est.tuples |
An estimated number of table rows (tuples) that should be processed or scanned by the plan node |
Actual tuples |
An actual number of processed table rows (tuples) |
Prediction accuracy |
A ratio of the actual number of processed tuples to the estimated number (percentage). The value that exceeds 100% indicates that the planner has made a wrong assumption about the number of tuples that should be processed/scanned when executing the plan node |
Operation keys |
Additional conditions that are used to perform specific operations. For example, |
Execution time |
A plan node execution time in hours, minutes, seconds |
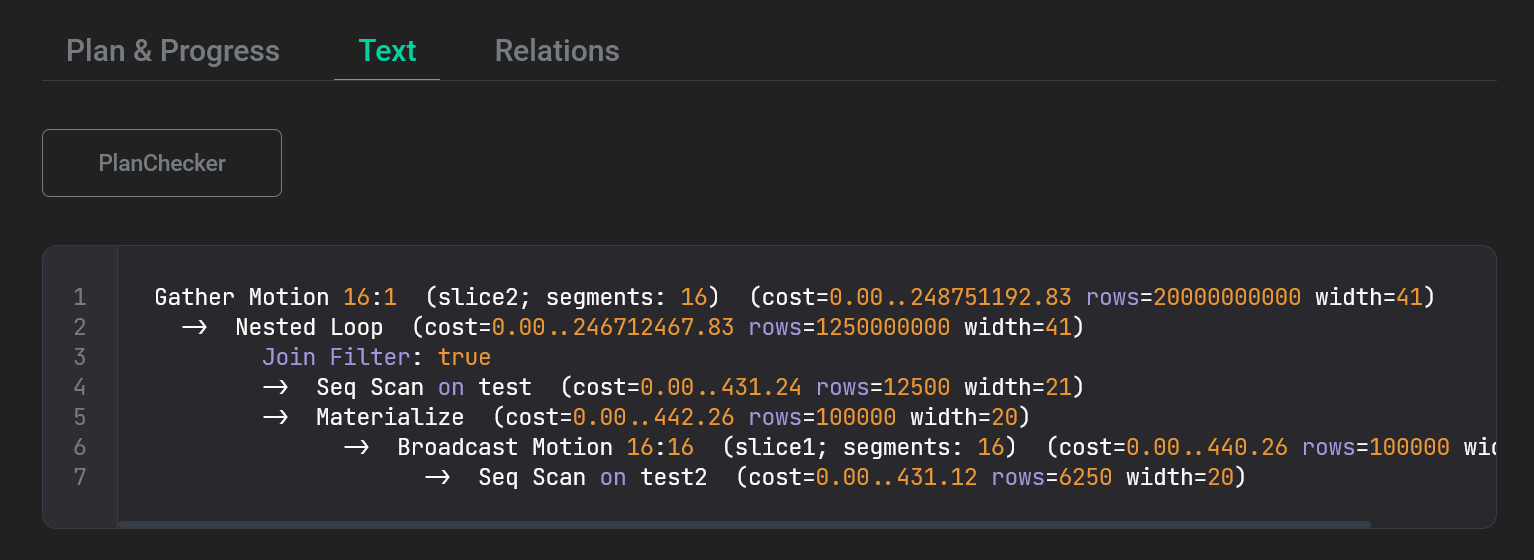
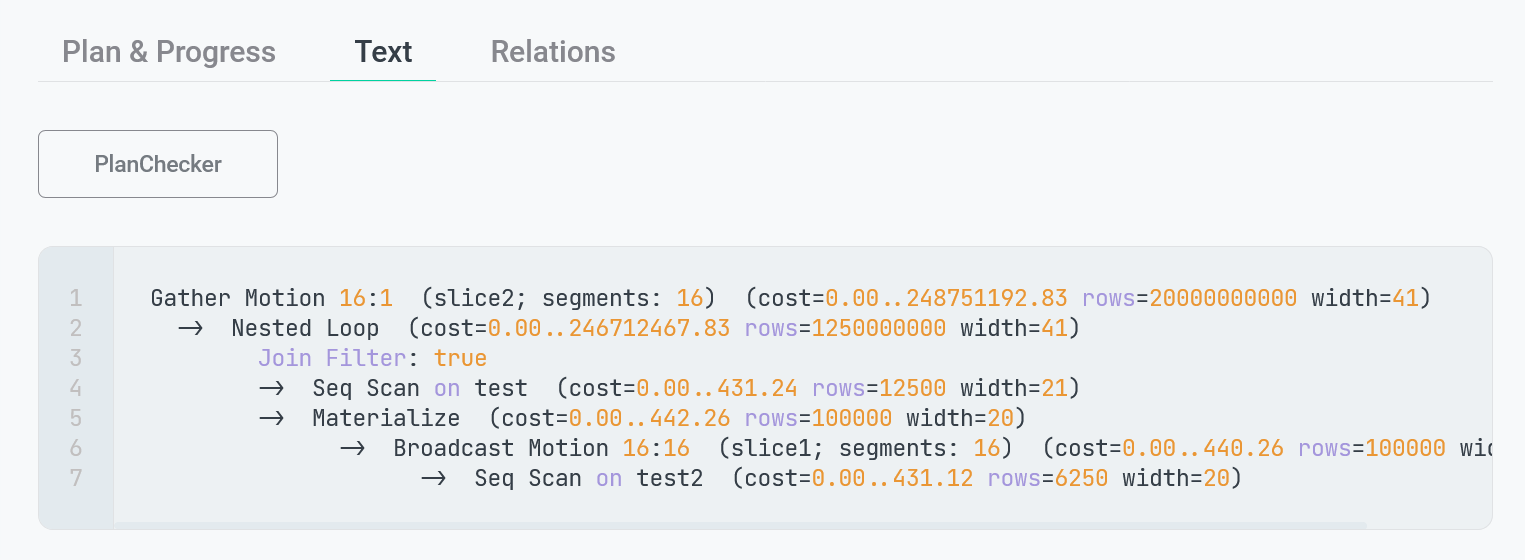
The next tab Text outputs a text presentation of the query plan, which is the result of the EXPLAIN command. You can copy the text by clicking the
icon in the top right corner of the code sample.
The last tab Relations lists the database relations that are used in the query. For each relation, the name of the corresponding schema is displayed.
|
NOTE
To view audit details for the specific relation, you can click the row corresponding to that relation in the table above. This functionality is available for ADB Control users with appropriate permissions (see |


System metrics collected for commands
Both Online and History tabs allow you to view the statistics of the system resource consumption by commands (on the Performance tab in the command details). The metrics available for commands are listed below.
|
NOTE
|
| Group | Metric | Description |
|---|---|---|
CPU |
CPU usage total |
The total CPU consumption across cluster segments (in seconds) |
CPU avg usage % |
The CPU percent average for all segment processes executing the query. Calculated as the result of dividing the total CPU consumption on all cluster segments (excluding the coordinator and standby) by the total number of processes processing the query on segment hosts (excluding the coordinator and standby) |
|
CPU skew |
The indicator that displays the CPU consumption skew across cluster segments (percentage). A value other than zero indicates that one of the segments uses more CPU than others |
|
RAM |
RAM average |
The average amount of RAM consumed across cluster segments (in bytes). The RAM consumption at any given moment is calculated based on the operating system metric rss (Resident Set Size) |
RAM skew |
The indicator that displays the RAM consumption skew across cluster segments (percentage). A value other than zero indicates that one of the segments uses more RAM than others |
|
Virtual memory |
Virtual memory average |
The average amount of virtual memory allocated across cluster segments (in bytes). The virtual memory consumption at any given moment is calculated based on the operating system metric vsize (Virtual Memory Size) |
Virtual memory skew |
The indicator that displays the virtual memory skew across cluster segments (percentage). A value other than zero indicates that one of the segments uses more virtual memory than others |
|
Read |
Read total |
The total amount of data read across cluster segments (in bytes). The following formula is used for calculation: |
Read avg per sec |
The average amount of data read across cluster segments per second (in bytes). The data read rate at any given moment is calculated based on the I/O Read information from /proc/[pid]/stat as a delta between the current and previous values |
|
Read skew |
The indicator that displays the data reading skew across cluster segments (percentage). A value other than zero indicates that one of the segments reads more data from a disk than others |
|
Write |
Write total |
The total amount of data written across cluster segments (in bytes). The following formula is used for calculation: |
Write avg per sec |
The average amount of data written across cluster segments per second (in bytes). The data write rate at any given moment is calculated based on the I/O Write information from /proc/[pid]/stat as a delta between the current and previous values |
|
Write skew |
The indicator that displays the data writing skew across cluster segments (percentage). A value other than zero indicates that one of the segments writes more data to a disk than others |
|
Spill files |
Spill files host |
The total amount of spill files on cluster hosts at the current moment (in bytes) |
Spill files abs host |
The maximum value of Spill files host detected on cluster hosts during the command execution (in bytes) |
|
Spill files abs seg |
The maximum amount of spill files produced by one cluster segment during the command execution (in bytes) |
|
Spill files skew |
The indicator that displays the spill file amount skew (in percents) at the current moment. A value other than zero indicates that one of the segments uses more spill files than others |
|
Spill files abs seg skew |
The indicator that displays the spill file amount skew (in percents) at the moment when the Spill files abs seg value was fixed. The following formula is used for calculation: |
Groups
A query group is a set of SQL queries grouped by SQL ID, node number, and node type in the query plan.
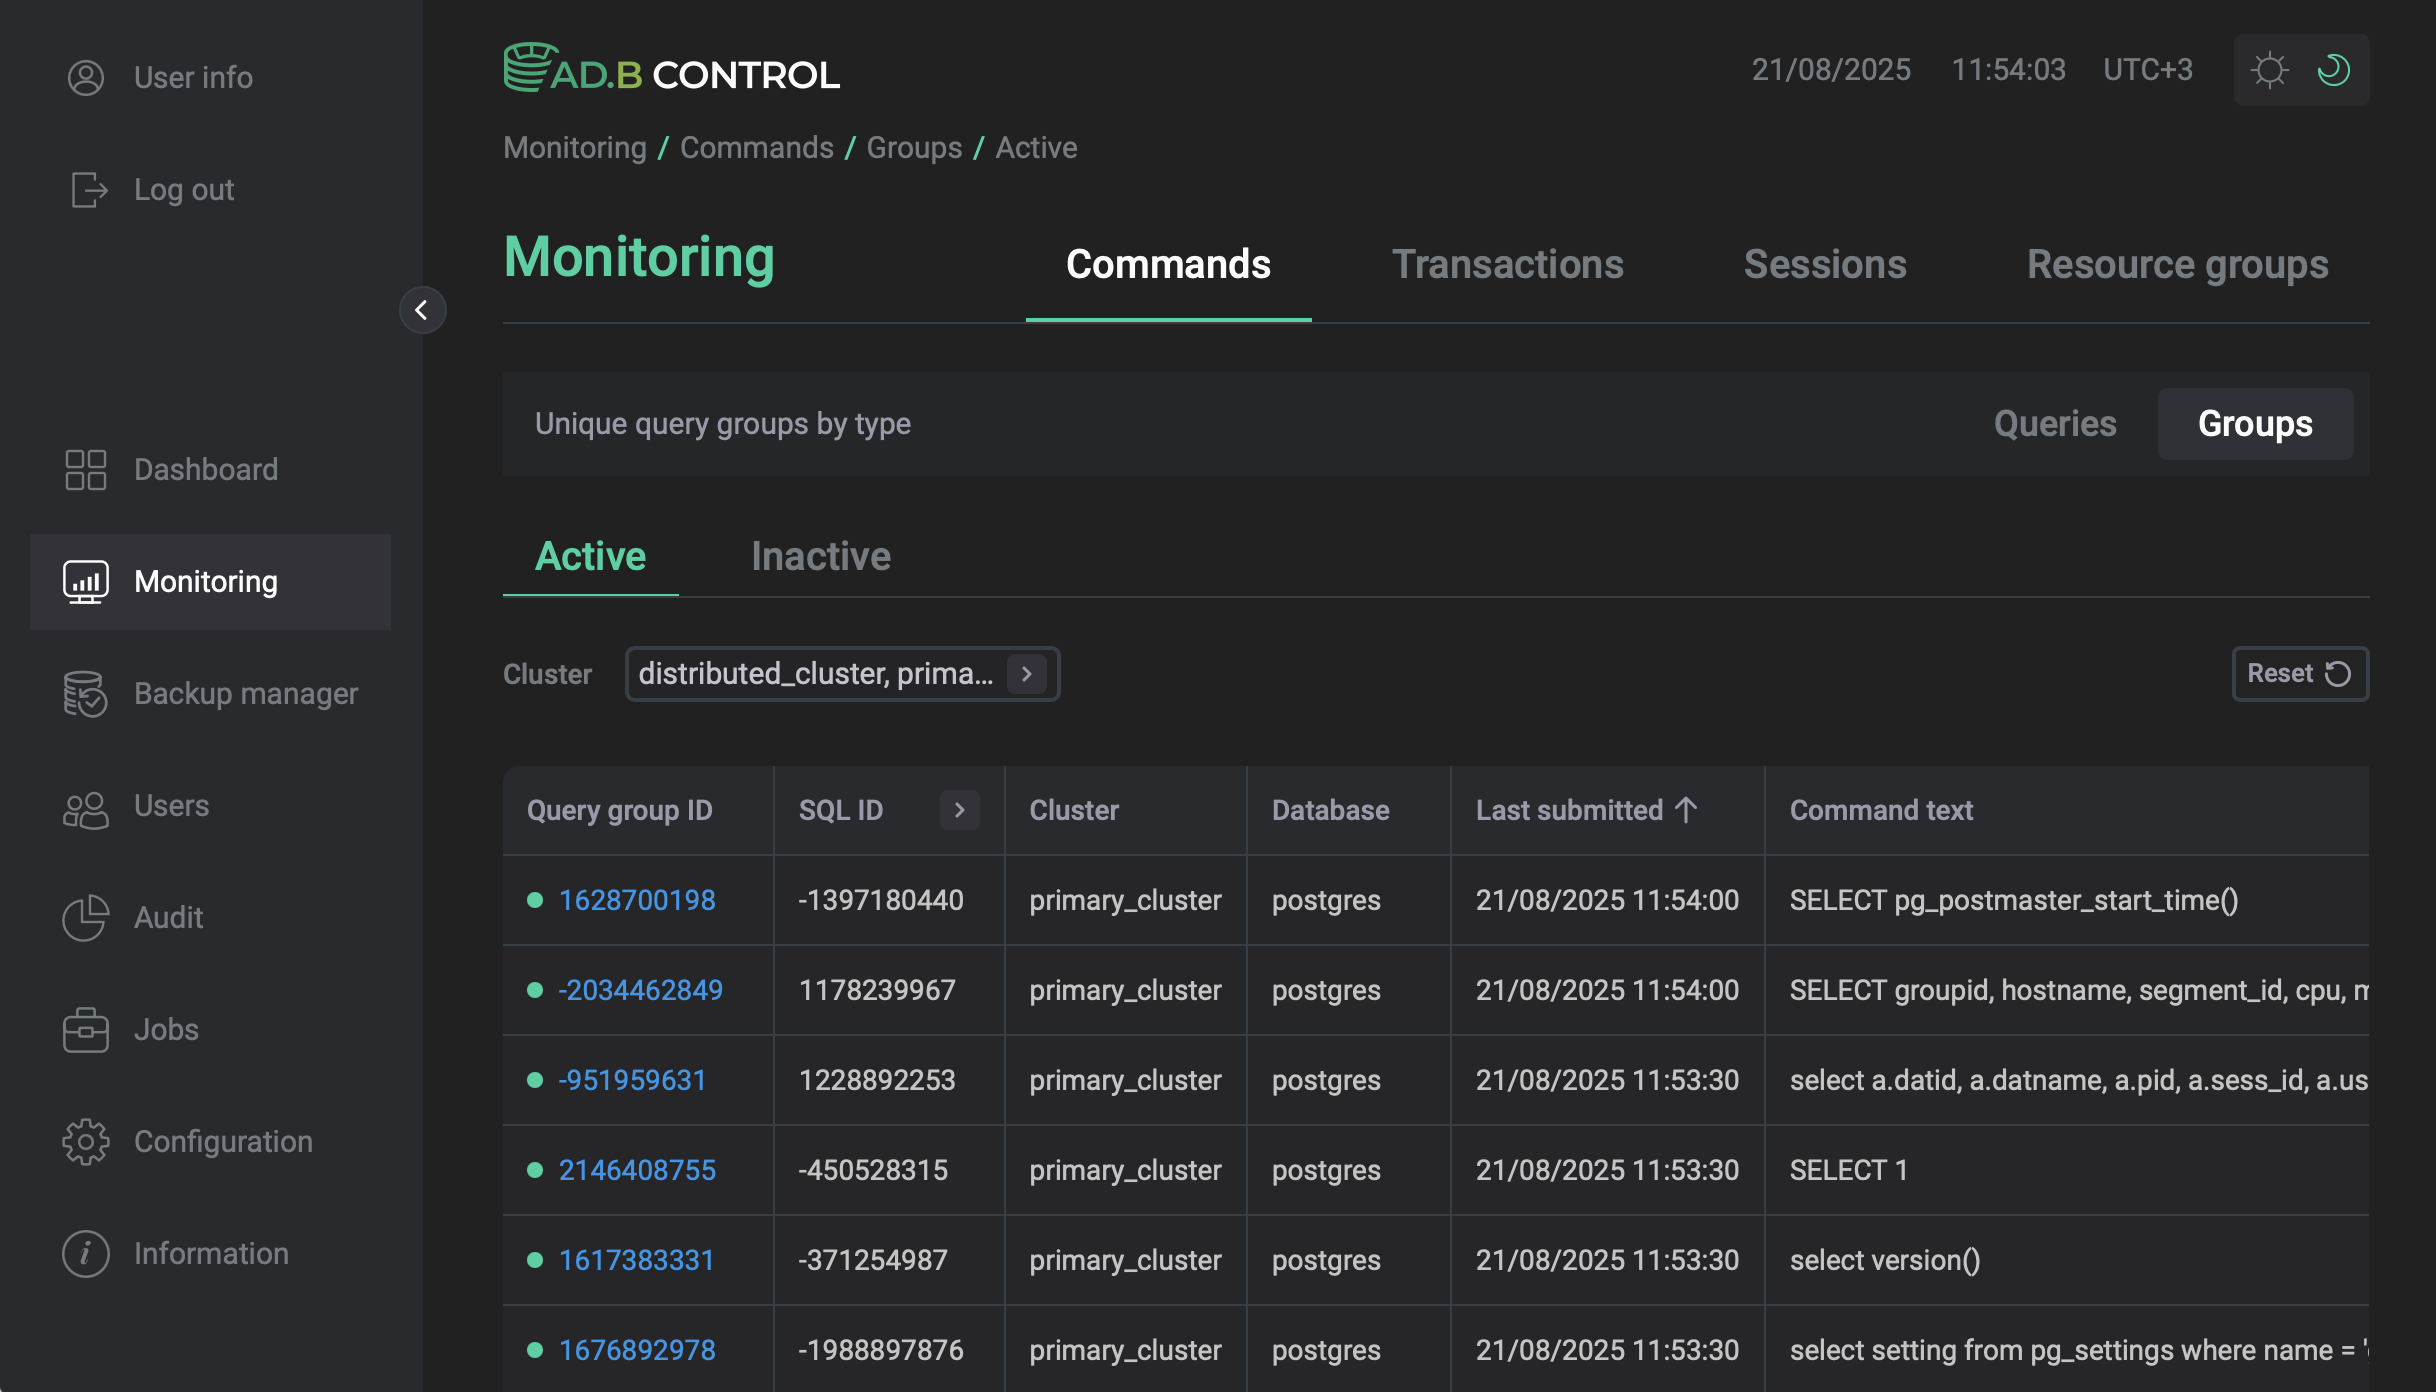
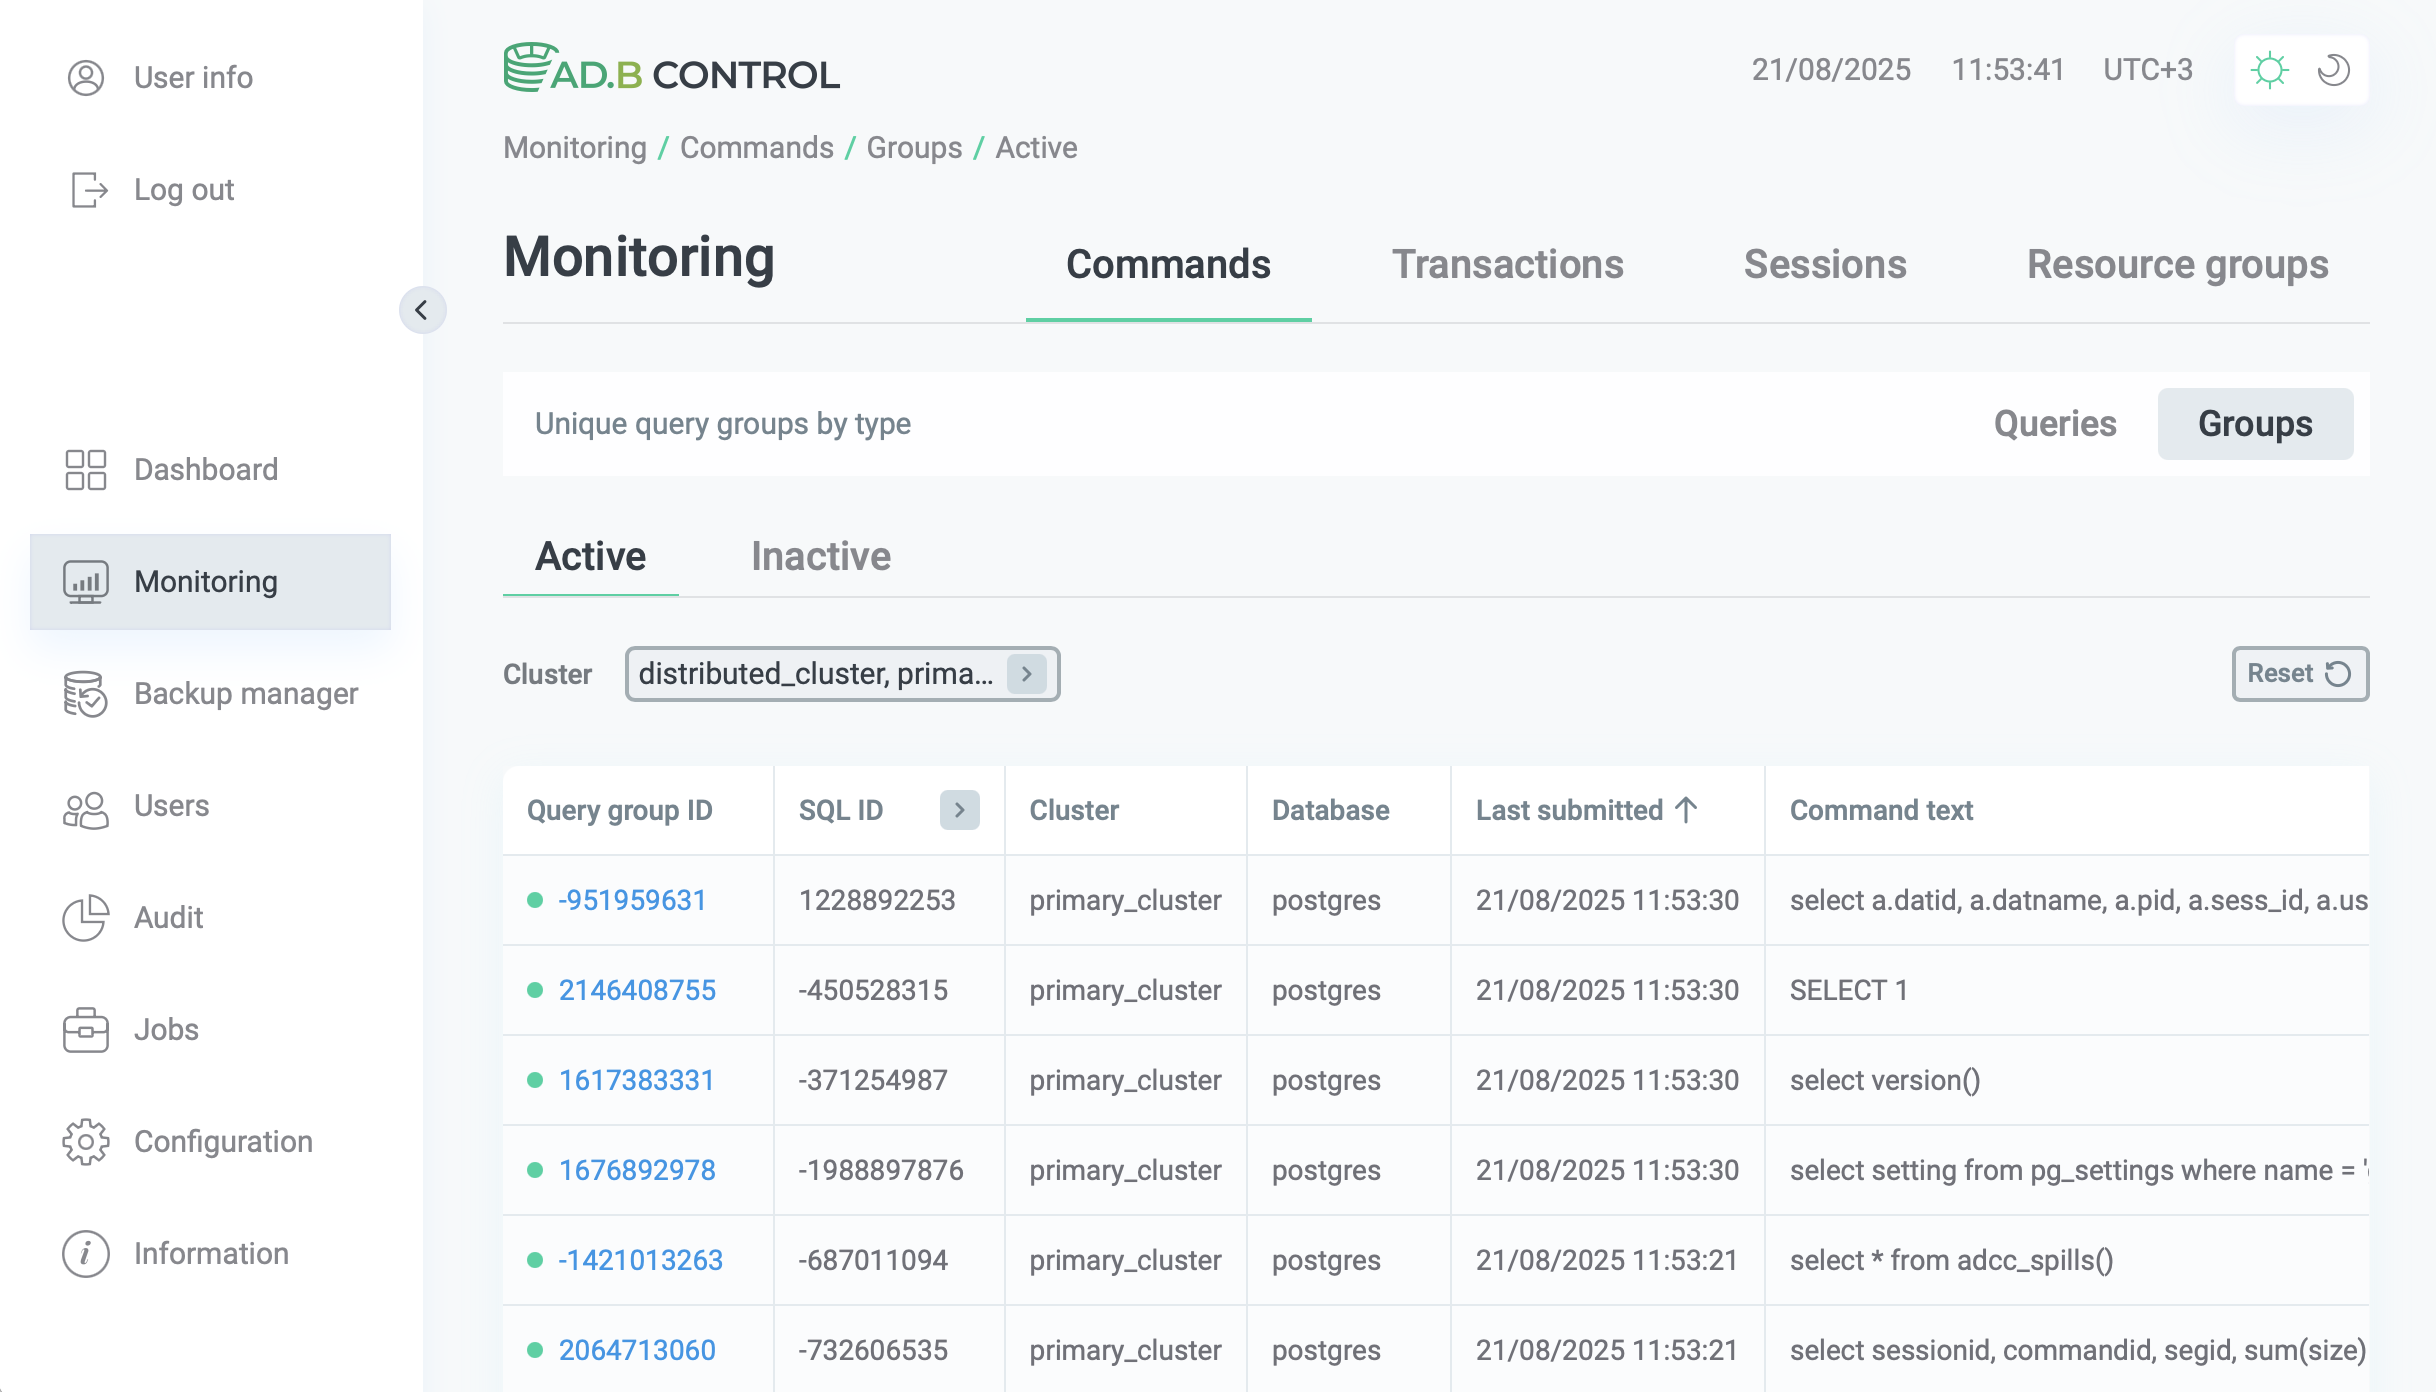
When a query is received, ADB Control creates a group for every new combination of SQL ID, node number, and node type. If the next query matches these parameters of an existing group, it belongs to this group, and the Last submitted parameter of the group is updated. Otherwise, a new group is created.
|
NOTE
Currently, the duration of an SQL command determines on which tab the command is shown:
|
Query groups can be active and inactive depending on the time of the last query in the group. If the time of the last query is within the last 5 minutes, the group is considered active and is displayed on the Active tab. If more than 5 minutes have passed after the last query in the group, it is considered inactive and is displayed on the Inactive tab.
The Monitoring → Commands → Groups tab consists of a table with the following information.
| Field | Description |
|---|---|
Query group ID |
An identifier of the query group calculated as a hash based on the SQL ID, node number, and node type |
SQL ID |
A common identifier for SQL commands with the same structure |
Cluster |
A name of the ADB cluster where the group queries are launched |
Database |
A name of the database where the group queries are launched |
Last submitted |
The time of the last query in the group |
Command text |
The text of the first SQL query in the group |
Type |
The type of the group. Currently, only the |
Above the table with a list of groups, the Cluster filter is located. You can use this filter to select the ADB cluster and its databases for which you want to display data in the table. Initially all databases of the default cluster are selected.


Group details
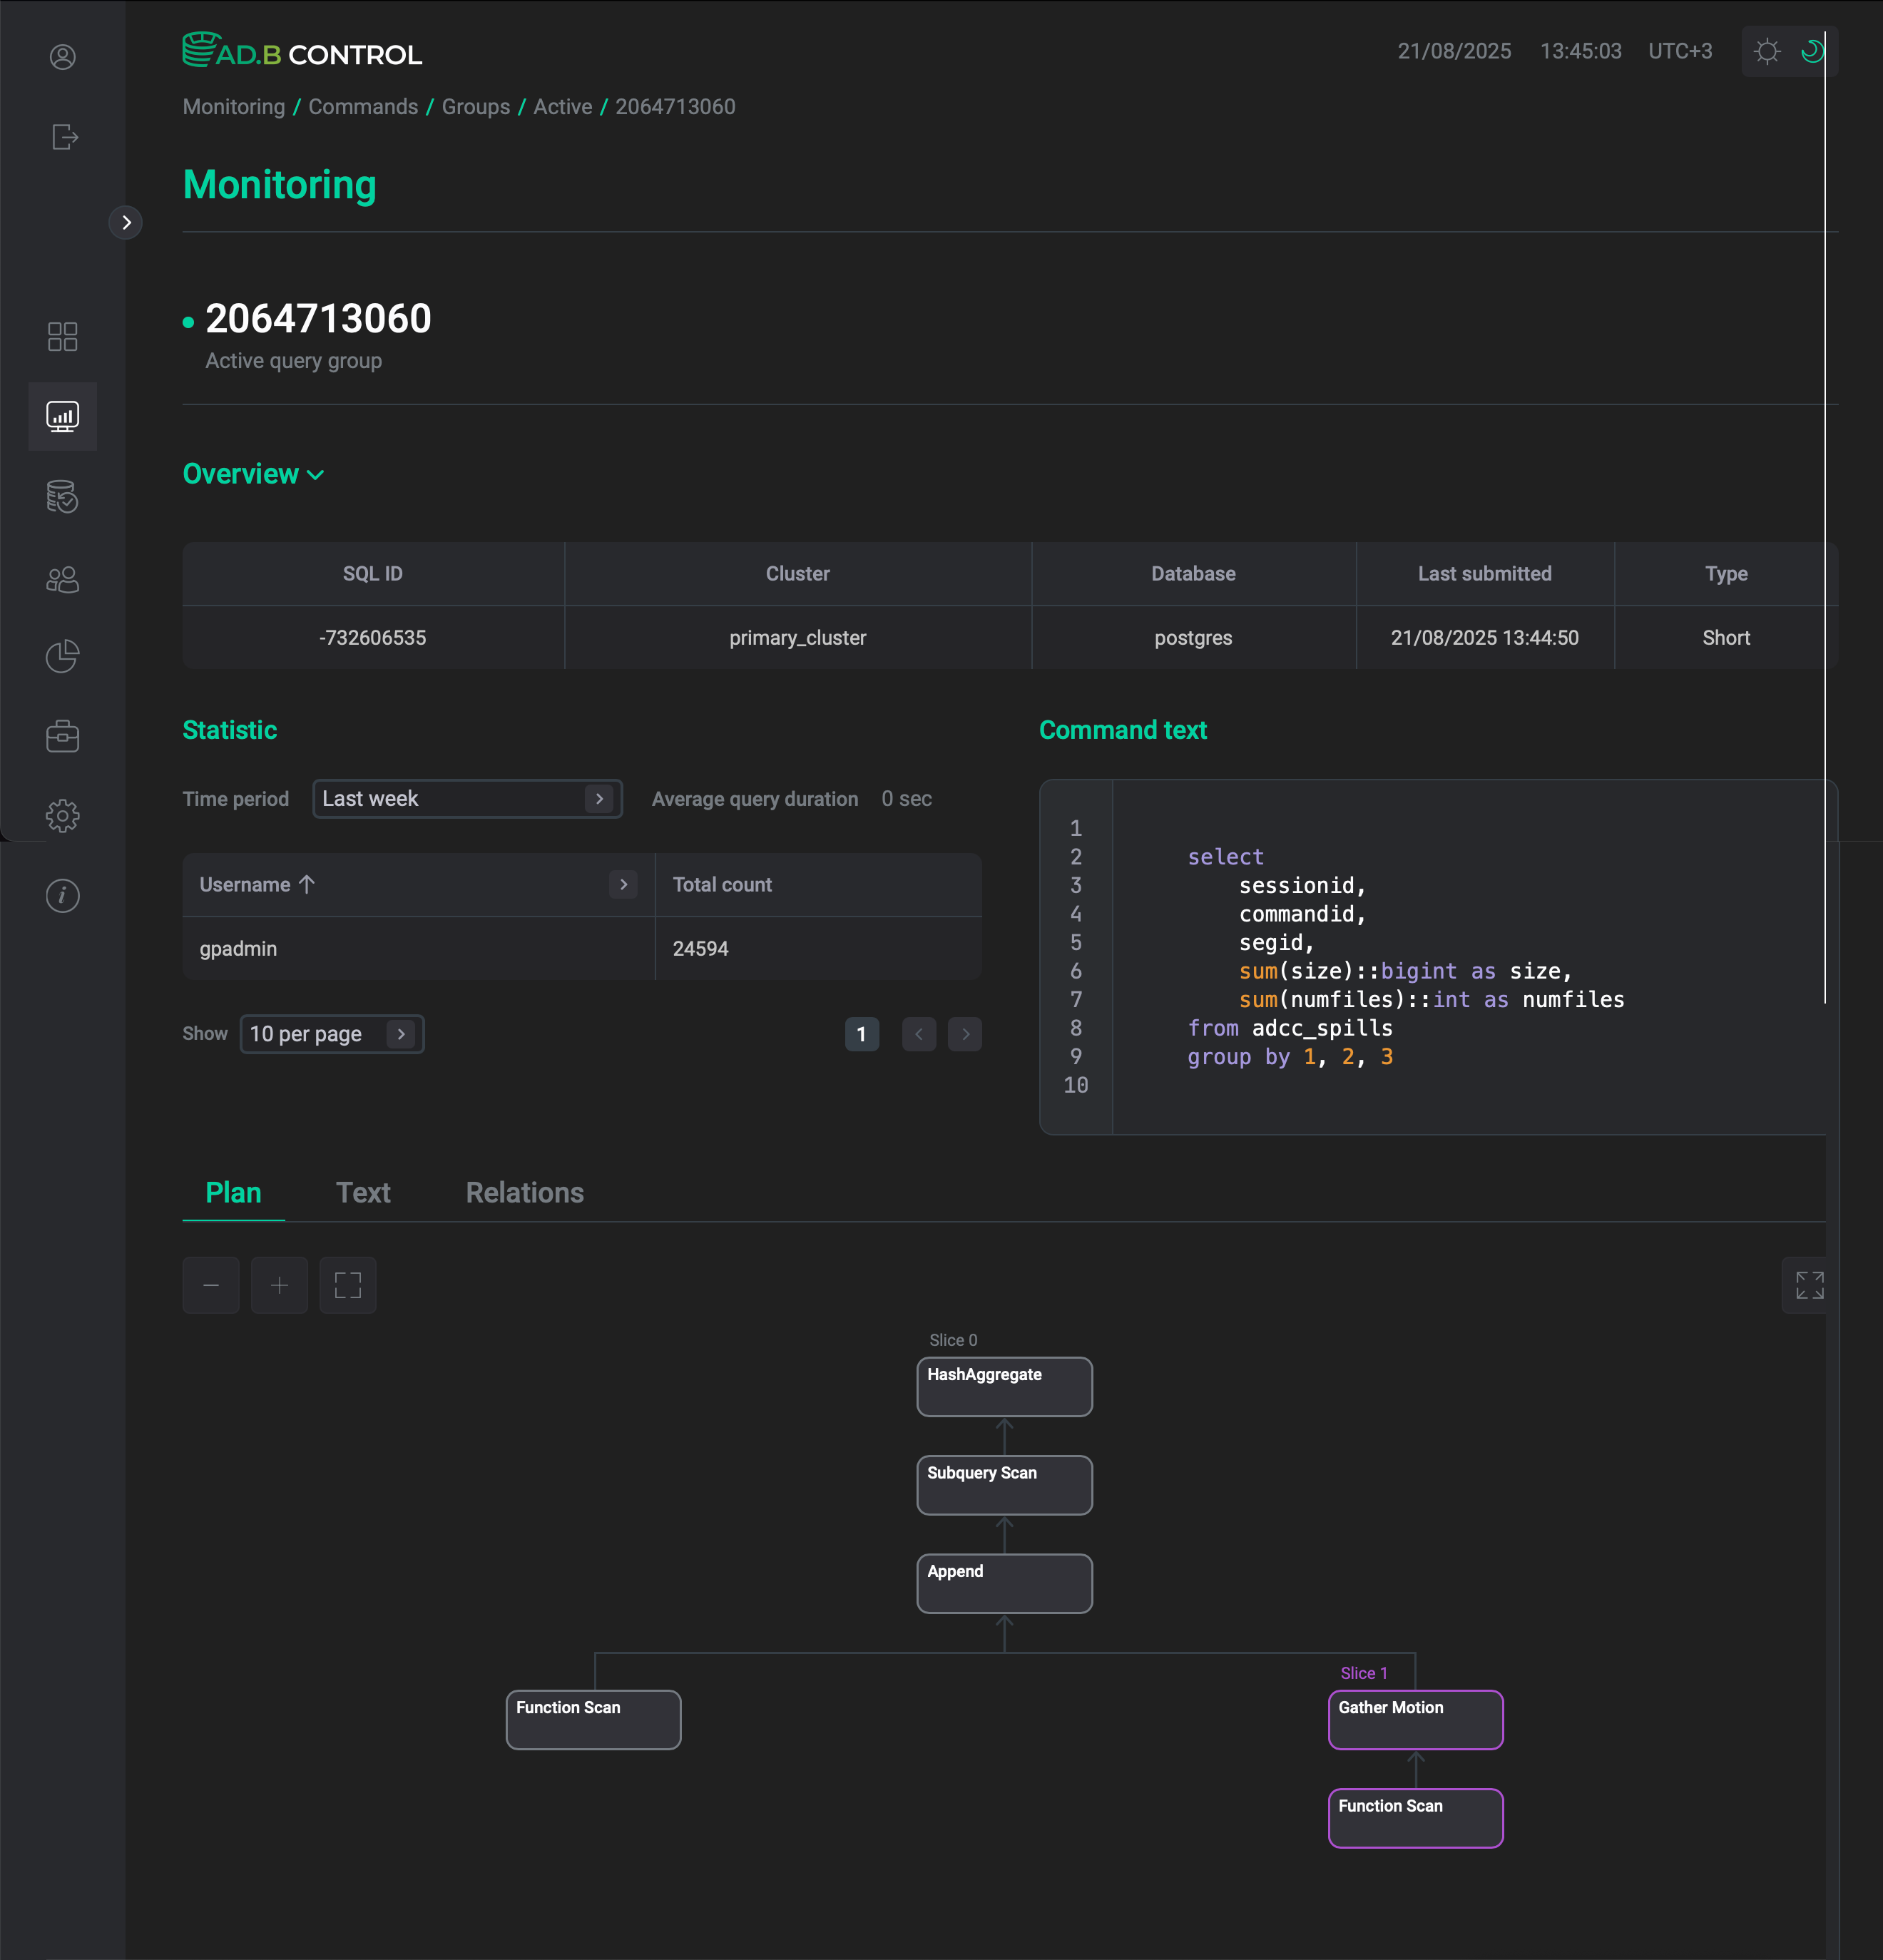
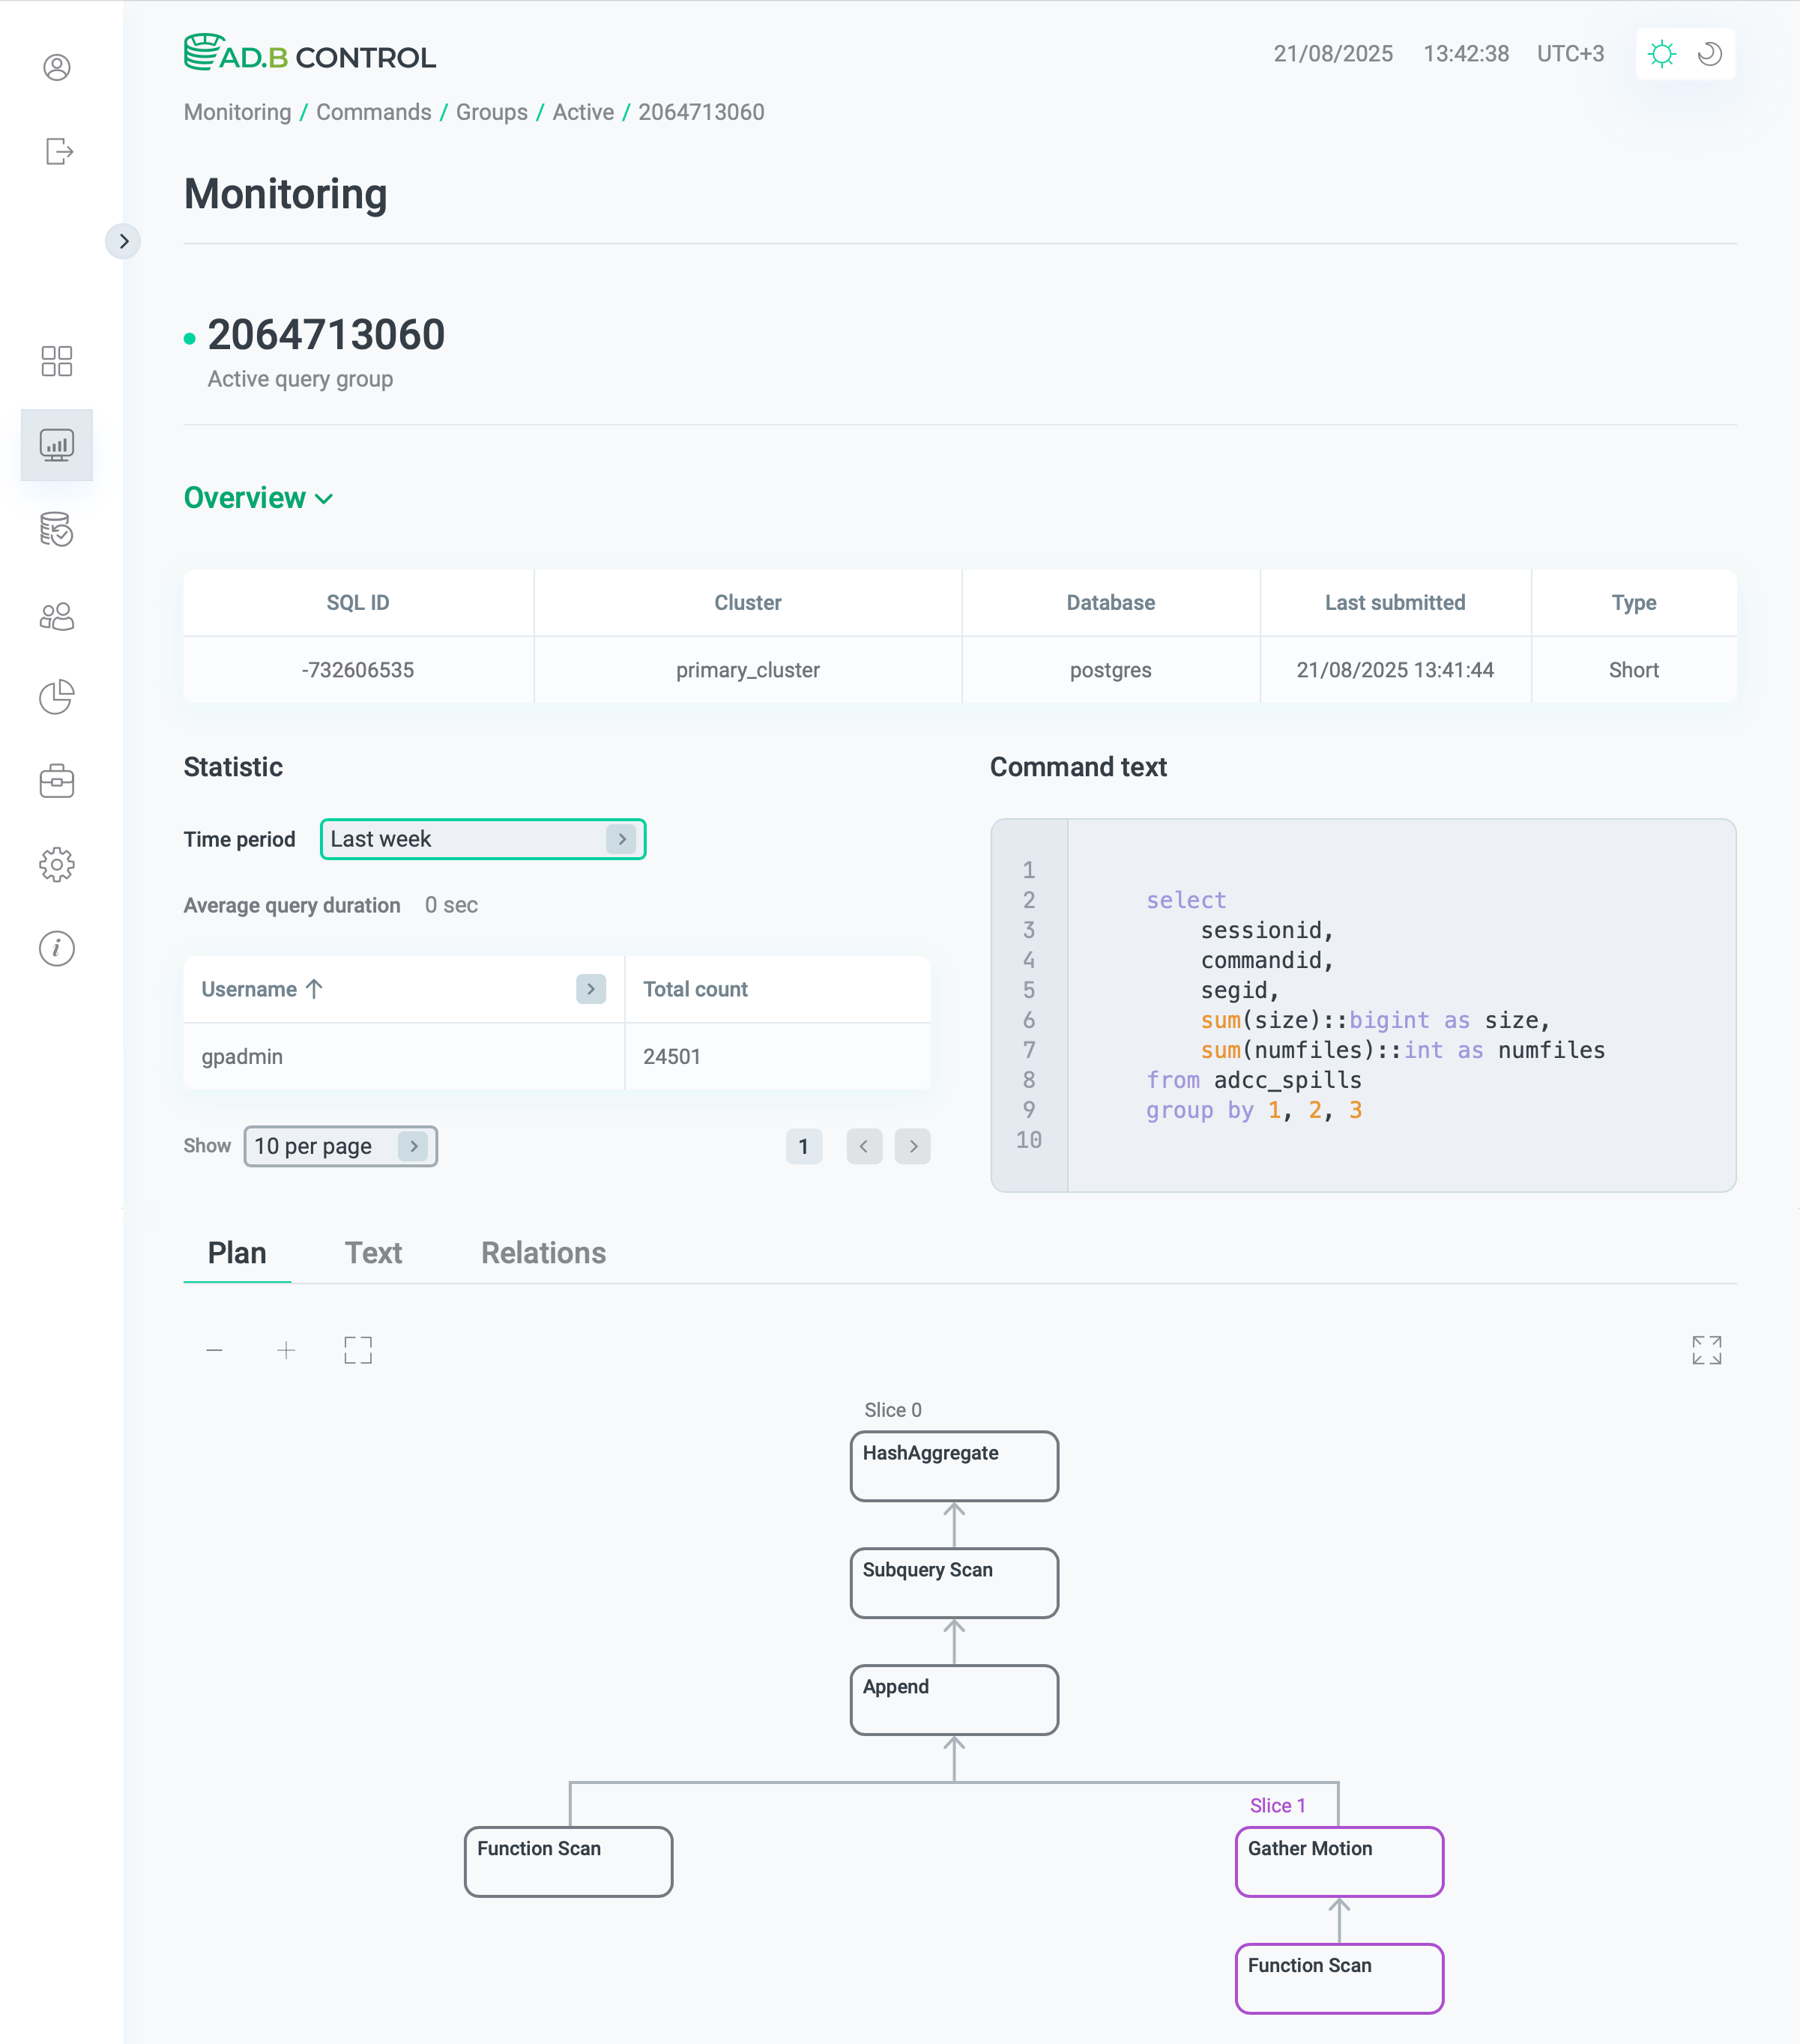
To view the group details, click the group identifier in the Query group ID column.
The page that opens contains the following sections:
-
Overview displays the main parameters of the group described in the table above.
-
Statistic shows the average query duration and the number of queries per user in the group. Use the Time period filter to show data for the last hour, last day, or last week.
-
Command text shows the text of the first SQL query in the group.
-
Plan, Text, and Relations — refer to Command details → Query plan sections for description of these tabs.
|
NOTE
Unlike the Queries tab, query groups don’t show the progress and the statuses of nodes. |
SQL ID
An SQL ID is an identifier of an SQL command structure.
ADB Control uses SQL ID to identify commands with the same structure and to categorize them into groups.
In ADB Control, SQL ID corresponds to the queryid value from the pg_stat_statements table in ADB.
Semantically equivalent SQL commands share the same SQL ID. In practice, this means the command properties described below will match.
Subqueries are analyzed recursively according to these same principles.
Factors affecting SQL ID
When the following SQL command properties differ, the commands will have separate SQL IDs.
| Property | Examples of commands with different SQL IDs |
|---|---|
Operation type: |
|
Target relations |
|
Affected columns including their order |
|
Functions. Different functions result in different SQL IDs regardless of their arguments |
|
Common table expressions. The structure and the order of CTEs if there are many. Different names result in different SQL IDs even if the content is identical |
|
The |
|
|
|
|
|
|
|
Window functions — columns, functions, operators |
|
|
|
Factors not affecting SQL ID
If only the following properties differ in SQL command text, the commands will have the same SQL ID.
| Property | Examples of commands having the same SQL ID |
|---|---|
Aliases |
|
Constants (literal values) in operators and functions |
|
Line breaks, spaces, and tabs |
|
|
|
All utility commands (those other than If a utility command has a subquery that is not a utility command, that subquery will have a separate SQL ID |
|