

Cruise Control usage example
The article describes how to use Cruise Control with Kafka in the ADS cluster, including examples of REST API requests via the cURL command-line tool.
Prerequisites
Below is the environment used to work with Cruise Control in ADS.
Install Cruise Control
Starting with ADS 3.9.0.1.b1, Cruise Control can be added as the Kafka Cruise Control component after adding and before installing the Kafka service in the ADS cluster.
If Kafka service is already installed, after upgrading the cluster to the desired version, the Kafka Cruise Control component can be added via the Add/Remove components action in the Kafka service.
Configure Cruise Control
If necessary, the configuration of Cruise Control parameters can be performed in the ADCM interface on the configuration page of the Kafka Cruise Control component. To configure, activate the Show advanced switch.
For the operation of Cruise Control, the following can be configured:
-
The configuration file of the Cruise Control main parameters.
To configure the main parameters, expand the node cruisecontrol.properties in the configuration settings tree and enter new values for the parameters. Descriptions of the parameters are provided in the Kafka → Kafka Cruise Control component configuration parameters section of the ADS configuration parameters article.
-
Used resources of Kafka brokers.
Before starting work with Cruise Control, a user can set a soft resource limit available to the Kafka cluster. This is done using a user-defined template of the capacity.json file — capacity.json config template.
For the broker, disk space parameters can be overridden, as shown below (for
brokerId = -1— the values are default, forbrokerId = 0— the values are overridden):{ "brokerCapacities":[ { "brokerId": "-1", "capacity": { "DISK": "100000", "CPU": "100", "NW_IN": "10000", "NW_OUT": "10000" }, "doc": "This is the default capacity. Capacity unit used for disk is in MB, cpu is in percentage, network throughput is in KB." }, { "brokerId": "0", "capacity": { "DISK": "500000", "CPU": "100", "NW_IN": "50000", "NW_OUT": "50000" }, "doc": "This overrides the capacity for broker 0." } ] }The capacity.json configuration does not set hard limits, but provides Cruise Control with information about the amount of resources (CPU, memory, disk space) allocated to the Kafka cluster, and the system offers optimization options based primarily on these constraints.
After changing the parameters via the ADCM interface, restart the Kafka service. To do this, apply the Restart action by clicking on the icon ![]()
![]() in the Actions column.
in the Actions column.
Start Cruise Control
Cruise Control is automatically activated after installation in the ADCM interface.
After the setup and run, there should be some time for the Metrics Reporter to collect initial metrics, and for the Analyzer to prepare the first proposals for optimization. For test clusters, 10—20 minutes is sufficient, but for production clusters, depending on the nature of the cluster’s load, it is recommended to wait 1—2 hours.
Use Cruise Control REST API
Interactions with Cruise Control are performed using the GET and POST requests sent to its REST API .
Requests are sent to the http://<hostname>:<port> address, where:
-
<hostname>is the name of the host where the Kafka Cruise Control component is installed. The hostname for Cruise Control is displayed on the Info tab of the Kafka service menu.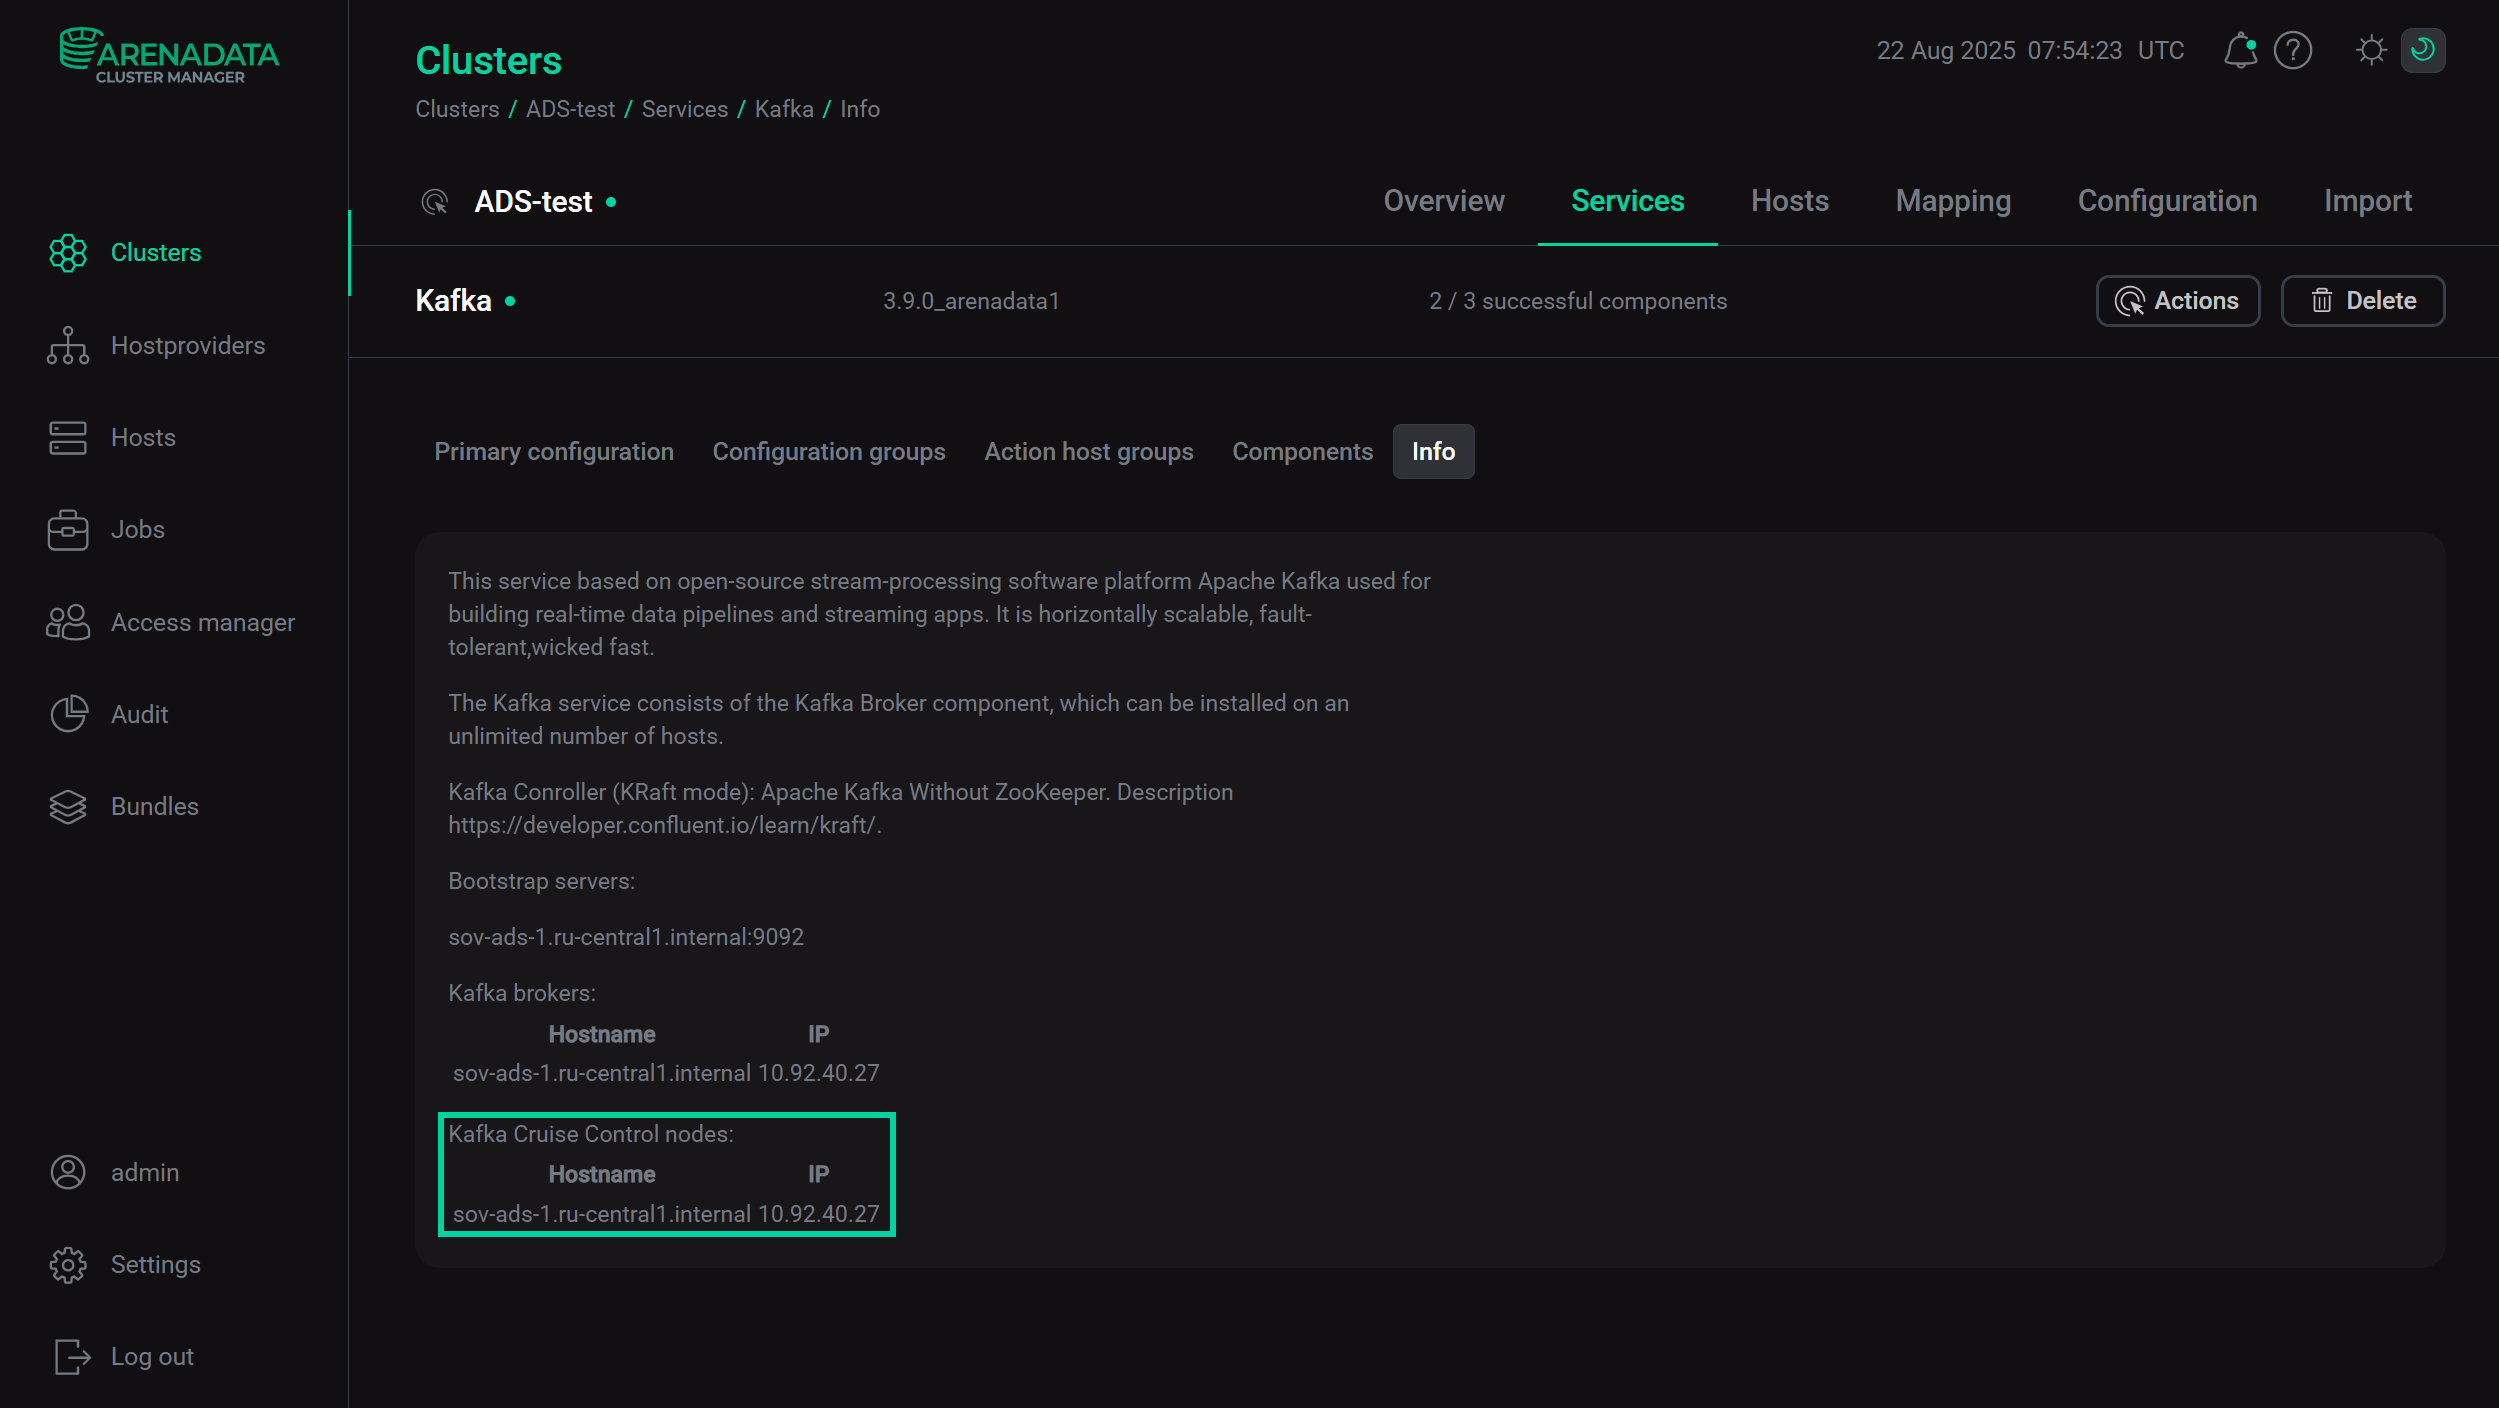 Info tab of the Kafka service menu
 -
<port>is the port for connecting to Cruise Control. It is specified as the value of thewebserver.http.portparameter during the configuration of the Kafka Cruise Control component. The default value in ADS is9181.
|
NOTE
In the queries provided below, the |
Cruise Control state
The state of Cruise Control can be obtained by sending a GET request to /kafkacruisecontrol/state:
$ curl -X GET 'http://10.92.40.27:9181/kafkacruisecontrol/state?json=true' |jqBelow is an example response regarding the Cruise Control state.
{
  "AnalyzerState": {
    "isProposalReady": true,
    "readyGoals": [
      "NetworkInboundUsageDistributionGoal",
      "CpuUsageDistributionGoal",
      "PotentialNwOutGoal",
      "LeaderReplicaDistributionGoal",
      "NetworkInboundCapacityGoal",
      "LeaderBytesInDistributionGoal",
      "DiskCapacityGoal",
      "ReplicaDistributionGoal",
      "RackAwareGoal",
      "TopicReplicaDistributionGoal",
      "NetworkOutboundCapacityGoal",
      "CpuCapacityGoal",
      "DiskUsageDistributionGoal",
      "NetworkOutboundUsageDistributionGoal",
      "ReplicaCapacityGoal"
    ]
  },
  "MonitorState": {
    "trainingPct": 20,
    "trained": false,
    "numFlawedPartitions": 0,
    "state": "RUNNING",
    "numTotalPartitions": 190,
    "numMonitoredWindows": 5,
    "monitoringCoveragePct": 100,
    "reasonOfLatestPauseOrResume": "Resumed-By-Cruise-Control-Before-Starting-Execution (Date: 2025-08-25T07:28:21Z)",
    "numValidPartitions": 190
  },
  "ExecutorState": {
    "state": "NO_TASK_IN_PROGRESS"
  },
  "AnomalyDetectorState": {
    "recentBrokerFailures": [
      {
        "anomalyId": "cdfed8c7-b5a7-47cb-9733-9e7585166e3d",
        "failedBrokersByTimeMs": {
          "2": 1756105916891
        },
        "detectionMs": 1756105916899,
        "statusUpdateMs": 1756105916901,
        "status": "CHECK_WITH_DELAY"
      }
    ],
    "recentGoalViolations": [],
    "selfHealingDisabled": [
      "DISK_FAILURE",
      "BROKER_FAILURE",
      "GOAL_VIOLATION",
      "METRIC_ANOMALY",
      "TOPIC_ANOMALY",
      "MAINTENANCE_EVENT"
    ],
    "balancednessScore": 100,
    "selfHealingEnabled": [],
    "recentDiskFailures": [],
    "metrics": {
      "meanTimeBetweenAnomaliesMs": {
        "GOAL_VIOLATION": 0,
        "TOPIC_ANOMALY": 0,
        "MAINTENANCE_EVENT": 0,
        "METRIC_ANOMALY": 0.3756093819295242,
        "DISK_FAILURE": 0,
        "BROKER_FAILURE": 0.18780465267895471
      },
      "ongoingAnomalyDurationMs": 0,
      "numSelfHealingStarted": 0,
      "numSelfHealingFailedToStart": 0,
      "meanTimeToStartFixMs": 2072139
    },
    "recentMetricAnomalies": [
      {
        "anomalyId": "364e7ae2-6b4c-44ba-8ac6-e065706122bc",
        "detectionMs": 1756104828843,
        "description": "Metric value 16.250 of BROKER_PRODUCE_LOCAL_TIME_MS_50TH for brokerId=1,host=sov-ads-1.ru-central1.internal in window 2025-08-25T06:55:00Z is out of the normal range for percentile: [10.00, 90.00] (value: [0.000, 10.031] with margins (lower: 0.200, upper: 0.500)) in 20 history windows from 2025-08-25T06:50:00Z to 2025-08-25T05:15:00Z.",
        "statusUpdateMs": 1756104828845,
        "status": "IGNORED"
      },
      {
        "anomalyId": "7584c388-189b-40a7-b013-6f81fded6df8",
        "detectionMs": 1756104828845,
        "description": "Metric value 18.917 of BROKER_PRODUCE_LOCAL_TIME_MS_50TH for brokerId=2,host=sov-ads-5.ru-central1.internal in window 2025-08-25T06:55:00Z is out of the normal range for percentile: [10.00, 90.00] (value: [0.000, 2.700] with margins (lower: 0.200, upper: 0.500)) in 20 history windows from 2025-08-25T06:50:00Z to 2025-08-25T05:15:00Z.",
        "statusUpdateMs": 1756104828845,
        "status": "IGNORED"
      }
    ],
    "recentTopicAnomalies": [],
    "selfHealingEnabledRatio": {
      "DISK_FAILURE": 0,
      "BROKER_FAILURE": 0,
      "GOAL_VIOLATION": 0,
      "METRIC_ANOMALY": 0,
      "TOPIC_ANOMALY": 0,
      "MAINTENANCE_EVENT": 0
    },
    "recentMaintenanceEvents": []
  },
  "version": 1
}
The provided example response displays the status of all Cruise Control components (statuses, readiness of proposals, used goals, found anomalies), including a description of the recently discovered metric anomalies (recentMetricAnomalies) related to brokers.
Cluster load
The cluster load and the state of the brokers can be obtained by sending a GET request to /kafkacruisecontrol/load.
$ curl -X GET 'http://10.92.40.27:9181/kafkacruisecontrol/load?json=true' |jqBelow is an example response about the cluster load.
{
  "brokers": [
    {
      "FollowerNwInRate": 0,
      "BrokerState": "ALIVE",
      "Broker": 1,
      "NwOutRate": 0.03215755149722099,
      "NumCore": 1,
      "Host": "sov-ads-1.ru-central1.internal",
      "CpuPct": 0.6822174191474915,
      "Replicas": 83,
      "NetworkInCapacity": 50000,
      "Rack": "sov-ads-1.ru-central1.internal",
      "Leaders": 60,
      "DiskCapacityMB": 20000,
      "DiskMB": 13.415552139282227,
      "PnwOutRate": 0.03215755149722099,
      "NetworkOutCapacity": 50000,
      "LeaderNwInRate": 0.043243322521448135,
      "DiskPct": 0.06707776069641114
    },
    {
      "FollowerNwInRate": 0,
      "BrokerState": "ALIVE",
      "Broker": 2,
      "NwOutRate": 0.0601540207862854,
      "NumCore": 1,
      "Host": "sov-ads-5.ru-central1.internal",
      "CpuPct": 7.6233110427856445,
      "Replicas": 88,
      "NetworkInCapacity": 50000,
      "Rack": "sov-ads-5.ru-central1.internal",
      "Leaders": 57,
      "DiskCapacityMB": 20000,
      "DiskMB": 12.10150146484375,
      "PnwOutRate": 0.0601540207862854,
      "NetworkOutCapacity": 50000,
      "LeaderNwInRate": 0.038225192576646805,
      "DiskPct": 0.06050750732421875
    },
    {
      "FollowerNwInRate": 0,
      "BrokerState": "ALIVE",
      "Broker": 3,
      "NwOutRate": 0.019182980060577393,
      "NumCore": 1,
      "Host": "sov-ads-9.ru-central1.internal",
      "CpuPct": 0.7776201963424683,
      "Replicas": 99,
      "NetworkInCapacity": 50000,
      "Rack": "sov-ads-9.ru-central1.internal",
      "Leaders": 73,
      "DiskCapacityMB": 20000,
      "DiskMB": 6.148280143737793,
      "PnwOutRate": 0.019182980060577393,
      "NetworkOutCapacity": 50000,
      "LeaderNwInRate": 0.019607990980148315,
      "DiskPct": 0.030741400718688965
    }
  ],
  "hosts": [
    {
      "FollowerNwInRate": 0,
      "NwOutRate": 0.03215755149722099,
      "NumCore": 1,
      "Host": "sov-ads-1.ru-central1.internal",
      "CpuPct": 0.6822174191474915,
      "Replicas": 83,
      "NetworkInCapacity": 50000,
      "Rack": "sov-ads-1.ru-central1.internal",
      "Leaders": 60,
      "DiskCapacityMB": 20000,
      "DiskMB": 13.415552139282227,
      "PnwOutRate": 0.03215755149722099,
      "NetworkOutCapacity": 50000,
      "LeaderNwInRate": 0.043243322521448135,
      "DiskPct": 0.06707776069641114
    },
    {
      "FollowerNwInRate": 0,
      "NwOutRate": 0.0601540207862854,
      "NumCore": 1,
      "Host": "sov-ads-5.ru-central1.internal",
      "CpuPct": 7.6233110427856445,
      "Replicas": 88,
      "NetworkInCapacity": 50000,
      "Rack": "sov-ads-5.ru-central1.internal",
      "Leaders": 57,
      "DiskCapacityMB": 20000,
      "DiskMB": 12.10150146484375,
      "PnwOutRate": 0.0601540207862854,
      "NetworkOutCapacity": 50000,
      "LeaderNwInRate": 0.038225192576646805,
      "DiskPct": 0.06050750732421875
    },
    {
      "FollowerNwInRate": 0,
      "NwOutRate": 0.019182980060577393,
      "NumCore": 1,
      "Host": "sov-ads-9.ru-central1.internal",
      "CpuPct": 0.7776201963424683,
      "Replicas": 99,
      "NetworkInCapacity": 50000,
      "Rack": "sov-ads-9.ru-central1.internal",
      "Leaders": 73,
      "DiskCapacityMB": 20000,
      "DiskMB": 6.148280143737793,
      "PnwOutRate": 0.019182980060577393,
      "NetworkOutCapacity": 50000,
      "LeaderNwInRate": 0.019607990980148315,
      "DiskPct": 0.030741400718688965
    }
  ],
  "version": 1
}|
NOTE
The shown load only refers to the load from partitions with a sufficient number of metric samples. Therefore, always check the status of LoadMonitor (through the |
Proposals view
Proposals for optimization from Cruise Control can be obtained by sending a GET request to /kafkacruisecontrol/proposals:
$ curl -X GET 'http://10.92.40.27:9181/kafkacruisecontrol/proposals?json=true' |jqFor clarity, a new broker was added to the cluster before viewing the proposals, and the partitions were automatically redistributed.
Below is the response after the Cruise Control proposals request.
{  "summary": {
    "numIntraBrokerReplicaMovements": 0,
    "numReplicaMovements": 97,
    "onDemandBalancednessScoreAfter": 79.74705957325753,
    "intraBrokerDataToMoveMB": 0,
    "monitoredPartitionsPercentage": 100,
    "provisionRecommendation": "",
    "excludedBrokersForReplicaMove": [],
    "excludedBrokersForLeadership": [],
    "provisionStatus": "RIGHT_SIZED",
    "onDemandBalancednessScoreBefore": 74.5020336497431,
    "recentWindows": 5,
    "dataToMoveMB": 0,
    "excludedTopics": [],
    "numLeaderMovements": 0
  },
  "goalSummary": [
   ...
    {
      "clusterModelStats": {
        "statistics": {
          "AVG": {
            "disk": 8.032857894897461,
            "replicas": 67.5,
            "leaderReplicas": 47.5,
            "cpu": 1.4941092729568481,
            "networkOutbound": 0.02796957641839981,
            "networkInbound": 0.026663552969694138,
            "topicReplicas": 7.5,
            "potentialNwOut": 0.027969577349722385
          },
          "STD": {
            "disk": 5.044990525164198,
            "replicas": 3.774917217635375,
            "leaderReplicas": 8.440971508067067,
            "cpu": 1.7554403795885893,
            "networkOutbound": 0.02202569000419393,
            "networkInbound": 0.010510778657732341,
            "topicReplicas": 4.514831618707495,
            "potentialNwOut": 0.02202569000419391
          },
          "MIN": {
            "disk": 0.5629663467407227,
            "replicas": 61,
            "leaderReplicas": 38,
            "cpu": 0.1823471486568451,
            "networkOutbound": 0,
            "networkInbound": 0.011331086046993732,
            "topicReplicas": 0,
            "potentialNwOut": 0
          },
          "MAX": {
            "disk": 12.988670349121094,
            "replicas": 70,
            "leaderReplicas": 61,
            "cpu": 4.5058794021606445,
            "networkOutbound": 0.06056395173072815,
            "networkInbound": 0.03814876452088356,
            "topicReplicas": 20,
            "potentialNwOut": 0.06056395173072815
          }
        },
        "metadata": {
          "topics": 9,
          "replicas": 270,
          "brokers": 4
        }
      },
      "optimizationTimeMs": 5,
      "status": "VIOLATED",
      "goal": "DiskUsageDistributionGoal"
    },
    ...
    ...
    {
      "clusterModelStats": {
        "statistics": {
          "AVG": {
            "disk": 8.032857894897461,
            "replicas": 67.5,
            "leaderReplicas": 47.5,
            "cpu": 1.4941092729568481,
            "networkOutbound": 0.02796957641839981,
            "networkInbound": 0.026663552969694138,
            "topicReplicas": 7.5,
            "potentialNwOut": 0.027969577349722385
          },
          "STD": {
            "disk": 5.044990525164198,
            "replicas": 3.774917217635375,
            "leaderReplicas": 8.440971508067067,
            "cpu": 1.748044132782149,
            "networkOutbound": 0.02202569000419393,
            "networkInbound": 0.007883814130179204,
            "topicReplicas": 4.656829177051786,
            "potentialNwOut": 0.02202569000419391
          },
          "MIN": {
            "disk": 0.5629663467407227,
            "replicas": 61,
            "leaderReplicas": 38,
            "cpu": 0.2709278166294098,
            "networkOutbound": 0,
            "networkInbound": 0.016833635047078133,
            "topicReplicas": 0,
            "potentialNwOut": 0
          },
          "MAX": {
            "disk": 12.988670349121094,
            "replicas": 70,
            "leaderReplicas": 61,
            "cpu": 4.5058794021606445,
            "networkOutbound": 0.06056395173072815,
            "networkInbound": 0.03814876452088356,
            "topicReplicas": 21,
            "potentialNwOut": 0.06056395173072815
          }
        },
        "metadata": {
          "topics": 9,
          "replicas": 270,
          "brokers": 4
        }
      },
      "optimizationTimeMs": 1,
      "status": "VIOLATED",
      "goal": "CpuUsageDistributionGoal"
    },
   ...
   ...
    {
      "clusterModelStats": {
        "statistics": {
          "AVG": {
            "disk": 8.032857894897461,
            "replicas": 67.5,
            "leaderReplicas": 47.5,
            "cpu": 1.4941092729568481,
            "networkOutbound": 0.02796957641839981,
            "networkInbound": 0.026663552969694138,
            "topicReplicas": 7.5,
            "potentialNwOut": 0.027969577349722385
          },
          "STD": {
            "disk": 5.044990525164198,
            "replicas": 3.774917217635375,
            "leaderReplicas": 8.440971508067067,
            "cpu": 1.748044132782149,
            "networkOutbound": 0.02202569000419393,
            "networkInbound": 0.007883814130179204,
            "topicReplicas": 4.656829177051786,
            "potentialNwOut": 0.02202569000419391
          },
          "MIN": {
            "disk": 0.5629663467407227,
            "replicas": 61,
            "leaderReplicas": 38,
            "cpu": 0.2709278166294098,
            "networkOutbound": 0,
            "networkInbound": 0.016833635047078133,
            "topicReplicas": 0,
            "potentialNwOut": 0
          },
          "MAX": {
            "disk": 12.988670349121094,
            "replicas": 70,
            "leaderReplicas": 61,
            "cpu": 4.5058794021606445,
            "networkOutbound": 0.06056395173072815,
            "networkInbound": 0.03814876452088356,
            "topicReplicas": 21,
            "potentialNwOut": 0.06056395173072815
          }
        },
        "metadata": {
          "topics": 9,
          "replicas": 270,
          "brokers": 4
        }
      },
      "optimizationTimeMs": 1,
      "status": "VIOLATED",
      "goal": "LeaderBytesInDistributionGoal"
    }
  ],
  "loadAfterOptimization": {
    "brokers": [
      {
        "FollowerNwInRate": 0,
        "BrokerState": "ALIVE",
        "Broker": 1,
        "NwOutRate": 0.032181717455387115,
        "NumCore": 1,
        "Host": "sov-ads-1.ru-central1.internal",
        "CpuPct": 0.767410159111023,
        "Replicas": 61,
        "NetworkInCapacity": 50000,
        "Rack": "sov-ads-1.ru-central1.internal",
        "Leaders": 61,
        "DiskCapacityMB": 20000,
        "DiskMB": 12.988670349121094,
        "PnwOutRate": 0.032181717455387115,
        "NetworkOutCapacity": 50000,
        "LeaderNwInRate": 0.028894560411572456,
        "DiskPct": 0.06494335174560546
      },
      {
        "FollowerNwInRate": 0,
        "BrokerState": "ALIVE",
        "Broker": 2,
        "NwOutRate": 0.06056395173072815,
        "NumCore": 1,
        "Host": "sov-ads-5.ru-central1.internal",
        "CpuPct": 4.5058794021606445,
        "Replicas": 69,
        "NetworkInCapacity": 50000,
        "Rack": "sov-ads-5.ru-central1.internal",
        "Leaders": 38,
        "DiskCapacityMB": 20000,
        "DiskMB": 12.313807487487793,
        "PnwOutRate": 0.06056395173072815,
        "NetworkOutCapacity": 50000,
        "LeaderNwInRate": 0.03814876452088356,
        "DiskPct": 0.06156903743743897
      },
      {
        "FollowerNwInRate": 0,
        "BrokerState": "ALIVE",
        "Broker": 3,
        "NwOutRate": 0.019132640212774277,
        "NumCore": 1,
        "Host": "sov-ads-9.ru-central1.internal",
        "CpuPct": 0.4322197437286377,
        "Replicas": 70,
        "NetworkInCapacity": 50000,
        "Rack": "sov-ads-9.ru-central1.internal",
        "Leaders": 44,
        "DiskCapacityMB": 20000,
        "DiskMB": 6.265987396240234,
        "PnwOutRate": 0.019132640212774277,
        "NetworkOutCapacity": 50000,
        "LeaderNwInRate": 0.0227772518992424,
        "DiskPct": 0.03132993698120117
      },
      {
        "FollowerNwInRate": 0,
        "BrokerState": "ALIVE",
        "Broker": 4,
        "NwOutRate": 0,
        "NumCore": 1,
        "Host": "sov-ads-6.ru-central1.internal",
        "CpuPct": 0.2709278166294098,
        "Replicas": 70,
        "NetworkInCapacity": 50000,
        "Rack": "sov-ads-6.ru-central1.internal",
        "Leaders": 47,
        "DiskCapacityMB": 20000,
        "DiskMB": 0.5629663467407227,
        "PnwOutRate": 0,
        "NetworkOutCapacity": 50000,
        "LeaderNwInRate": 0.016833635047078133,
        "DiskPct": 0.0028148317337036133
      }
    ],
    "hosts": [
      {
        "FollowerNwInRate": 0,
        "NwOutRate": 0.032181717455387115,
        "NumCore": 1,
        "Host": "sov-ads-1.ru-central1.internal",
        "CpuPct": 0.767410159111023,
        "Replicas": 61,
        "NetworkInCapacity": 50000,
        "Rack": "sov-ads-1.ru-central1.internal",
        "Leaders": 61,
        "DiskCapacityMB": 20000,
        "DiskMB": 12.988670349121094,
        "PnwOutRate": 0.032181717455387115,
        "NetworkOutCapacity": 50000,
        "LeaderNwInRate": 0.028894560411572456,
        "DiskPct": 0.06494335174560546
      },
      {
        "FollowerNwInRate": 0,
        "NwOutRate": 0.06056395173072815,
        "NumCore": 1,
        "Host": "sov-ads-5.ru-central1.internal",
        "CpuPct": 4.5058794021606445,
        "Replicas": 69,
        "NetworkInCapacity": 50000,
        "Rack": "sov-ads-5.ru-central1.internal",
        "Leaders": 38,
        "DiskCapacityMB": 20000,
        "DiskMB": 12.313807487487793,
        "PnwOutRate": 0.06056395173072815,
        "NetworkOutCapacity": 50000,
        "LeaderNwInRate": 0.03814876452088356,
        "DiskPct": 0.06156903743743897
      },
      {
        "FollowerNwInRate": 0,
        "NwOutRate": 0,
        "NumCore": 1,
        "Host": "sov-ads-6.ru-central1.internal",
        "CpuPct": 0.2709278166294098,
        "Replicas": 70,
        "NetworkInCapacity": 50000,
        "Rack": "sov-ads-6.ru-central1.internal",
        "Leaders": 47,
        "DiskCapacityMB": 20000,
        "DiskMB": 0.5629663467407227,
        "PnwOutRate": 0,
        "NetworkOutCapacity": 50000,
        "LeaderNwInRate": 0.016833635047078133,
        "DiskPct": 0.0028148317337036133
      },
      {
        "FollowerNwInRate": 0,
        "NwOutRate": 0.019132640212774277,
        "NumCore": 1,
        "Host": "sov-ads-9.ru-central1.internal",
        "CpuPct": 0.4322197437286377,
        "Replicas": 70,
        "NetworkInCapacity": 50000,
        "Rack": "sov-ads-9.ru-central1.internal",
        "Leaders": 44,
        "DiskCapacityMB": 20000,
        "DiskMB": 6.265987396240234,
        "PnwOutRate": 0.019132640212774277,
        "NetworkOutCapacity": 50000,
        "LeaderNwInRate": 0.0227772518992424,
        "DiskPct": 0.03132993698120117
      }
    ]
  },
  "version": 1
}
The summary section provides an overview of the proposal. In the given response example, a movement of 97 replicas is suggested (the numReplicaMovements parameter).
The goalSummary section outlines the overview of goals, where it describes the goals that are violated (in the VIOLATED status). In this example, only the violated goals are left, but the report is generated for all specified goals, including those not violated (in the NO-ACTION status).
In the provided response example, disk usage among brokers is violated, meaning that some brokers have partitions taking up more space than others, and the distribution of leaders is unbalanced. This is the main reason the analyzer wants to move 97 replicas.
The loadAfterOptimization section shows the cluster load model after the proposed optimization.
Proposals acceptance
Proposals for optimization from Cruise Control can be accepted by triggering a rebalance using a POST request to /kafkacruisecontrol/rebalance:
$ curl -X POST 'http://10.92.40.27:9181/kafkacruisecontrol/rebalance?dryrun=false&json=true' |jqwhere the dryrun parameter indicates whether to perform a test run of the request.
The response to the request is identical to the request for proposals.
If after the rebalancing you perform cluster load request, in the response to the request you can see that the existing load of the cluster matches the load model shown in the proposal.
Check the status of the request
The user can view the status of requested tasks by sending a GET request to /kafkacruisecontrol/user_tasks:
$ curl -X GET 'http://10.92.40.27:9181/kafkacruisecontrol/user_tasks?json=true' |jqBelow is the response after the request statuses from Cruise Control.
{
  "userTasks": [
    {
      "Status": "CompletedWithError",
      "ClientIdentity": "10.92.40.27",
      "RequestURL": "GET /kafkacruisecontrol/proposals?json=true",
      "UserTaskId": "b6bb21c1-23a3-4981-b051-a9a06a34fc73",
      "StartMs": "1756106056396"
    },
    {
      "Status": "Completed",
      "ClientIdentity": "10.92.40.27",
      "RequestURL": "GET /kafkacruisecontrol/load?json=true",
      "UserTaskId": "d246263f-b1f9-4c02-a84a-c916571a0982",
      "StartMs": "1756111195815"
    },
    {
      "Status": "Completed",
      "ClientIdentity": "10.92.40.27",
      "RequestURL": "POST /kafkacruisecontrol/rebalance?dryrun=false&json=true",
      "UserTaskId": "7997fd56-64d3-427b-874b-d99d08a0d9f5",
      "StartMs": "1756106900752"
    },
    {
      "Status": "Completed",
      "ClientIdentity": "10.92.40.27",
      "RequestURL": "GET /kafkacruisecontrol/state?json=true",
      "UserTaskId": "7007d120-1139-4b5f-a827-0be23ba33597",
      "StartMs": "1756105986205"
    }
  ],
  "version": 1
}