

Configure Enterprise Tools cluster
|
IMPORTANT
Before the subsequent monitoring configuration, make sure that the Enterprise Tools (ET) cluster is installed via ADCM. All the following actions are performed on its base.
|
Step 1. Add monitoring services to the ET cluster
The steps for adding services to a cluster are listed below:
-
Select a cluster on the Clusters page. To do this, click a cluster name in the Name column.
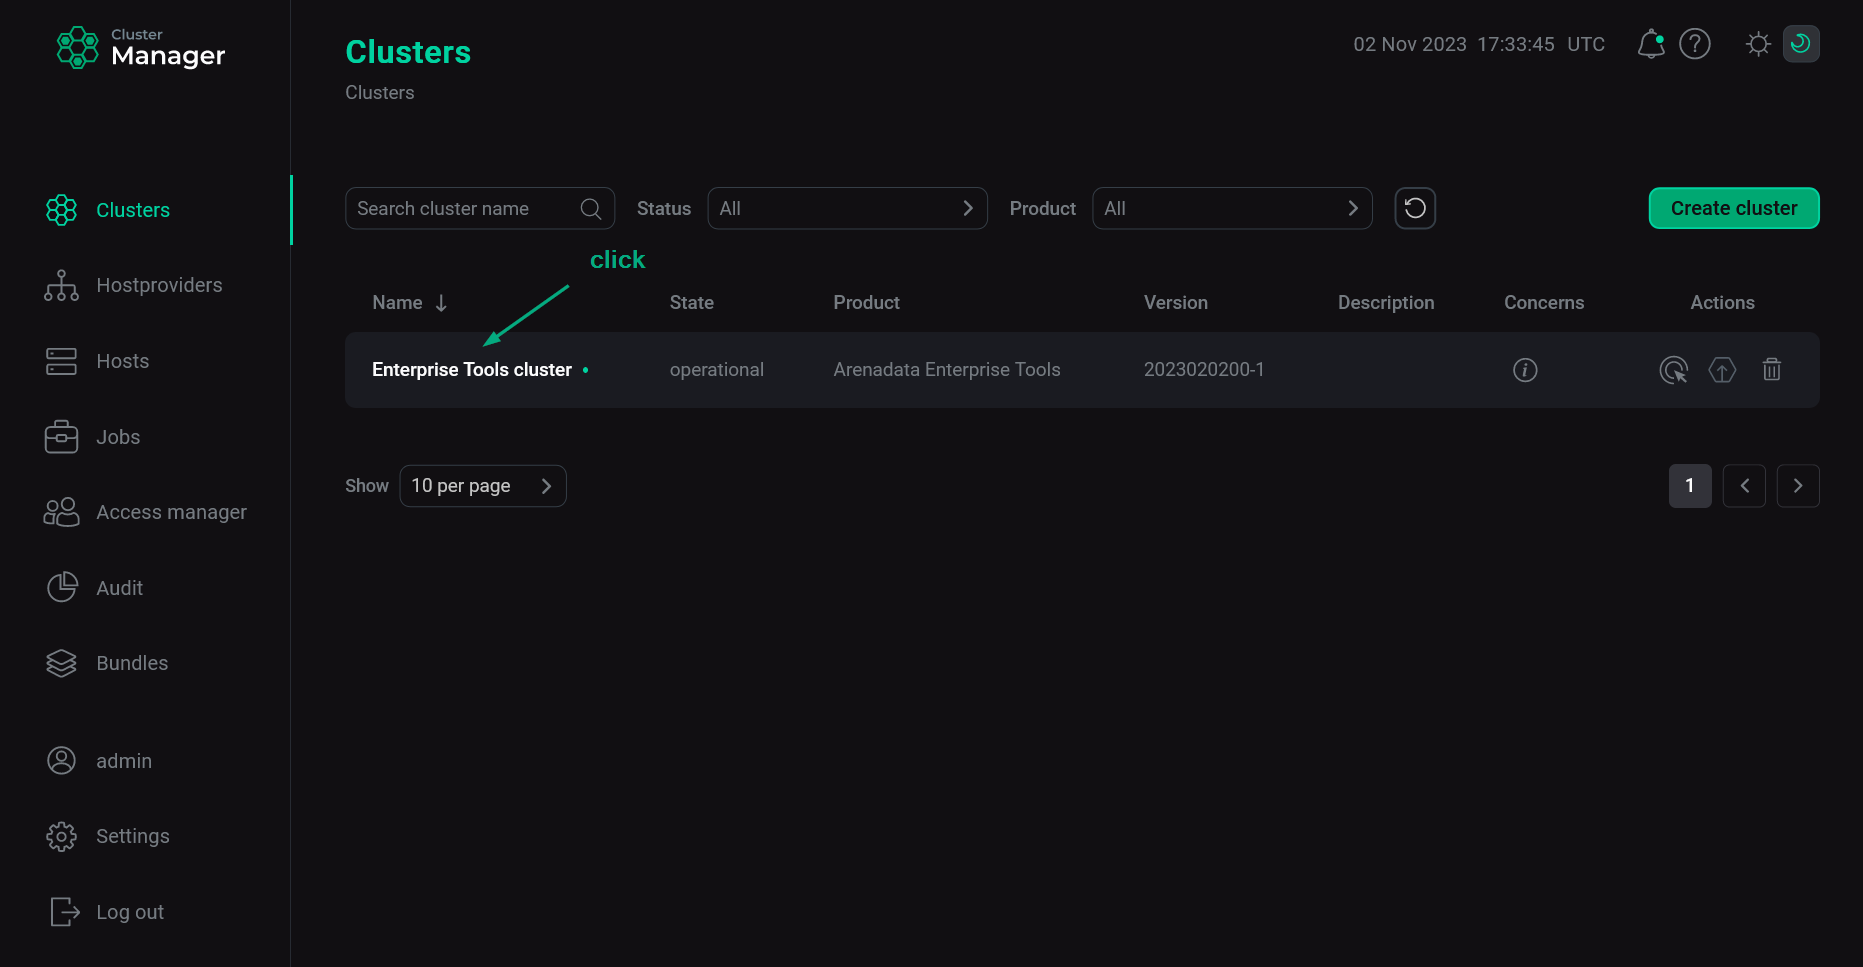 Select a cluster
 -
Open the Services tab on the cluster page and click Add services (Add service in first versions of ADCM).
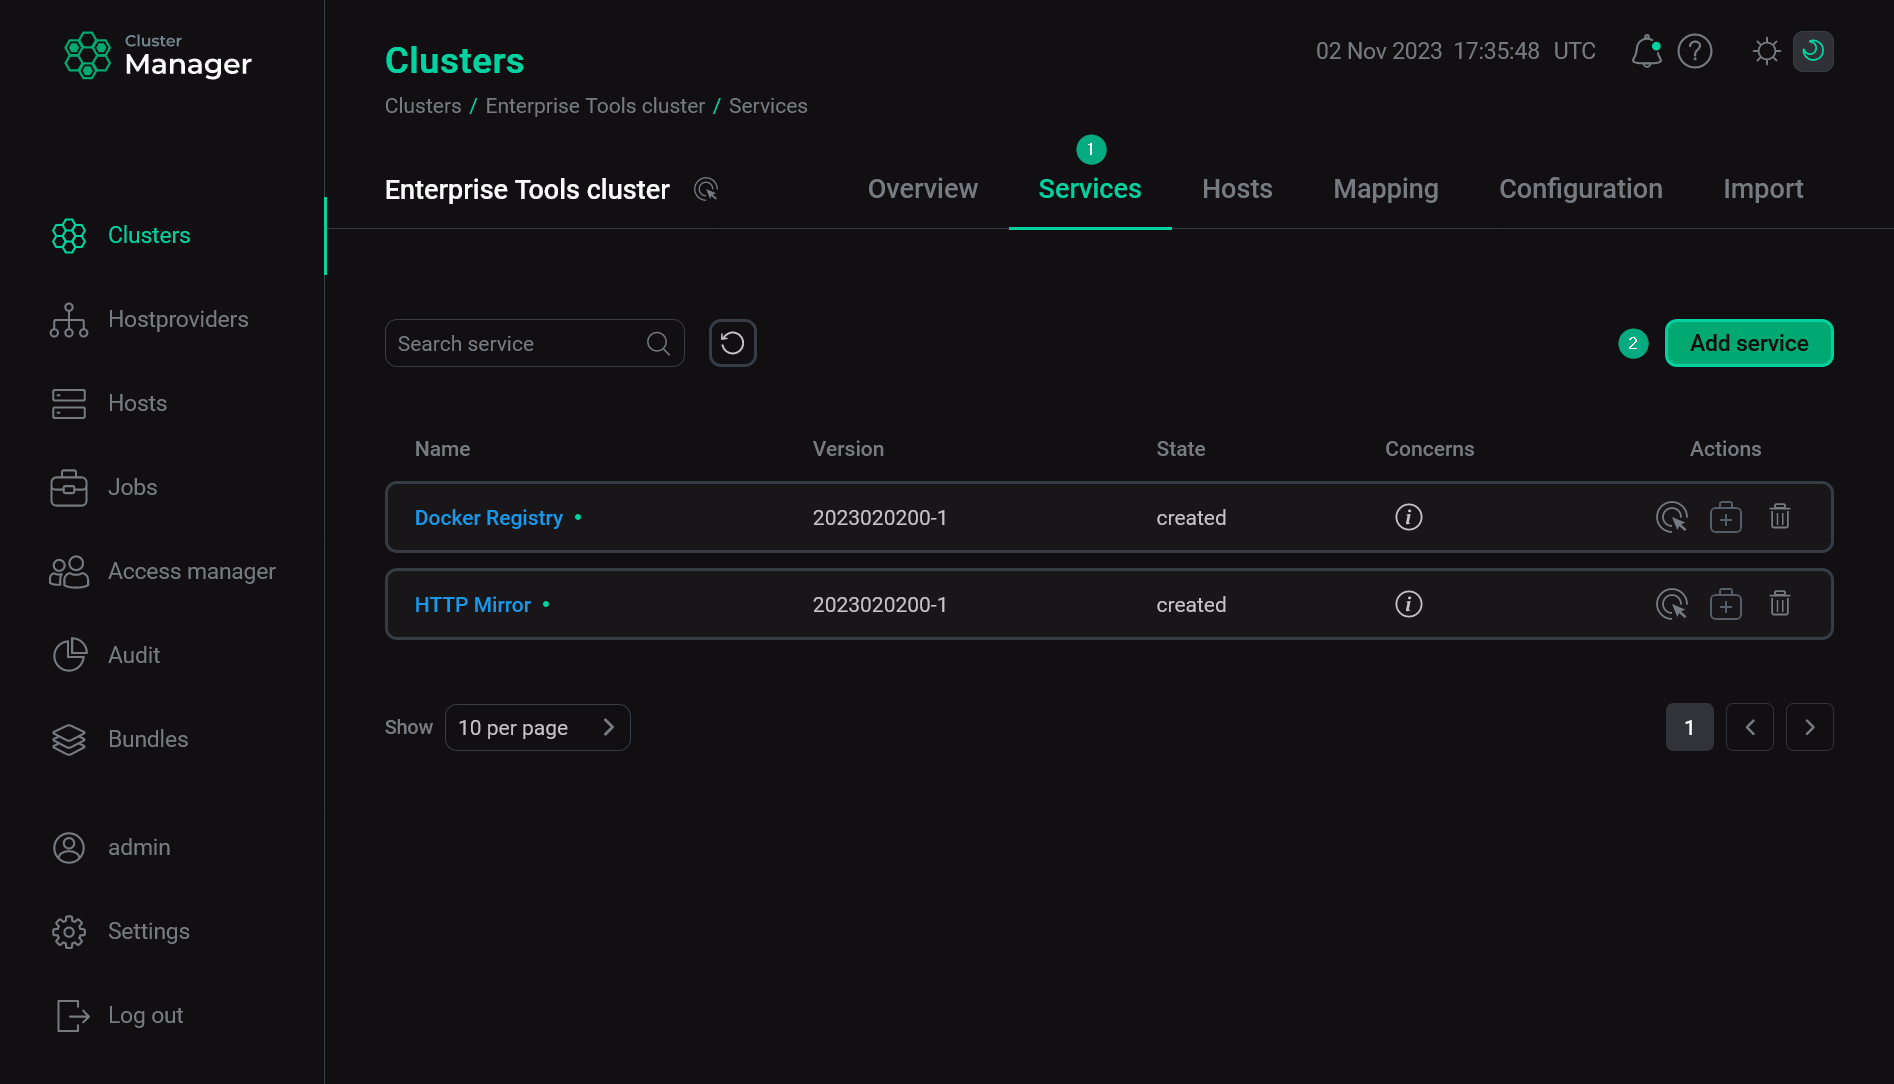 Switch to adding services
 -
In the opened dialog, select services that should be added to the cluster and click Add.
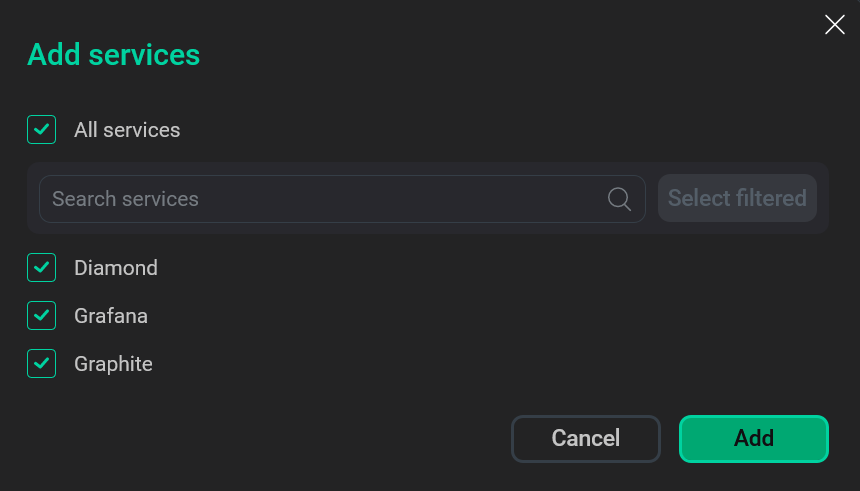 Select services
The brief description of available services is listed below.
Monitoring services that should be added to the Enterprise Tools cluster Service Purpose Diamond
A Python service used for collecting system metrics from the hosts that are connected to the monitoring system. The collected metrics are processed by Carbon (the backend services of Graphite)
Graphite
Includes several components:
-
Carbon — a set of services that are used to process metrics collected by Diamond.
-
Whisper DB — a temporary file database where collected metrics are stored.
-
Web service — allows to get and visualize metrics from Whisper DB.
Grafana
A web service that allows users to create convenient sets of graphs, alerts, and other visualization tools for metrics received from Graphite. By default, uses the port
3000 -
-
As a result, the added services are displayed on the Services tab.
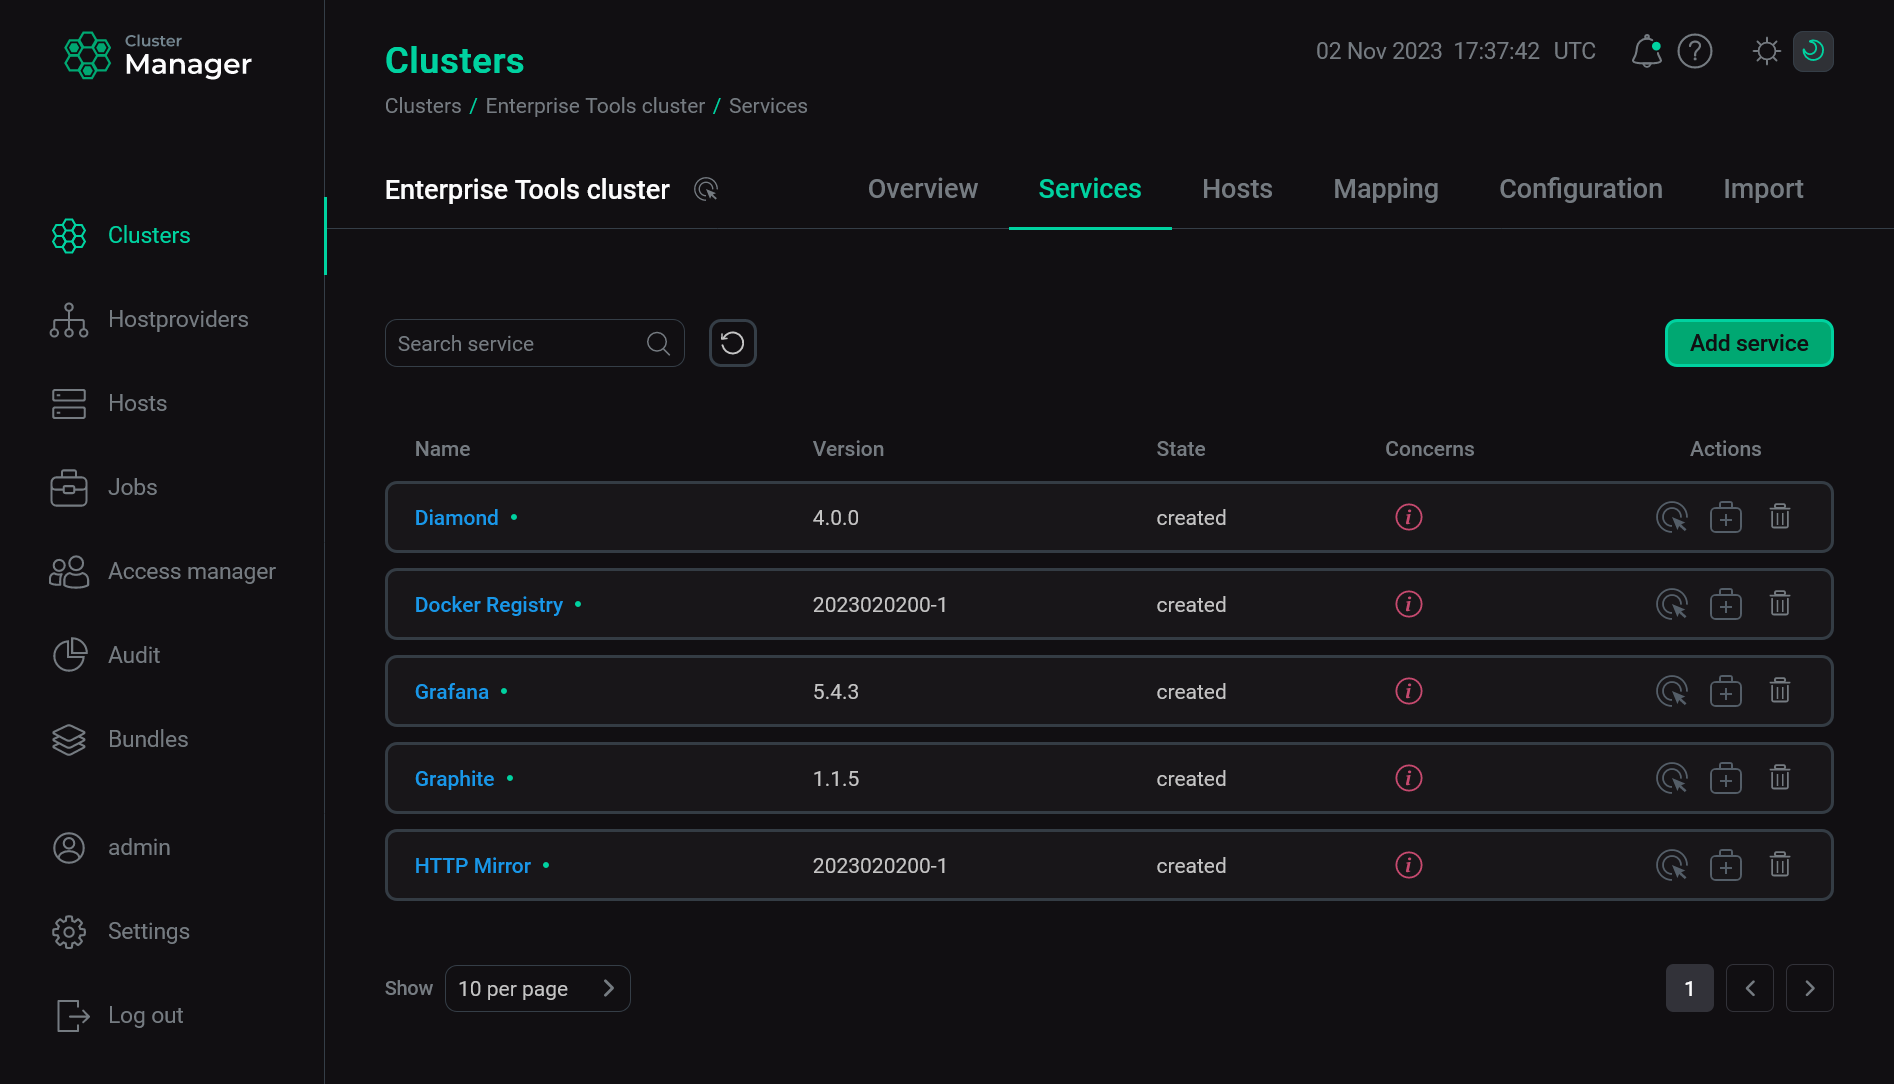 The result of successful adding services to a cluster
Step 2. Map monitoring components
The steps for adding components to hosts are listed below:
-
Select a cluster on the Clusters page. To do this, click a cluster name in the Name column.
Select a cluster -
Open the Mapping tab on the cluster page, map monitoring components to all cluster hosts, and click Save.
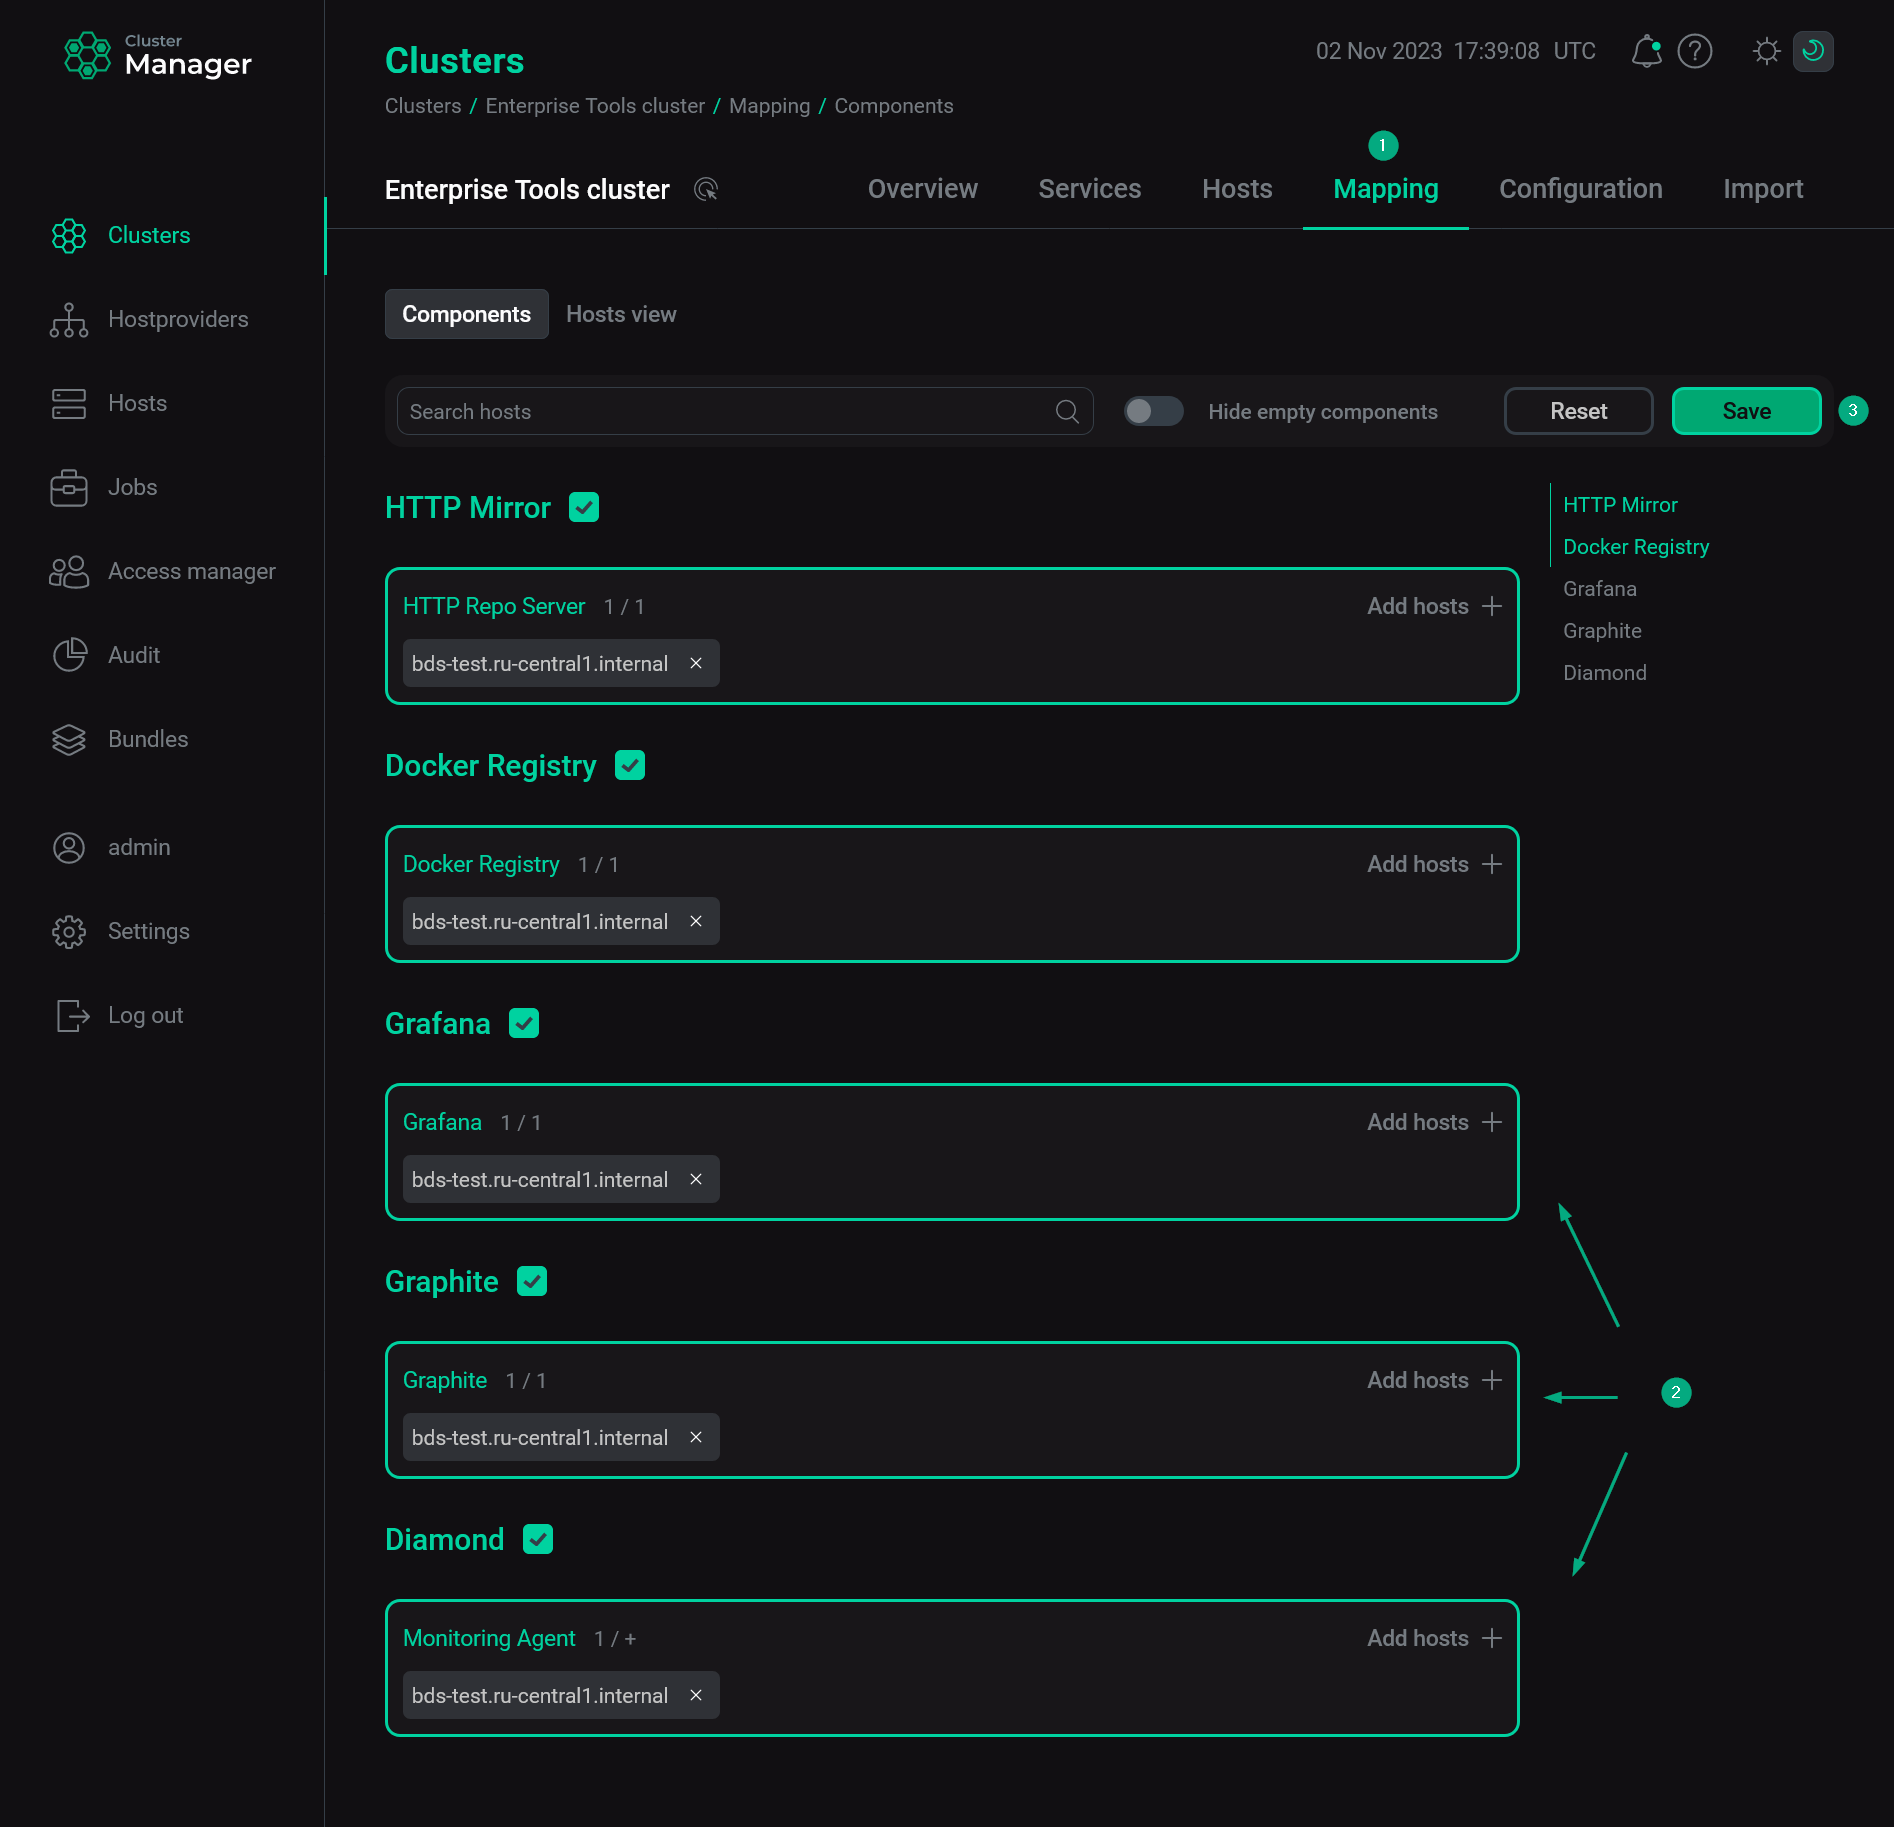 Map components to hosts
Step 3. Configure monitoring services
-
Select a cluster on the Clusters page. To do this, click a cluster name in the Name column.
Select a cluster -
Open the Services tab on the cluster page, find the row that contains the desired service, and click its name in the Name column.
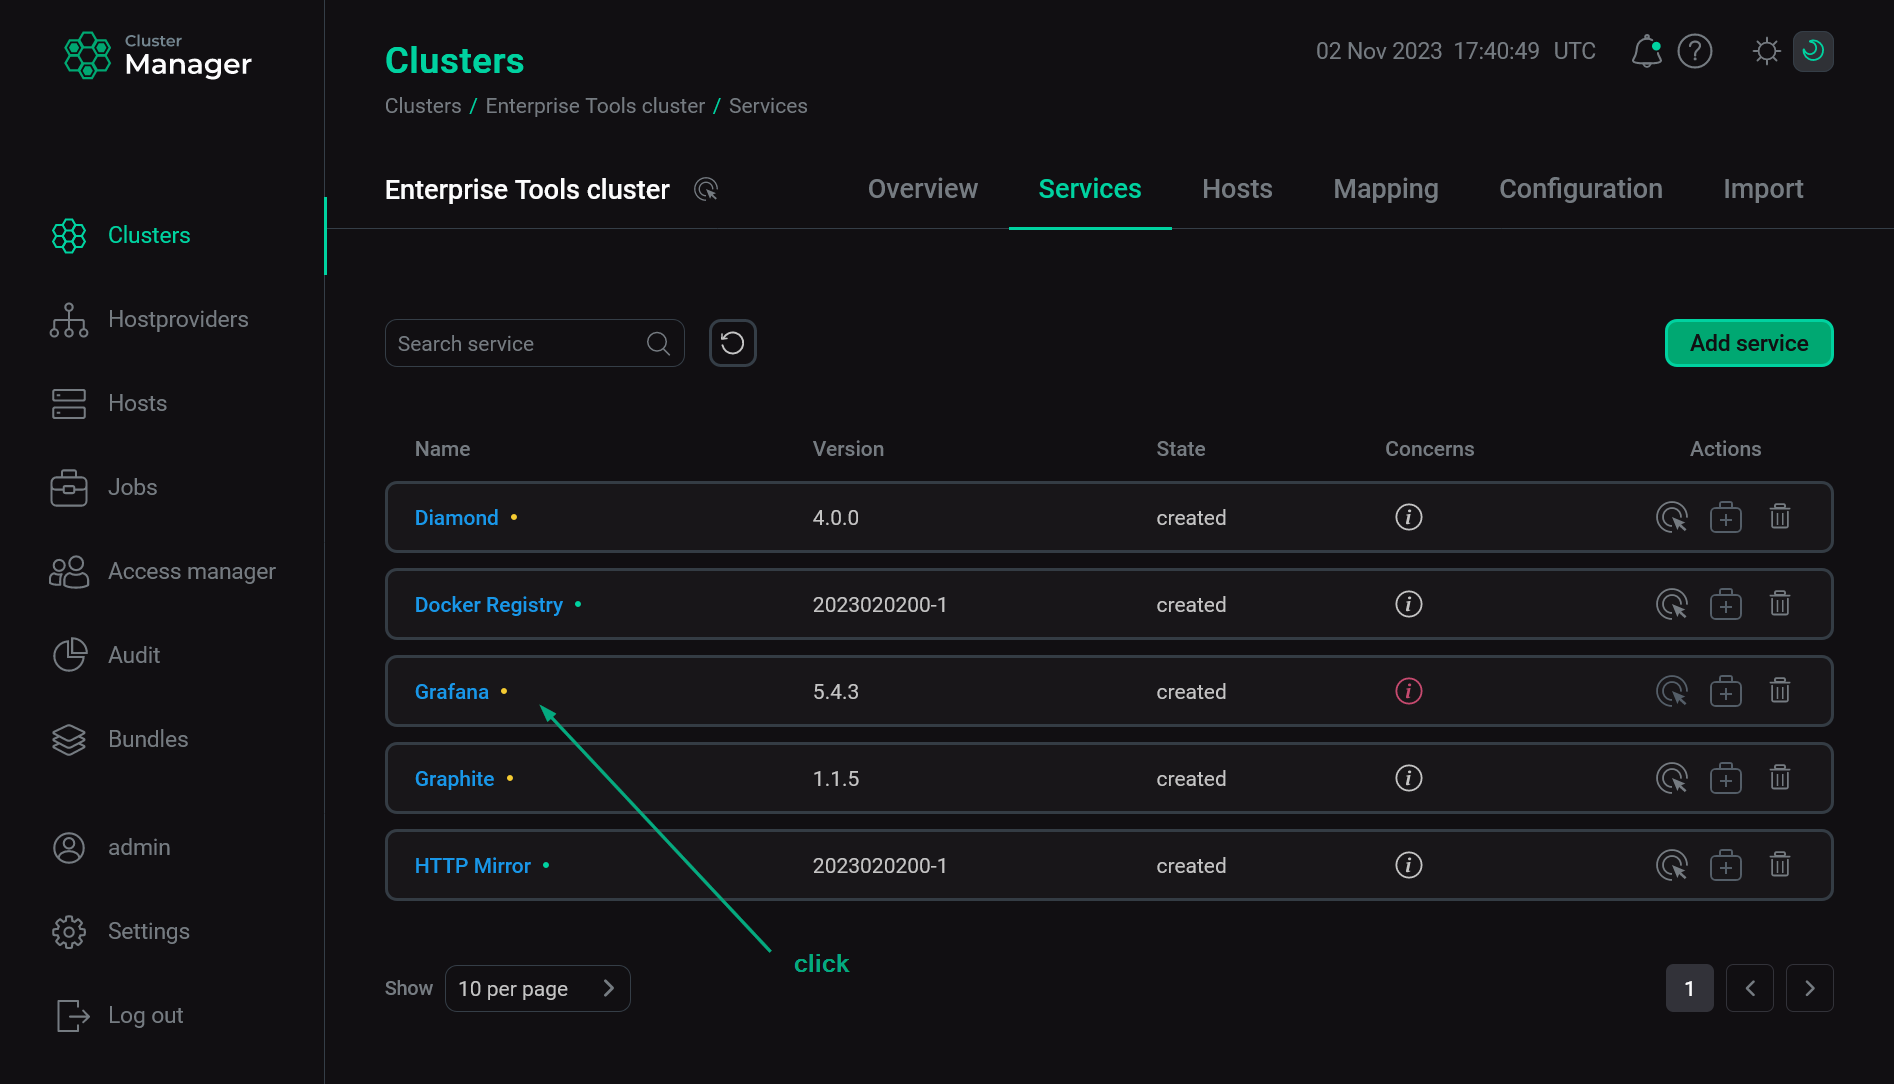 Switch to configuring services
 -
In the window that opens:
-
Open the Primary Configuration tab.
-
Switch on the Show advanced toggle.
-
Fill in configuration parameters of the selected service. The fields highlighted in red are mandatory.
-
Click Save.
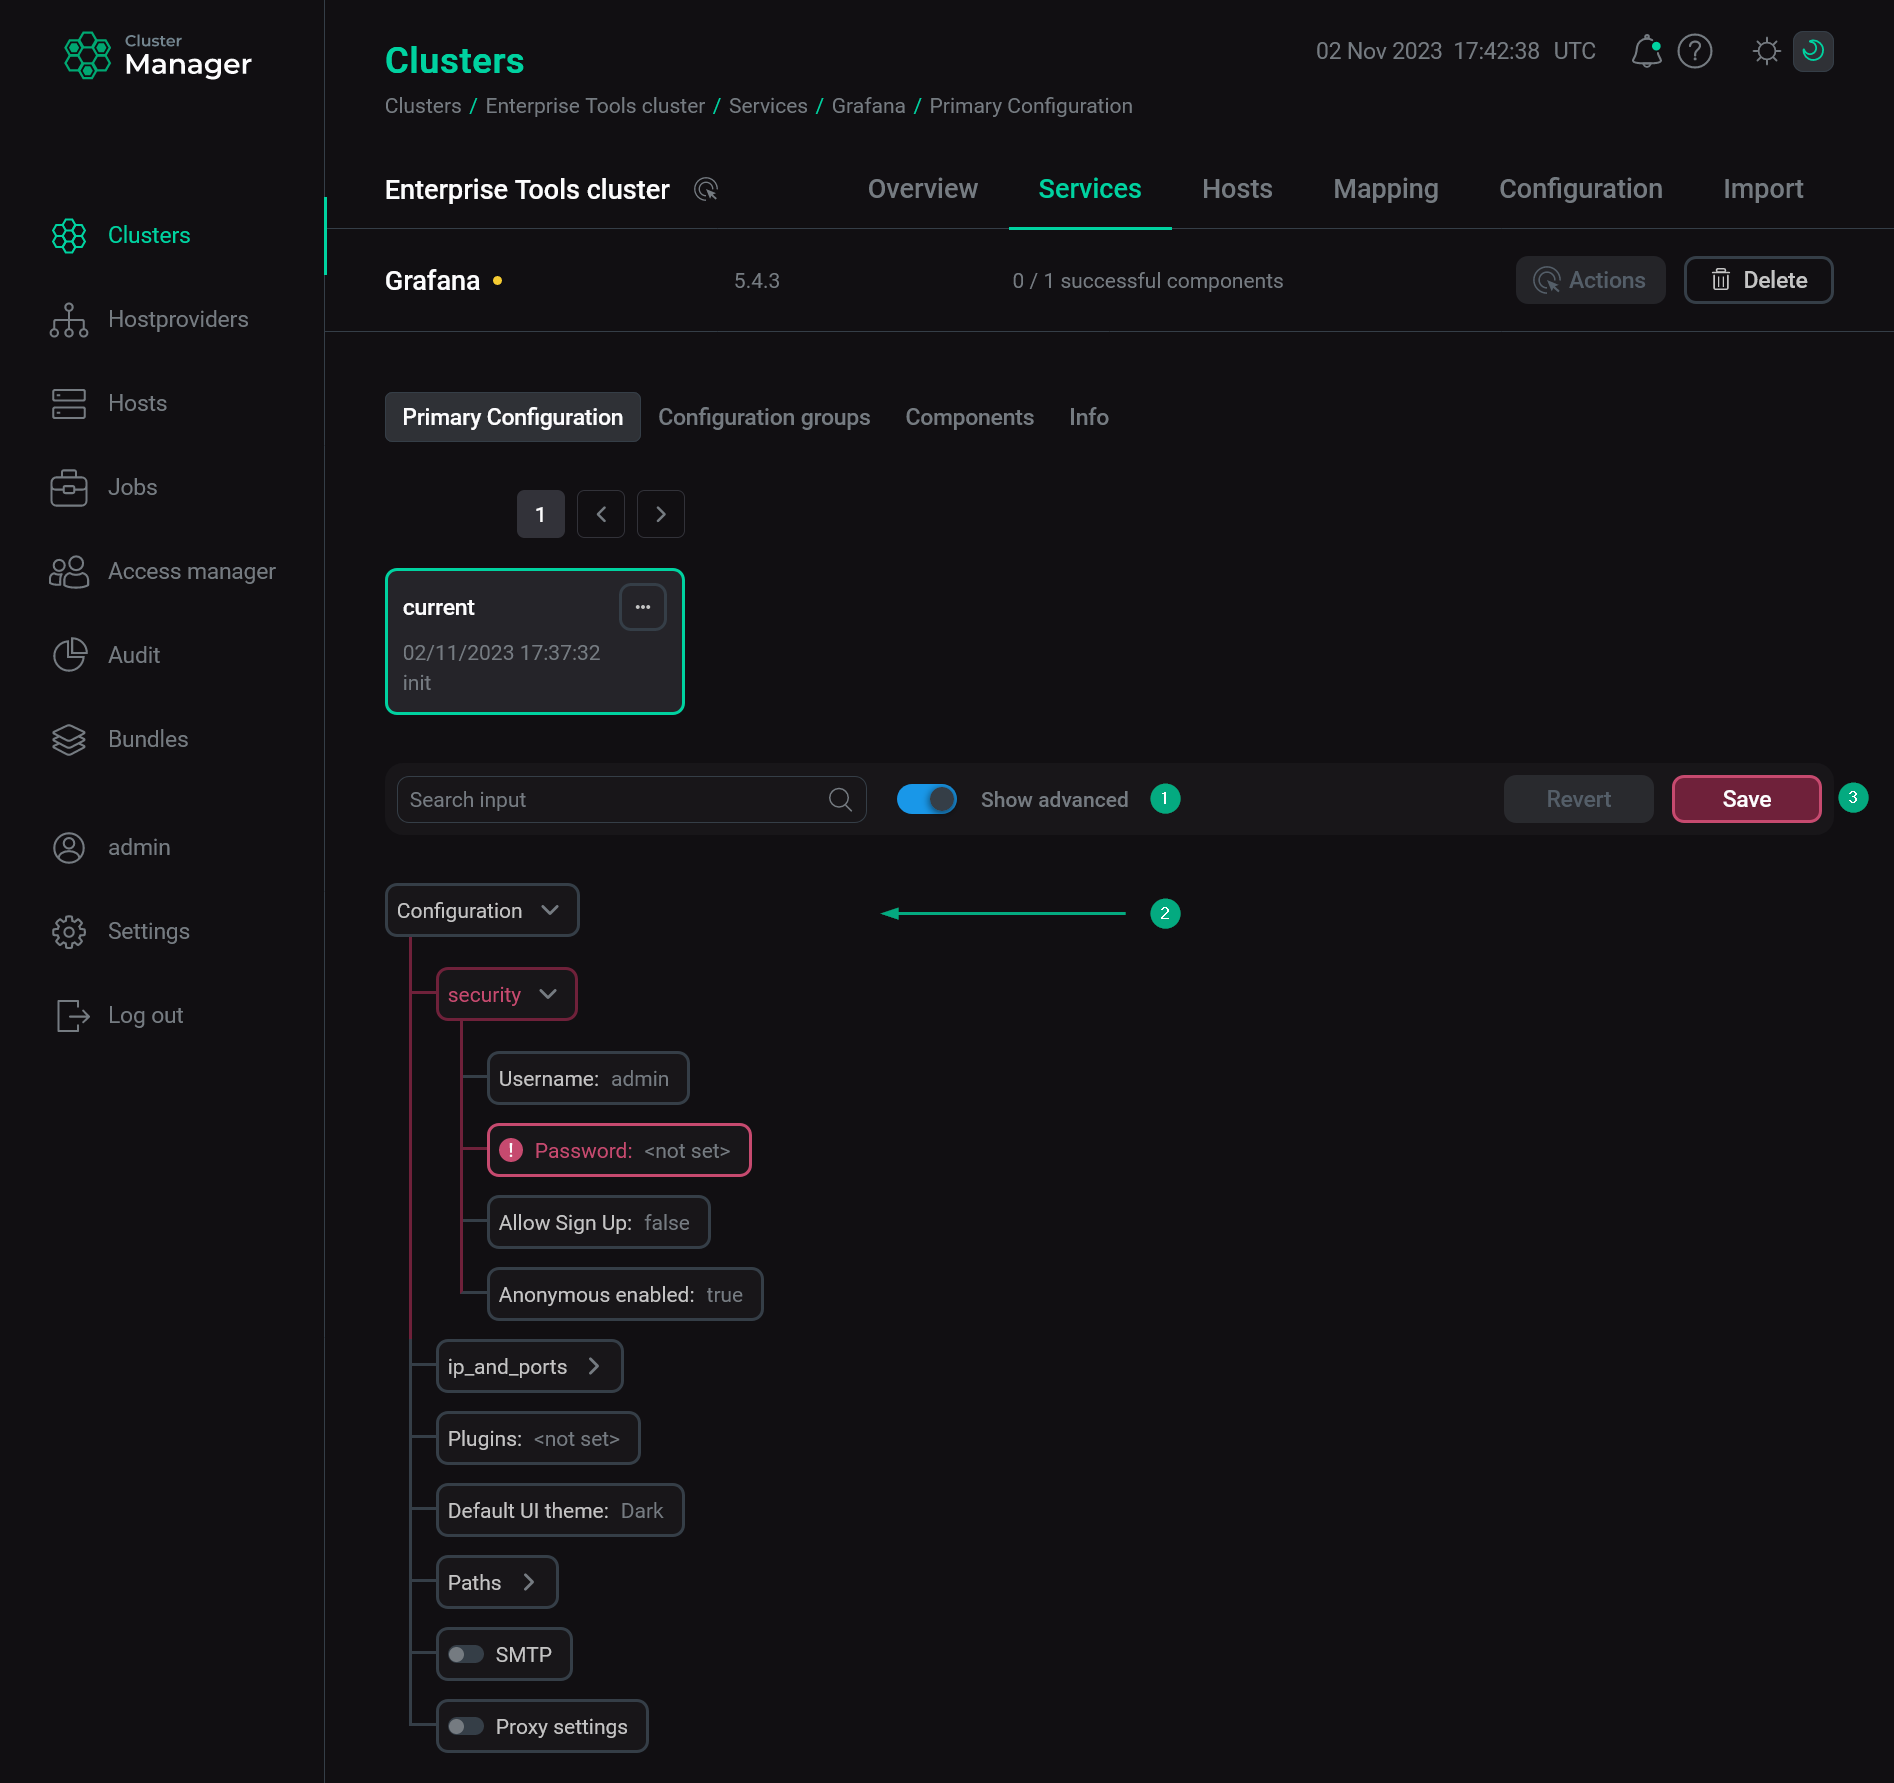 Configure a service
-
Step 4. Install monitoring services
-
Apply the Install Monitoring action to the cluster selected on the Clusters page by clicking the

 icon in the Actions column.
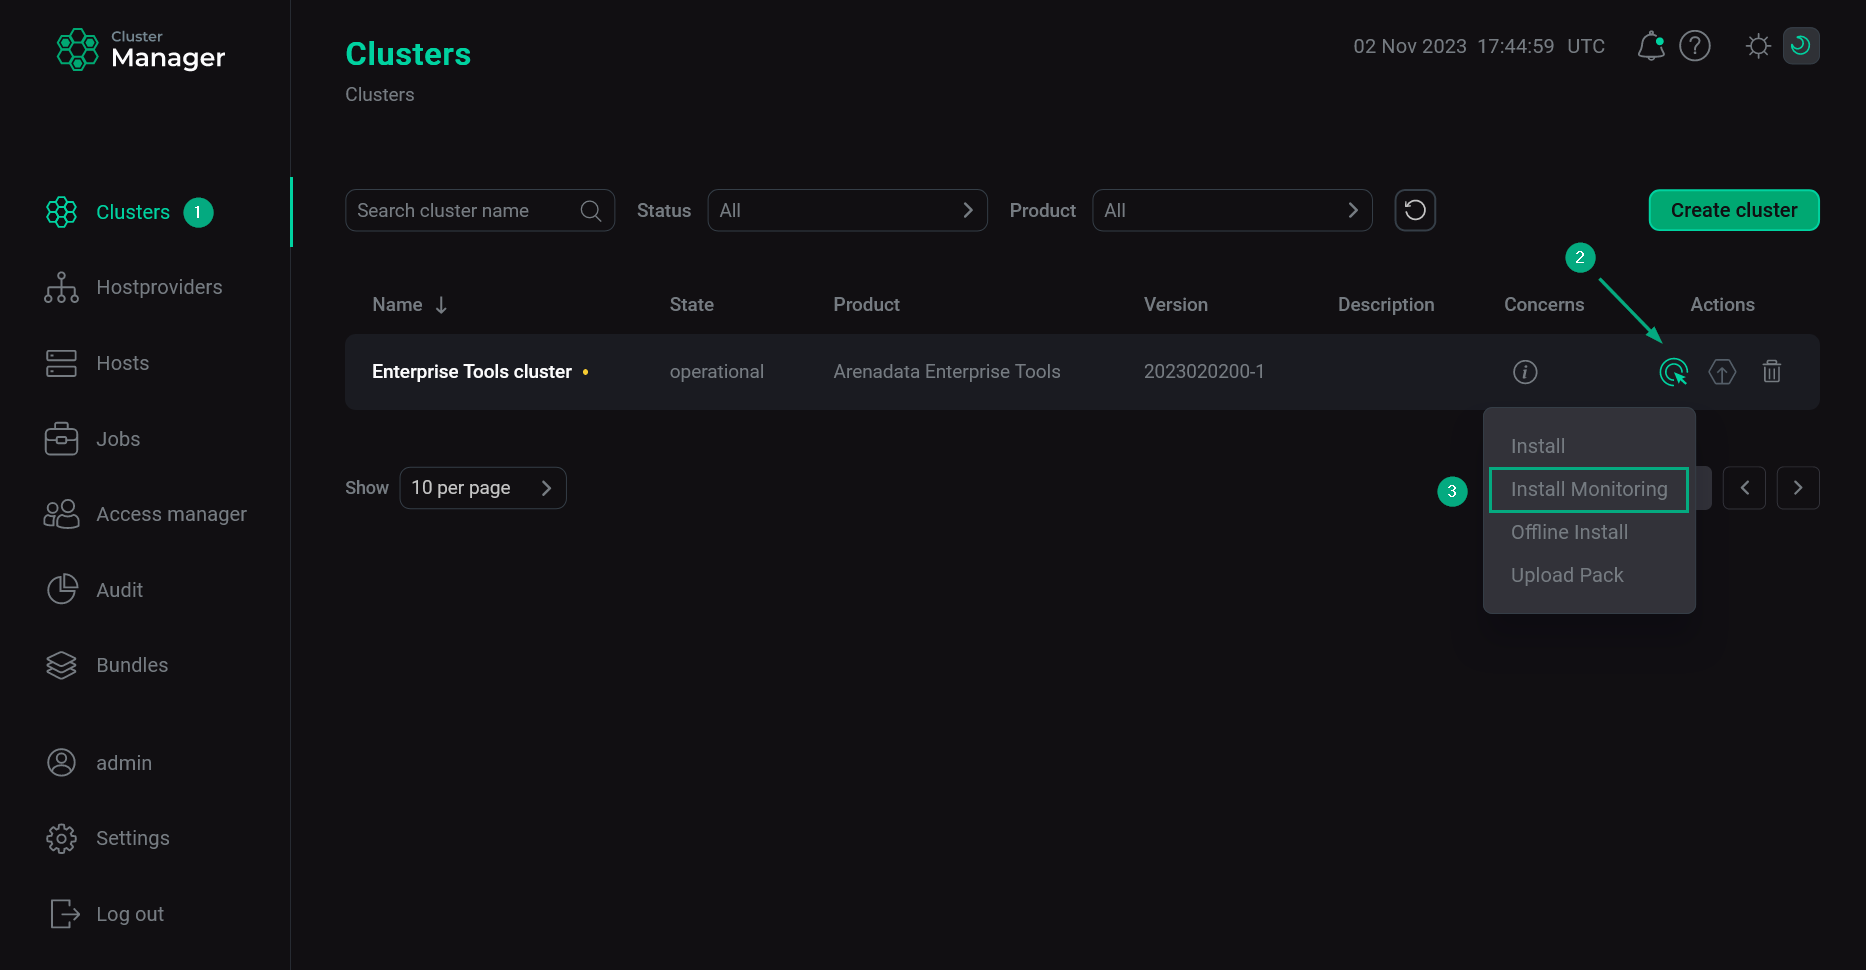 Switch to monitoring installation
 -
In the opened window, click Run.
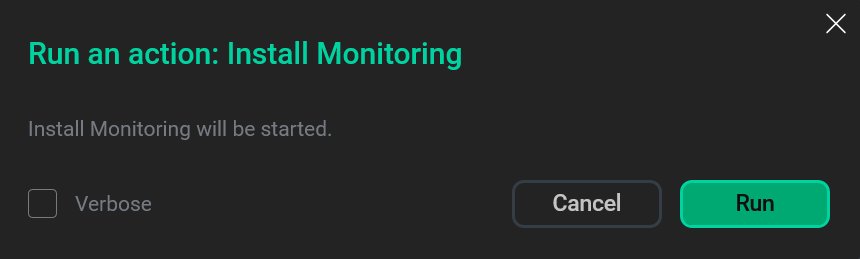 Verify installation
 -
Wait until the installation process is completed.
NOTEIn case of errors, you can find logs on the Jobs page.
Step 5. Verify results
Graphite
To check availability of the Graphite web-interface, you can do:
-
In the browser bar, enter an address of the host where the monitoring cluster is deployed. To specify the port number, use the value of the Web-interface TCP port parameter from the ip_and_ports section defined when configuring the Graphite service during the monitoring cluster installation. The value
80(used by default) can be omitted.IMPORTANTIn case of offline installation, this address matches the address of the host where the Enterprise Tools cluster is deployed. -
Expand a tree at the left side of the opened form. System metrics are displayed there, grouped by hosts. You can select some of these metrics to view their change dynamics in the form of a graph at the right side of the screen.
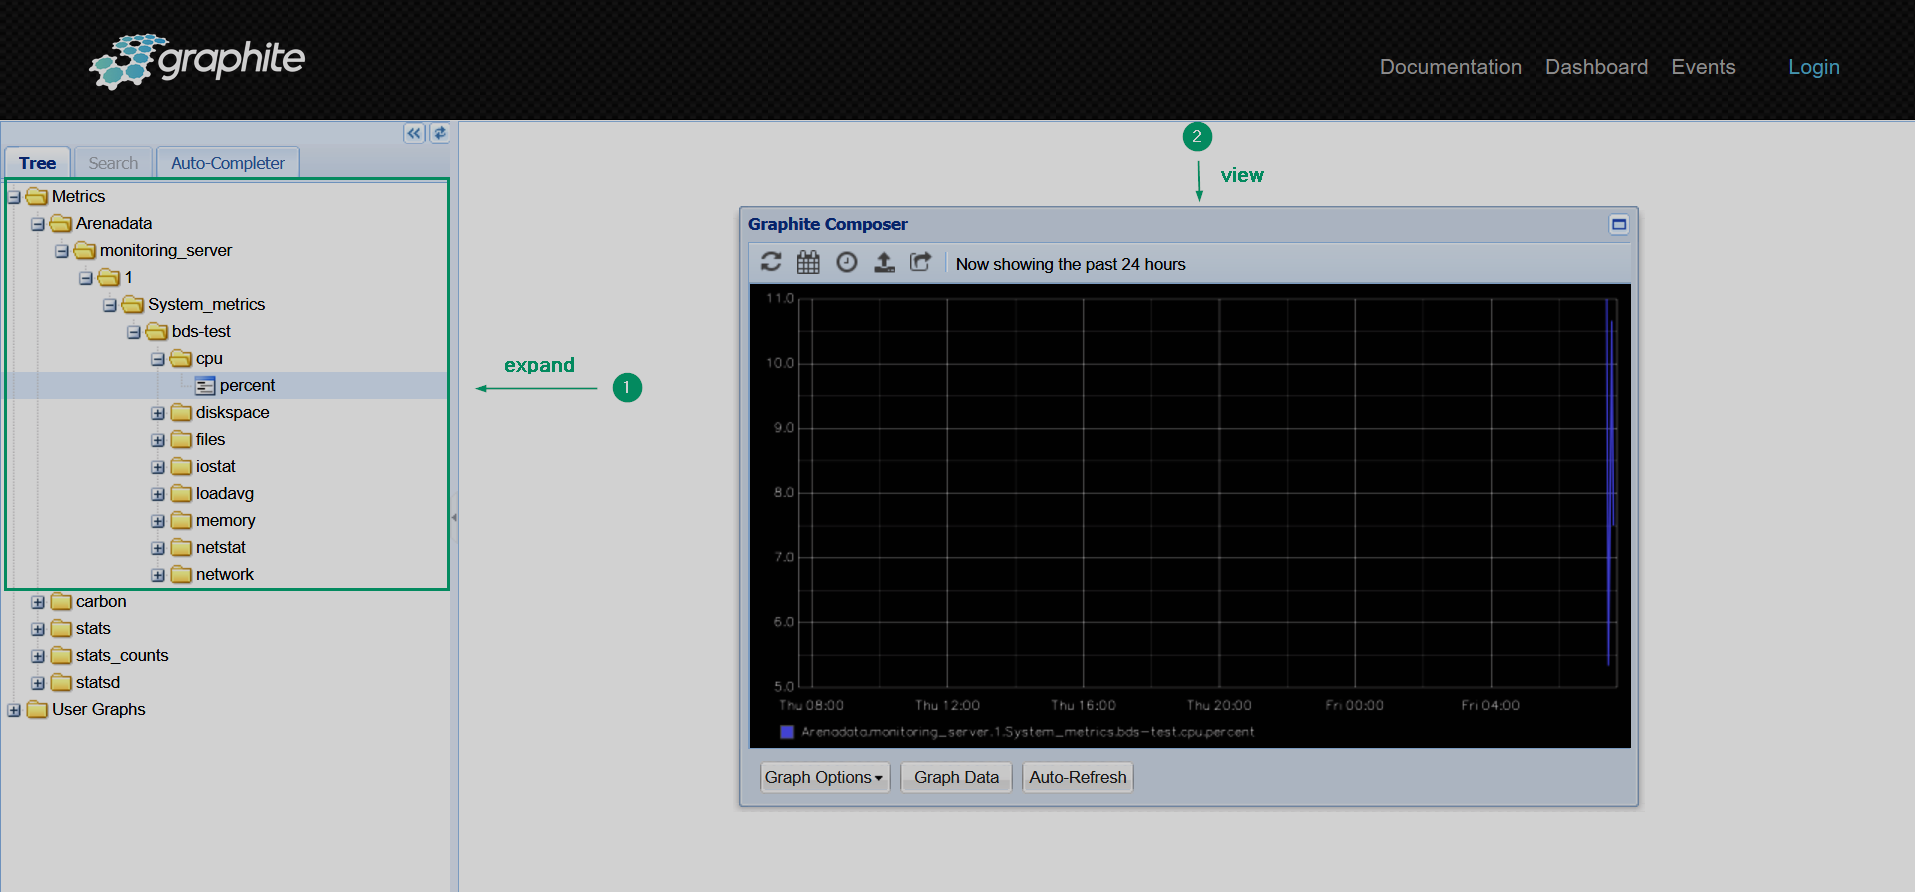 Graphite web-interface
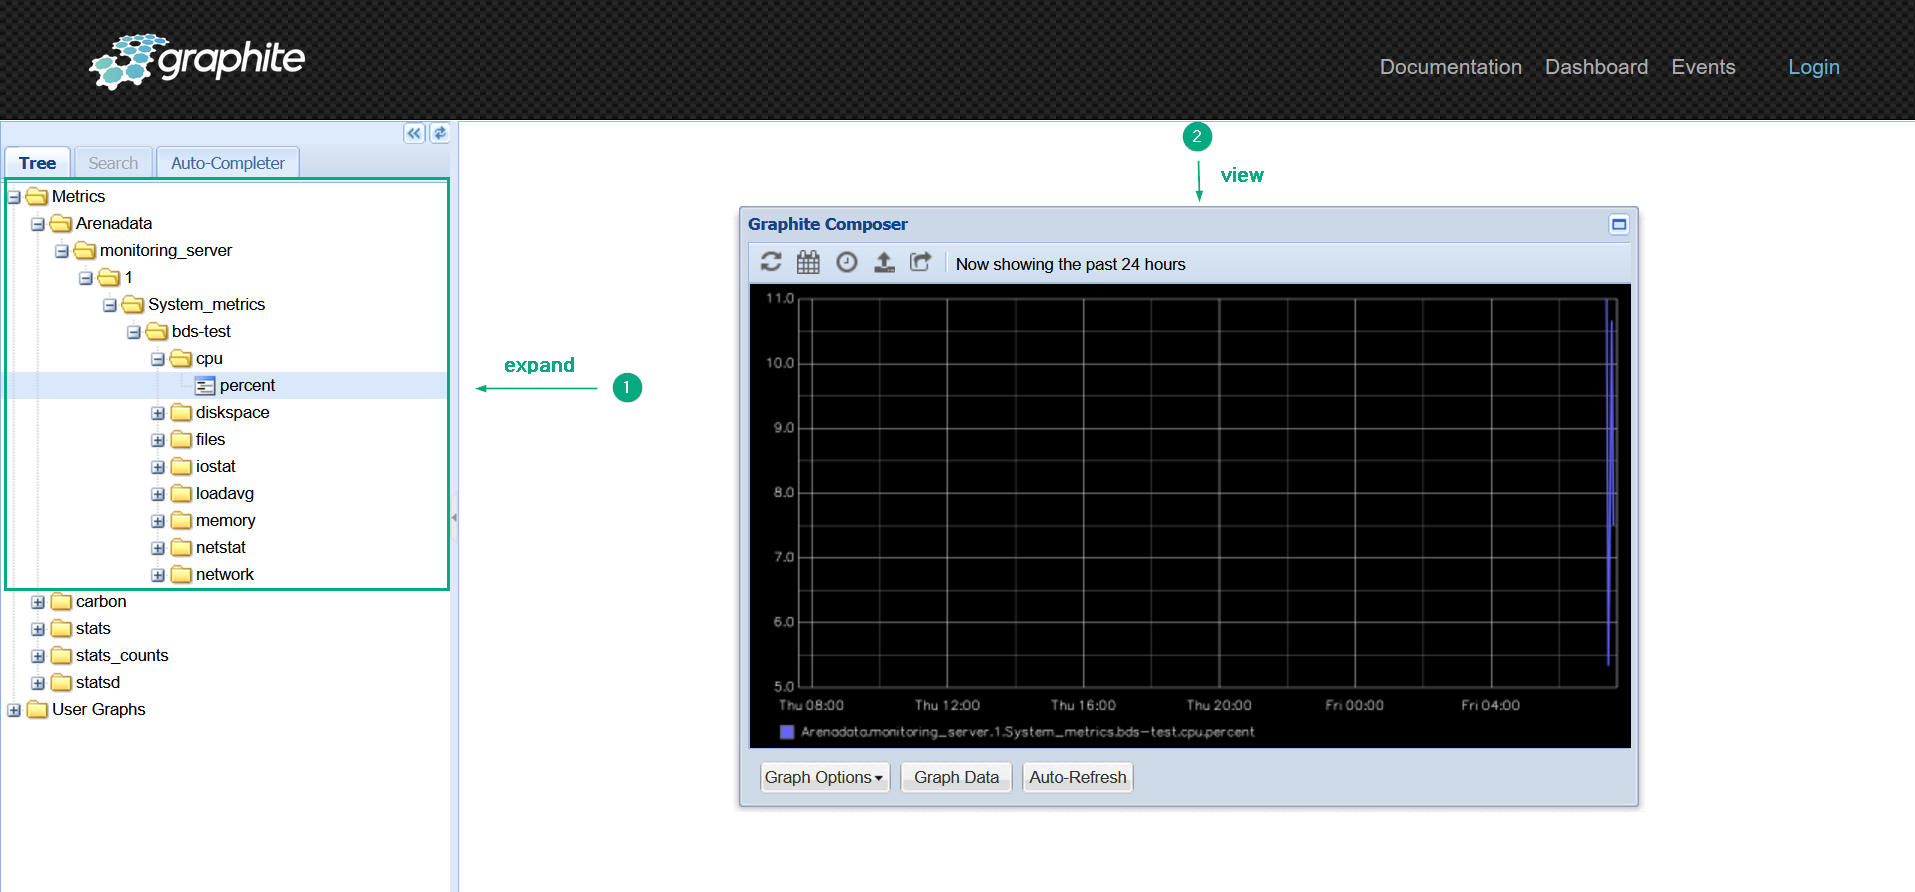 Graphite web-interface
Grafana
To check availability of the Grafana web-interface, you can do:
-
In the browser bar, enter an address of the host where the monitoring cluster is deployed. To specify the port number, use the value of the Port parameter from the ip_and_ports section defined when configuring the Grafana service during the monitoring cluster installation (by default,
3000). -
Select the Home menu item in the opened form.
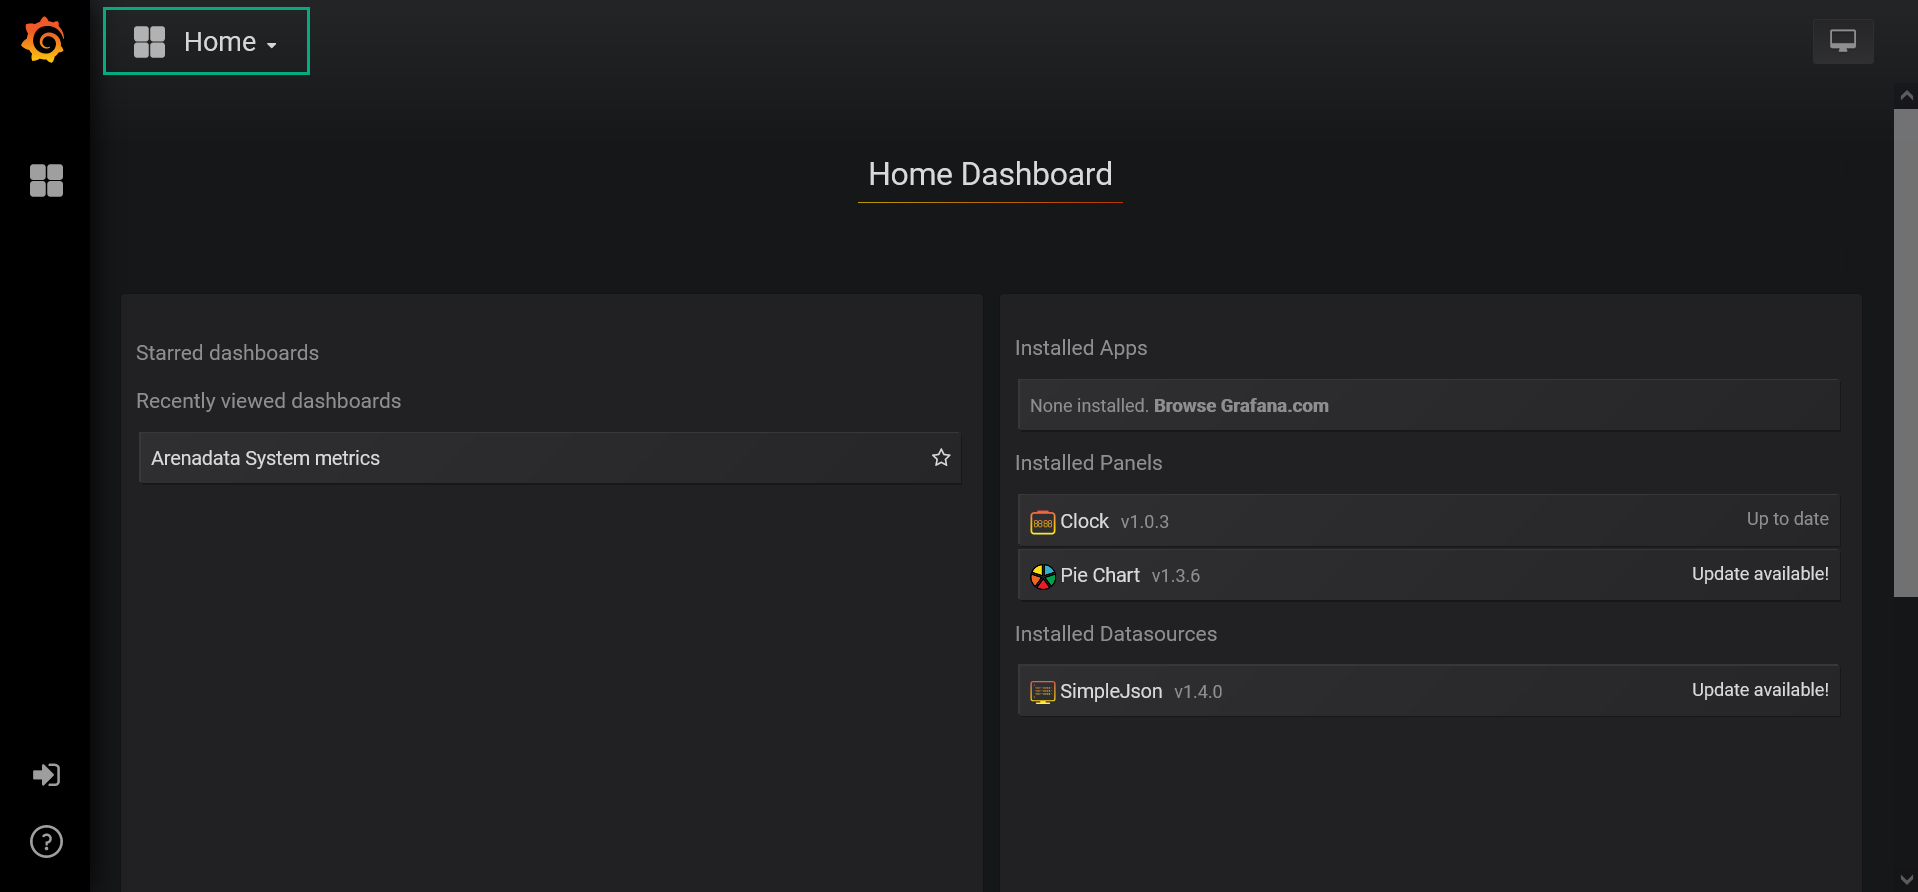 Grafana web-interface
 -
Open one of available dashboards. For example, Arenadata System metrics.
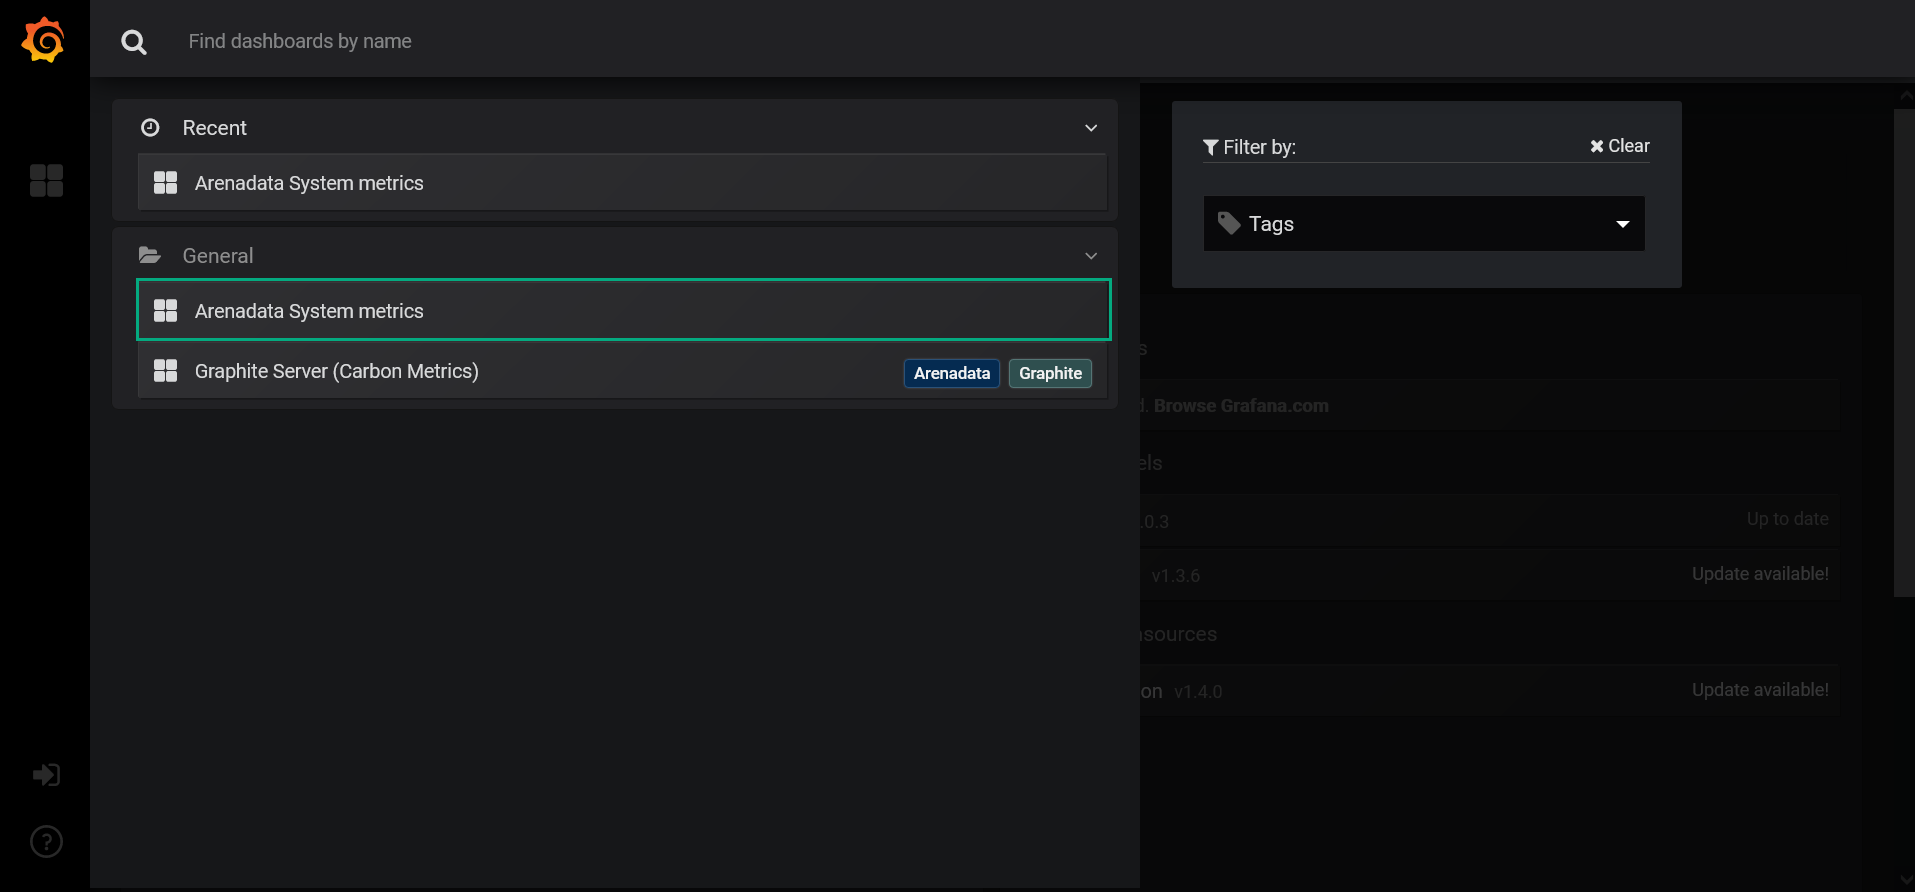 Switch to Arenadata System metrics
 -
View available graphs.
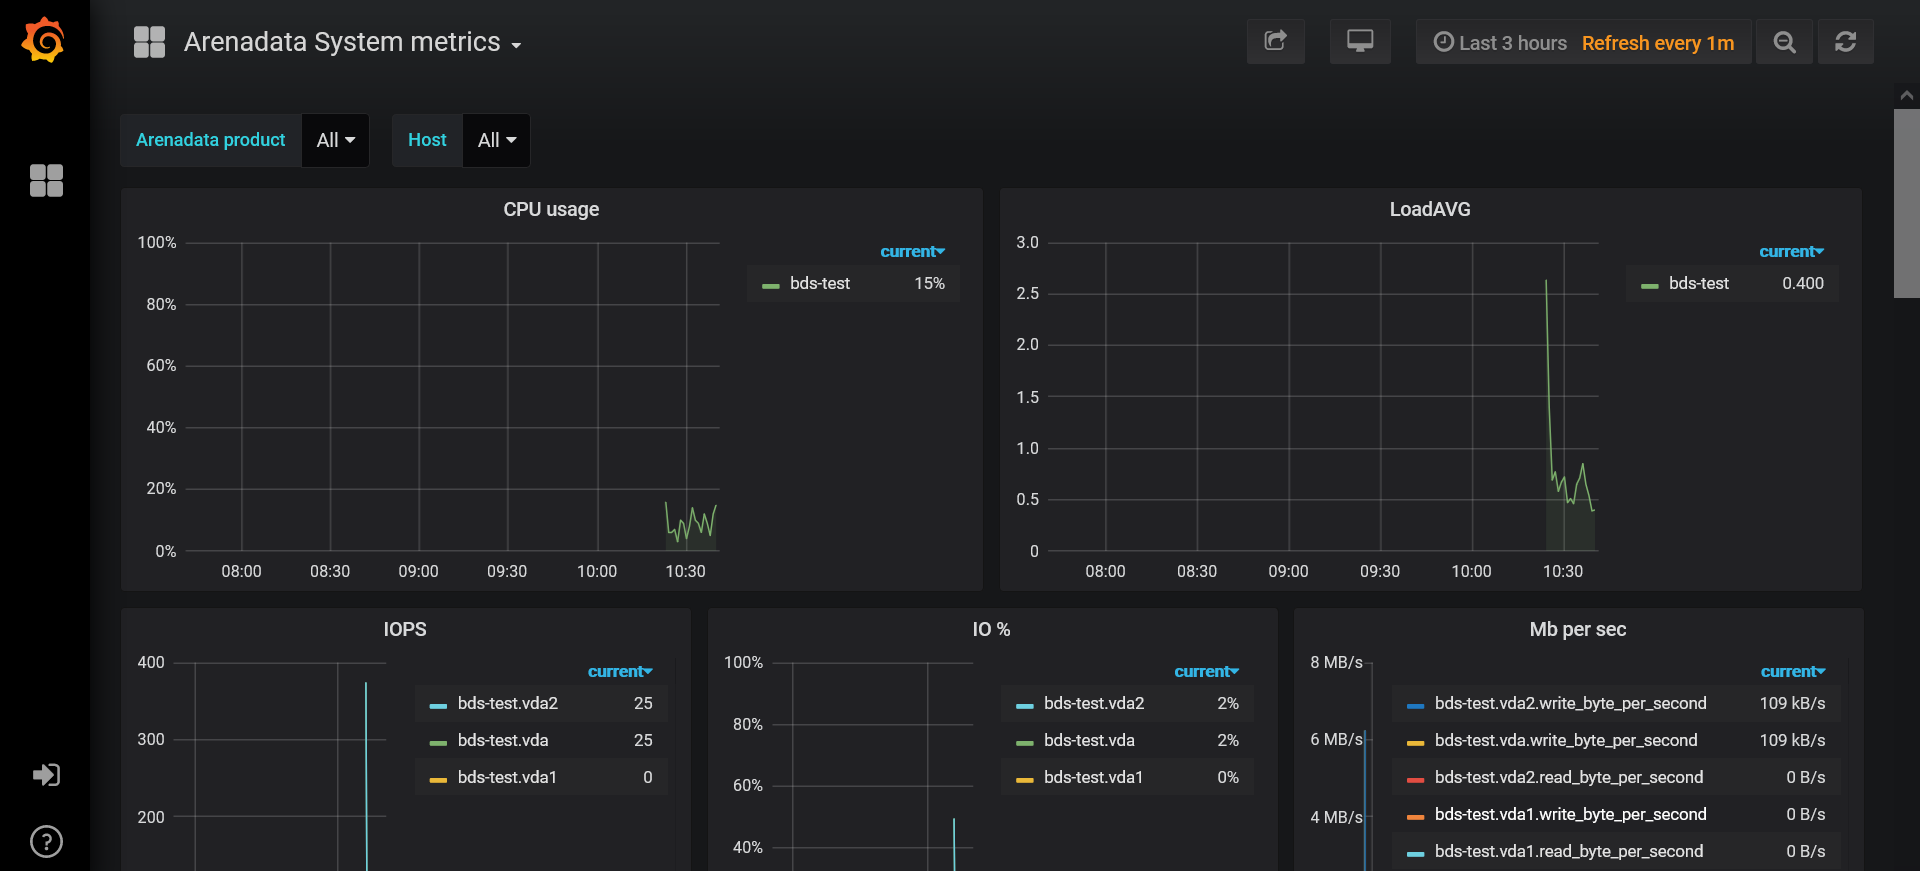 View Arenadata System metrics