
Built-in monitoring in the NiFi interface
This article describes how the NiFi UI presents information about a flow and its components to monitor its health and state.
Status bar
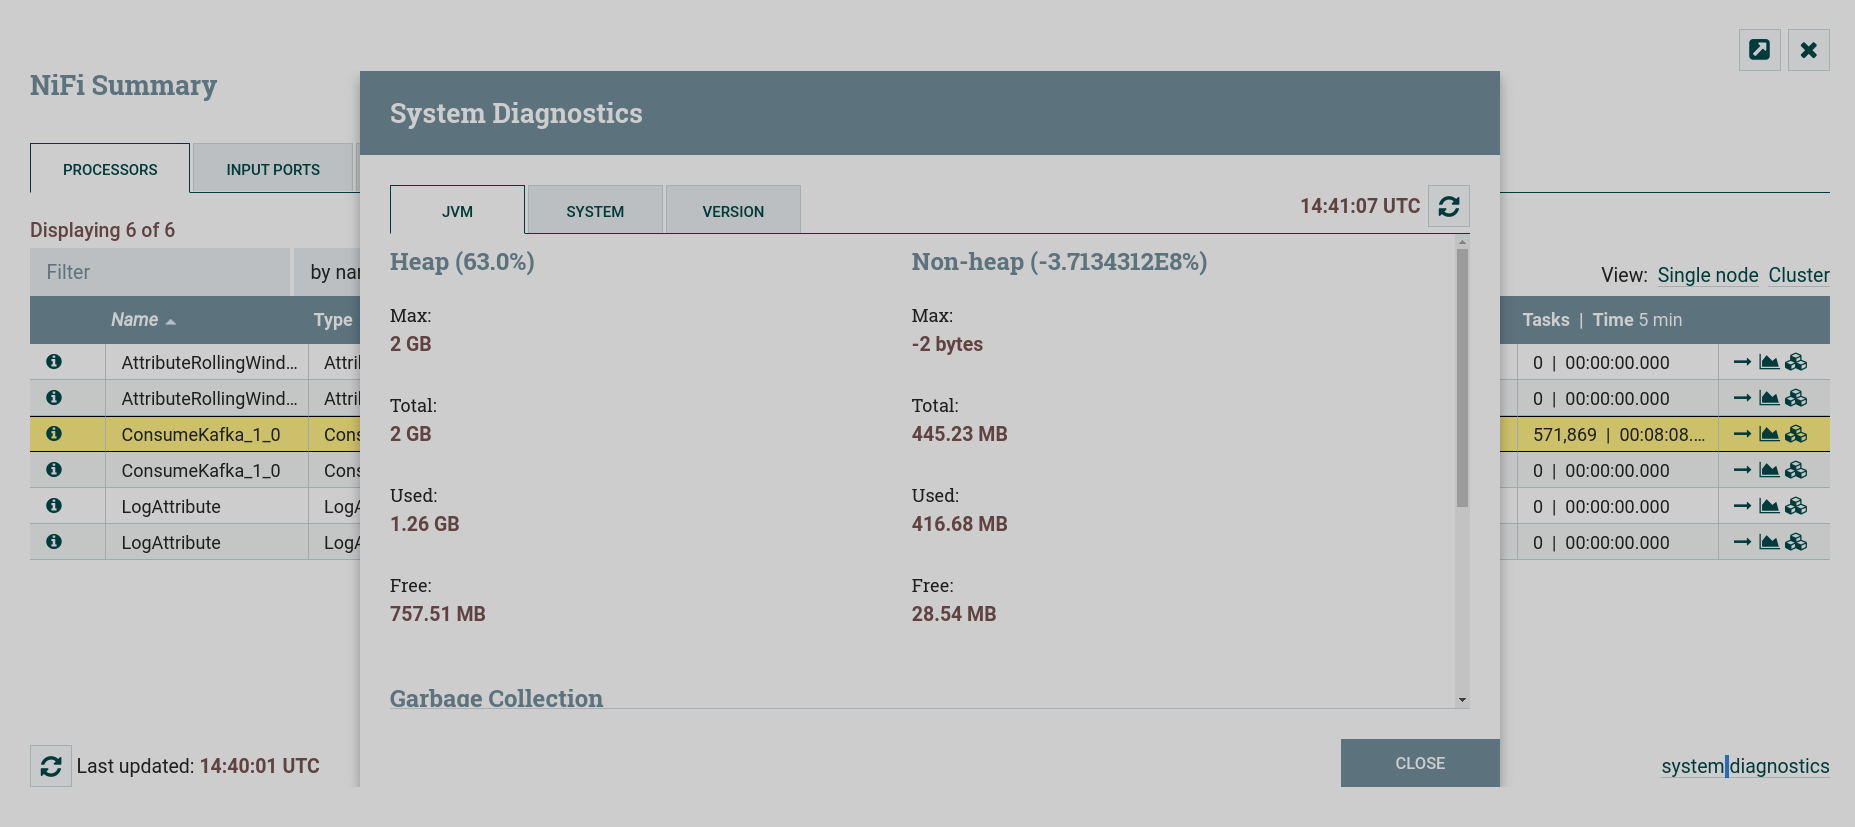
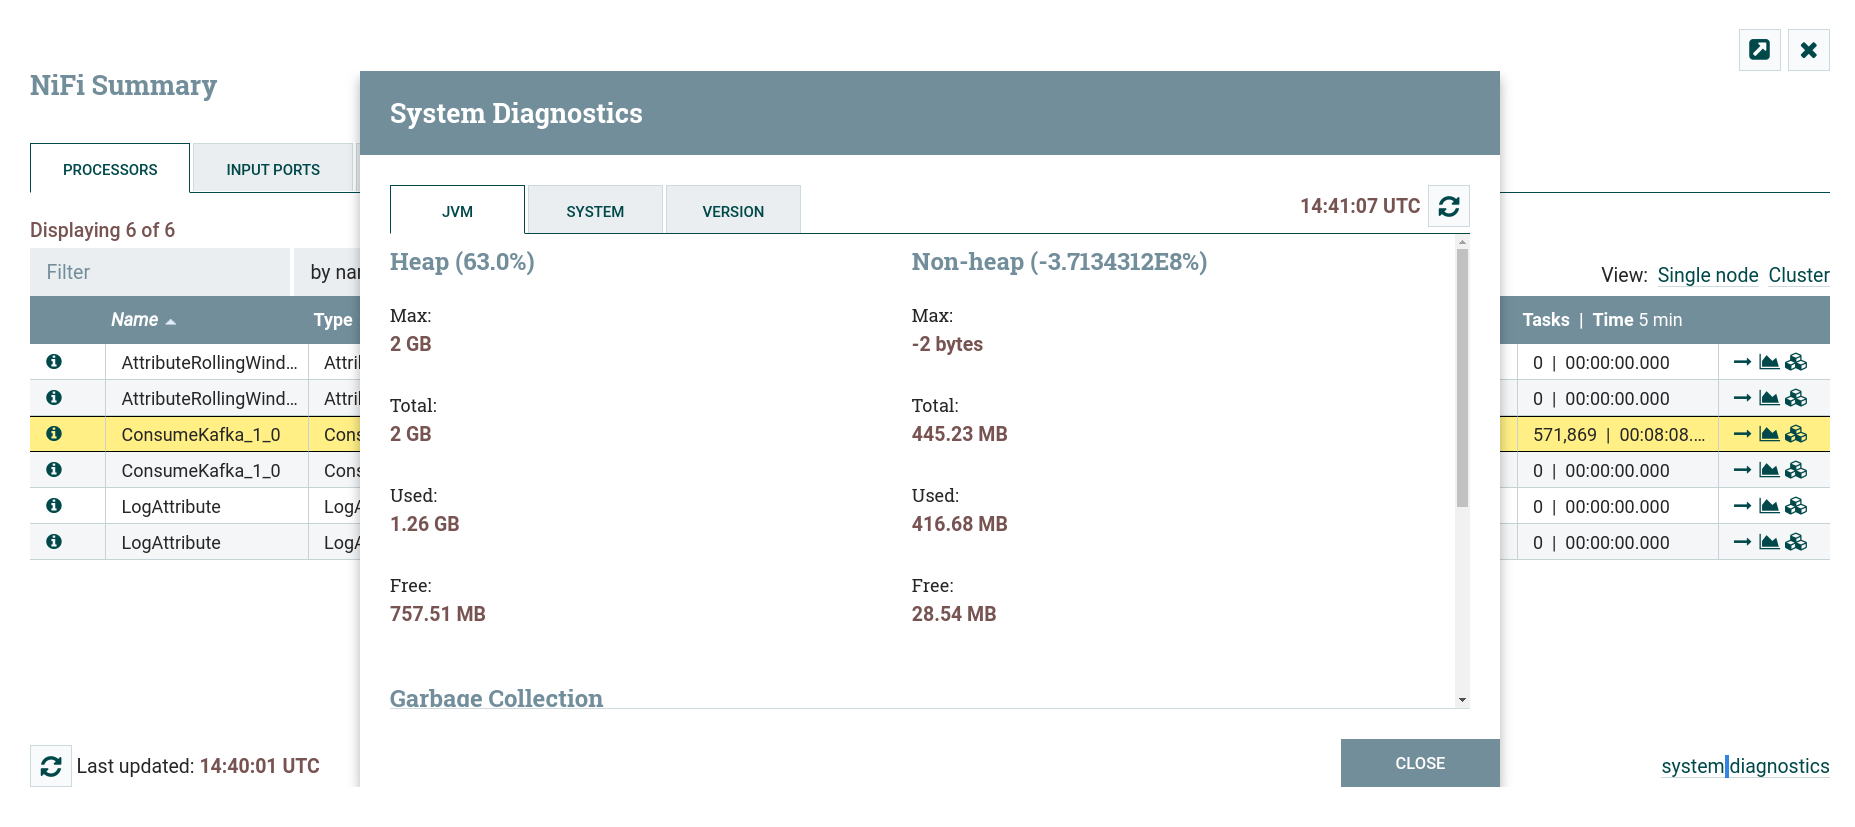
General system status information is provided on NiFi Server interface status bar.
Summary of the system components
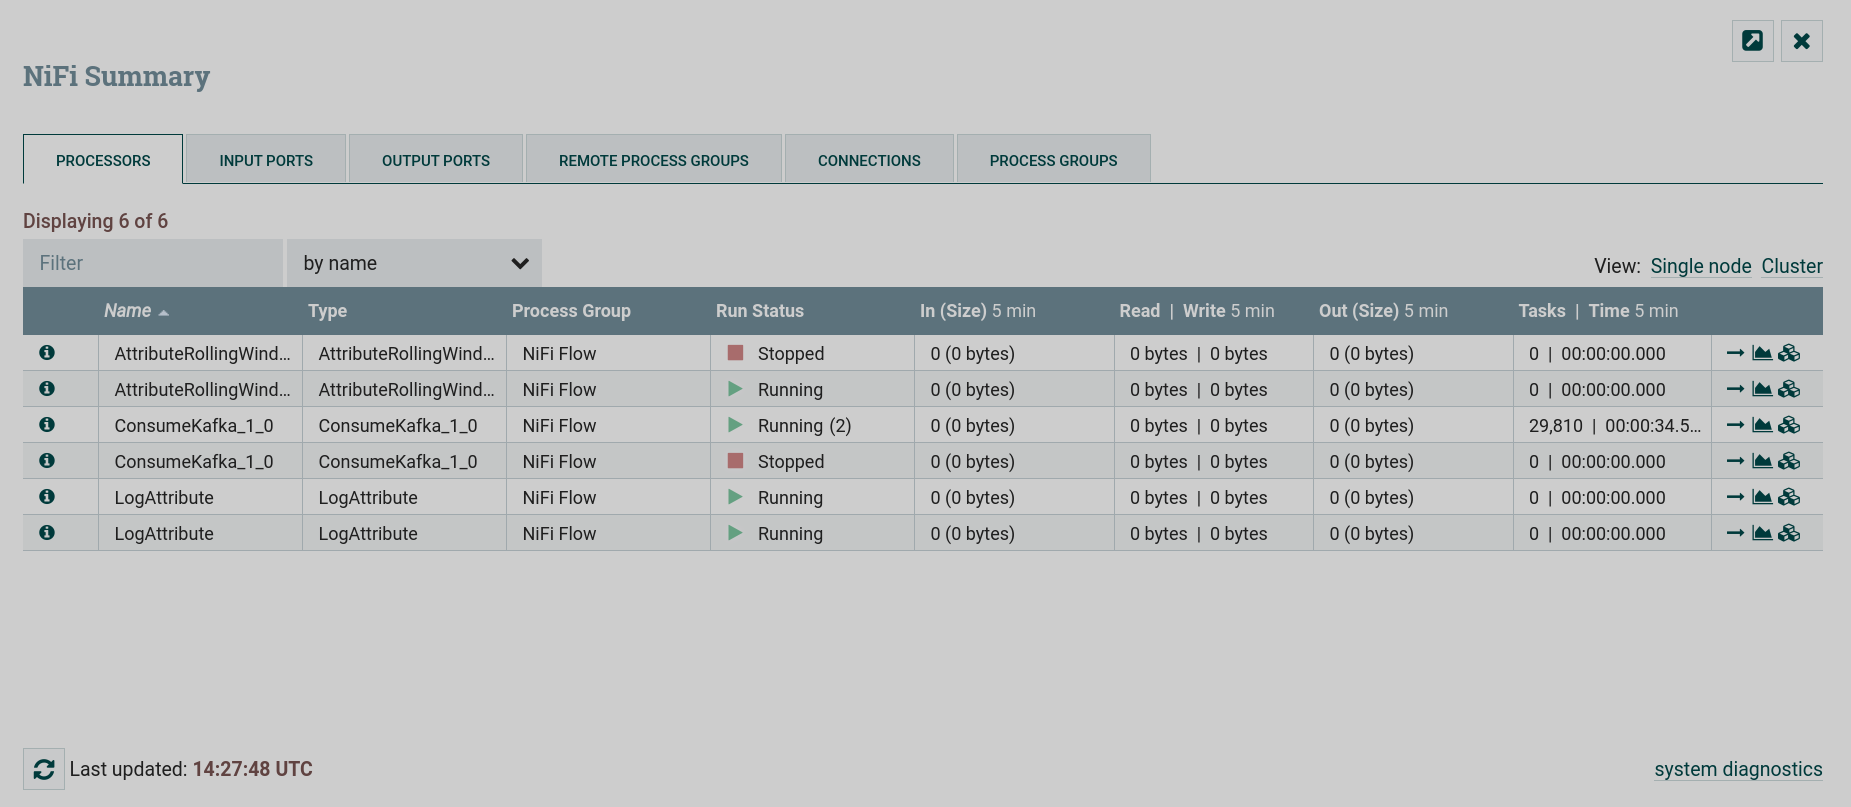
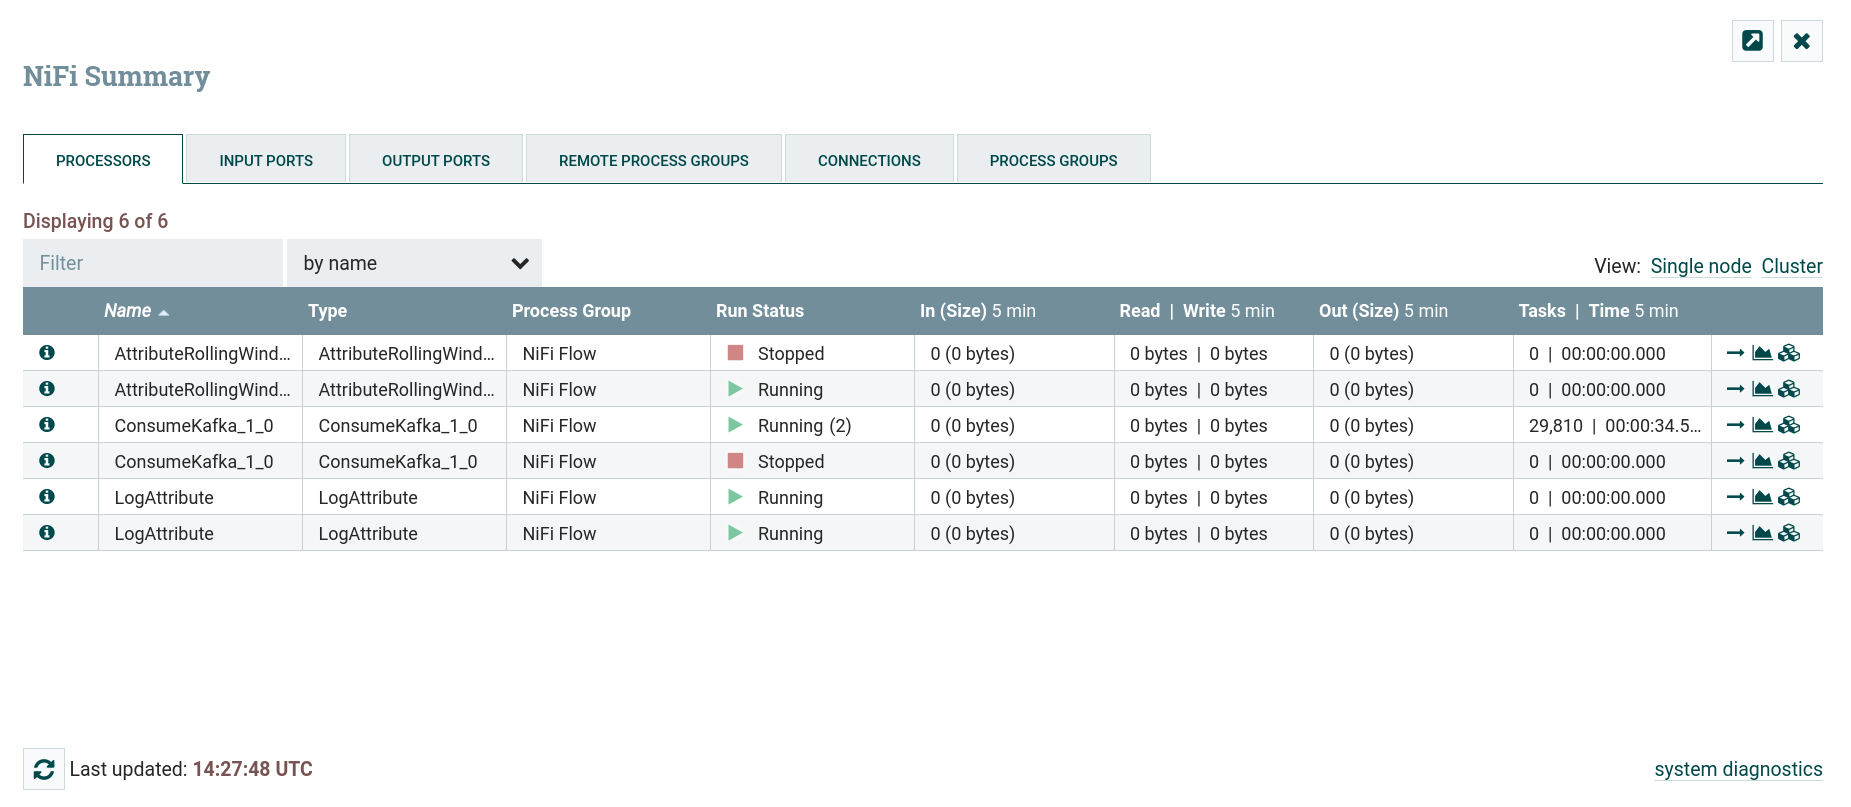
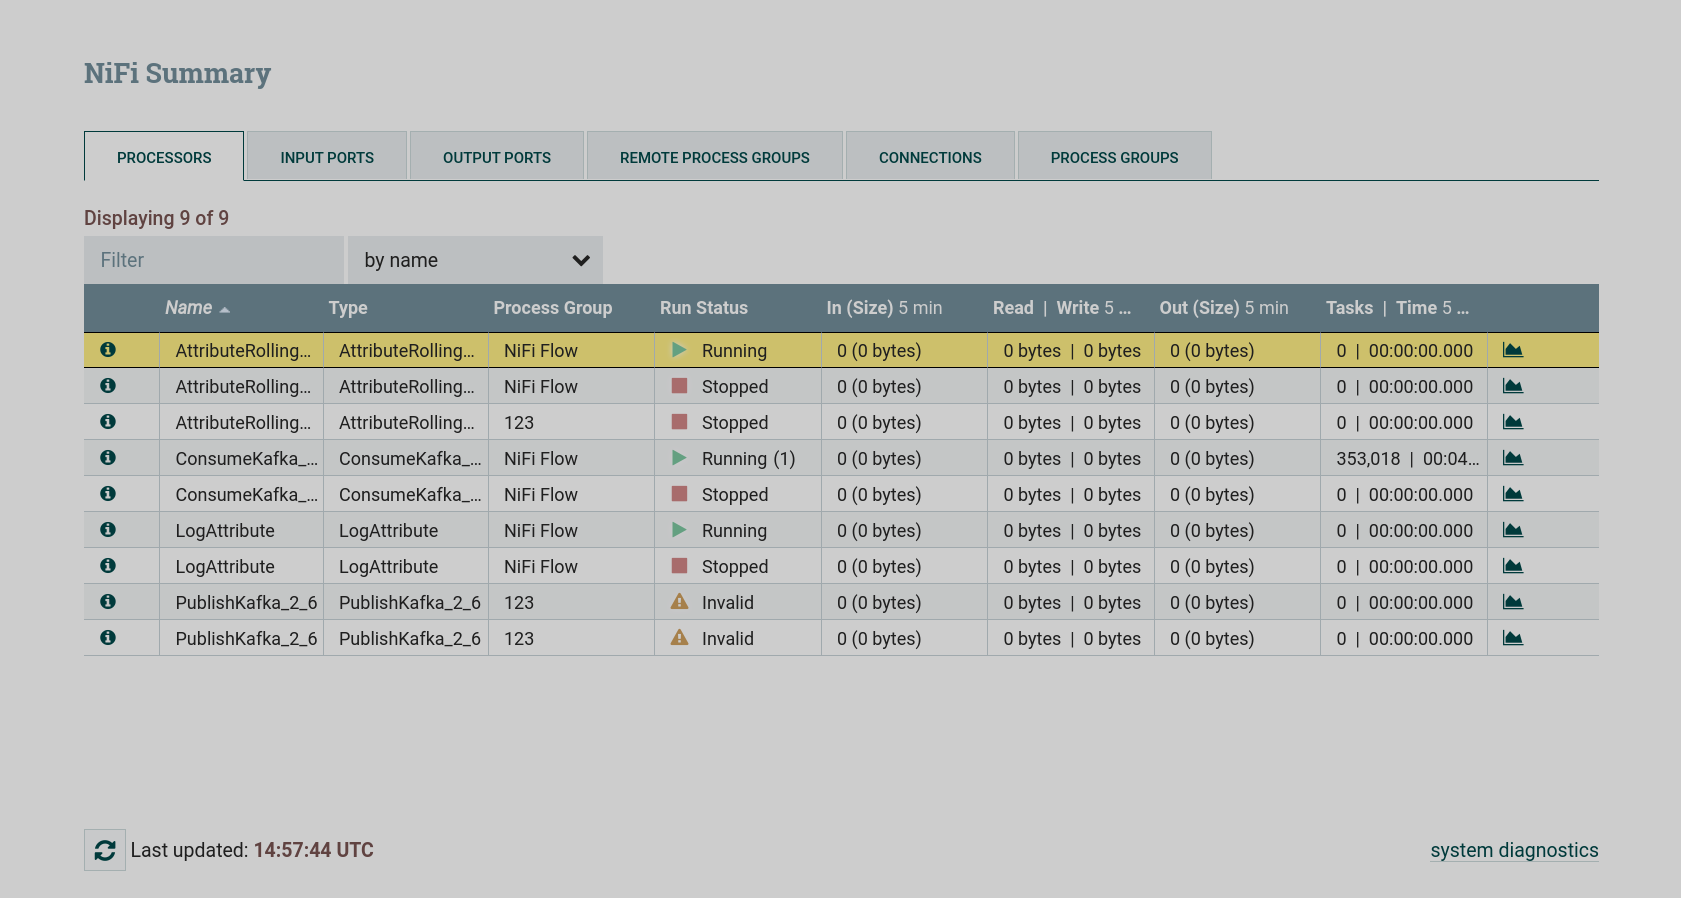
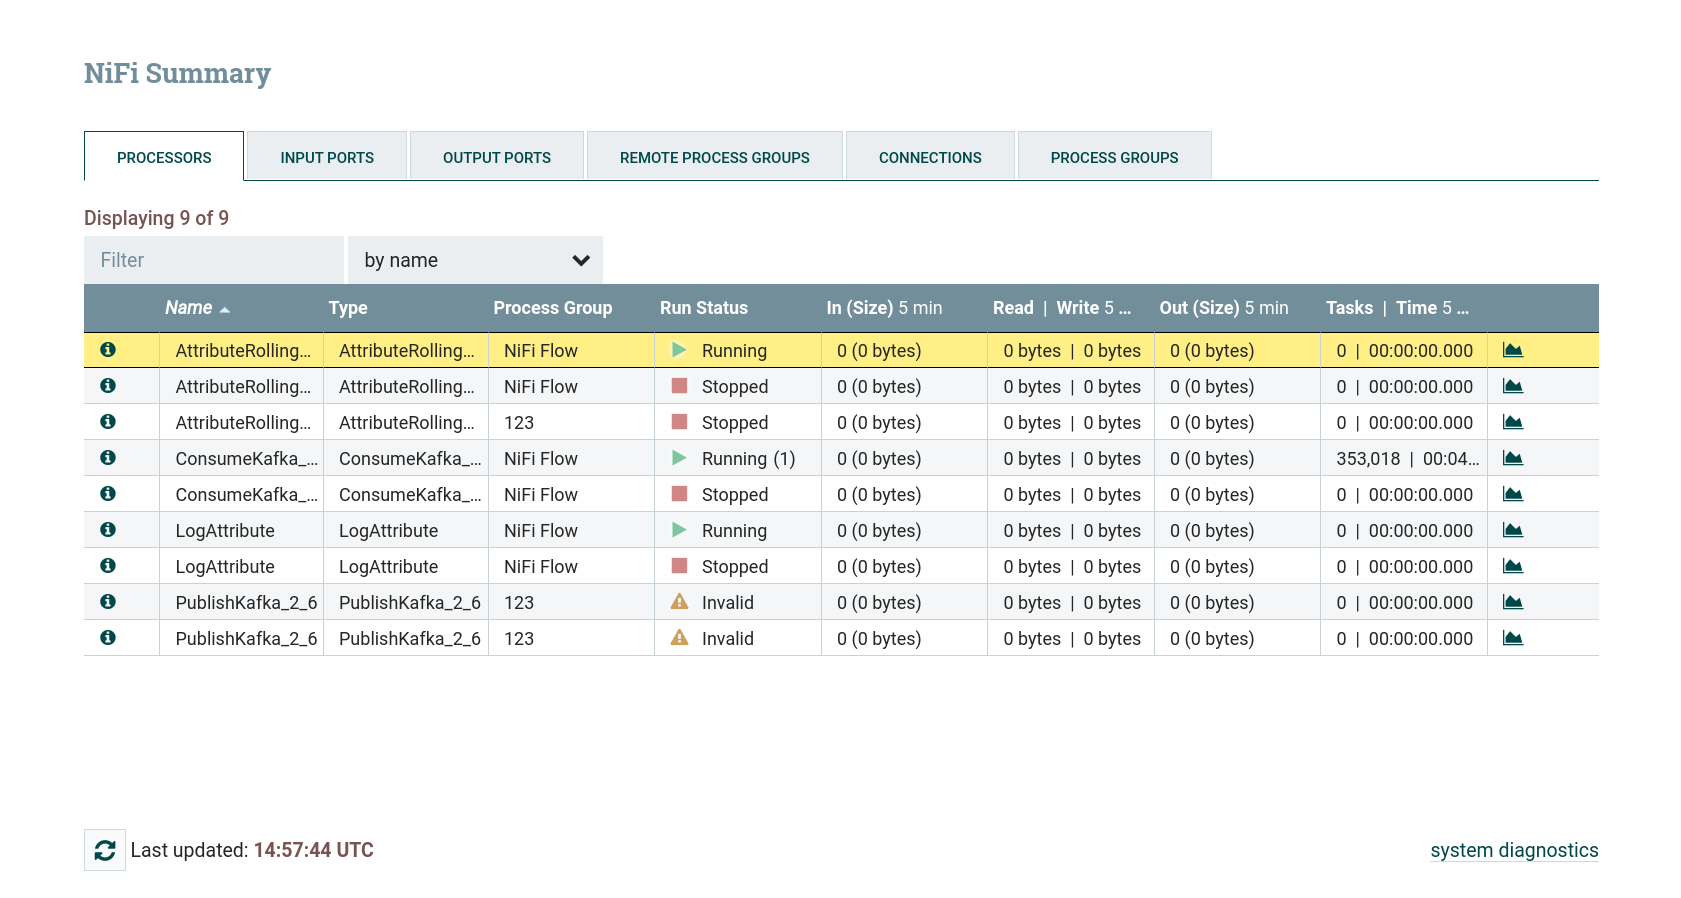
A summary of data on the operation of all system components is presented in the Summary window, which opens when you click the menu item of the same name in the global menu of the NiFi Server interface.
The summary provides information about all core components created with toolbar in a table format.
Component operation data
Information about the selected component can be obtained by clicking on the corresponding icon:
-
— provides basic information about the component. The data of the window repeats the data of the Configure window, which opens when you click the menu item in the context menu called by the right mouse button.
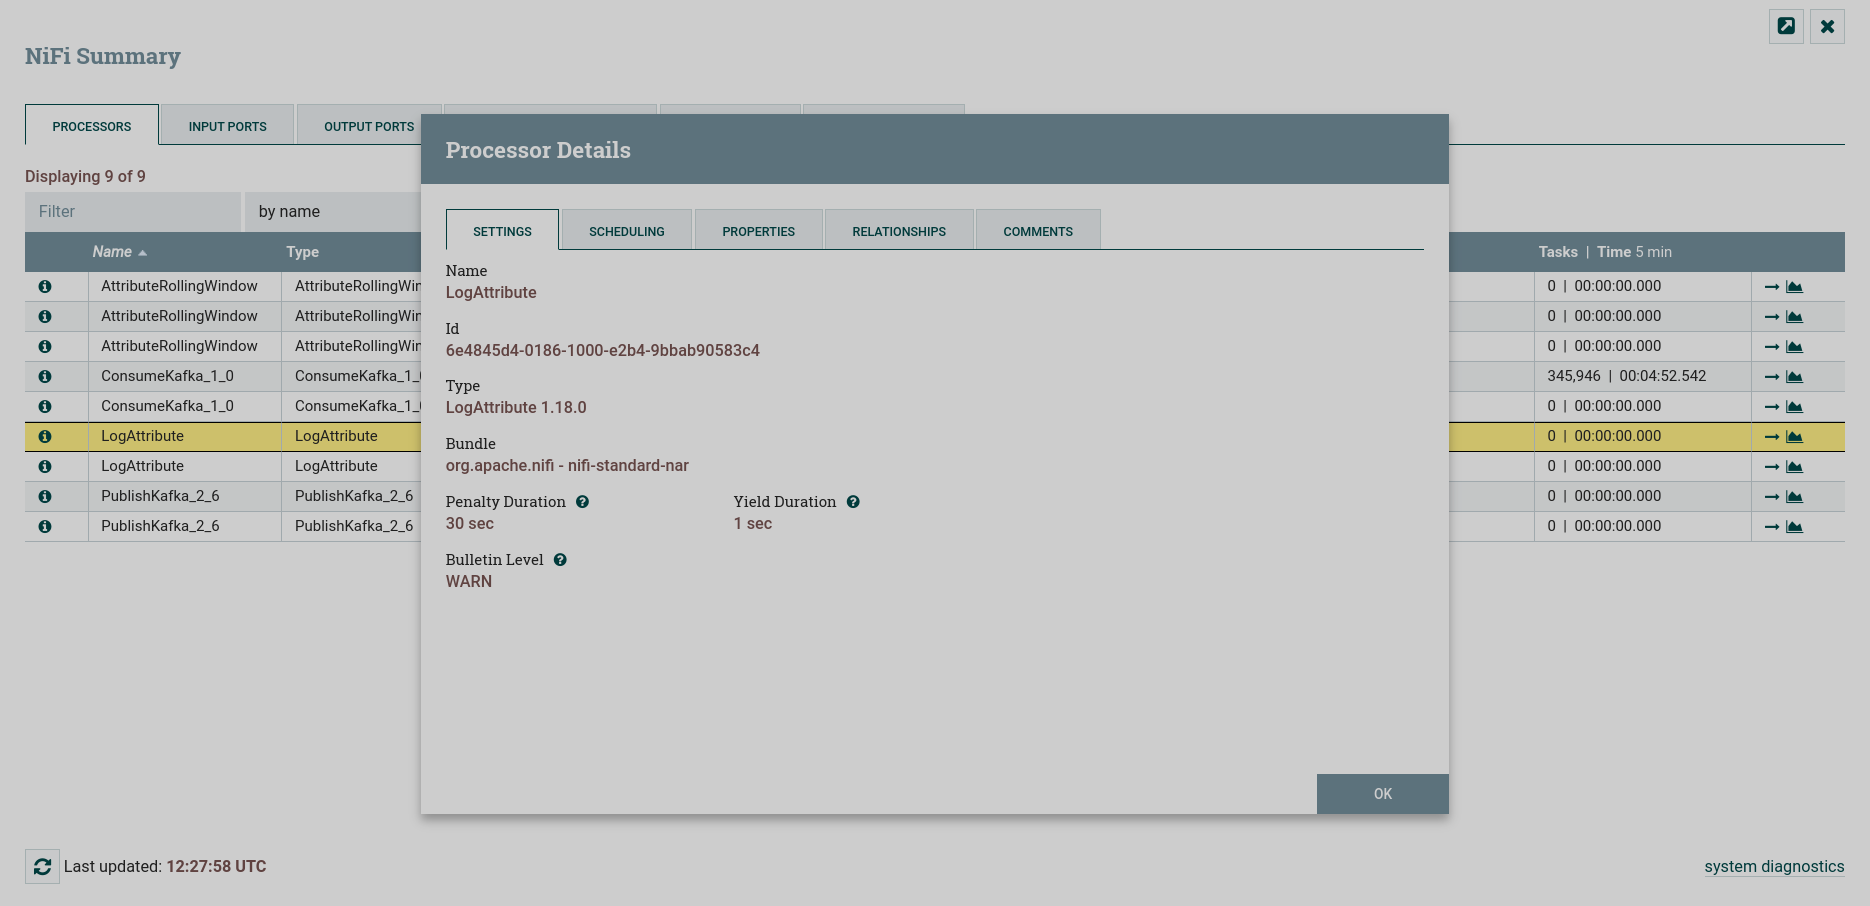 Processor information
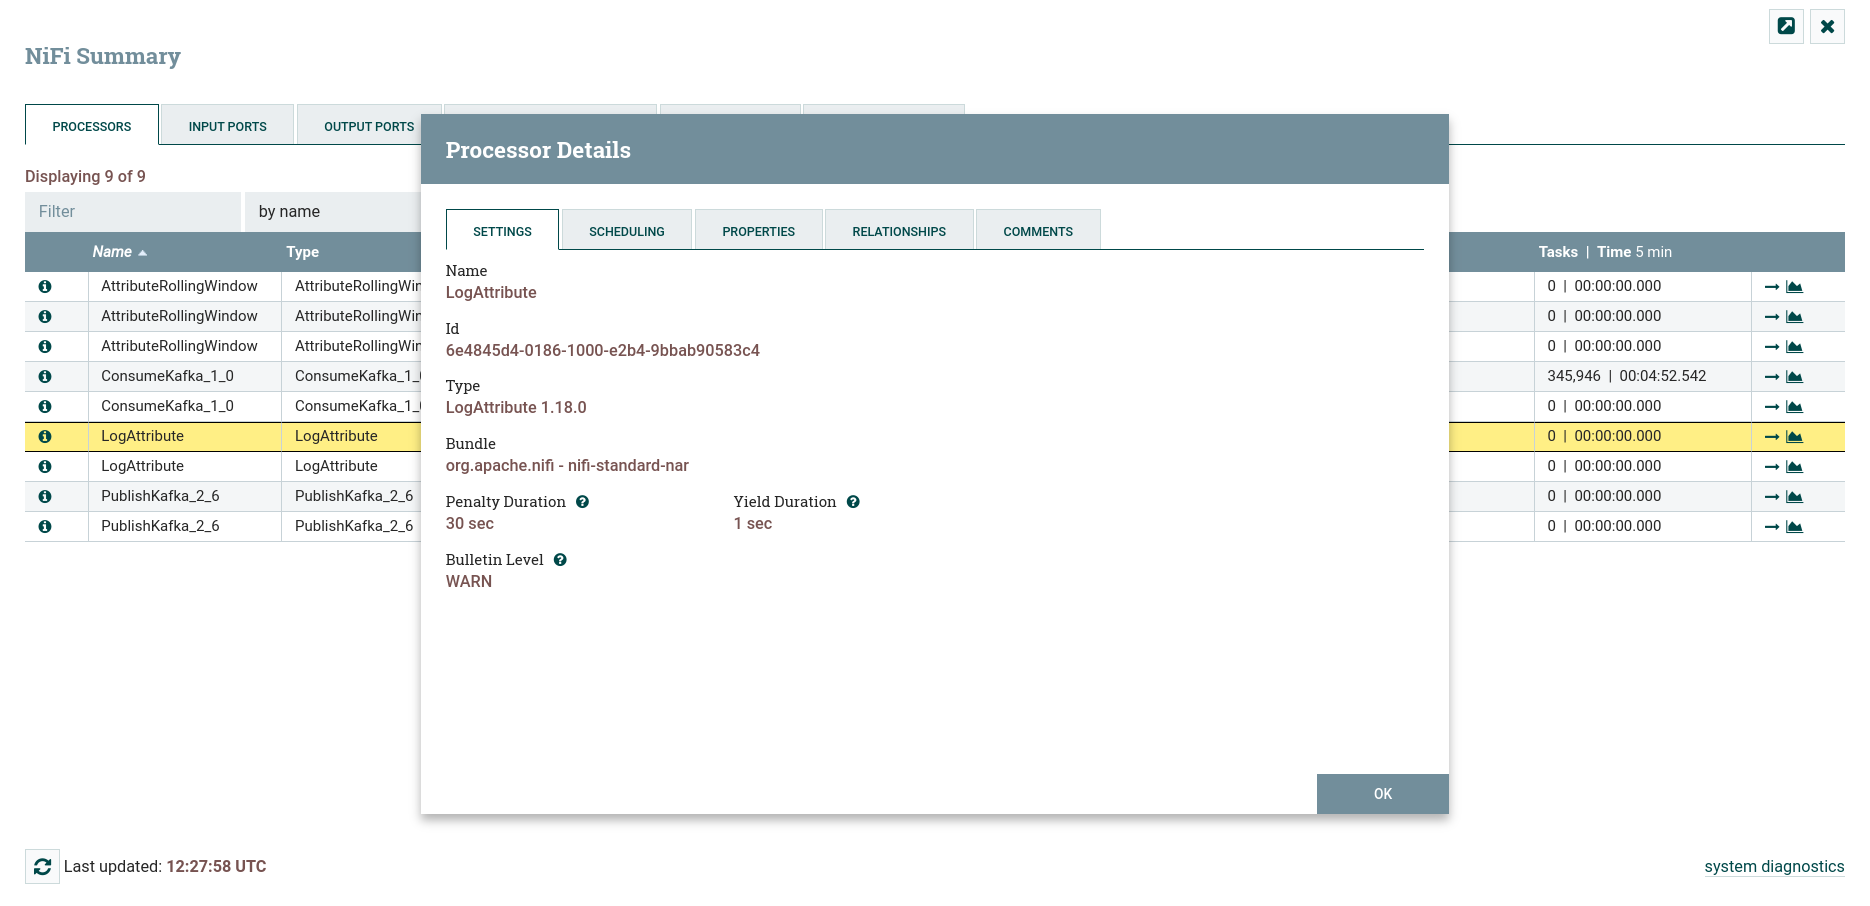 Processor information
 -
— provides basic data on the operation of each cluster host. This icon is only available for a multi-host cluster.
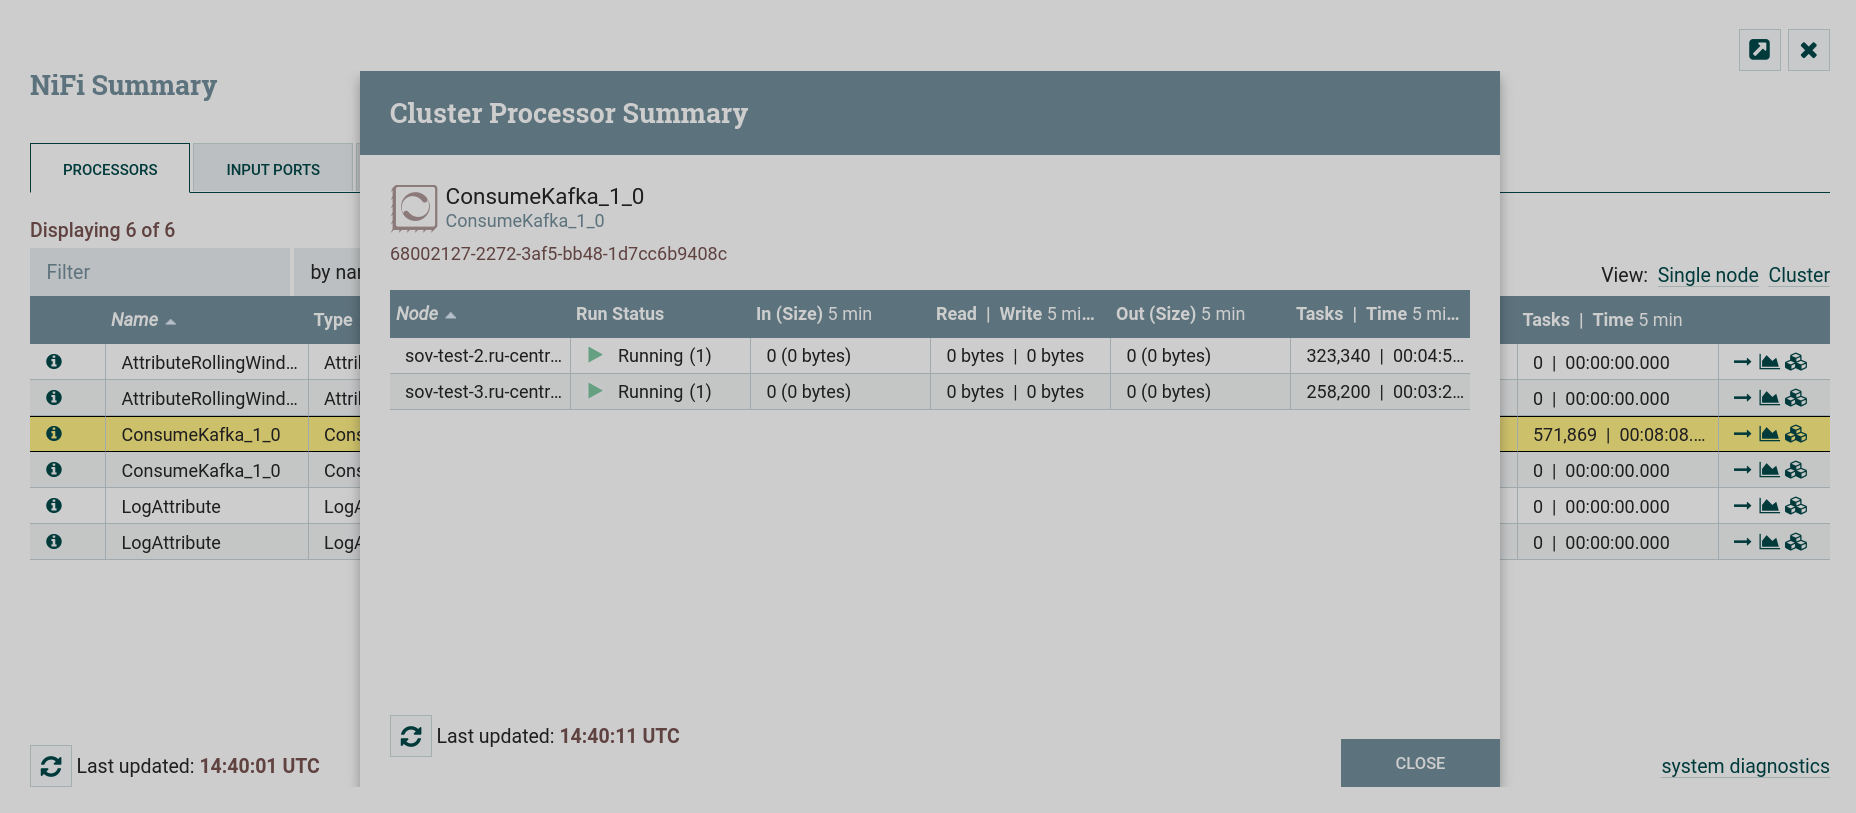 Information about the operation of the cluster hosts
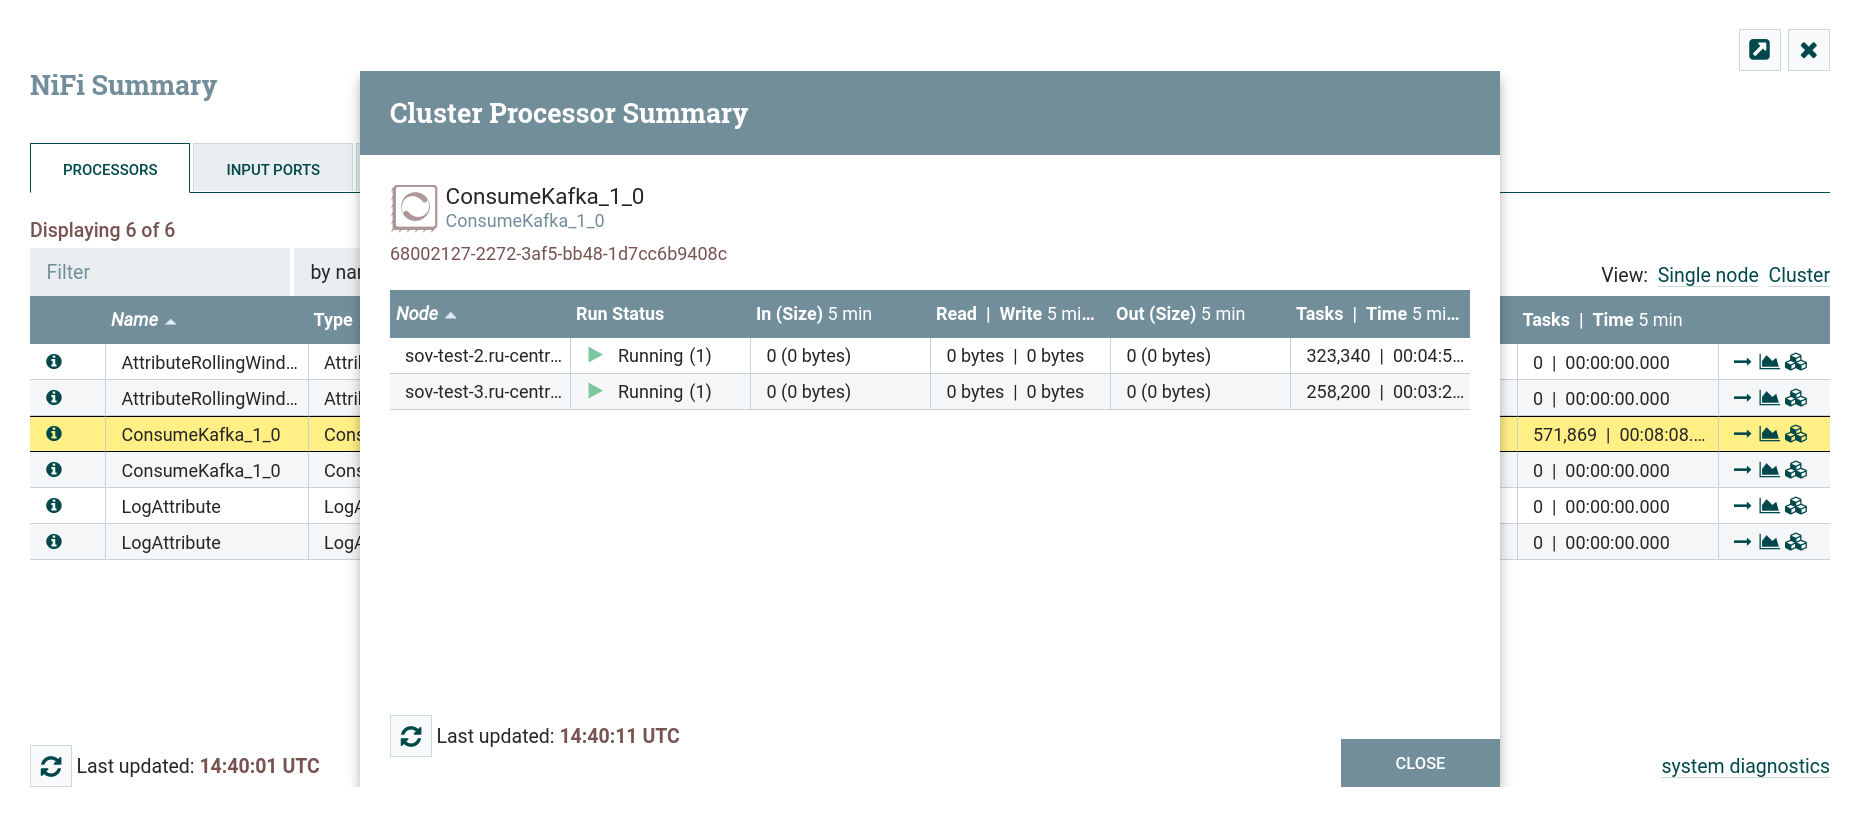 Information about the operation of the cluster hosts
 -
— displays state statistics for the selected component.
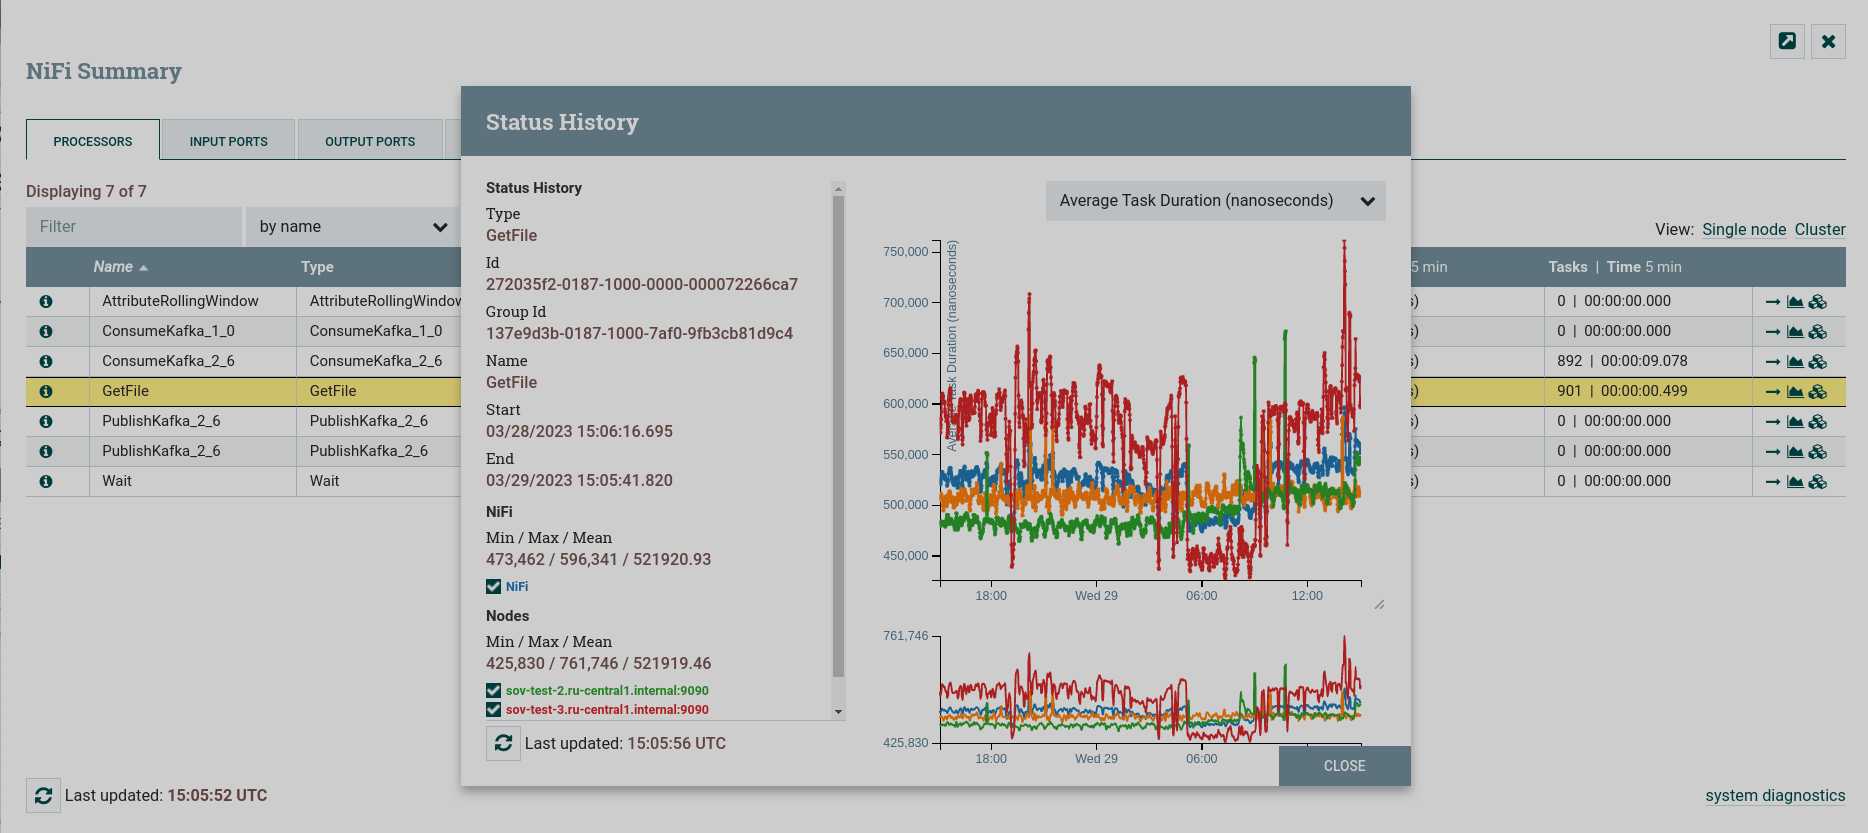 Statistics of states for the processor
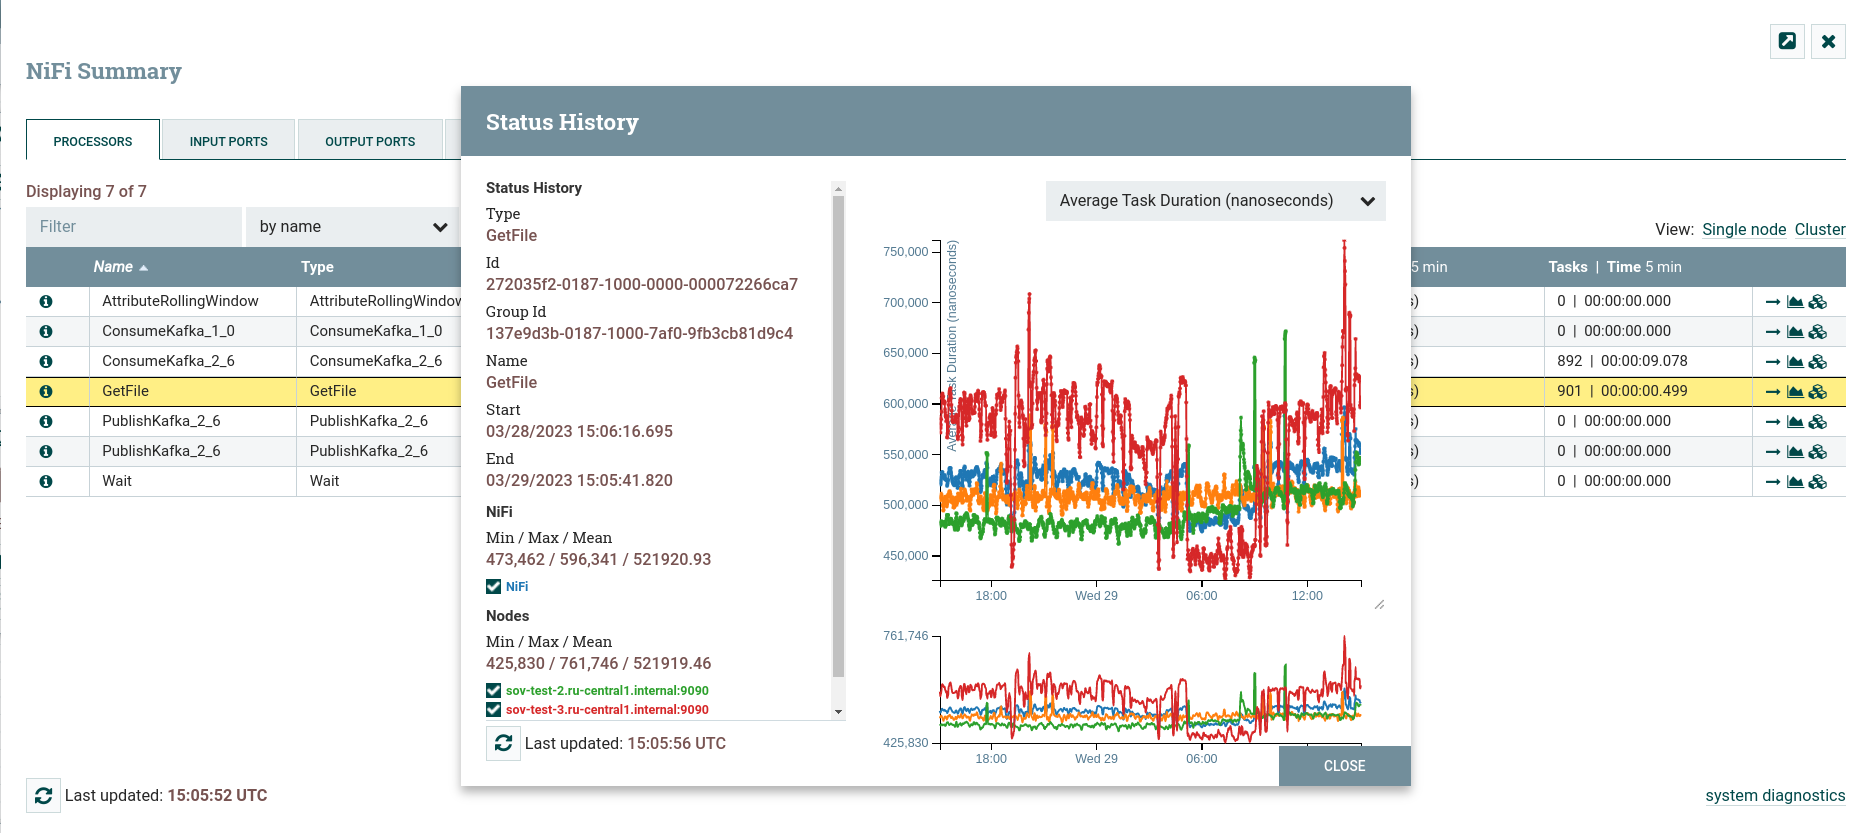 Statistics of states for the processor
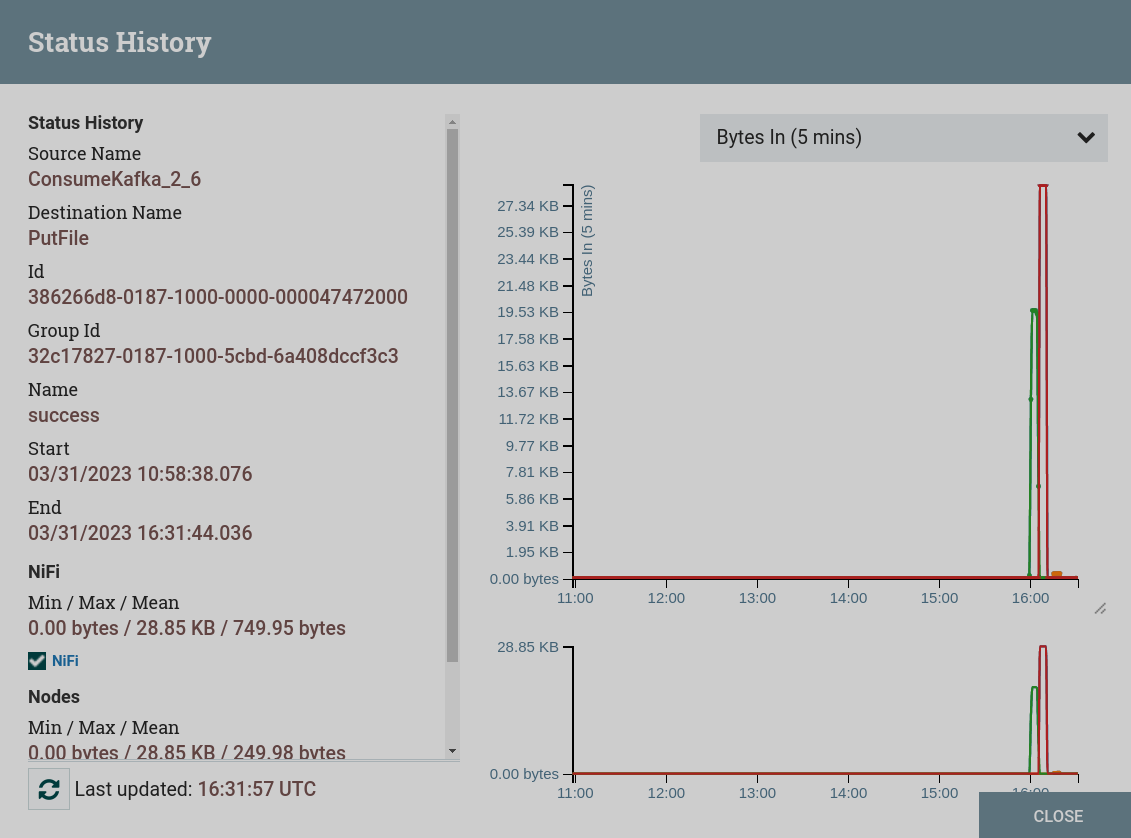
The left side provides the following information:
-
Type — the component type.
-
Id — the identifier of the component for which statistics are displayed.
-
Group Id — the identifier of the process group in which the component resides.
-
Name — the name of the component for which statistics are displayed.
-
Start — the earliest time shown on the chart.
-
End — the last time shown on the chart.
-
Min/Max/Mean — the minimum, maximum, and average (arithmetic mean or average) values. These values are based only on the selected time range if any time range is selected. Each node is displayed in its own color.
On the right side are:
-
Dropdown list of different types of metrics displayed in the charts below.
-
Enlarged top graph for easier reading. In the lower right corner of this graph is a small handle that can be dragged to resize the graph.
-
Lower graph, which provides the ability to select the time range to be displayed on the upper graph.
-
Work with component operation data
The Summary window uses the following elements to navigate and simplify the use of data:
-
The filter at the top of the table allows users to filter the contents of the pivot table by entering all or part of some criteria such as processor type or processor name.
-
— allows you to update the displayed information without closing the dialog box and opening it again. The information on the page is not updated automatically.
-
— closes the Summary page and takes the user directly to the component on the NiFi canvas. This can change the process group the user is currently in.
-
— сauses the entire Summary dialog to open on a new browser tab or window. In the window that opens, only data called using the icon
is available for viewing.
Event counters
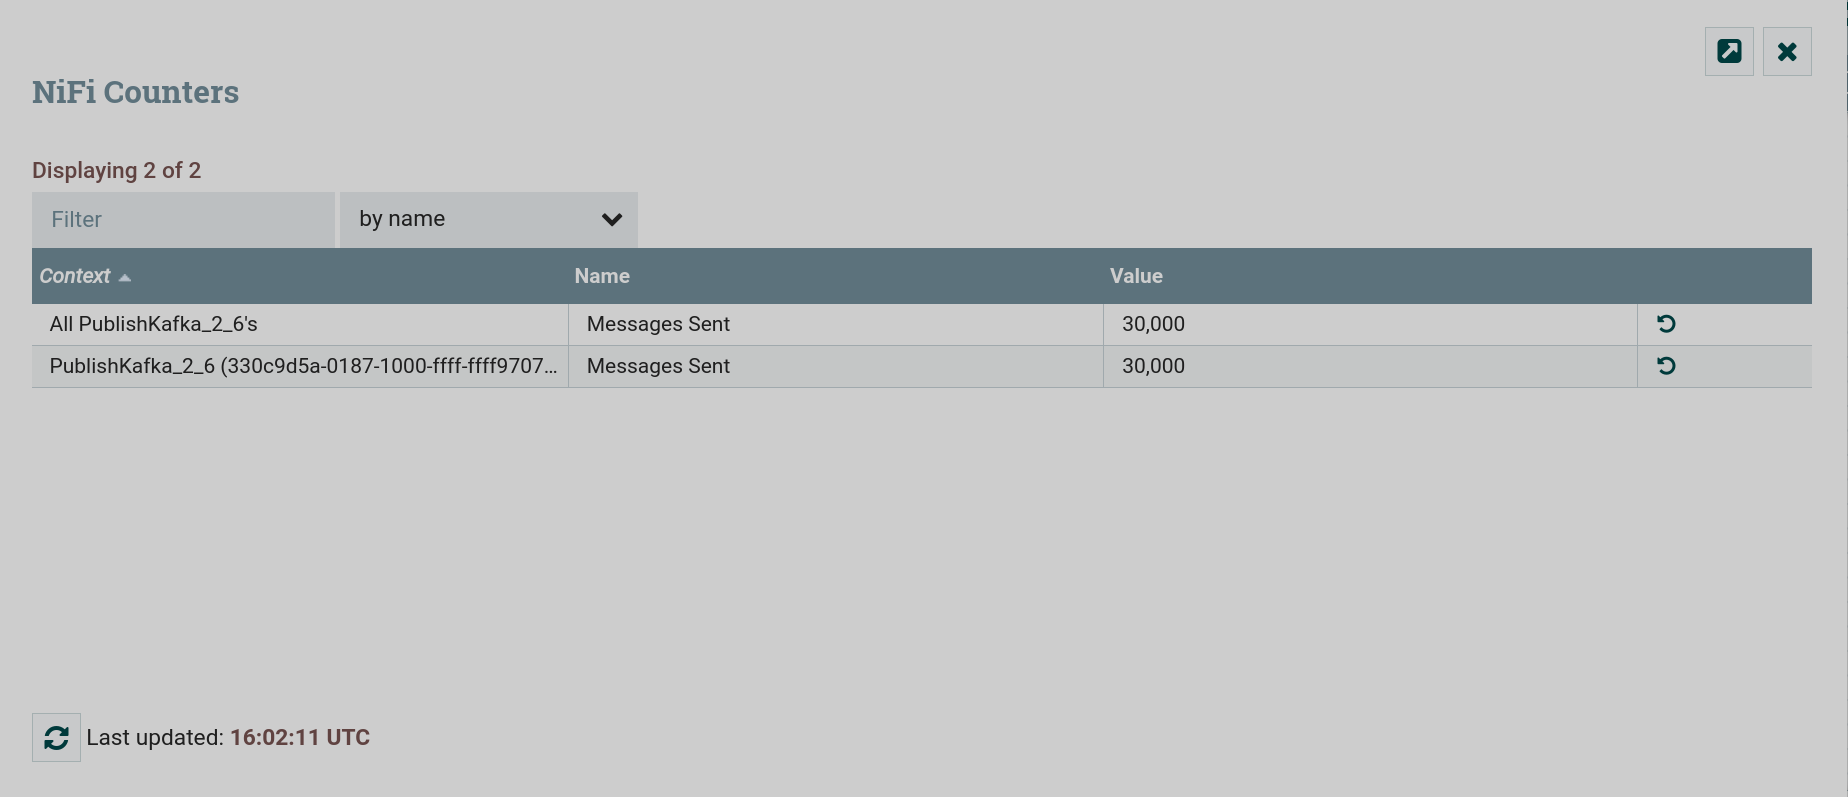
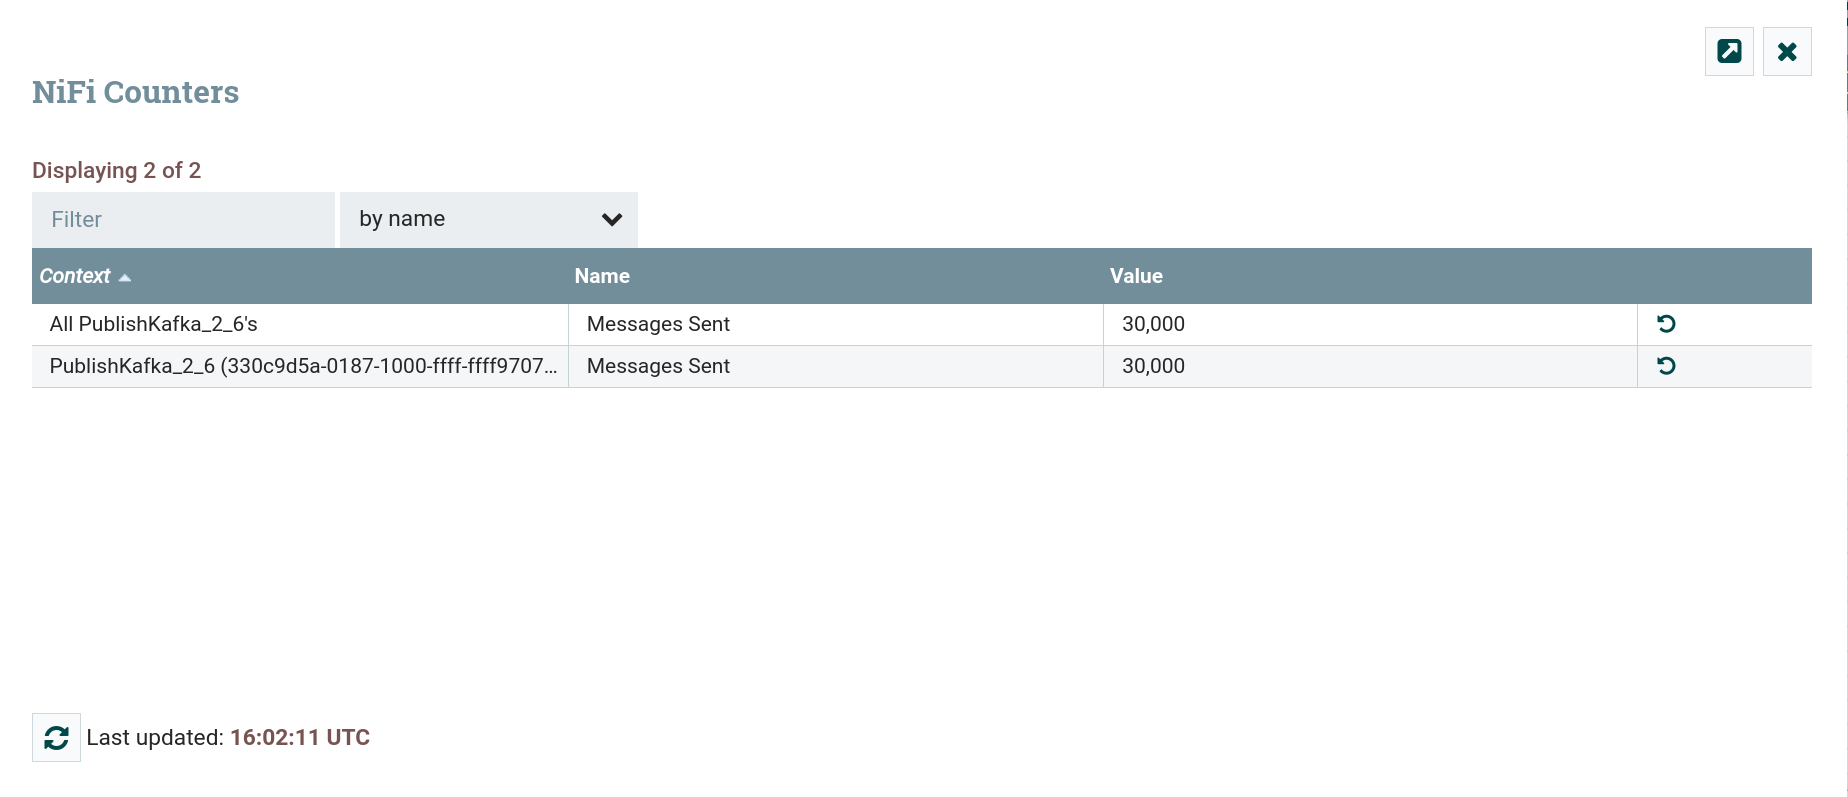
Event counters for each component are presented in the Counters window, which opens when you click the menu item of the same name in the global menu of the NiFi Server interface.
Bulletins
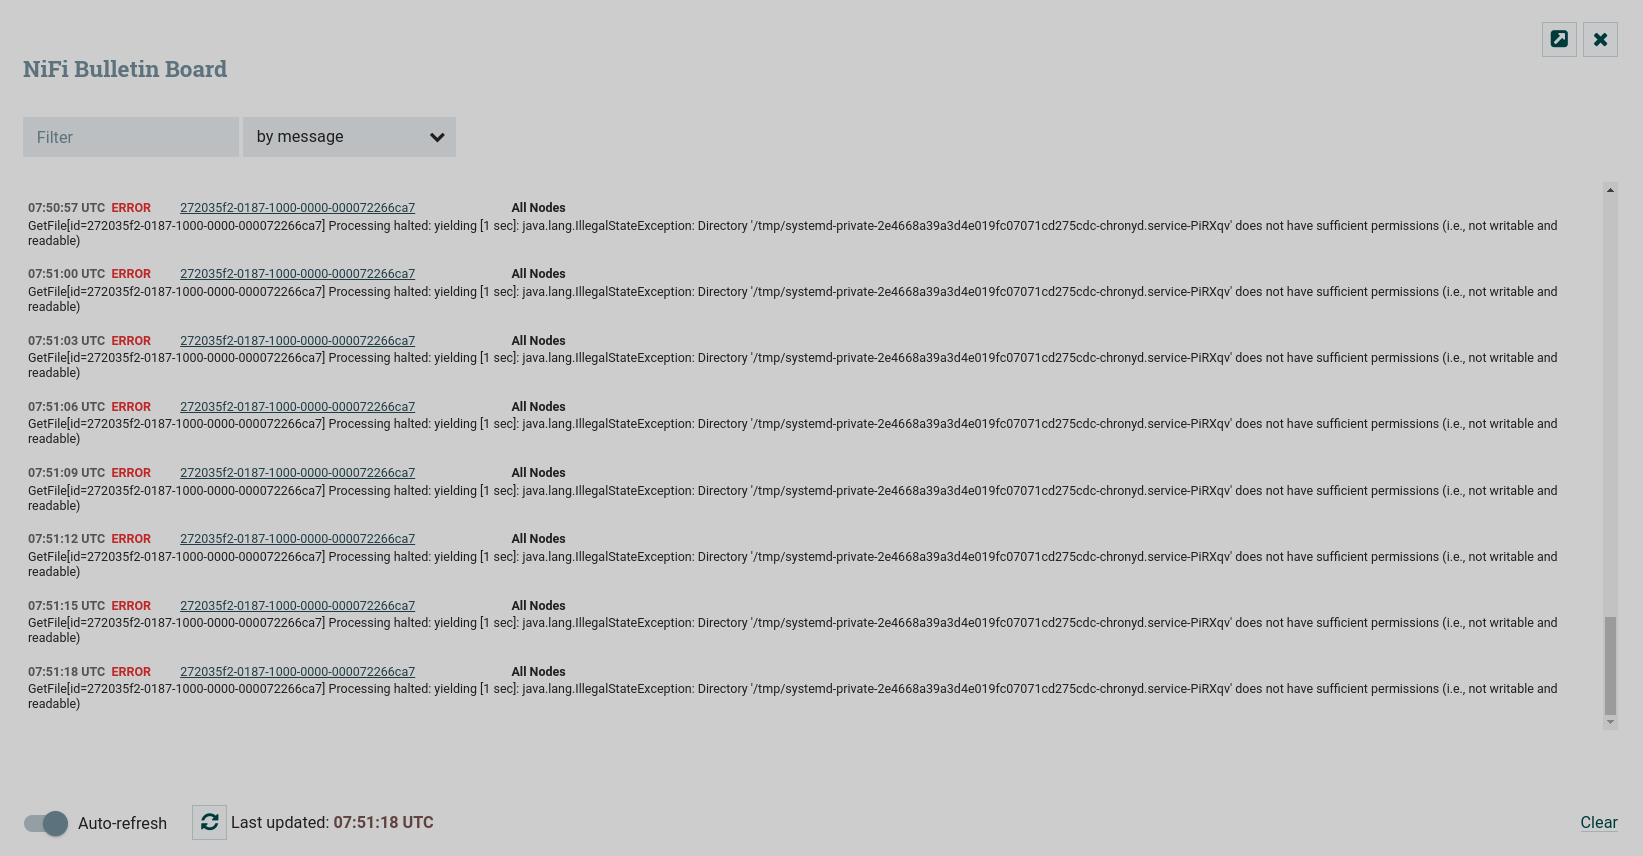
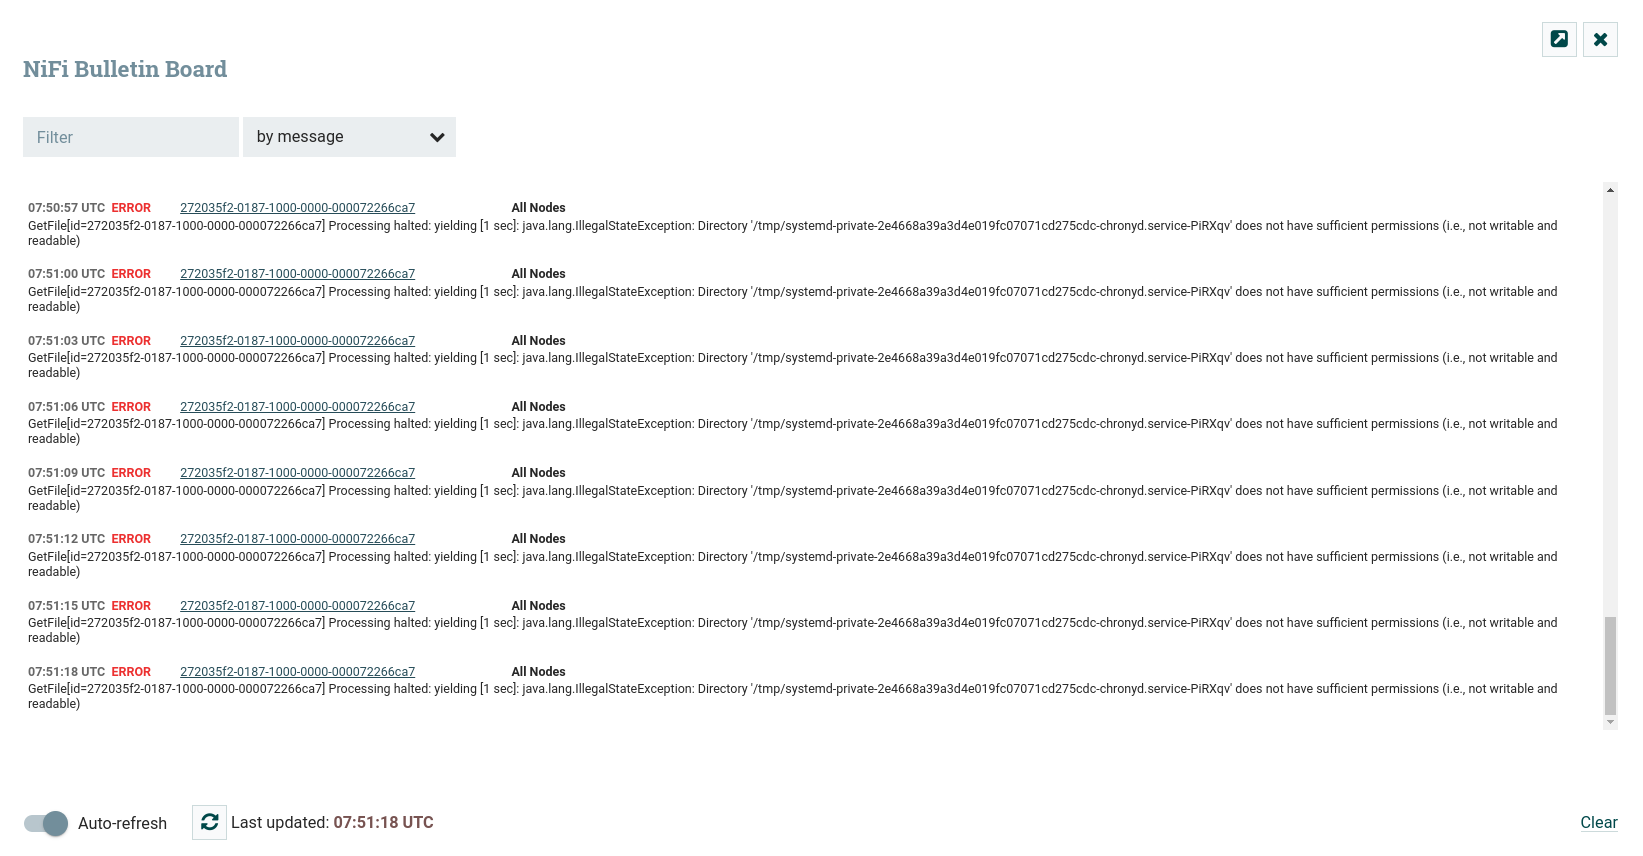
Event bulletins are presented in the Bulletin Board window, which opens when you click the menu item of the same name in the global menu of the NiFi Server interface.
Processor
The graphical representation of the processor on the canvas includes data about the processor and its operation.
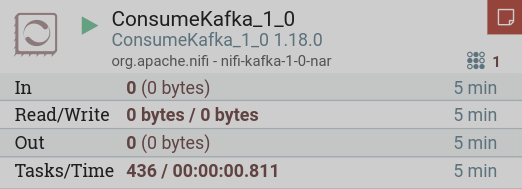
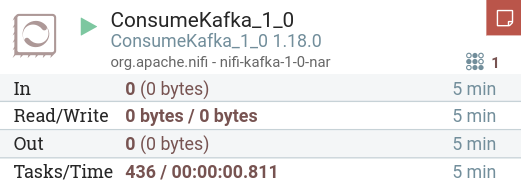
The information elements are described below using the example of the presented processor:
-
ConsumeKafka_1_0 — user-defined processor name. By default, the processor name is the same as the processor type. The processor name can be changed via processor settings on the SETTINGS tab.
-
ConsumeKafka_1_0 1.18.0 — processor type. This processor is designed to receive messages from Apache Kafka created for the Kafka 1.0 Consumer API.
-
org.apache.nifi - nifi-kafka-1-0-nar — processor bundle name.
-
— indicates that a bulletin has been created for this processor as a result of an event. The bulletin level can be changed via processor settings on the SETTINGS tab. When the icon is present, hovering the mouse over the icon will display a tooltip explaining the message provided by the processor as well as the bulletin level. If the NiFi instance is grouped, it will also show the node that issued the newsletter. Bulletins automatically expire after five minutes.
-
Status indicator showing the current state of the processor. The following indicators are possible:
-
— the processor is currently running.
-
— the processor is valid and enabled but not running.
-
— the processor is enabled but currently invalid and cannot be started. Hovering over this icon will display a tooltip indicating why the processor is invalid.
-
— the processor is not running and cannot be started until it is enabled. This status does not indicate whether the processor is valid.
-
-
— the number of tasks that this processor is currently executing. The task limit is configured using the Concurrent Tasks parameter via processor settings on the SCHEDULING tab.
-
5 minute statistics:
-
In — the amount of data the processor has retrieved from its incoming connection queues. This value is in the following format:
<count> (<size>), where<count>is the number of FlowFiles that were retrieved from the queues, and<size>is the total size of the contents of these FlowFiles, including unit of measure (for example,15 (20.1 MB)). -
Read/Write — the total size of the contents of the FlowFile read by the processor from disk and written to disk.
-
Out — the amount of data that the processor sent to its outgoing connections. This does not include FlowFiles that the Processor deletes itself, or FlowFiles that are redirected to auto-terminate connections. This value is in the following format:
<count> (<size>), where<count>is the number of FlowFiles that were retrieved from the queues, and<size>is the total size of the contents of these FlowFiles, including unit of measure (for example,15 (20.1 MB)). -
Tasks/Time — the number of times this processor has been called to run in the last 5 minutes and the amount of time these tasks have taken.
-
Process group
The graphical display of a process group on the canvas includes data about its operation.
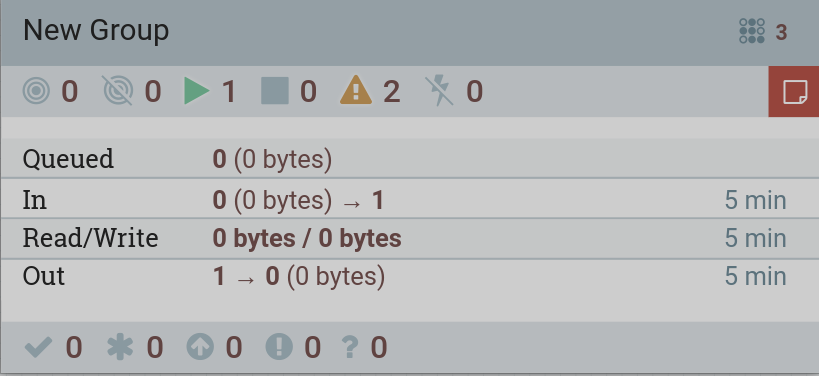
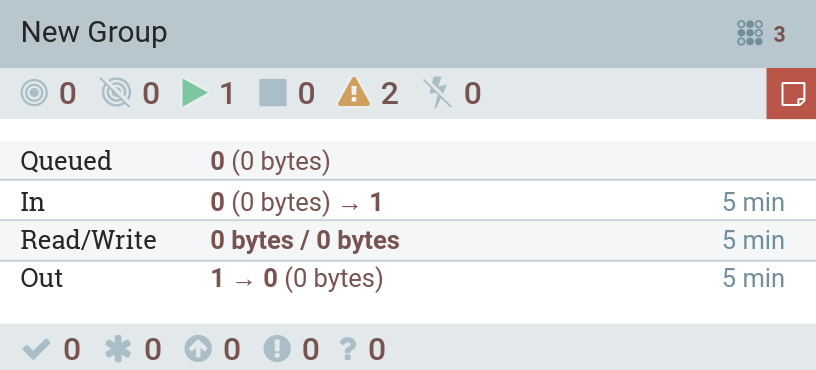
The information elements are described below using the example of the presented process group:
-
New group — name defined by the user during process group creation. The process group name can be changed via process group settings on the GENERAL tab.
-
— indicates that a bulletin has been issued for a child process group component.
-
— the number of tasks that the components of this process group are currently executing.
-
5 minute statistics:
-
Queued — the number of FlowFiles currently queued in the process group. This value is in the following format:
<count> (<size>), where<count>is the number of FlowFiles that were retrieved from the queues, and<size>is the total size of the contents of these FlowFiles, including unit of measure (for example,15 (20.1 MB)). -
In — the number of FlowFiles that were transferred to the process group through all input ports in the last 5 minutes. This value is in the following format:
<number> (<size>) → <ports>, where<number>is the number of FlowFiles that were retrieved from the queues,<size>is the total size of the contents of these FlowFiles, including the unit, and<ports>is the number of input ports. -
Read/Write — the total size of the contents of the FlowFile that the components in the process group read from disk and wrote to disk.
-
Out — the number of FlowFiles that have been transferred from the process group through its output ports in the last 5 minutes. This value is in the following format:
<ports> → <number> (<size>), where<ports>is the number of output ports,<number>is the number of FlowFiles that were retrieved from the queues,<size>is the total size of the contents of these FlowFiles, including the unit.
-
-
Status counters for components according to status bar in the NiFi Server interface.
Remote process group
The graphical display of a remote process group on the canvas includes data about its operation.
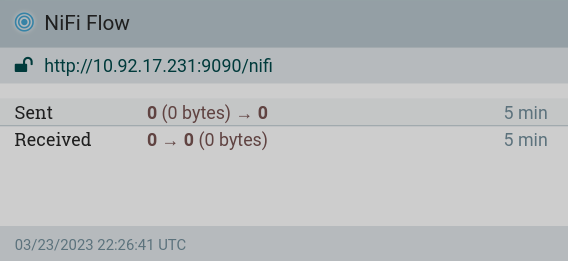
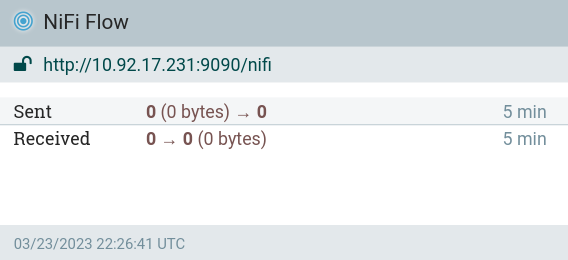
The information elements are described below using the remote process group as an example:
-
Transfer status indicating whether data transfer is currently enabled between the current and remote NiFi instances. The following indicators are possible:
-
— transmission is active, any of the input ports or output ports is currently set to transmit;
-
— transmission is inactive, all input ports and output ports that are currently connected have stopped.
-
-
NiFi Flow — the name of the NiFi instance reported by the remote instance.
-
http://10.92.17.231:9090/nifi — the URL of the remote instance pointed to by the remote process group. This URL is entered when adding a group of remote processes to the canvas and cannot be changed.
-
security indicator indicating whether communication with the remote NiFi instance is secure:
-
— communication is secure, this NiFi instance will not be able to communicate with the remote instance until the remote instance administrator grants access.
-
— communication is not secure.
-
-
5 minute statistics:
-
Sent — the number of FlowFiles that were sent. This value is in the following format:
<number> (<size>) → <ports>, where<number>is the number of FlowFiles that were retrieved from the queues,<size>is the total size of the contents of these FlowFiles, including the unit, and<ports>is the number of input ports. -
Received — the number of FlowFiles that were received. This value is in the following format:
<ports> → <number> (<size>), where<ports>is the number of output ports,<number>is the number of FlowFiles that were retrieved from the queues,<size>is the total size of the contents of these FlowFiles, including the unit.
-
-
Time when the remote stream was last updated.
Queue
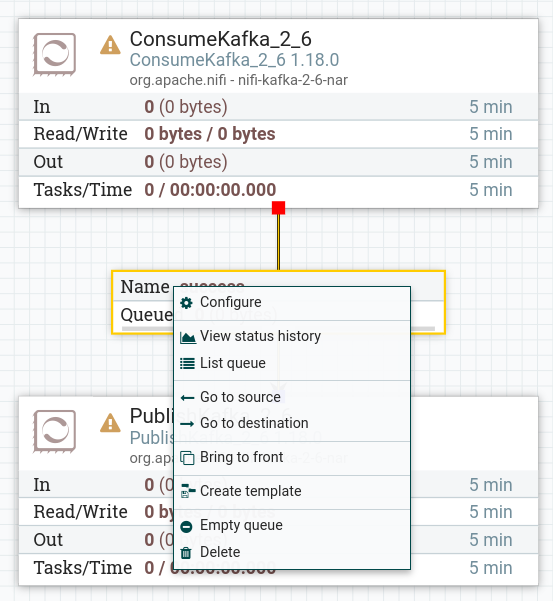
It is possible to view queue diagnostics via the context menu.
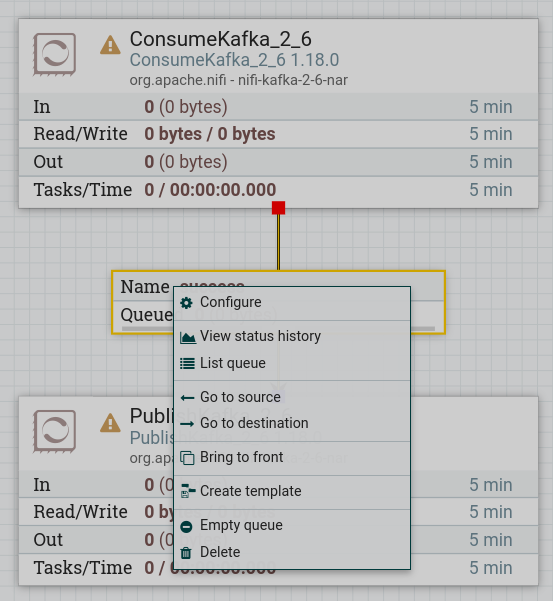
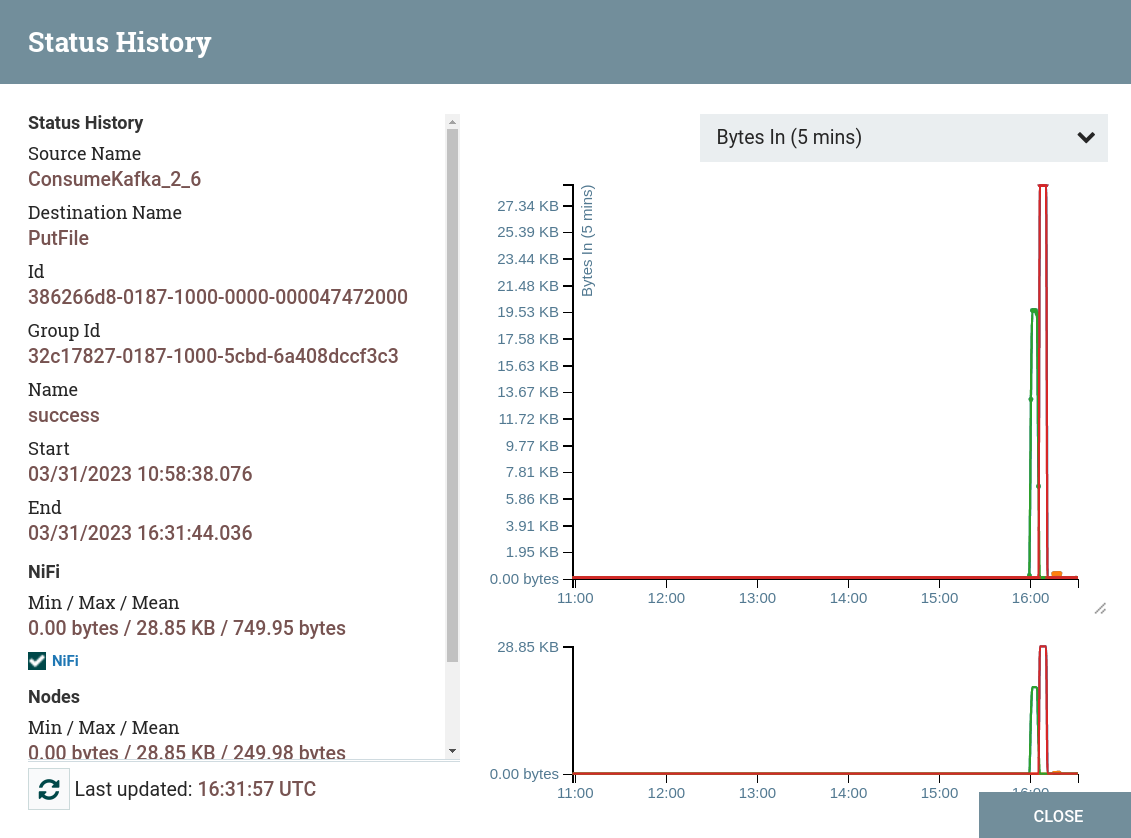
View status history — displays status statistics for the queue.
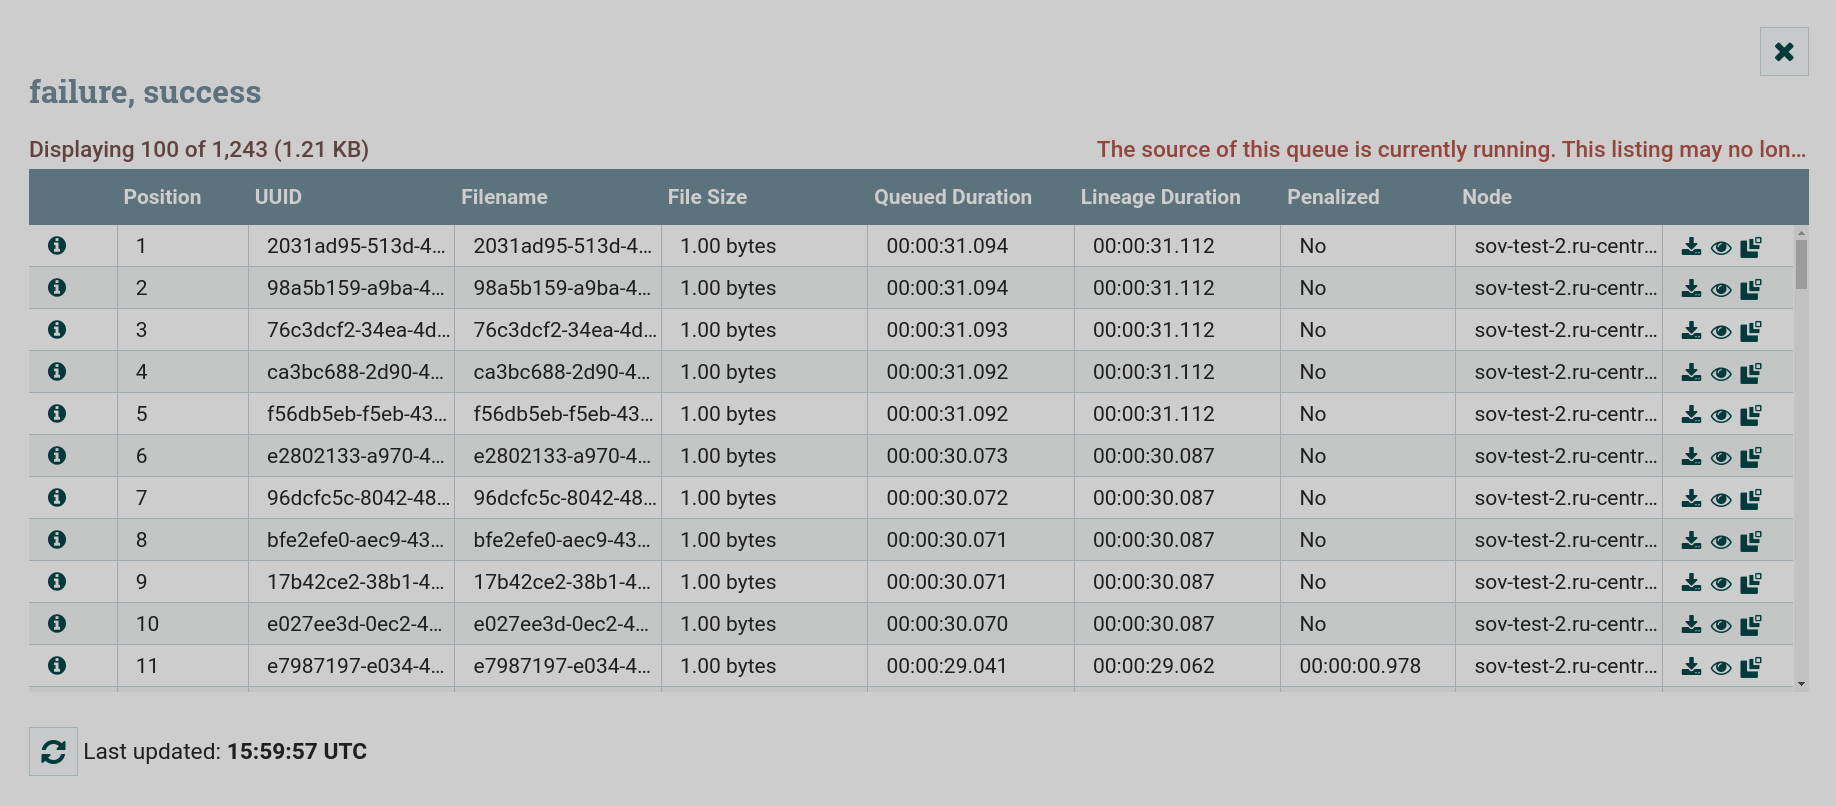
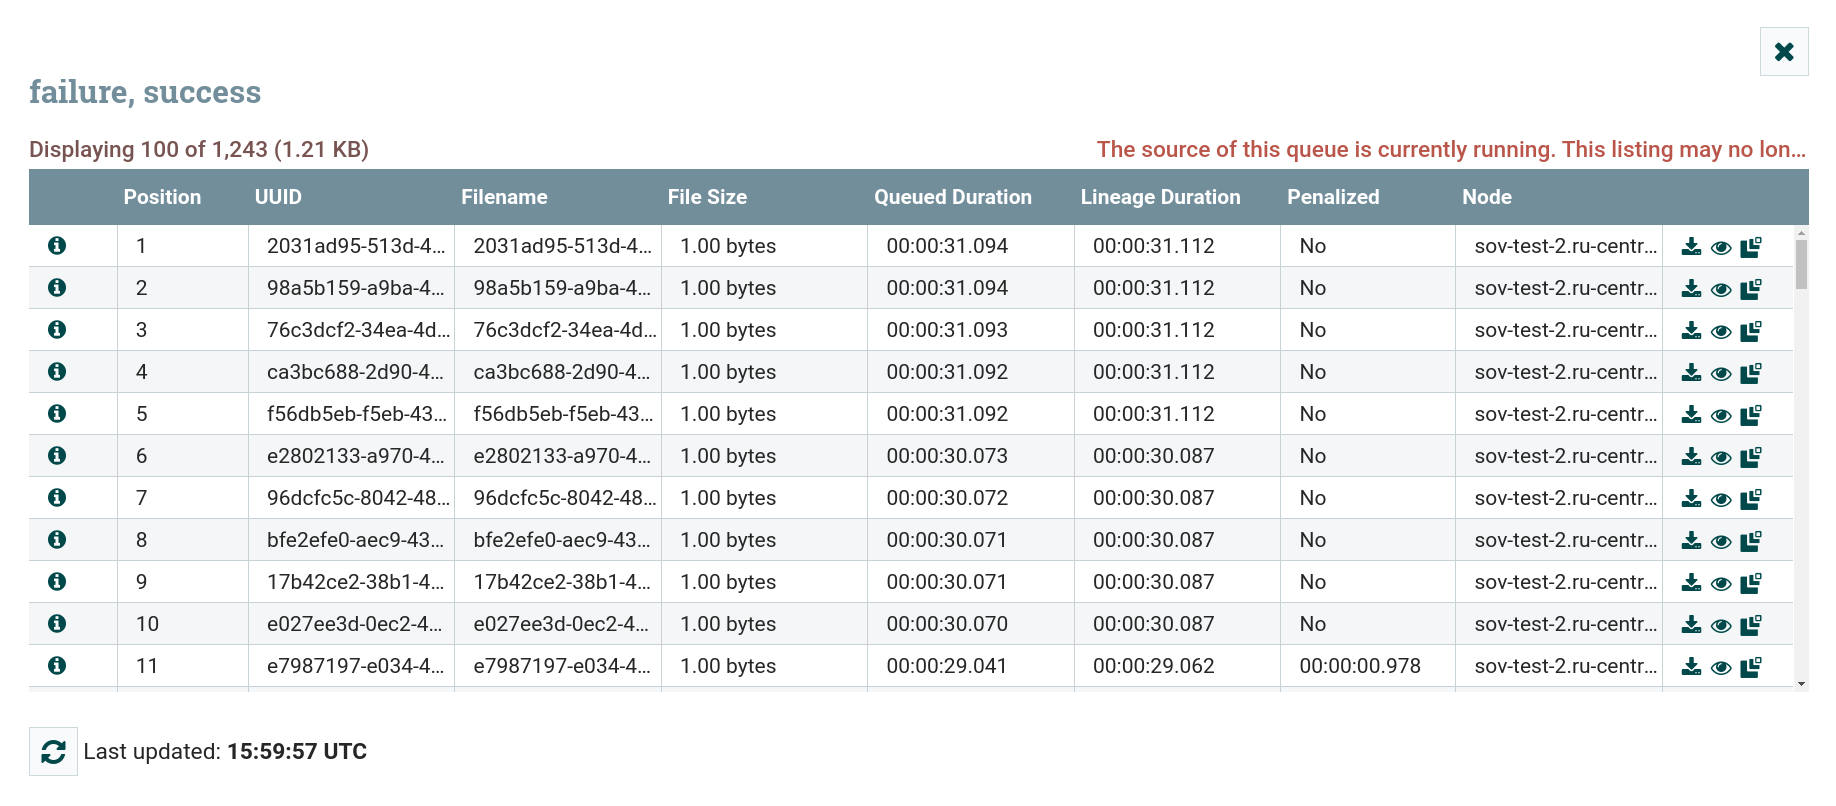
List queue — will return 100 FlowFiles in the active queue according to the configured priority.
|
NOTE
For more information about monitoring in the Apache NiFi user interface, see Monitoring of DataFlow. |
