ADS monitoring metrics
This article describes the metrics for monitoring an ADS cluster. For information on installing monitoring, refer to the articles:
Metric types
Two groups of metrics are available for an ADS cluster: system metrics and service metrics.
In Graphite, system metrics are shown in the System_metrics section, service metrics in the services section.
System metrics show the general characteristics of cluster hosts, usually related to resource consumption. System metrics are shown in the table below.
| Metrics group | Description |
|---|---|
cpu |
CPU utilization |
diskspace |
Disk capacity |
files |
File statistics |
iostat |
Input/output operation performance |
loadavg |
System load averages |
memory |
Memory usage |
netstat |
Network connection statistics |
network |
Network interface performance |
uptime |
Uptime statistics |
Service metrics show the characteristics of the services available to hosts in an ADS cluster.
The metrics for each service are shown in the tables below.
| Metrics group | Metric name | Description |
|---|---|---|
ReplicaManager |
AtMinIsrPartitionCount |
Number of partitions corresponding to minIsr ( |
FailedIsrUpdatesPerSec |
Number of failed In-Sync Replicas (ISR) updates per second. The metric has the following attributes:
|
|
IsrExpandsPerSec |
In-Sync Replicas (ISR) expand rate. The metric has the following attributes:
|
|
IsrShrinksPerSec |
In-Sync Replicas (ISR) shrink rate. The metric has the following attributes:
|
|
LeaderCount |
Number of partition leaders |
|
MaxLag |
Maximum delay |
|
OfflineReplicaCount |
Number of offline replicas |
|
PartitionCount |
Number of partitions |
|
ReassigningPartitions |
Number of reassigned partitions |
|
UnderMinIsrPartitionCount |
Number of partitions whose number of In-Sync Replicas (ISR) is less than minIsr |
|
UnderReplicatedPartitions |
Number of incompletely replicated partitions (ISR < current replicas) |
|
broker Group metrics have the following attributes:
|
BytesInPerSec |
Number of input bytes per second |
BytesOutPerSec |
Number of output bytes per second |
|
BytesRejectedPerSec |
Rejected data transfer rate (bytes per second) |
|
FailedFetchRequestsPerSec |
Number of get requests that failed per second |
|
FailedProduceRequestsPerSec |
Number of requests per second of the message producer that failed |
|
FetchMessageConversionsPerSec |
Number of fetch message conversions per second |
|
InvalidMagicNumberRecordsPerSec |
Number of errors per second when checking a message due to an invalid number of Magic. Magic Byte Protocol is used for backward compatibility of the message format |
|
InvalidMessageCrcRecordsPerSec |
Errors per second when checking a message due to a bad CRC checksum |
|
InvalidOffsetOrSequenceRecordsPerSec |
Number of errors while validating a message due to a non-constant offset or sequence number in the packet |
|
MessagesInPerSec |
Total number of incoming messages |
|
NoKeyCompactedTopicRecordsPerSec |
Number of messages validation errors due to no key specified for a compressed topic per second |
|
ProduceMessageConversionsPerSec |
Number of message conversions per second for the broker |
|
ReassignmentBytesInPerSec |
Number of bytes of incoming redirect traffic per second |
|
ReassignmentBytesOutPerSec |
Number of bytes of outgoing redirect traffic per second |
|
ReplicationBytesInPerSec |
Number of bytes of data transfer from other brokers per second |
|
ReplicationBytesOutPerSec |
Number of bytes transferred for other brokers per second |
|
TotalFetchRequestsPerSec |
Number of get requests per second |
|
TotalProduceRequestsPerSec |
Number of requests to produce messages per second |
|
controller |
ActiveControllerCount |
Number of active controllers |
ControllerState |
Controller status |
|
GlobalPartitionCount |
Total number of partitions |
|
GlobalTopicCount |
Total number of topics |
|
OfflinePartitionsCount |
Number of partitions that do not have an active leader and are therefore not writable or readable |
|
PreferredReplicaImbalanceCount |
Number of imbalances in the preferred replica |
|
ReplicasIneligibleToDeleteCount |
Number of non-compliant replicas waiting to be deleted |
|
ReplicasToDeleteCount |
Number of replicas waiting to be deleted |
|
TopicsIneligibleToDeleteCount |
Number of non-compliant topics waiting to be deleted |
|
TopicsToDeleteCount |
Number of topics waiting to be deleted |
|
controllerStats Group metrics have the following attributes:
|
AutoLeaderBalanceRateAndTimeMs |
Frequency and duration of automatic leader rebalancing |
ControlledShutdownRateAndTimeMs |
Frequency and duration of controlled stops |
|
ControllerChangeRateAndTimeMs |
Frequency and duration of controller changes |
|
ControllerShutdownRateAndTimeMs |
Monitors how often and how long the controller stops |
|
IsrChangeRateAndTimeMs |
Monitors frequency and duration of controller delay for manual balancing of leaders |
|
LeaderAndIsrResponseReceivedRateAndTimeMs |
Frequency and duration of receiving a leader response and synchronized replicas (In-Sync Replicas, ISR) |
|
LeaderElectionRateAndTimeMs |
Frequency and duration of leader election |
|
ListPartitionReassignmentRateAndTimeMs |
List of partition reassignment speed and time |
|
LogDirChangeRateAndTimeMs |
Frequency and duration (CPU latency) of LogDir changes |
|
ManualLeaderBalanceRateAndTimeMs |
Frequency and duration (CPU latency) of manual leaderboard balancing |
|
PartitionReassignmentRateAndTimeMs |
Frequency and duration (CPU latency) of partition remapping |
|
TopicChangeRateAndTimeMs |
Frequency and duration (CPU latency) of creating new topics |
|
TopicDeletionRateAndTimeMs |
Frequency and duration (CPU latency) of deleting topics |
|
TopicUncleanLeaderElectionEnableRateAndTimeMs |
Frequency and duration (CPU latency) of selecting an unclean leader (the leader appointed after the previous unreplicated leader was disabled) |
|
UncleanLeaderElectionEnableRateAndTimeMs |
Frequency and duration (CPU latency) of unclean leader election |
|
UncleanLeaderElectionsPerSec |
Number of unclean leader elections per second |
|
UpdateFeaturesRateAndTimeMs |
Frequency and duration (CPU latency) of feature updates |
|
memory |
HeapMemoryUsage_committed |
Usage of dynamic (heap) memory — committed (in MB) |
HeapMemoryUsage_init |
Usage of dynamic (heap) memory — initialization (in MB) |
|
HeapMemoryUsage_max |
Usage of dynamic (heap) memory — maximum (in MB) |
|
HeapMemoryUsage_used |
Used dynamic (heap) memory (in MB) |
|
NonHeapMemoryUsage_committed |
Use of non-heap memory — committed (in MB) |
|
NonHeapMemoryUsage_init |
Non-heap memory usage — initialization (in MB) |
|
NonHeapMemoryUsage_max |
Use of non-heap memory — maximum (in MB) |
|
NonHeapMemoryUsage_used |
Used non-dynamic (heap) memory (in MB) |
|
ObjectPendingFinalizationCount |
Number of objects for which finalization is pending |
|
network |
NetworkProcessorAvgIdlePercent |
The average percentage of time that network processor threads are idle. Values range from |
RequestQueueSize |
Request queue size |
|
ResponseQueueSize |
Response queue size |
|
session Group metrics have the following attributes:
|
ZooKeeperAuthFailuresPerSec |
Number of unsuccessful (due to authorization errors) attempts to connect to the cluster per second |
ZooKeeperDisconnectsPerSec |
Number of ZooKeeper client disconnects from the cluster per second. This metric tells if the broker goes down, but does not tell if ZooKeeper is running |
|
ZooKeeperExpiresPerSec |
Number of expired ZooKeeper sessions per second. Shows system performance most accurately |
|
ZooKeeperReadOnlyConnectsPerSec |
Number of connections from a client to a server that is "Read Only" (neither "follower" nor "leader") per second. Client can only read ZooKeeper state |
|
ZooKeeperSaslAuthenticationsPerSec |
Number of client authentication successes per second |
|
ZooKeeperSyncConnectsPerSec |
Number of successful ZooKeeper client connections to the cluster per second |
| Metrics group | Metric name | Description |
|---|---|---|
MinifiAgentCollector/Instance |
activeThreads |
Number of active threads |
bytesRead |
Number of bytes read |
|
bytesSent |
Number of bytes sent |
|
queuedContentSize |
Queue content size |
|
queuedCount |
Number of bytes in the queue |
|
MinifiAgentCollector/SystemDiagnostics |
availableProcessors |
Available processors |
diskUtilization |
Disk usage (in %) |
|
heapUtilization |
Heap usage (in %) |
|
loadAverage |
Average load (in %) |
|
usedHeap |
Memory heap used (in MB) |
|
usedSpaceGeneral |
Disk space usage (in MB) |
| Metrics group | Metric name | Description |
|---|---|---|
heap |
committed |
Usage of heap memory — committed (in MB) |
init |
Usage of heap memory — initialization (in MB) |
|
max |
Usage of heap memory — maximum (in MB) |
|
usage |
Usage of heap memory (in MB) |
|
used |
Used heap memory (in MB) |
|
non-heap |
committed |
Use of non-heap memory — committed (in MB) |
init |
Non-heap memory usage — initialization (in MB) |
|
max |
Use of non-heap memory — maximum (in MB) |
|
usage |
Use of non-heap memory (in MB) |
|
used |
Used non-heap memory (in MB) |
|
pools → Code Cache |
committed |
Code-Cache memory area — committed (in MB) |
init |
Code-Cache memory area — initialization (in MB) |
|
max |
Code-Cache memory area — maximum (in MB) |
|
usage |
Usage of the Code-Cache memory area (in MB) |
|
used |
Used Code-Cache memory area (in MB) |
|
pools → Compressed-Class-Space |
committed |
Compressed-Class-Space — committed (in MB) |
init |
Memory area Compressed-Class-Space — initialization (in MB) |
|
max |
Compressed-Class-Space — maximum (in MB) |
|
usage |
Use area of memory Compressed-Class-Space (in MB) |
|
used |
Used memory area Compressed-Class-Space (in MB) |
|
pools → G1-Eden-Space |
committed |
Memory area G1-Eden-Space — committed (in MB) |
init |
Memory area G1-Eden-Space — initialization (in MB) |
|
max |
Memory area G1-Eden-Space — maximum (in MB) |
|
usage |
Use area of memory G1-Eden-Space (in MB) |
|
used |
Used memory area G1-Eden-Space (in MB) |
|
used-after-gc |
Used after GC start area of memory G1-Eden-Space (in MB) |
|
pools → G1-Old-Gen |
committed |
Memory area G1-Old-Gen — assignment (committed) (in MB) |
init |
Memory area G1-Old-Gen — initialization (in MB) |
|
max |
G1-Old-Gen memory area — maximum (in MB) |
|
usage |
Usage of the G1-Old-Gen memory area (in MB) |
|
used |
Used area of memory G1-Old-Gen (in MB) |
|
used-after-gc |
Used after GC start area of memory G1-Old-Gen (in MB) |
|
pools → G1-Survivor-Space |
committed |
Memory area G1-Survivor-Space — committed (in MB) |
init |
Memory area G1-Survivor-Space — initialization (in MB) |
|
max |
G1-Survivor-Space memory area — maximum (in MB) |
|
usage |
Usage of the memory area G1-Survivor-Space (in MB) |
|
used |
Used memory area G1-Survivor-Space (in MB) |
|
used-after-gc |
Used after GC start (used-after-gc) area of memory G1-Survivor-Space (in MB) |
|
pools → Metaspace |
committed |
Memory area Metaspace — committed (in MB) |
init |
Memory area Metaspace — initialization (in MB) |
|
max |
Memory area Metaspace — maximum (in MB) |
|
usage |
Usage of the Metaspace memory area (in MB) |
|
used |
Used Metaspace memory area (in MB) |
|
total |
committed |
Assigned to use total memory (in MB) |
init |
Initialization of total memory (in MB) |
|
max |
Maximum total memory (in MB) |
|
usage |
Usage of total memory (in MB) |
|
used |
Used total memory (in MB) |
|
— |
ActiveThreads |
Number of active threads |
— |
BytesQueued |
Number of bytes in the queue |
— |
BytesReadLast5Minutes |
Number of bytes read in the last 5 minutes |
— |
BytesReceivedLast5Minutes |
Number of bytes received in the last 5 minutes |
— |
BytesSentLast5Minutes |
Number of bytes sent in the last 5 minutes |
— |
BytesWrittenLast5Minutes |
Number of bytes written in the last 5 minutes |
— |
FlowFilesQueued |
Number of FlowFiles in the queue |
— |
FlowFilesReceivedLast5Minutes |
Number of FlowFiles received in the last 5 minutes |
— |
FlowFilesSentLast5Minutes |
Number of FlowFiles sent in the last 5 minutes |
— |
TotalTaskDurationNanoSeconds |
Total task duration (in nanoseconds) |
View monitoring metrics
Graphite
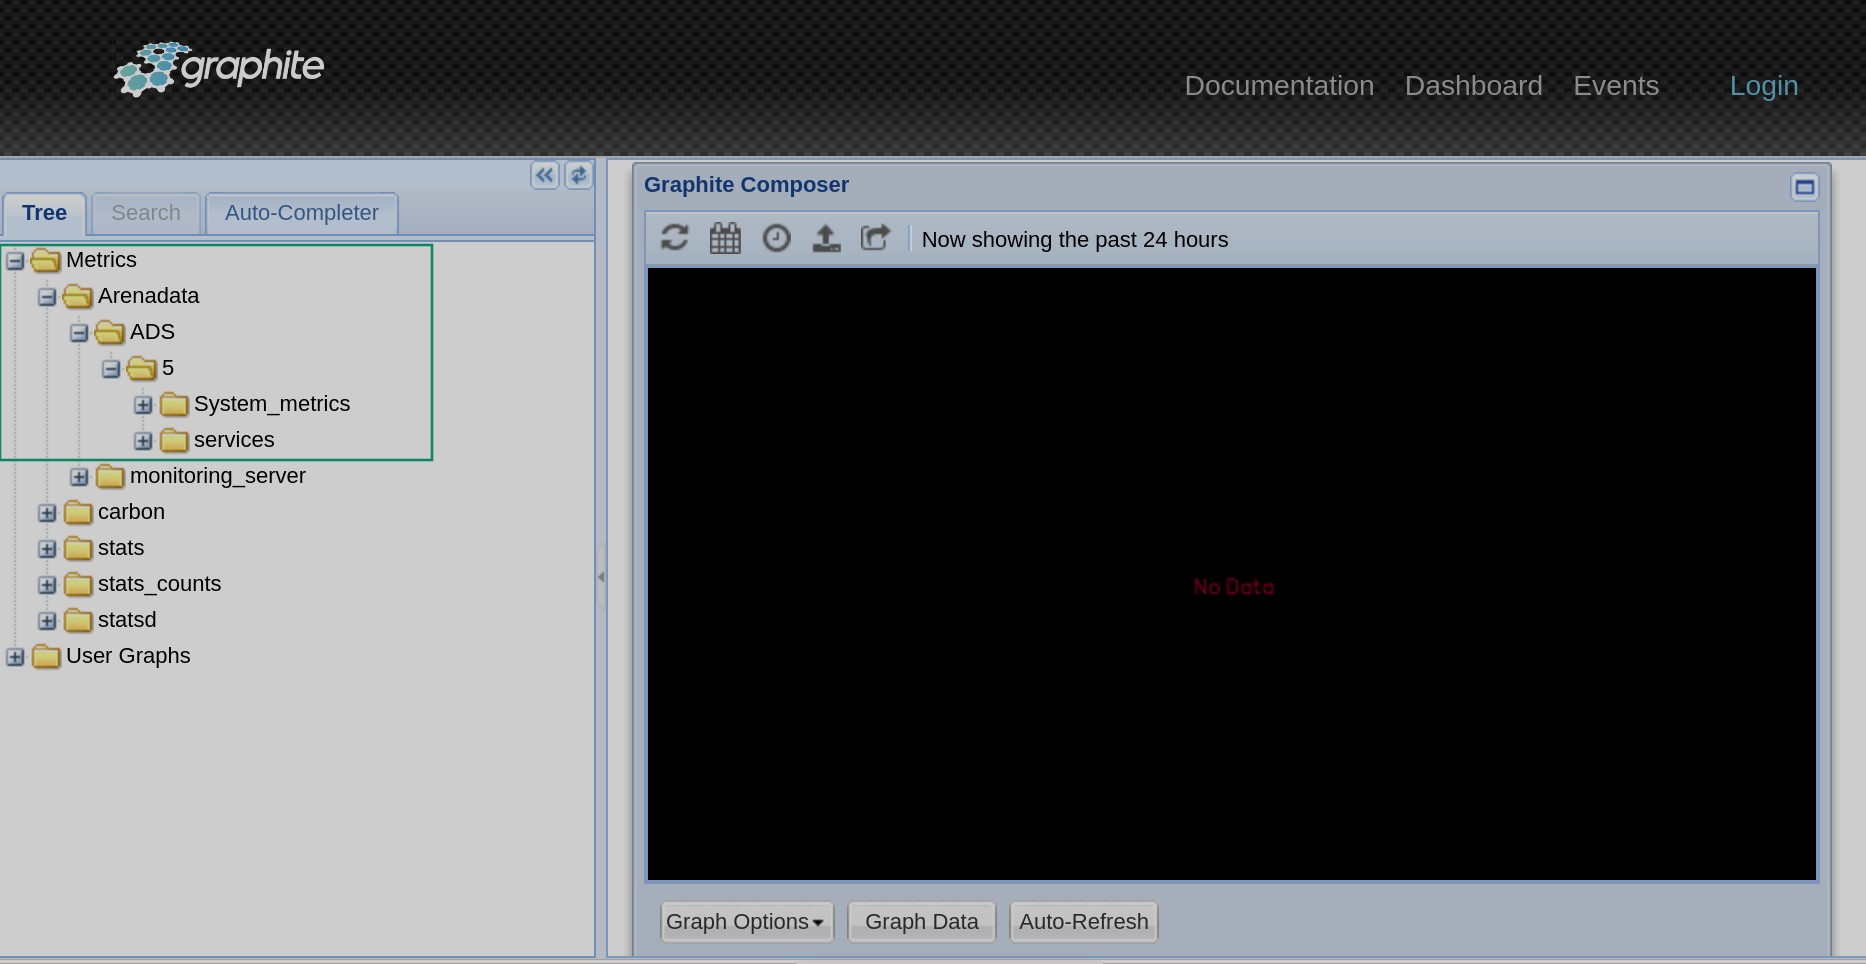
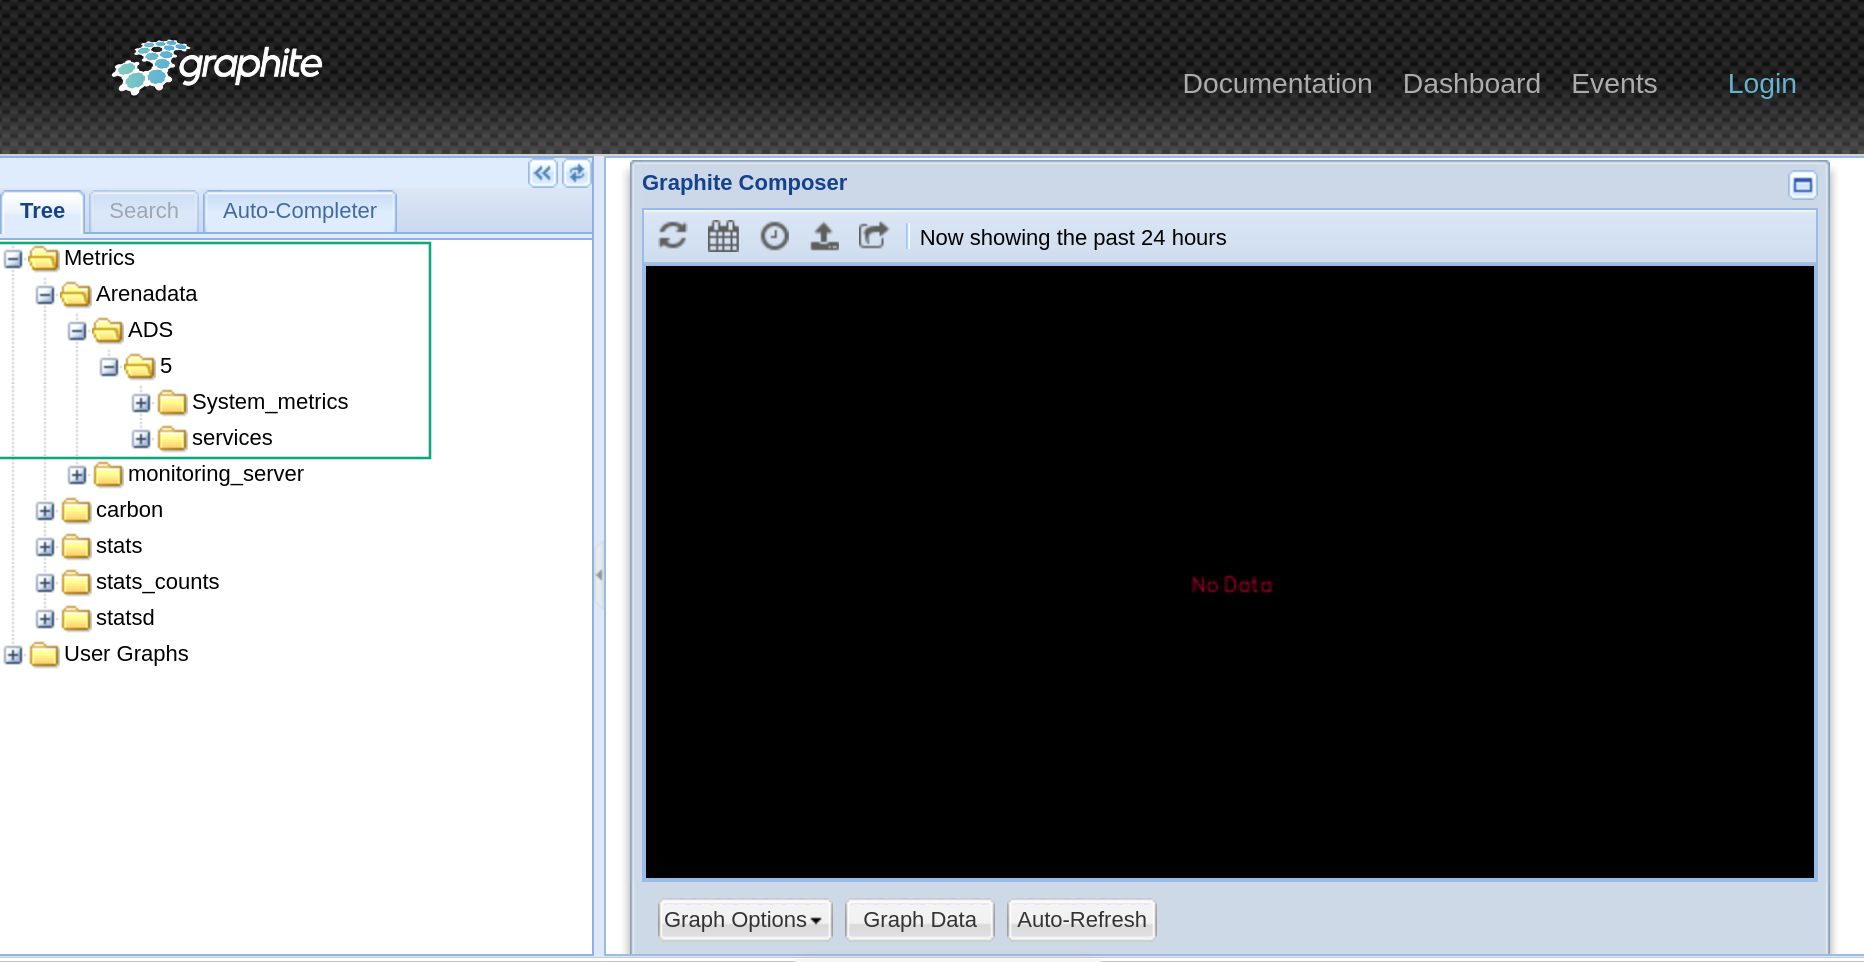
Graphite stores numeric time series data and displays graphs of the data on demand. To view the metrics, enter the address of the host with the monitoring cluster into the browser address bar. Example: http://10.92.16.223. If you didn’t specify a different port during сonfiguring services of the monitoring cluster, Graphite uses the default port (80). If you specified Web-interface TCP port when configuring Graphite, specify the port number separated by a colon. Example: http://10.92.16.223:8080.
In the left part of the window that opens, expand the Metrics → Arenadata → ADS node. The list displays two groups of metrics: System_metrics and services.
Grafana
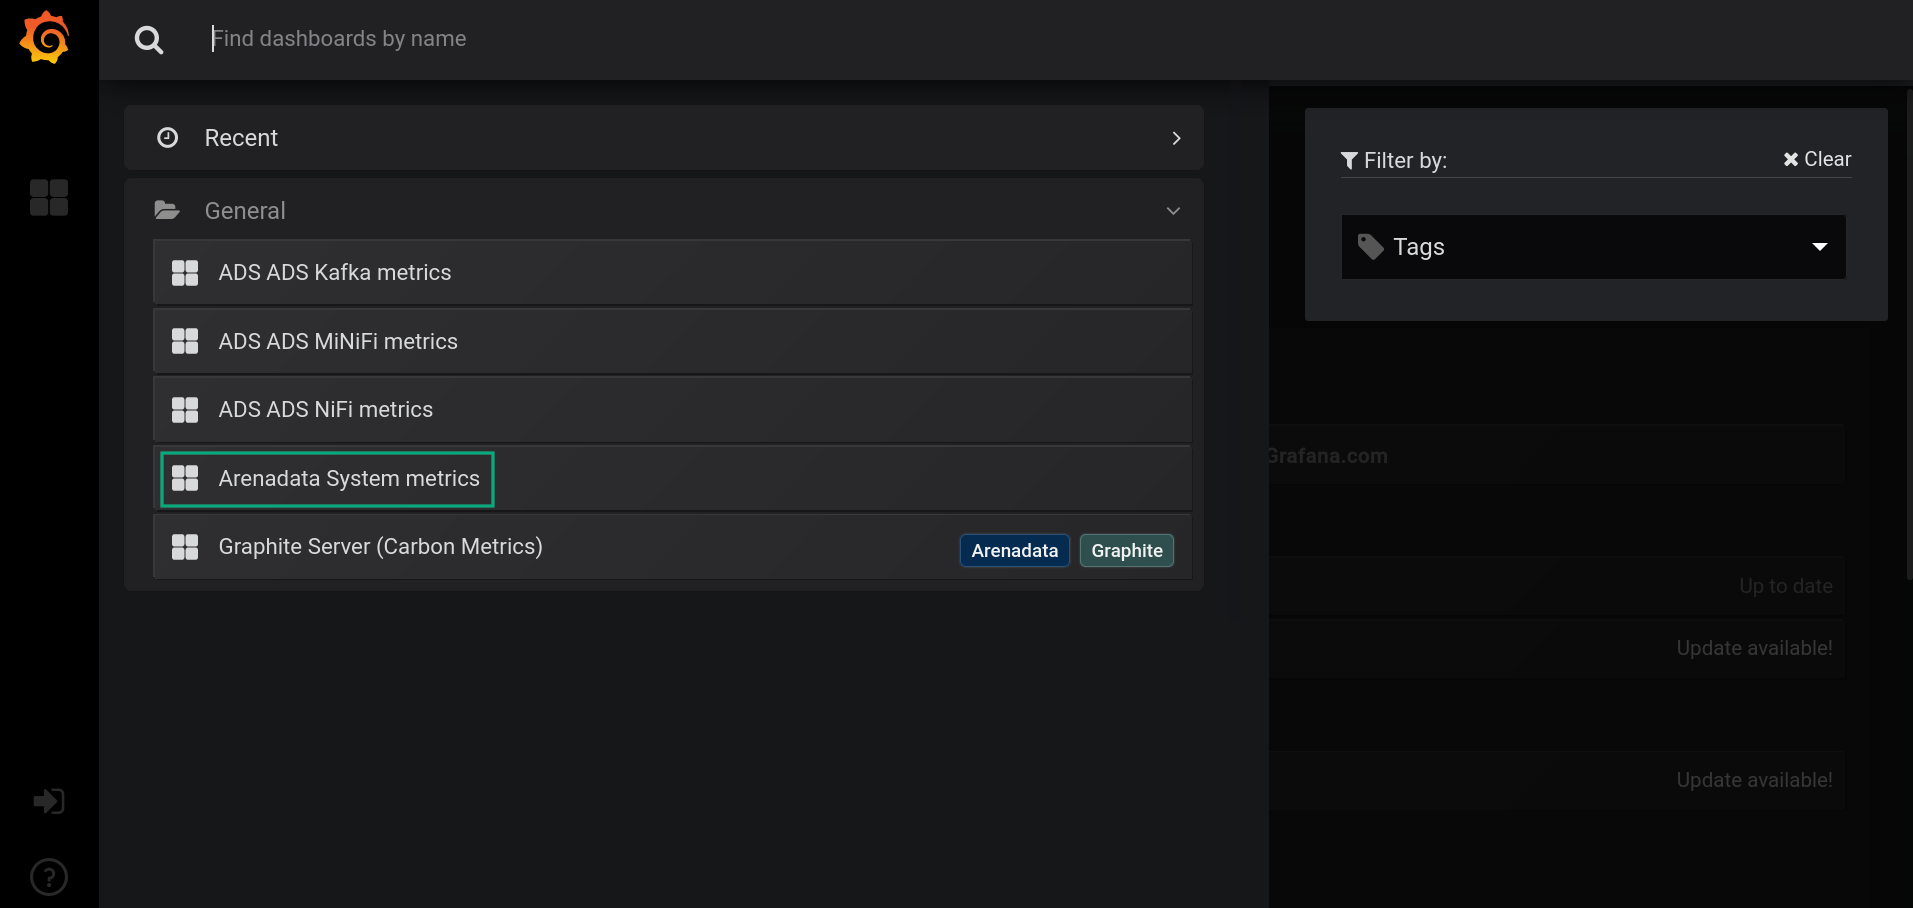
Grafana allows you to query data and visualize metrics stored in Graphite. To open the Grafana web interface, enter the host address of the monitoring cluster into the browser bar. If you don’t specify a port during сonfiguring services of the monitoring cluster, Grafana uses port 3000. Example: http://10.92.16.223:3000. If you specified Port when configuring Grafana, specify the port number separated by a colon. Example: http://10.92.16.223:8081.
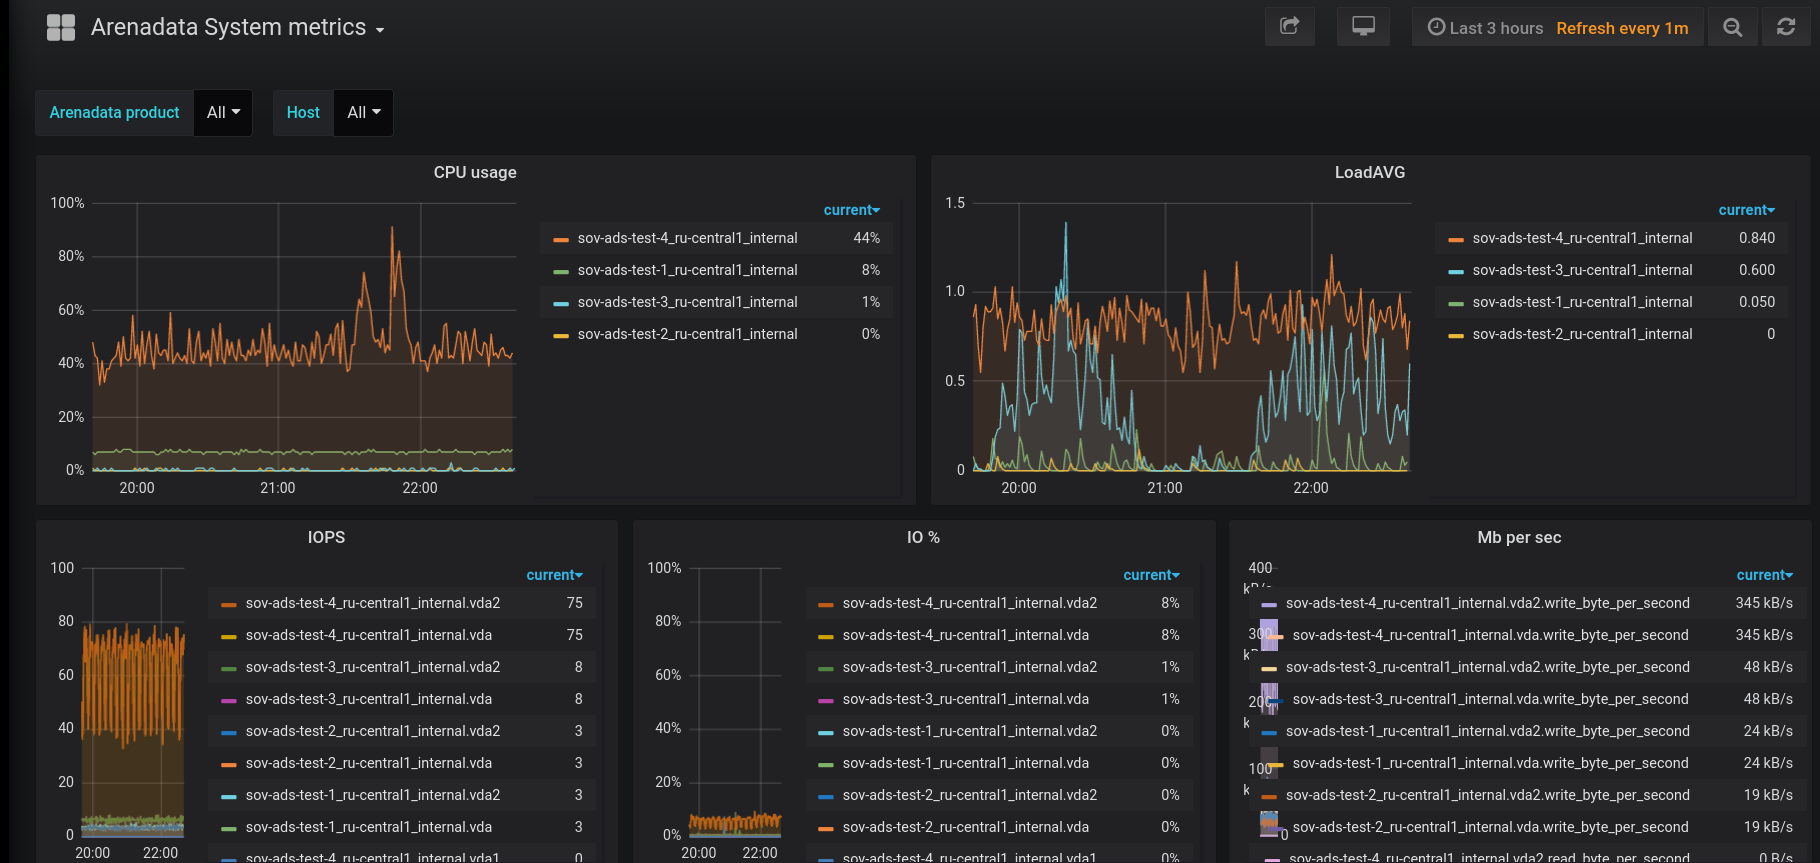
In the form that opens, click on the Home menu item. Select one of the monitoring dashboards to view the metrics.
A chart form will open.