Monitoring cluster based on VictoriaMetrics
Overview
Monitoring based on VictoriaMetrics is available in ADS only for the Enterprise version starting from 4.0.0.b1.
To configure monitoring, use:
VMAgent collects metrics from the ADS cluster and sends them to the ADM cluster. If the Grafana service is used in ADM, dashboards with service and ADS host metrics are available in the Grafana web interface.
The steps for installing the VMAgent component and setting up monitoring are described below.
|
NOTE
The installation description provided in the article is relevant for clusters where the Monitoring service has not been previously installed. If the Monitoring service is already installed — follow these steps:
|
Step 1. Install ADM
Install the ADM cluster (see the Installation guide), which is used as the base for import of the VictoriaMetrics server configuration.
The ADM cluster can be installed before or after the ADS cluster, but should be installed before installing the VMAgent component of the Monitoring service.
Step 2. Add the Monitoring service
-
In the ADCM interface, open the Clusters page and click your ADS cluster name. On the cluster page that opens, switch to the Services tab and click Add services.
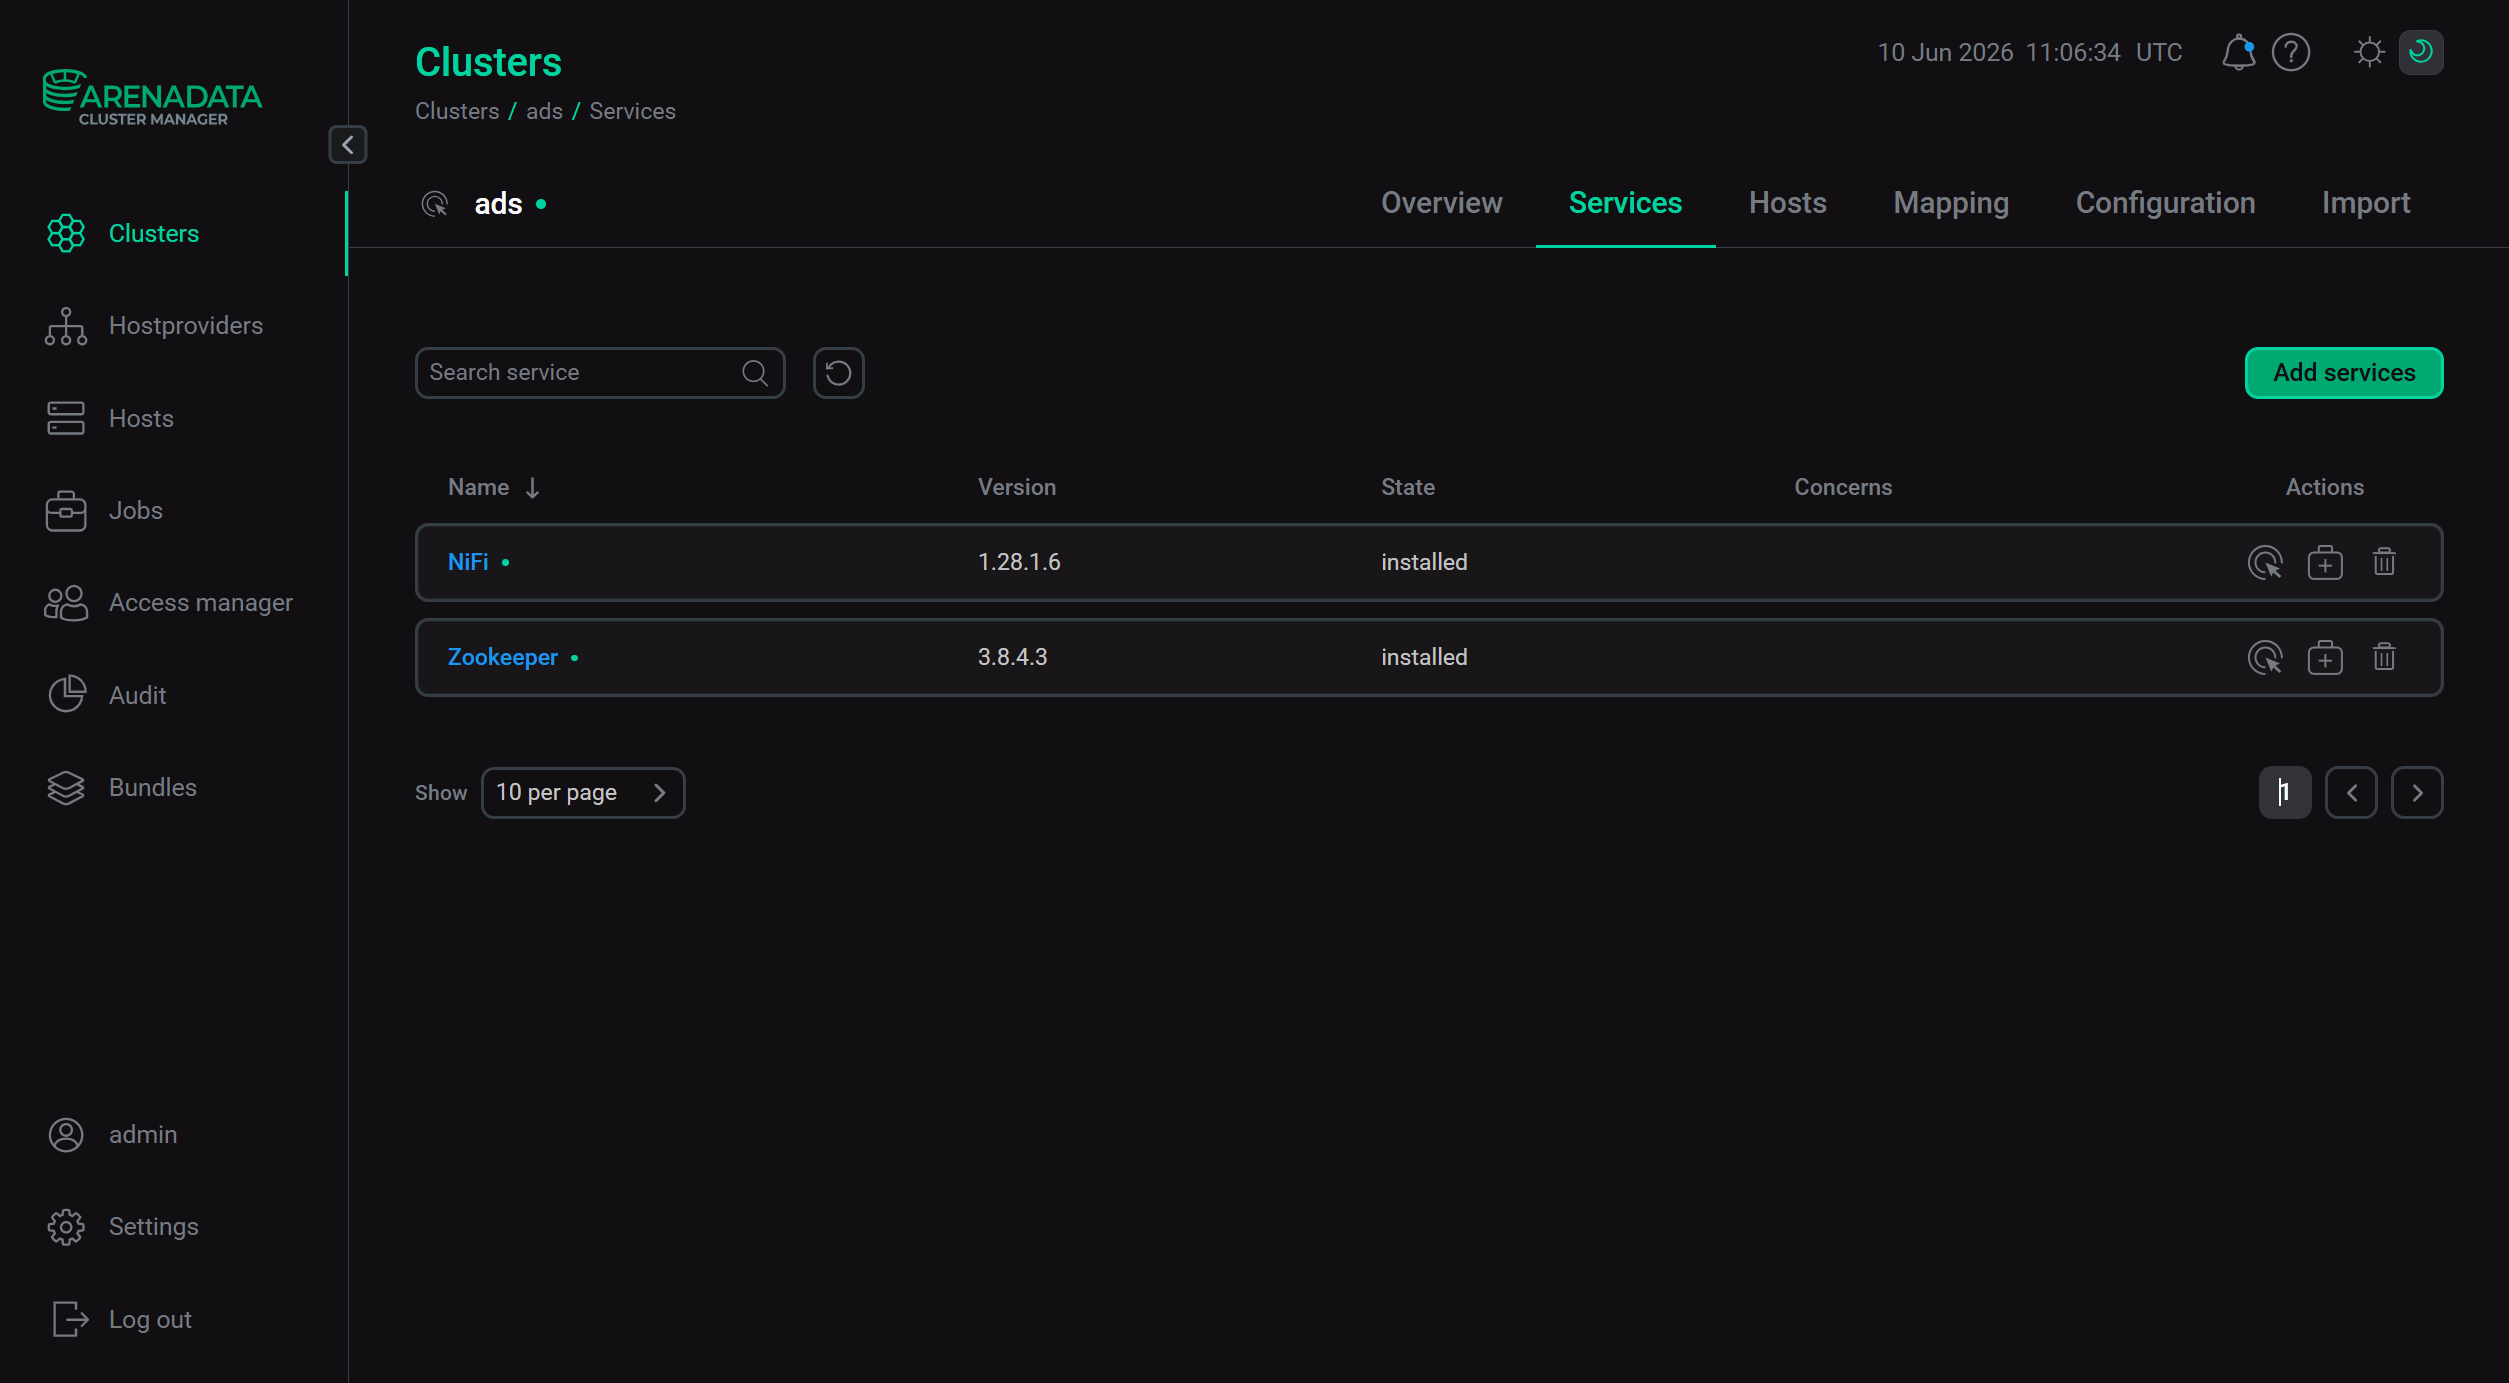 Switch to adding services
 -
In the opened window, select the Monitoring service and click Add.
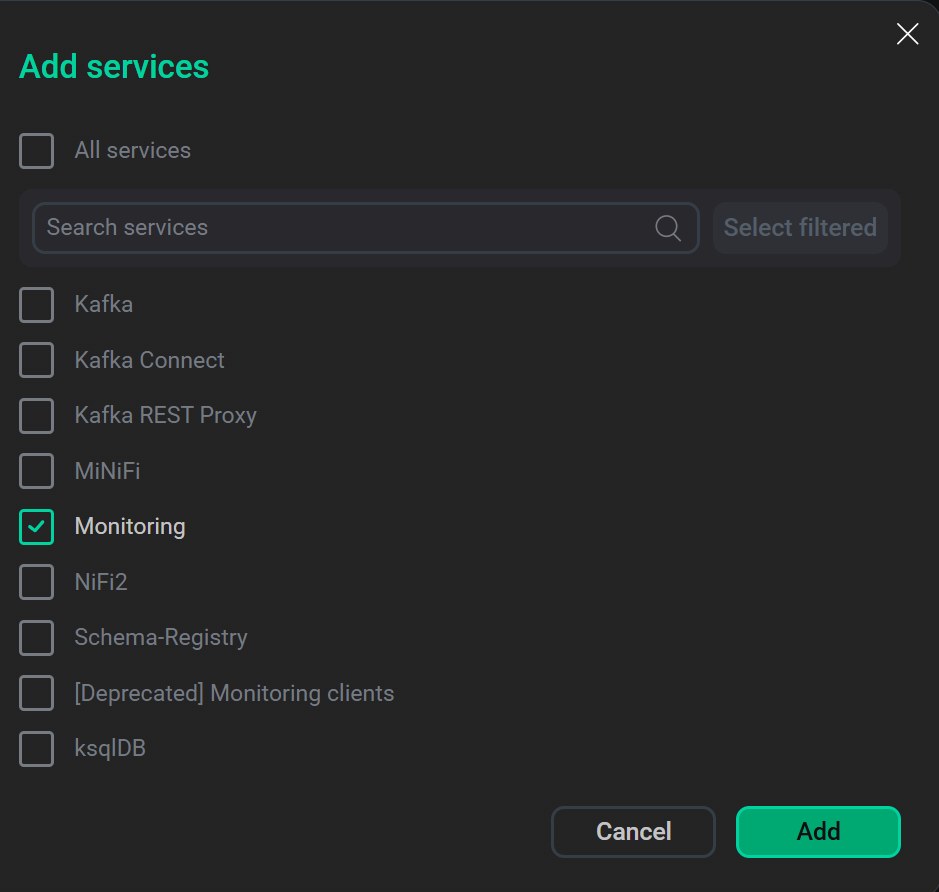 Select the service
As a result, the added service is displayed on the Services tab.
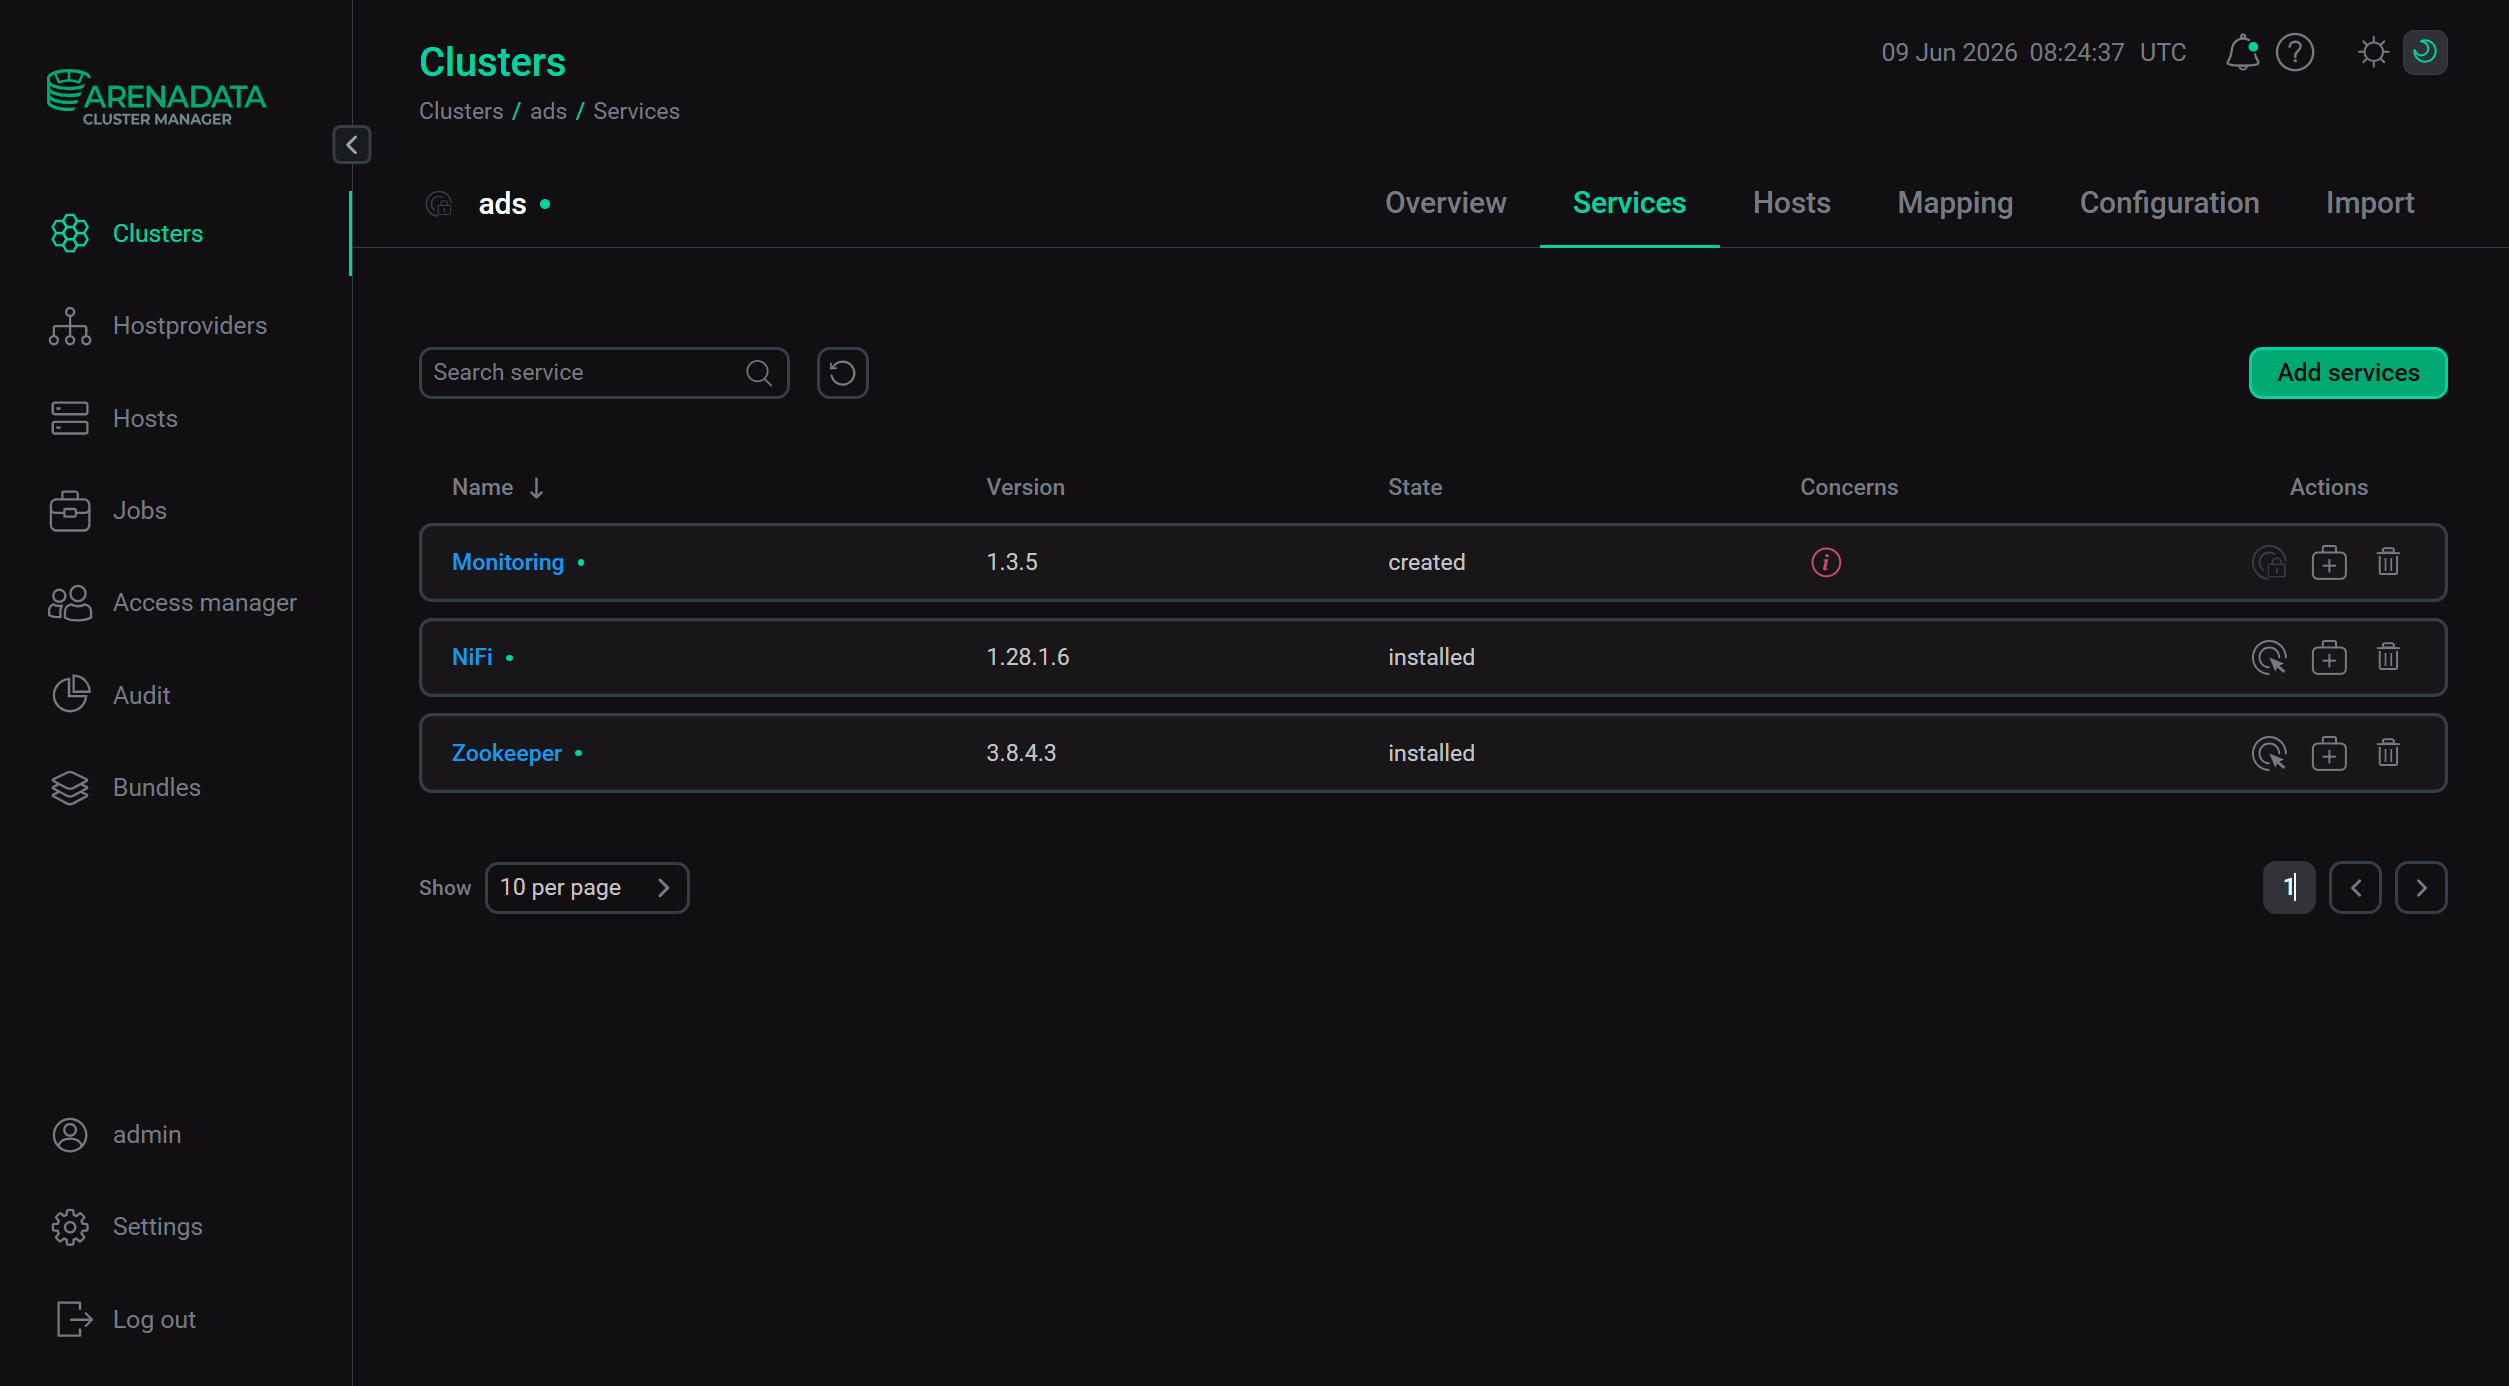 Result of successfully adding the service to the cluster
Step 3. Add the VMAgent component
-
On the cluster page, open the Mapping tab to proceed to mapping instances of the VMAgent component to cluster hosts.
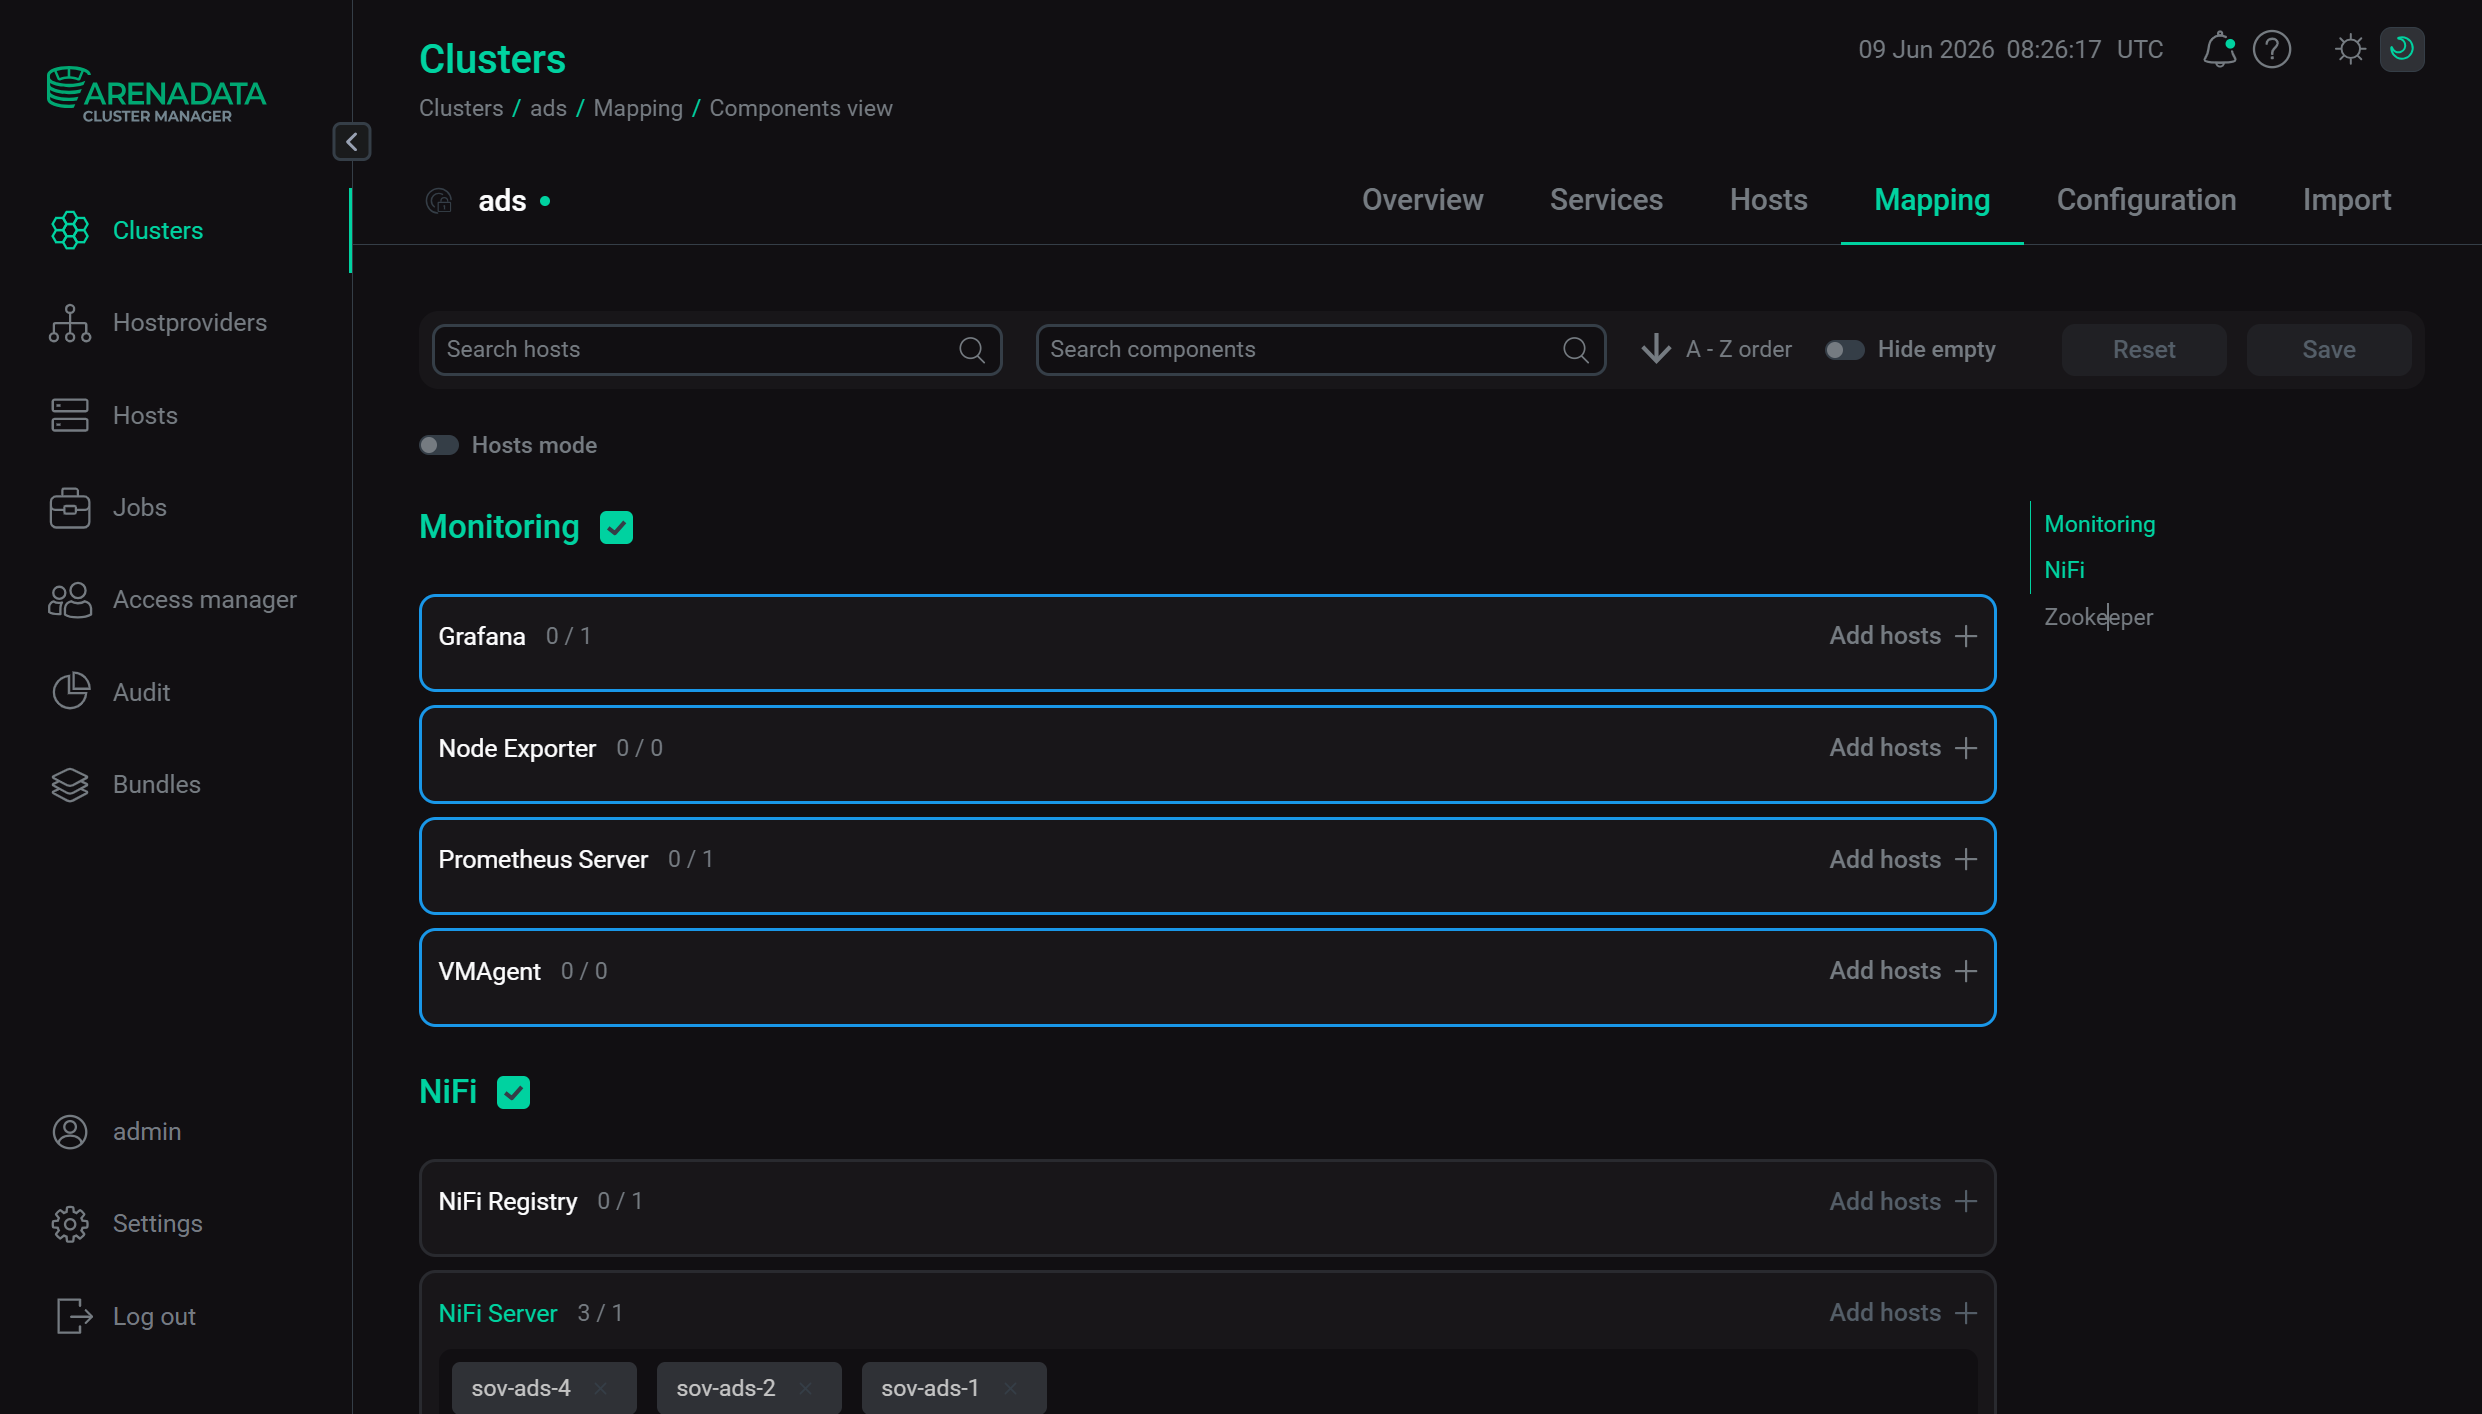 Switch to mapping service components
 -
Assign a host to the VMAgent component of the Monitoring service — click Add hosts and select the desired host in the pop-up window.
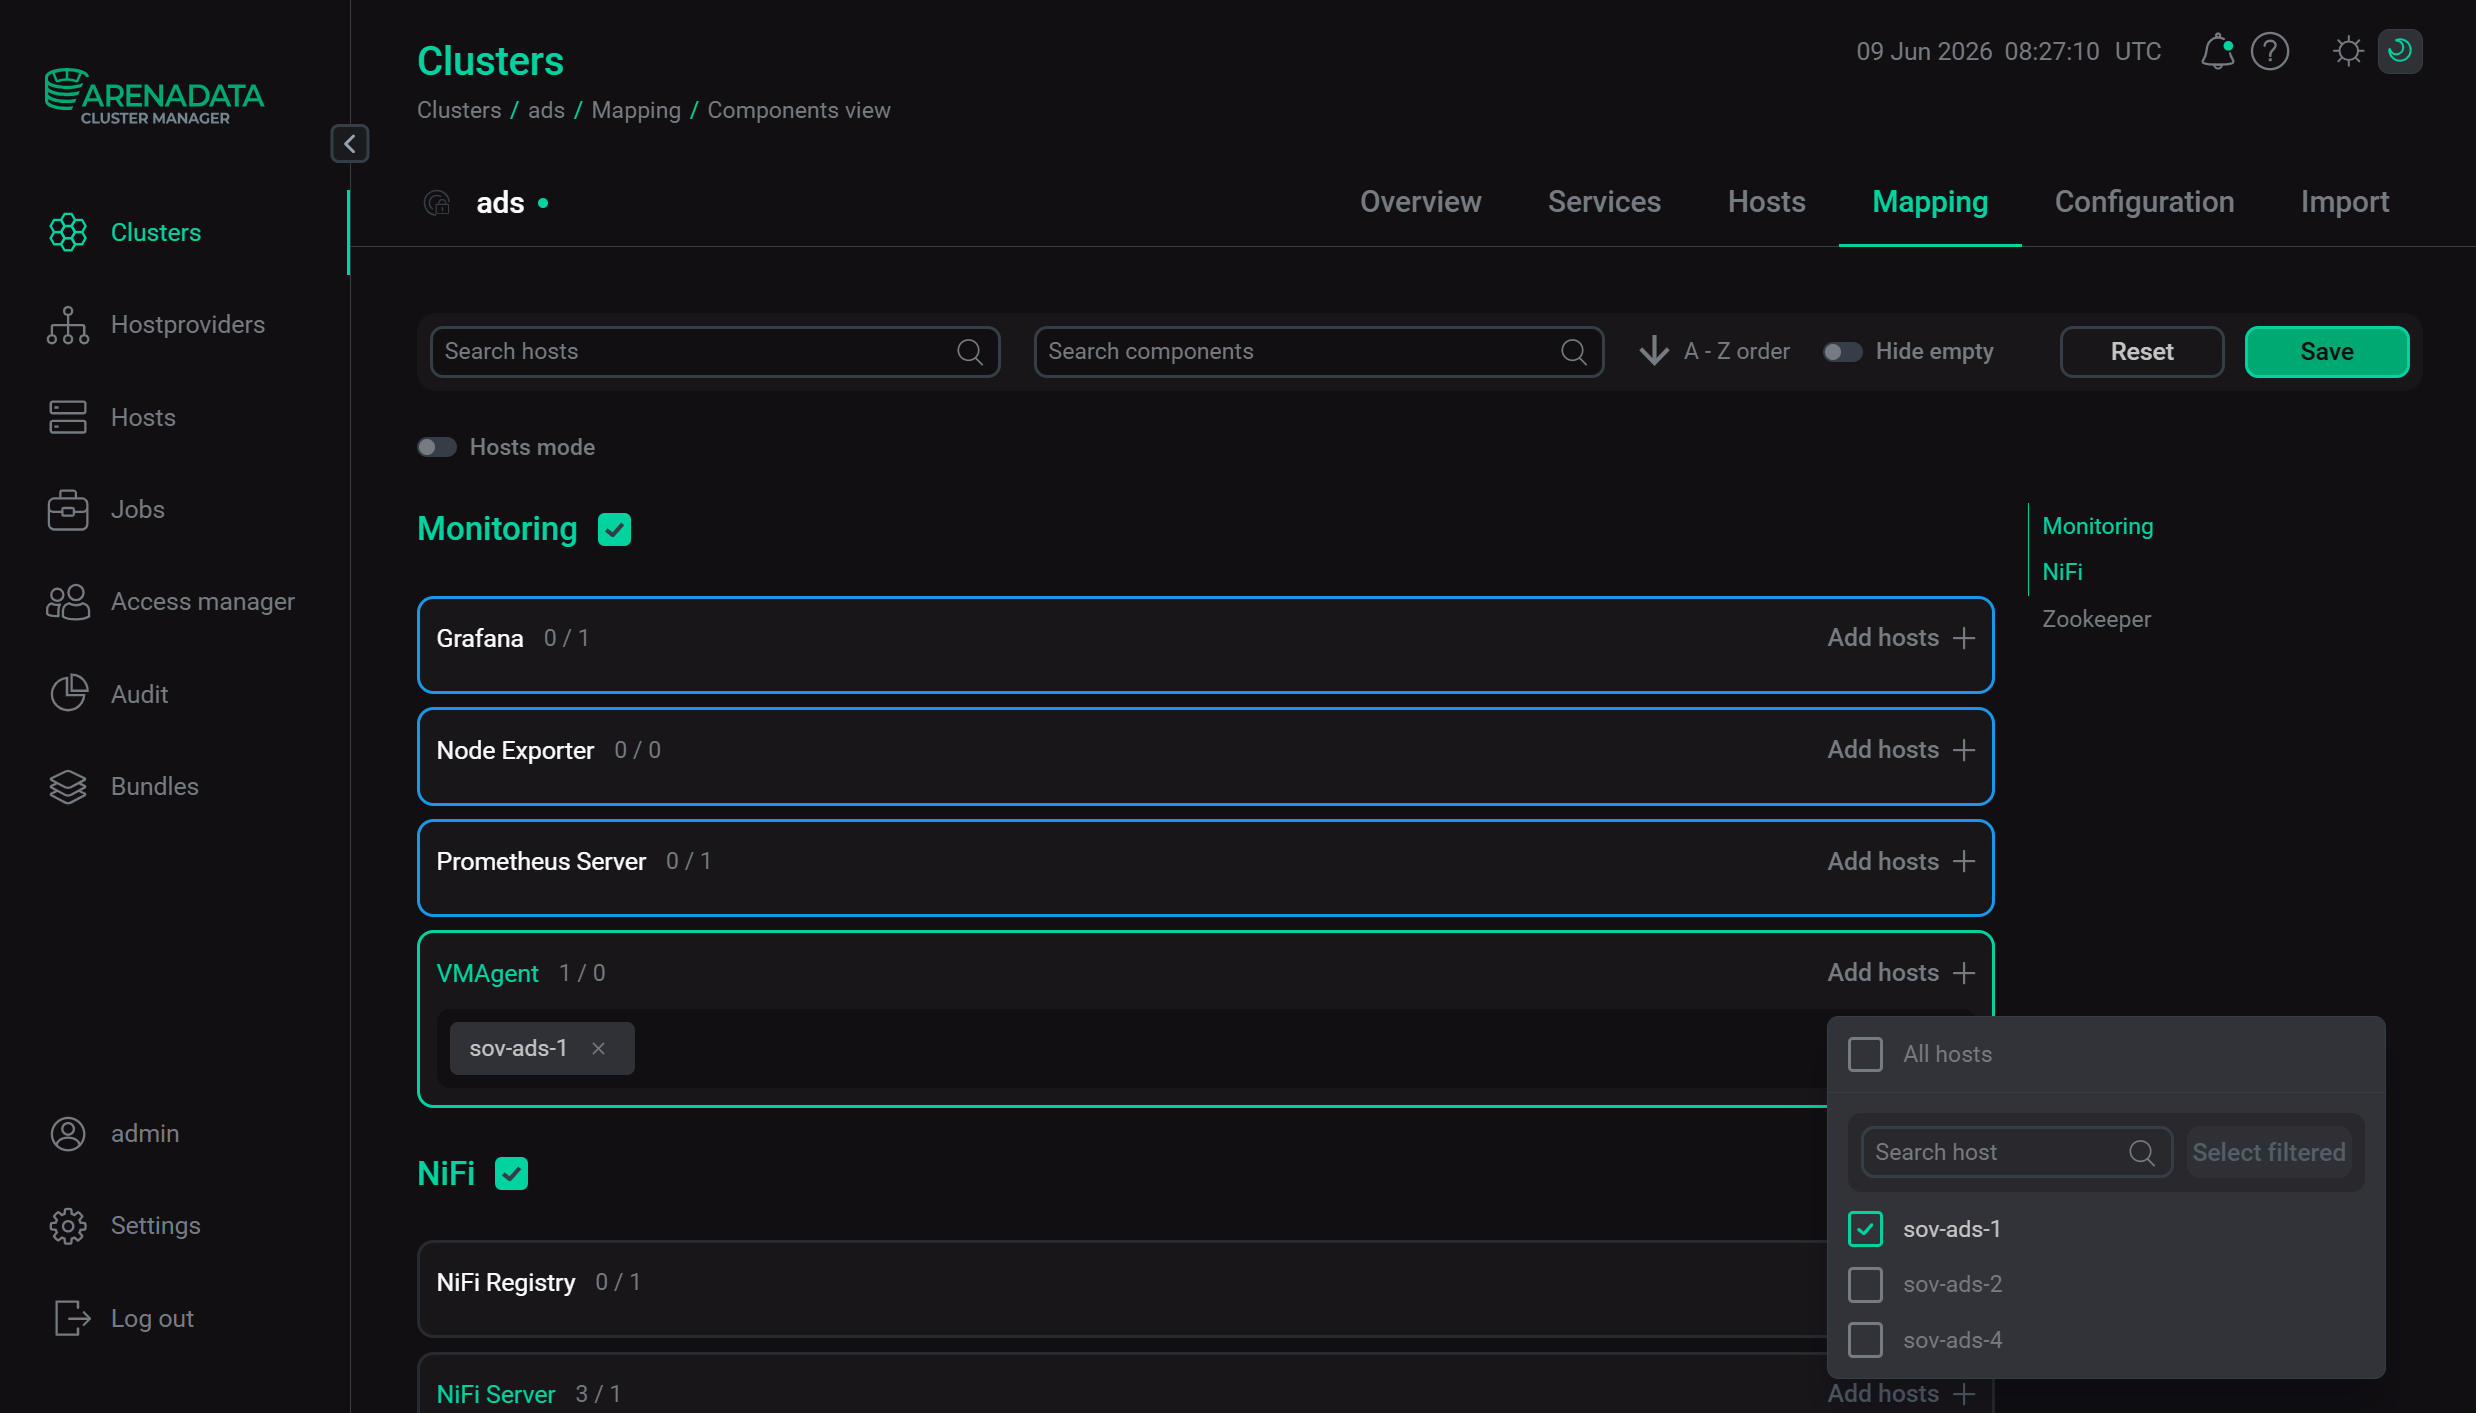 Select a host for a component
 -
After the distribution of components is completed, click Save.
Step 4. Configure VMAgent
-
Open the Services tab on the cluster page and click the Monitoring service name in the Name column.
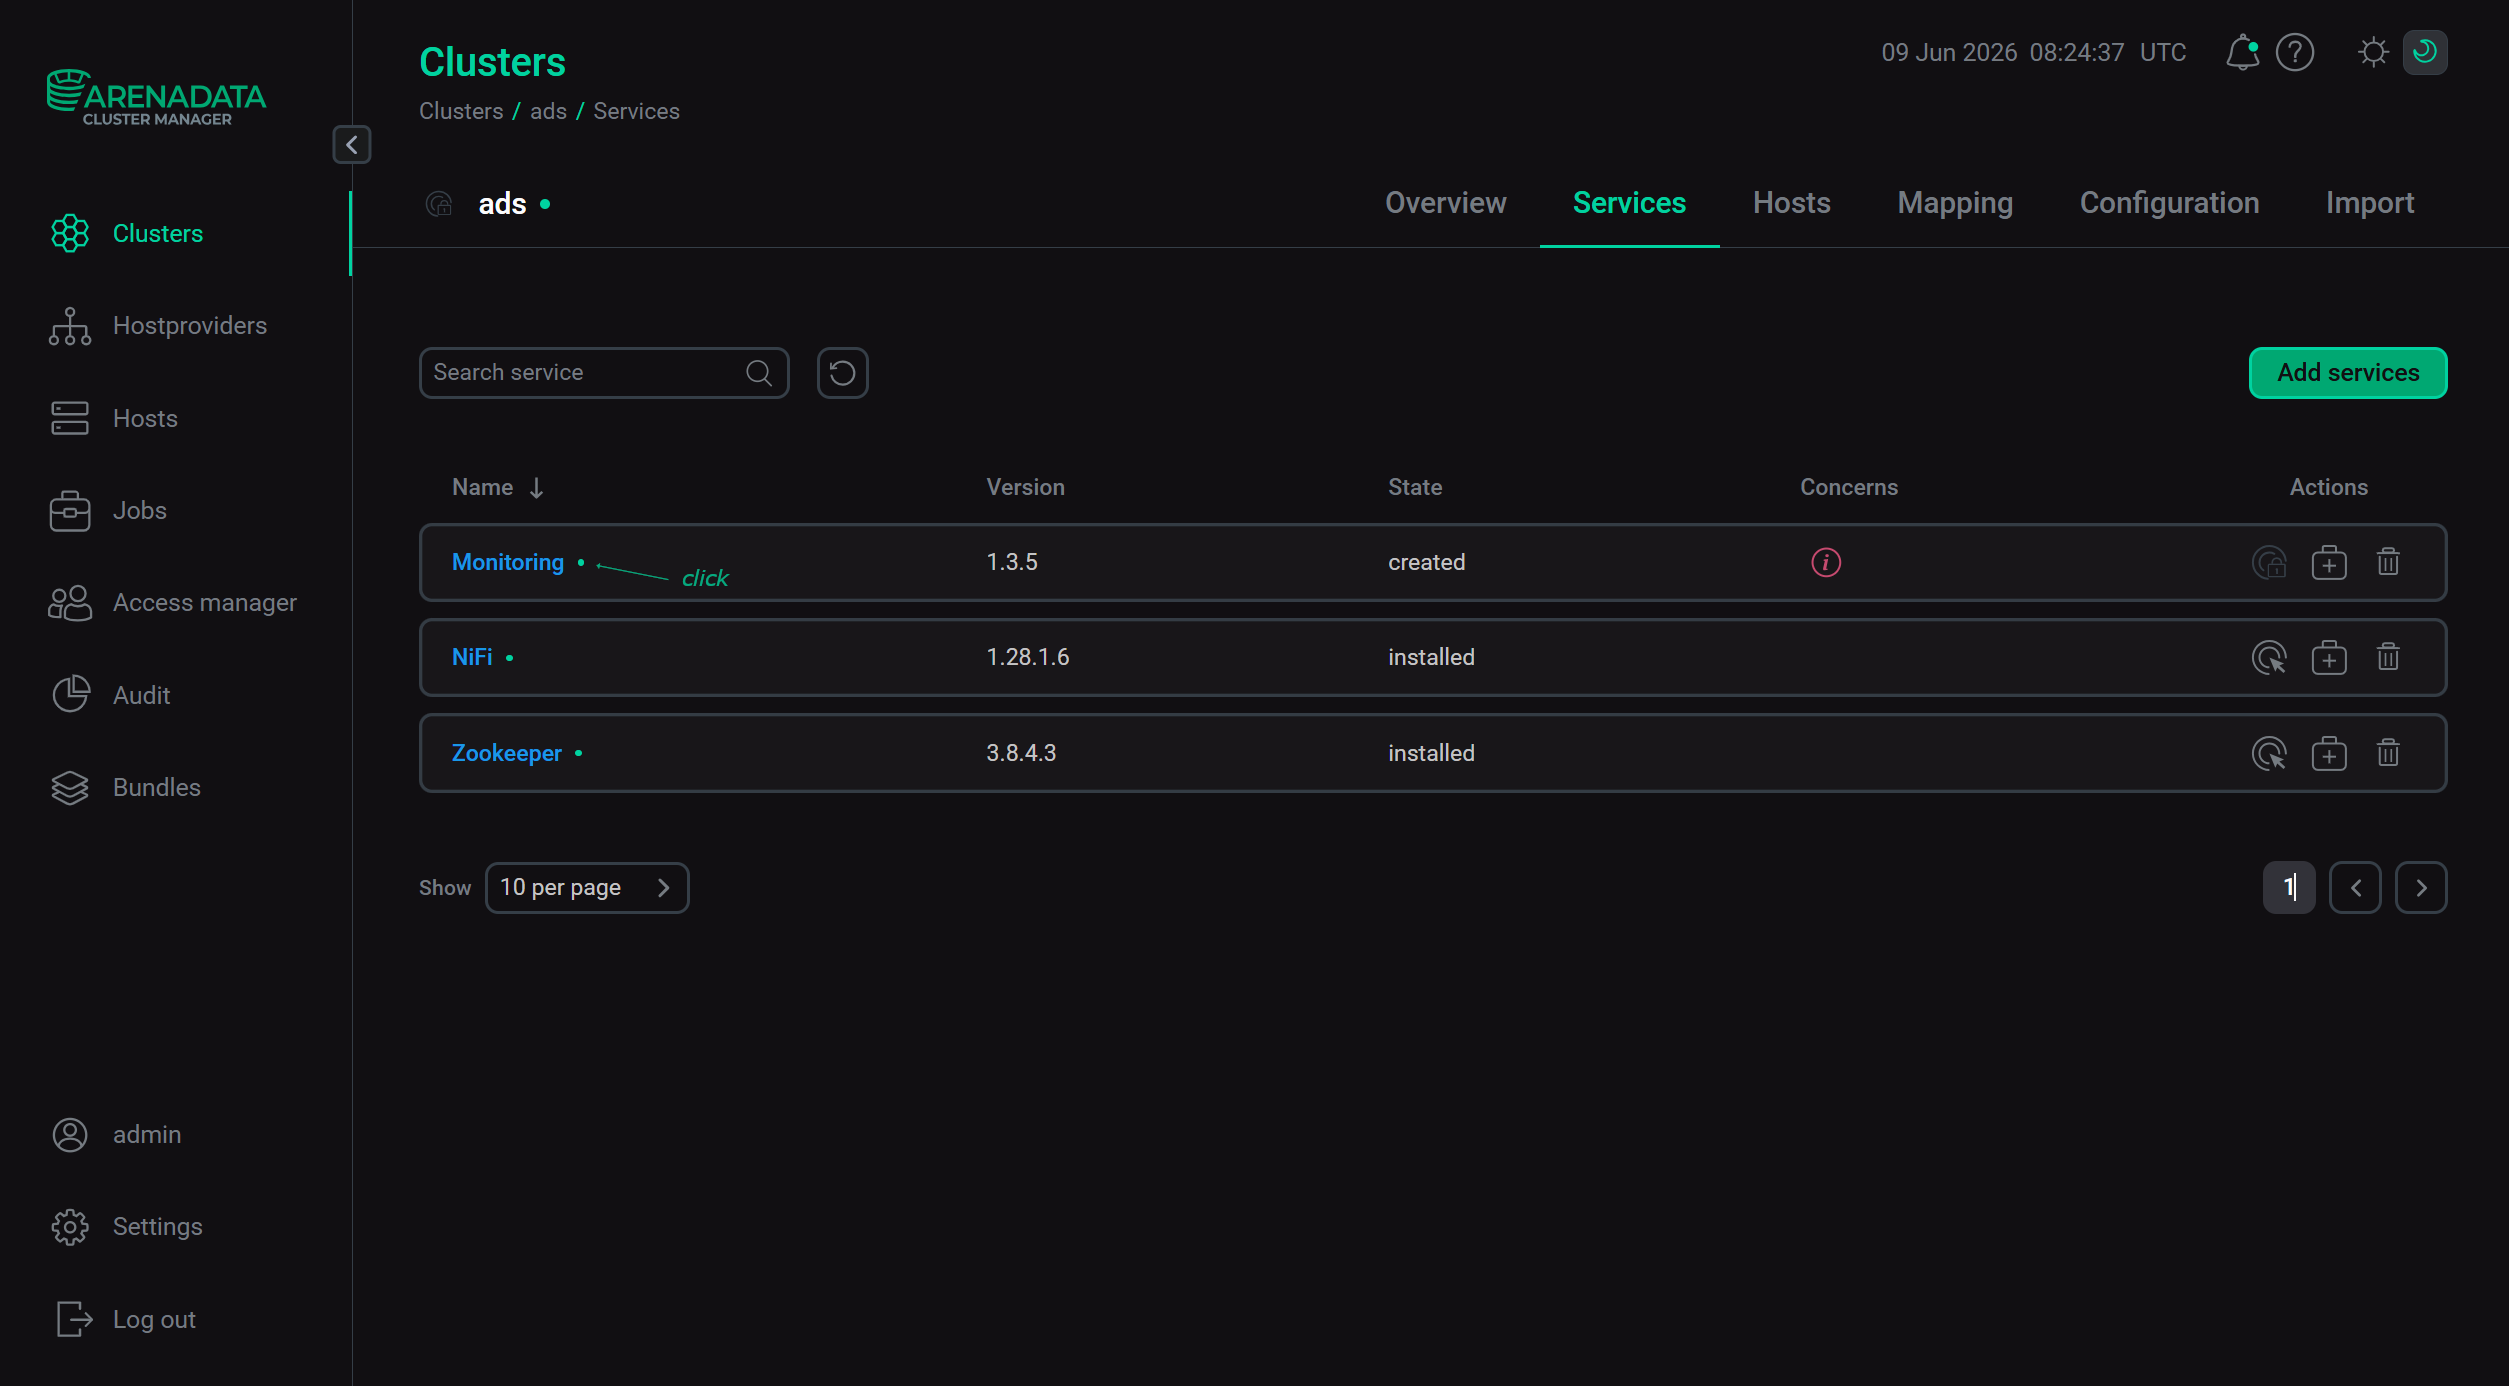 Switch to the service configuration
 -
On the page that opens, fill in or change the parameter values in the VMAgent group of the service configuration parameters as needed — descriptions of the parameters are provided in the Monitoring configuration parameters article. Also, fill in the fields highlighted in red, as they are mandatory, even if the components associated with these parameters are not added to the service (Prometheus Server, Grafana).
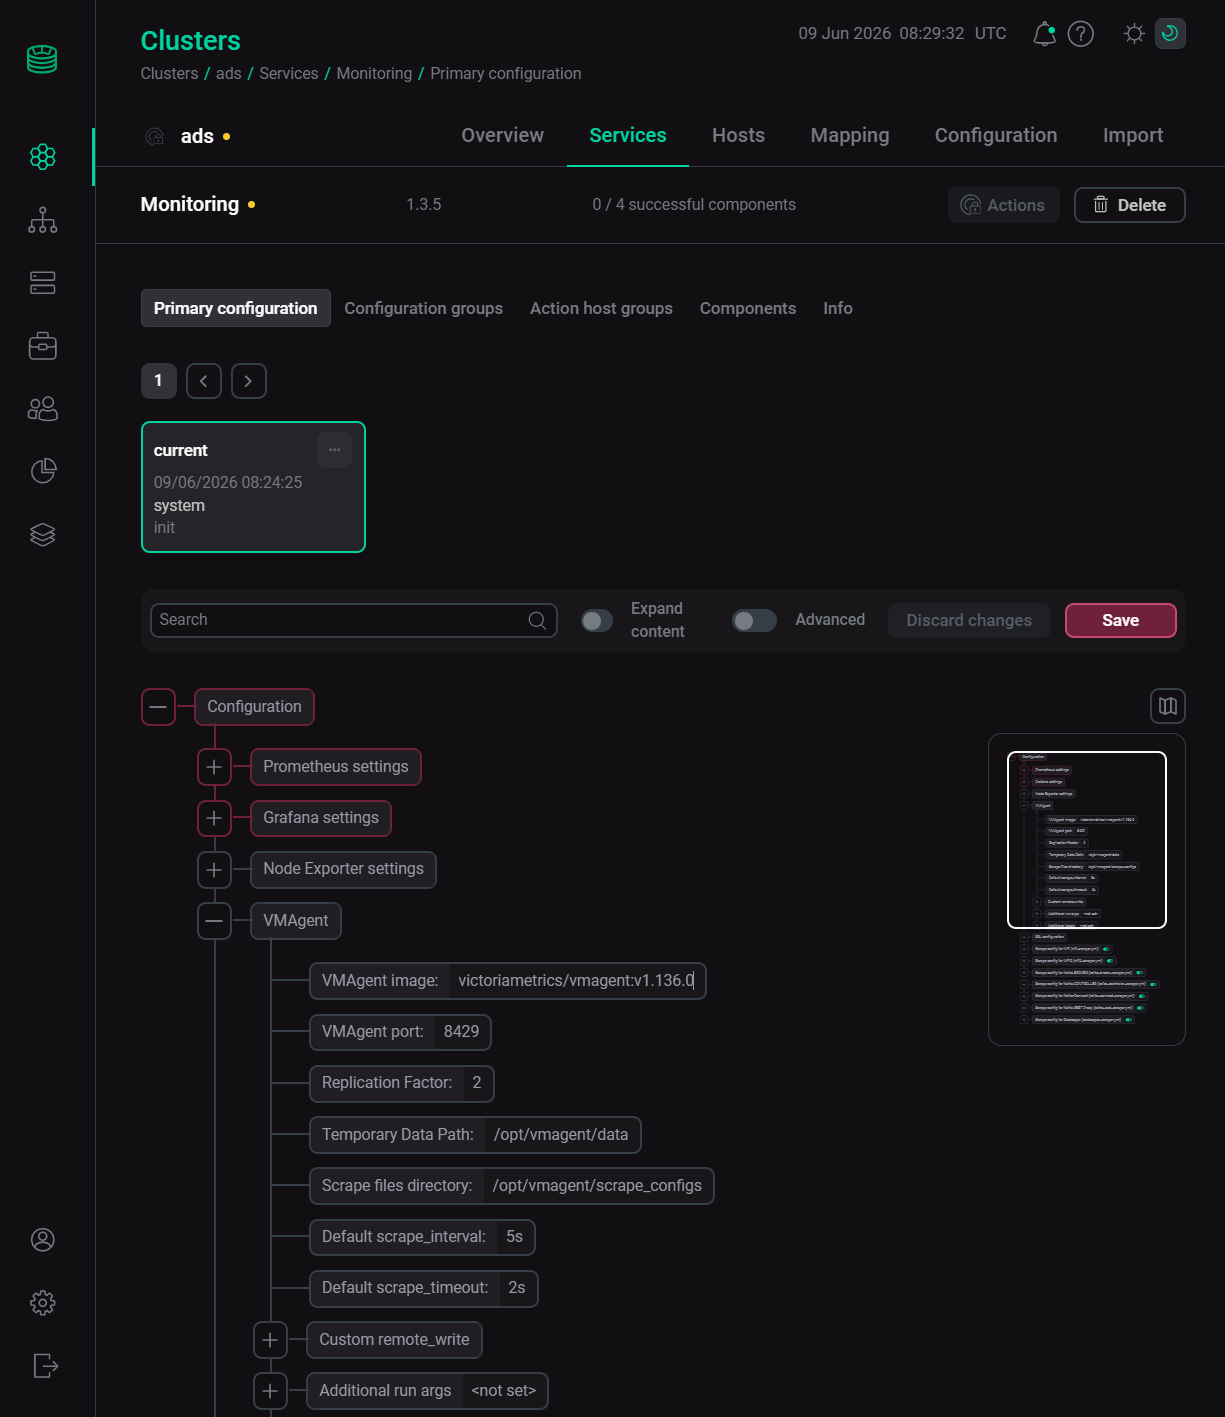 Configure the Monitoring service
After specifying all necessary parameters, click Save.
Step 5. Import
Import ADM configuration
-
Open the Import tab on the ADS cluster page.
-
Check the Cluster configuration box in the row with the ADM cluster.
-
Click Import.
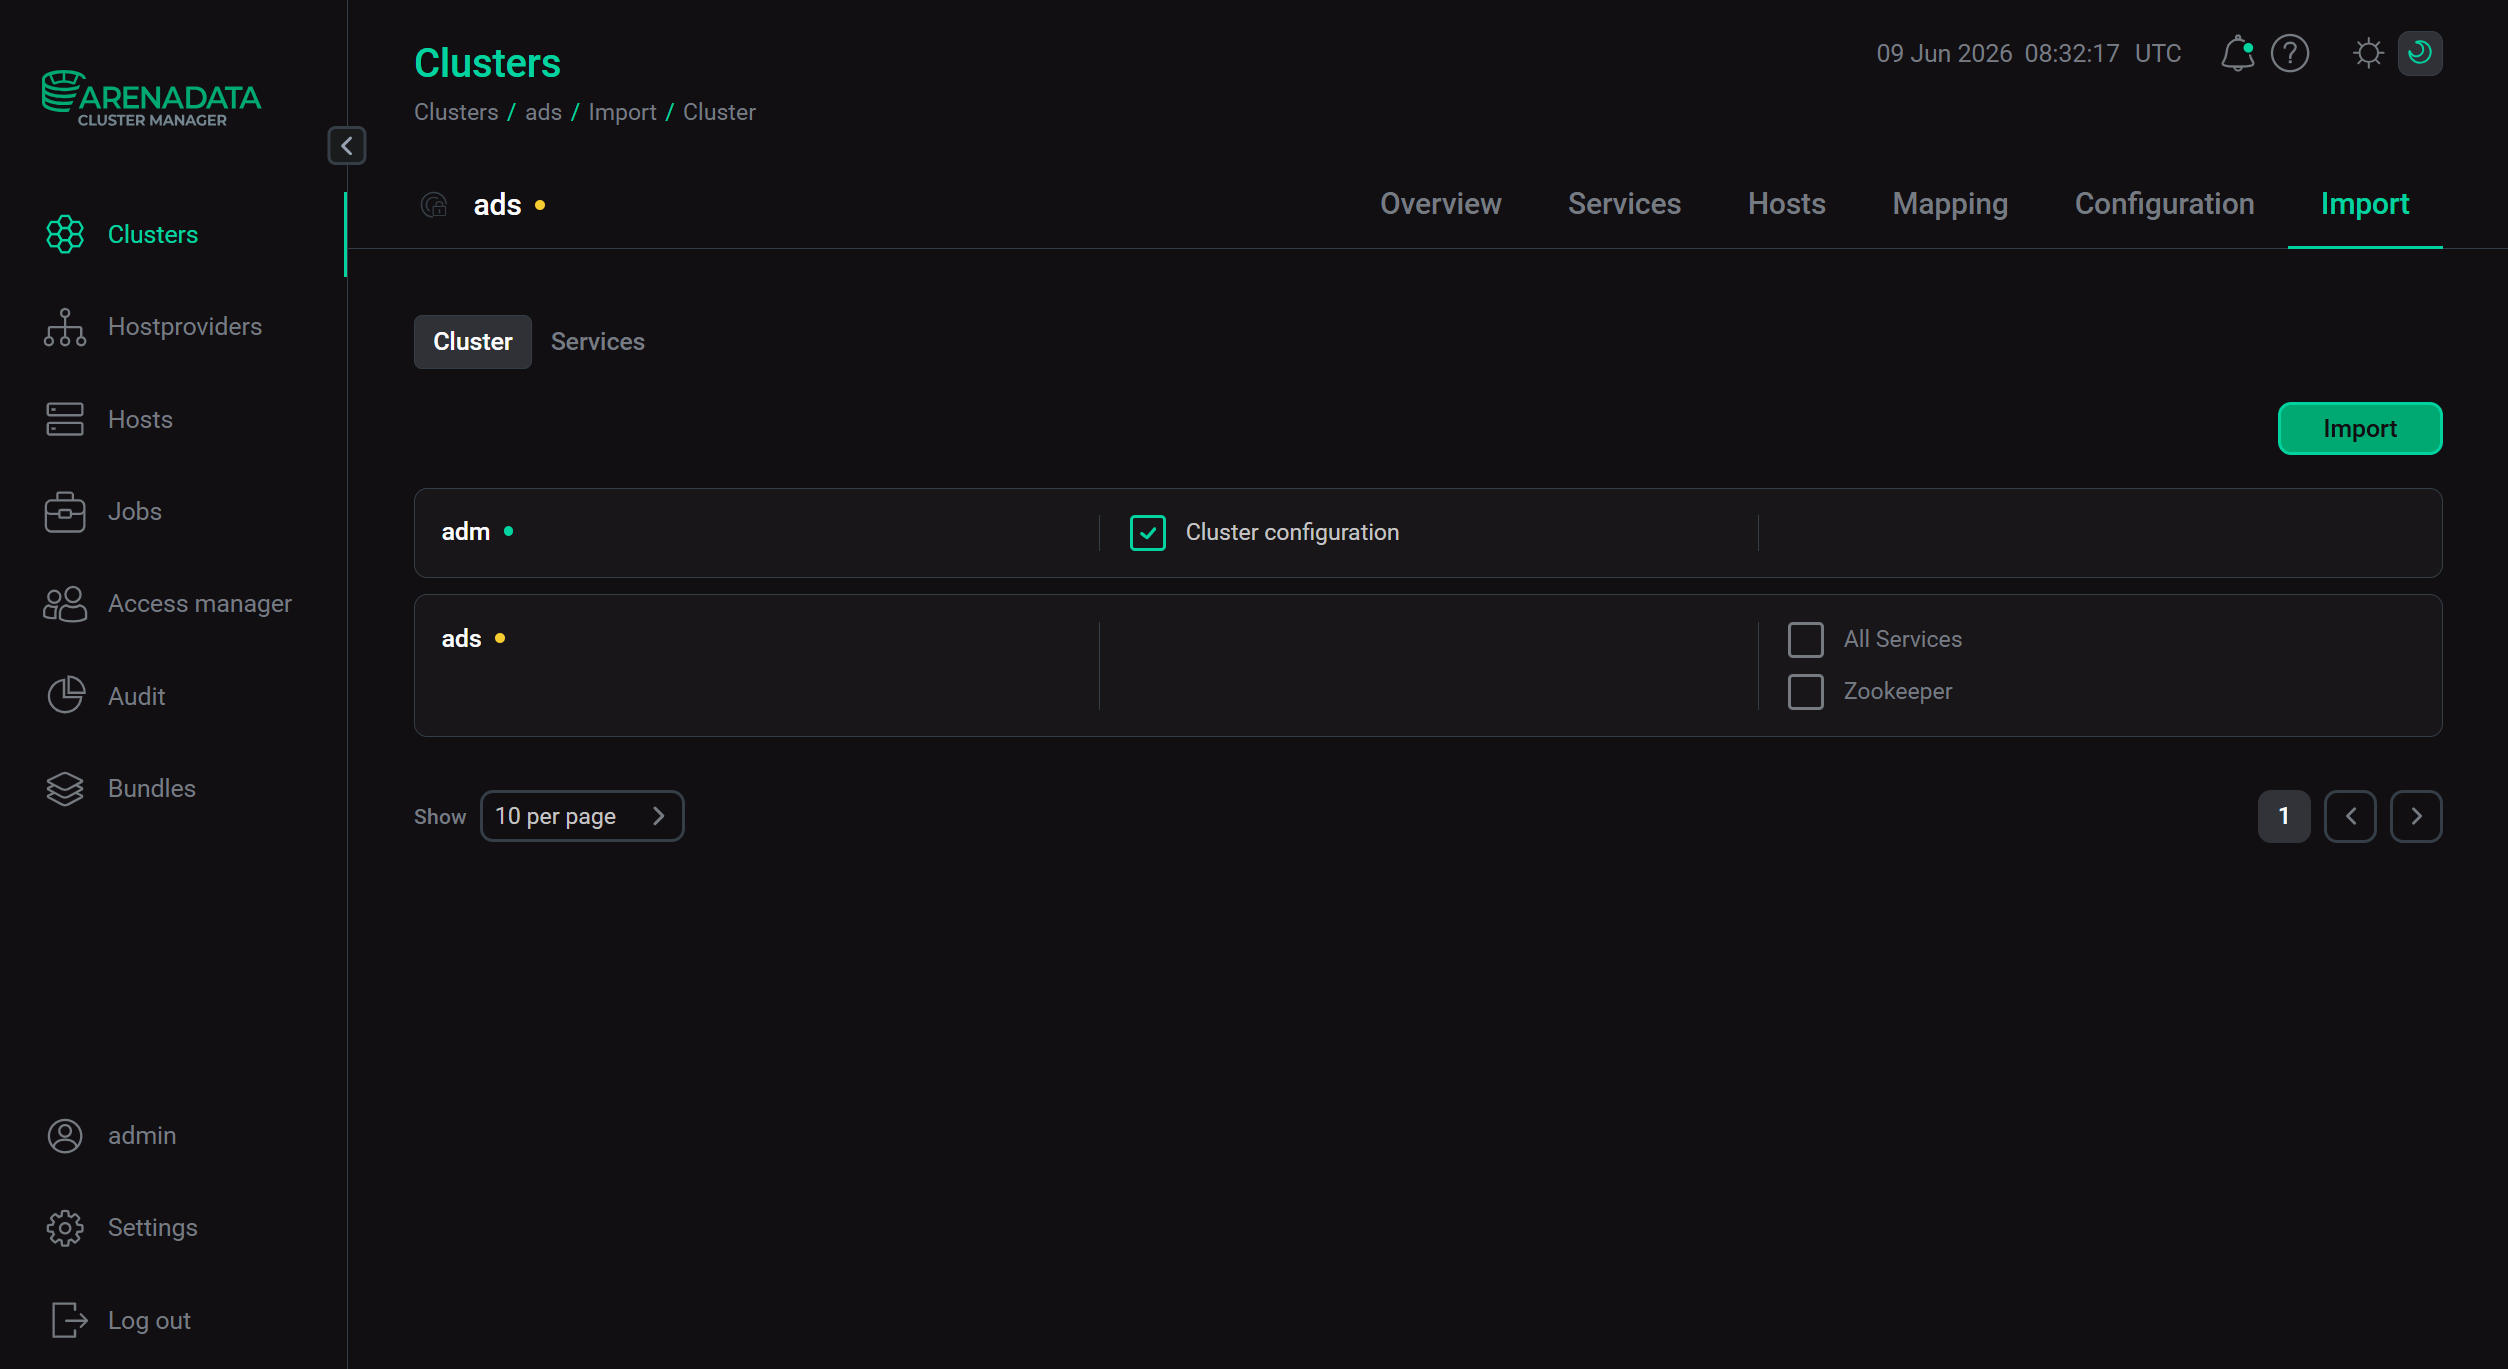
Import external VictoriaMetrics server configuration
When using an external VictoriaMetrics server, the server configuration must be imported into ADS.
To do this, go to the Monitoring service settings, as shown above, and in the VMAgent group for the Custom remote_write parameter, use the Add property field to set the value url: "http://<vm-central>:8428/api/v1/write", where <vm-central> is the IP address of the external VictoriaMetrics server.
Step 6. Install the Monitoring service
-
On the Services tab, click

 for the Monitoring service in the Actions column and run the Install action.
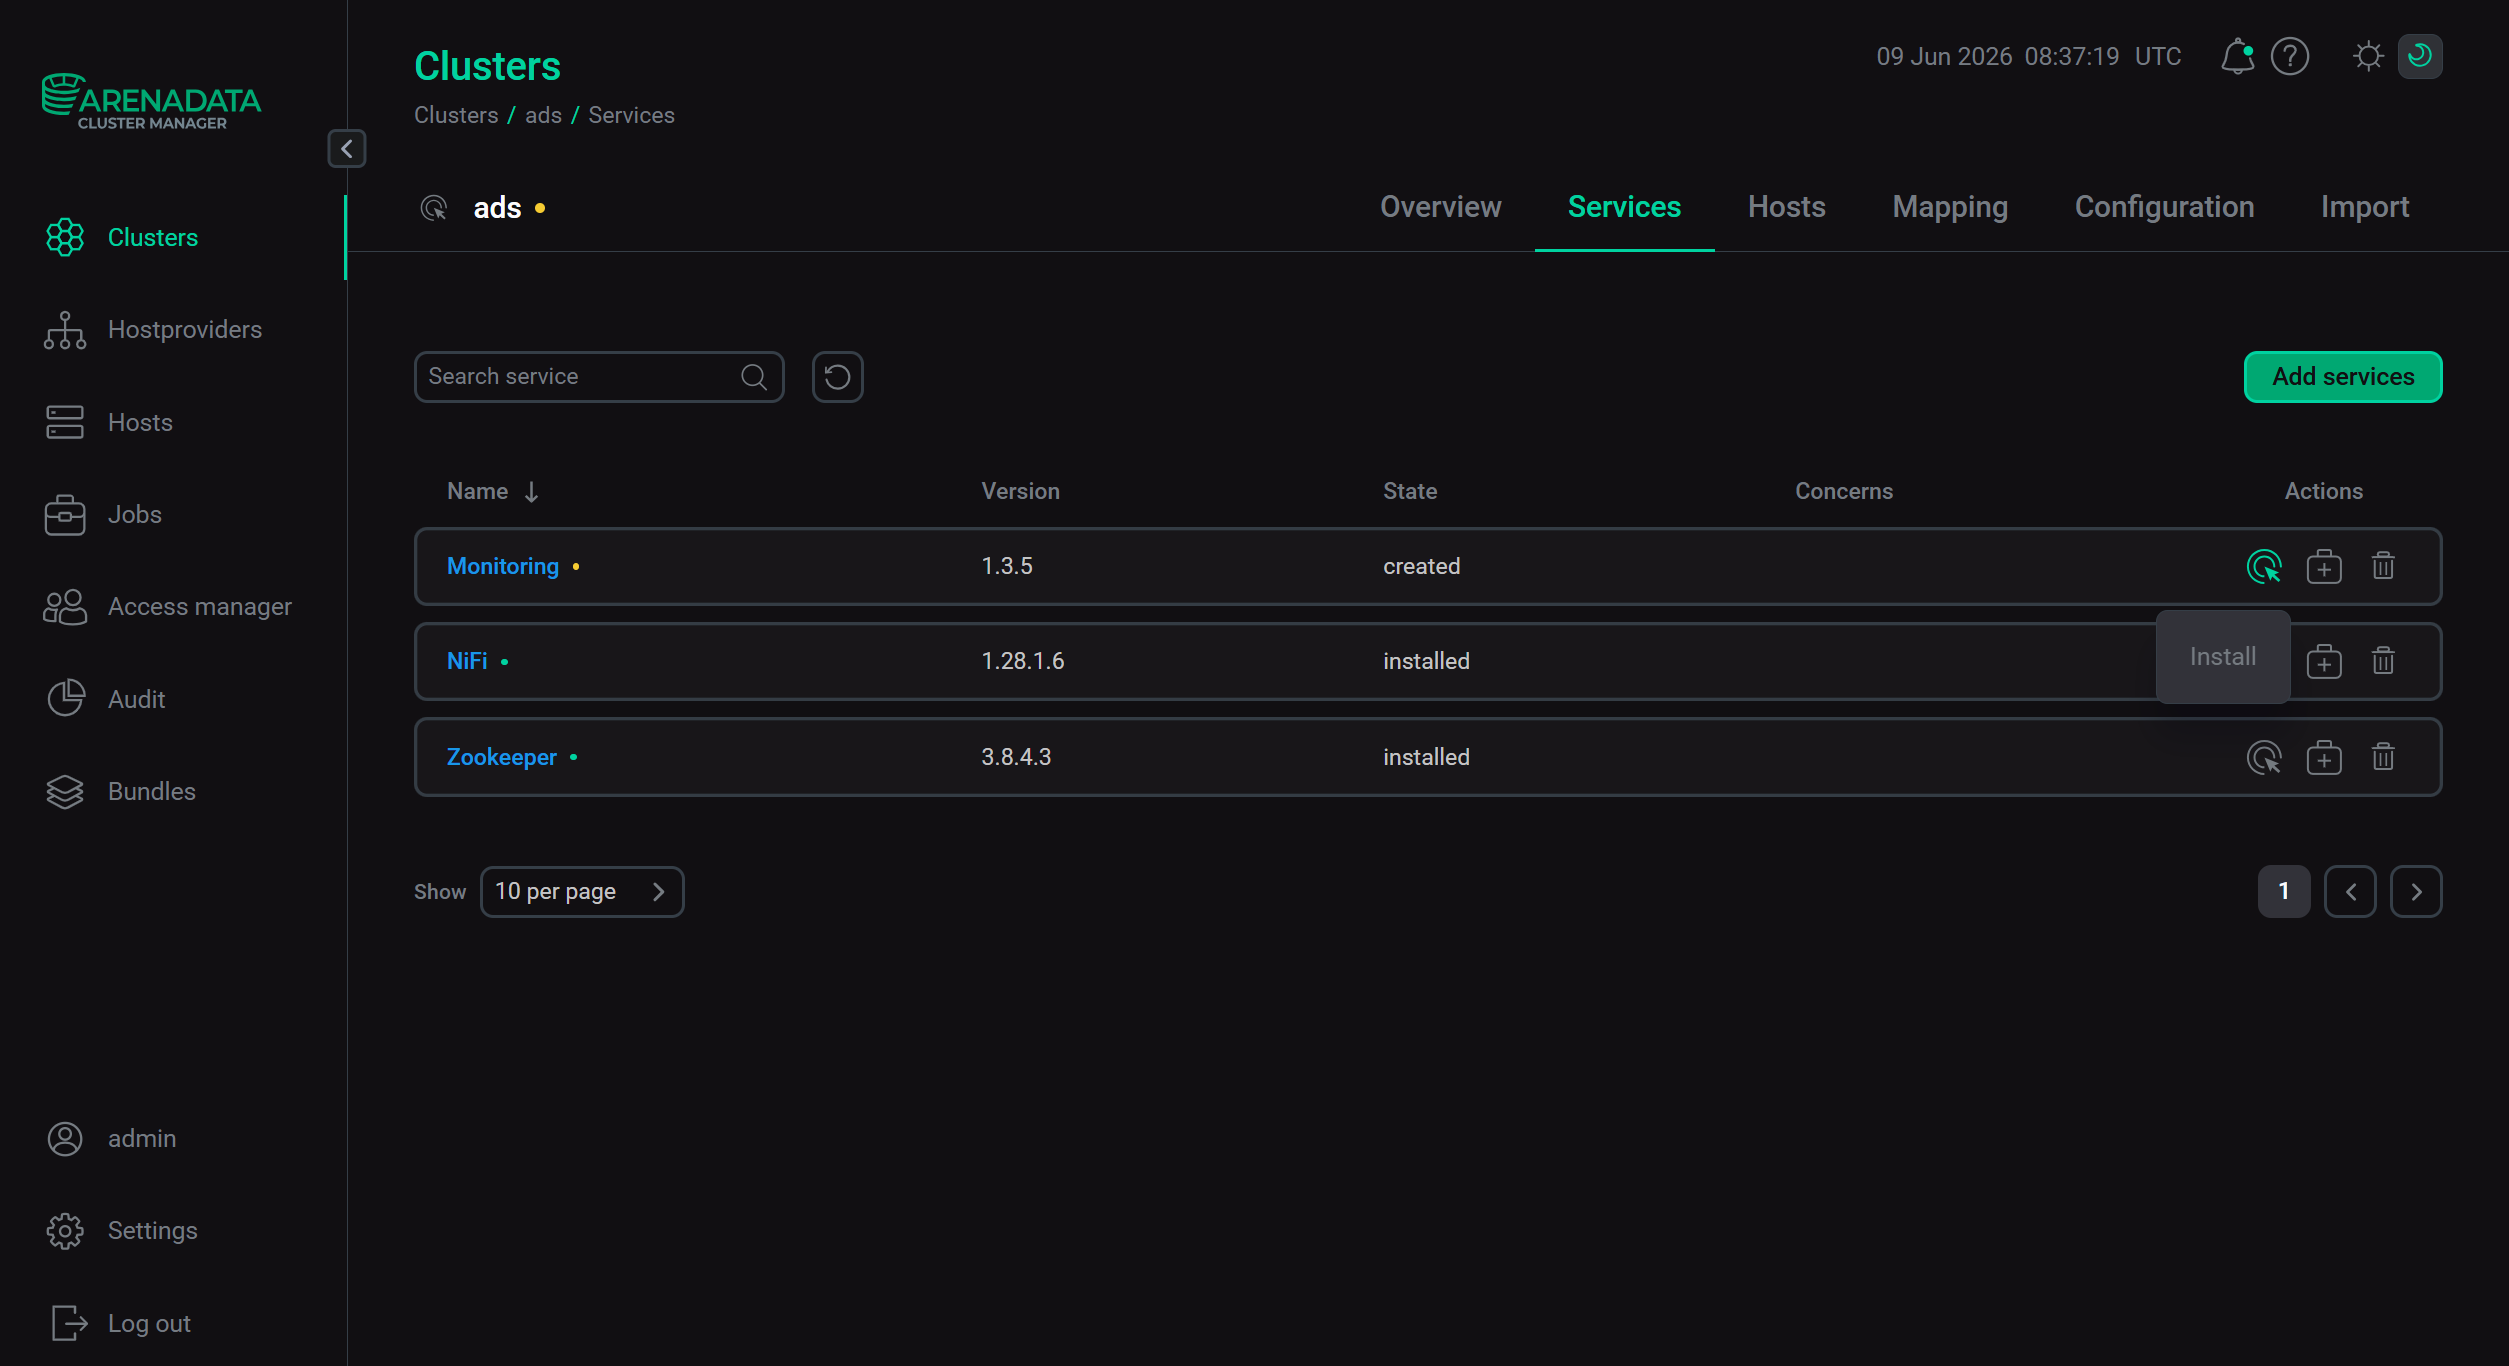 Switch to the service installation
 -
Confirm the action in the opened window.
-
Wait for the installation to complete and make sure the service status changes from
createdtoinstalled.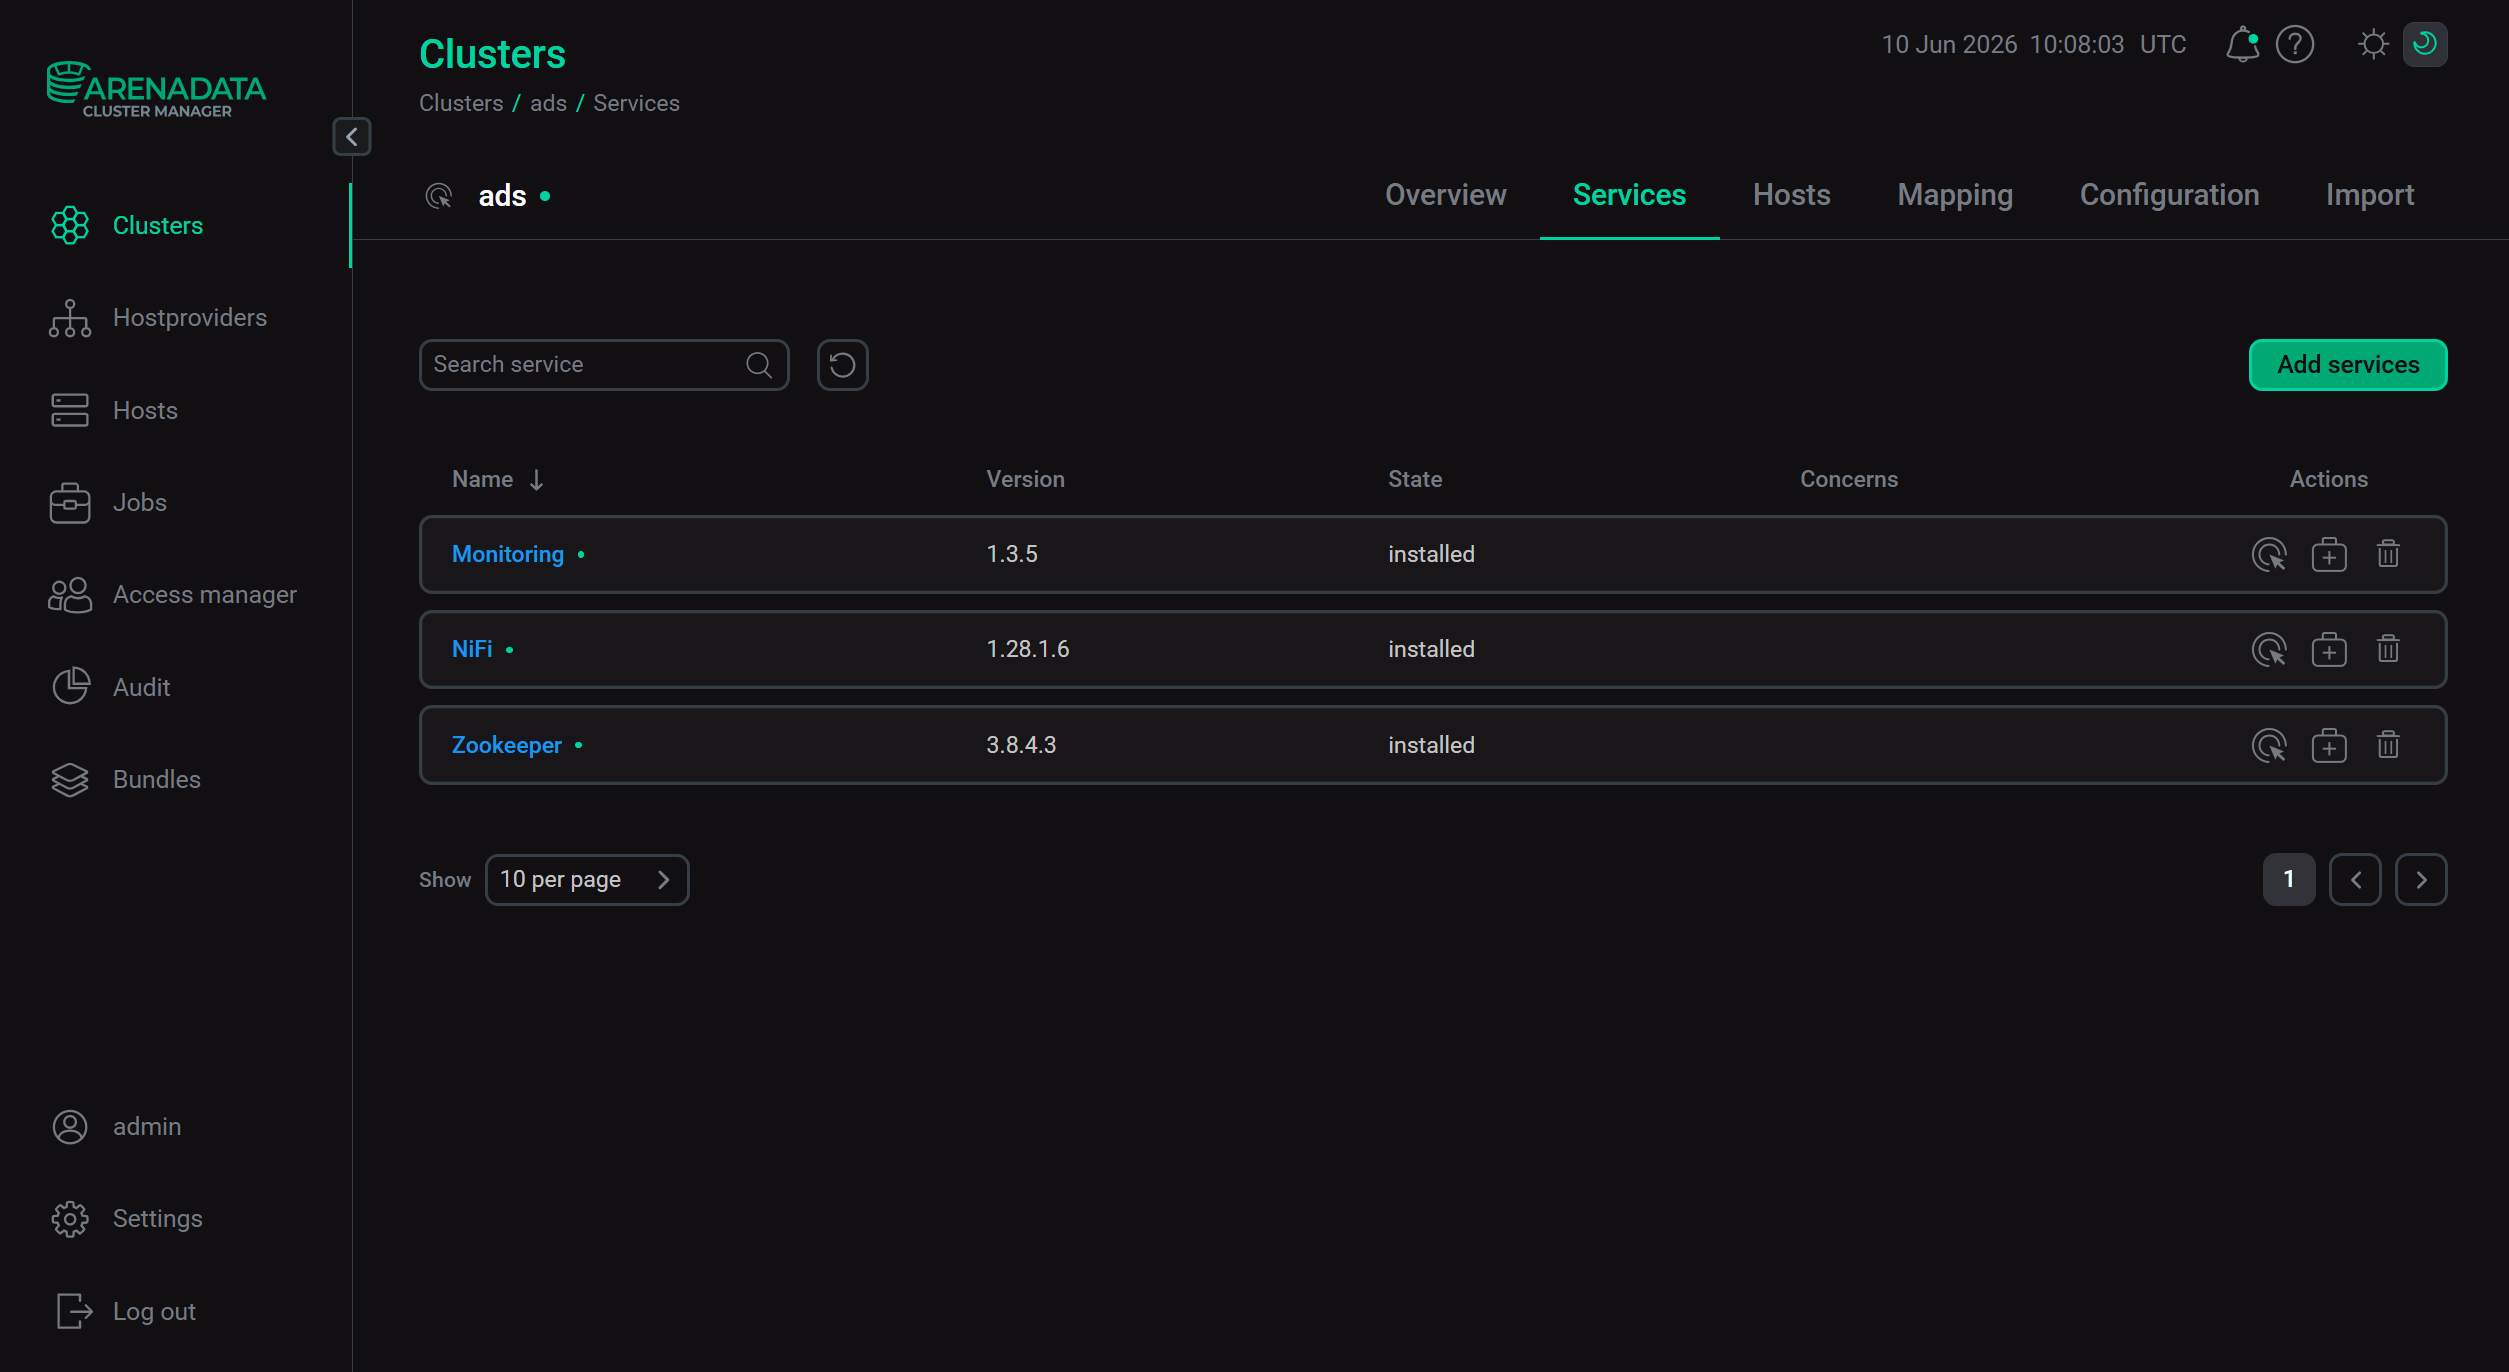 Installation is complete
To view the service installation process and analyze errors if they occur, select Jobs in the left navigation menu and click the Install job name in the Jobs list.
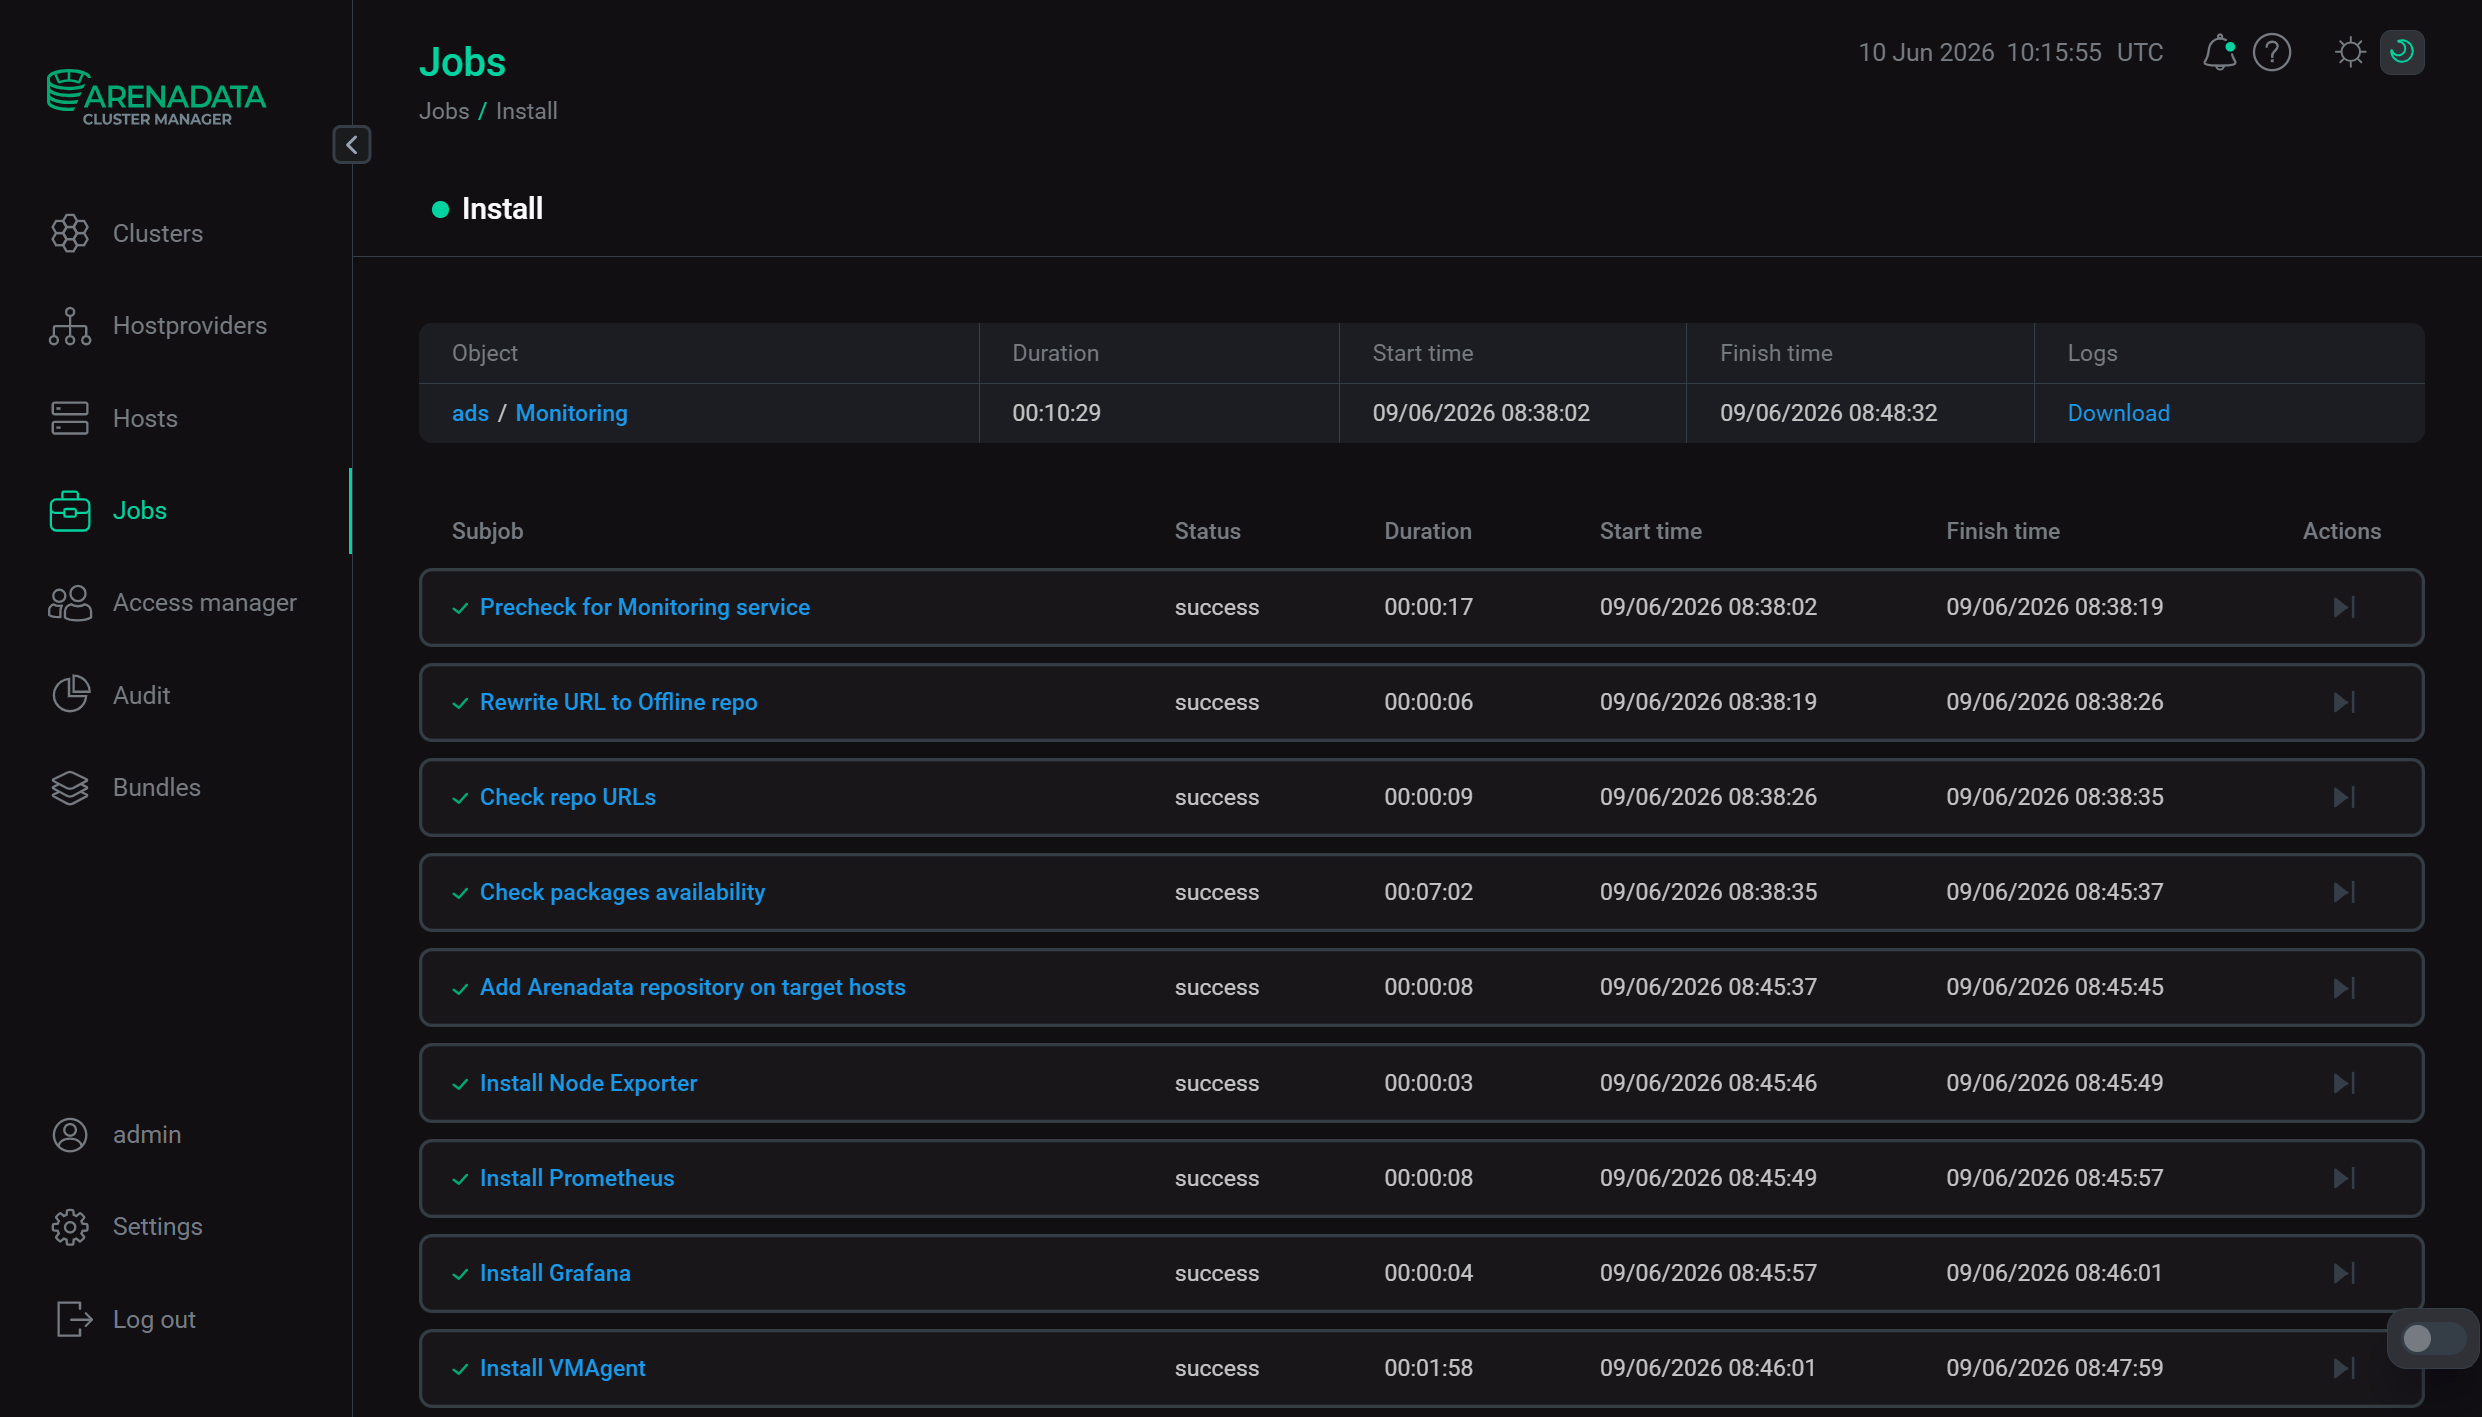 Install service job page
Step 7. Check the results
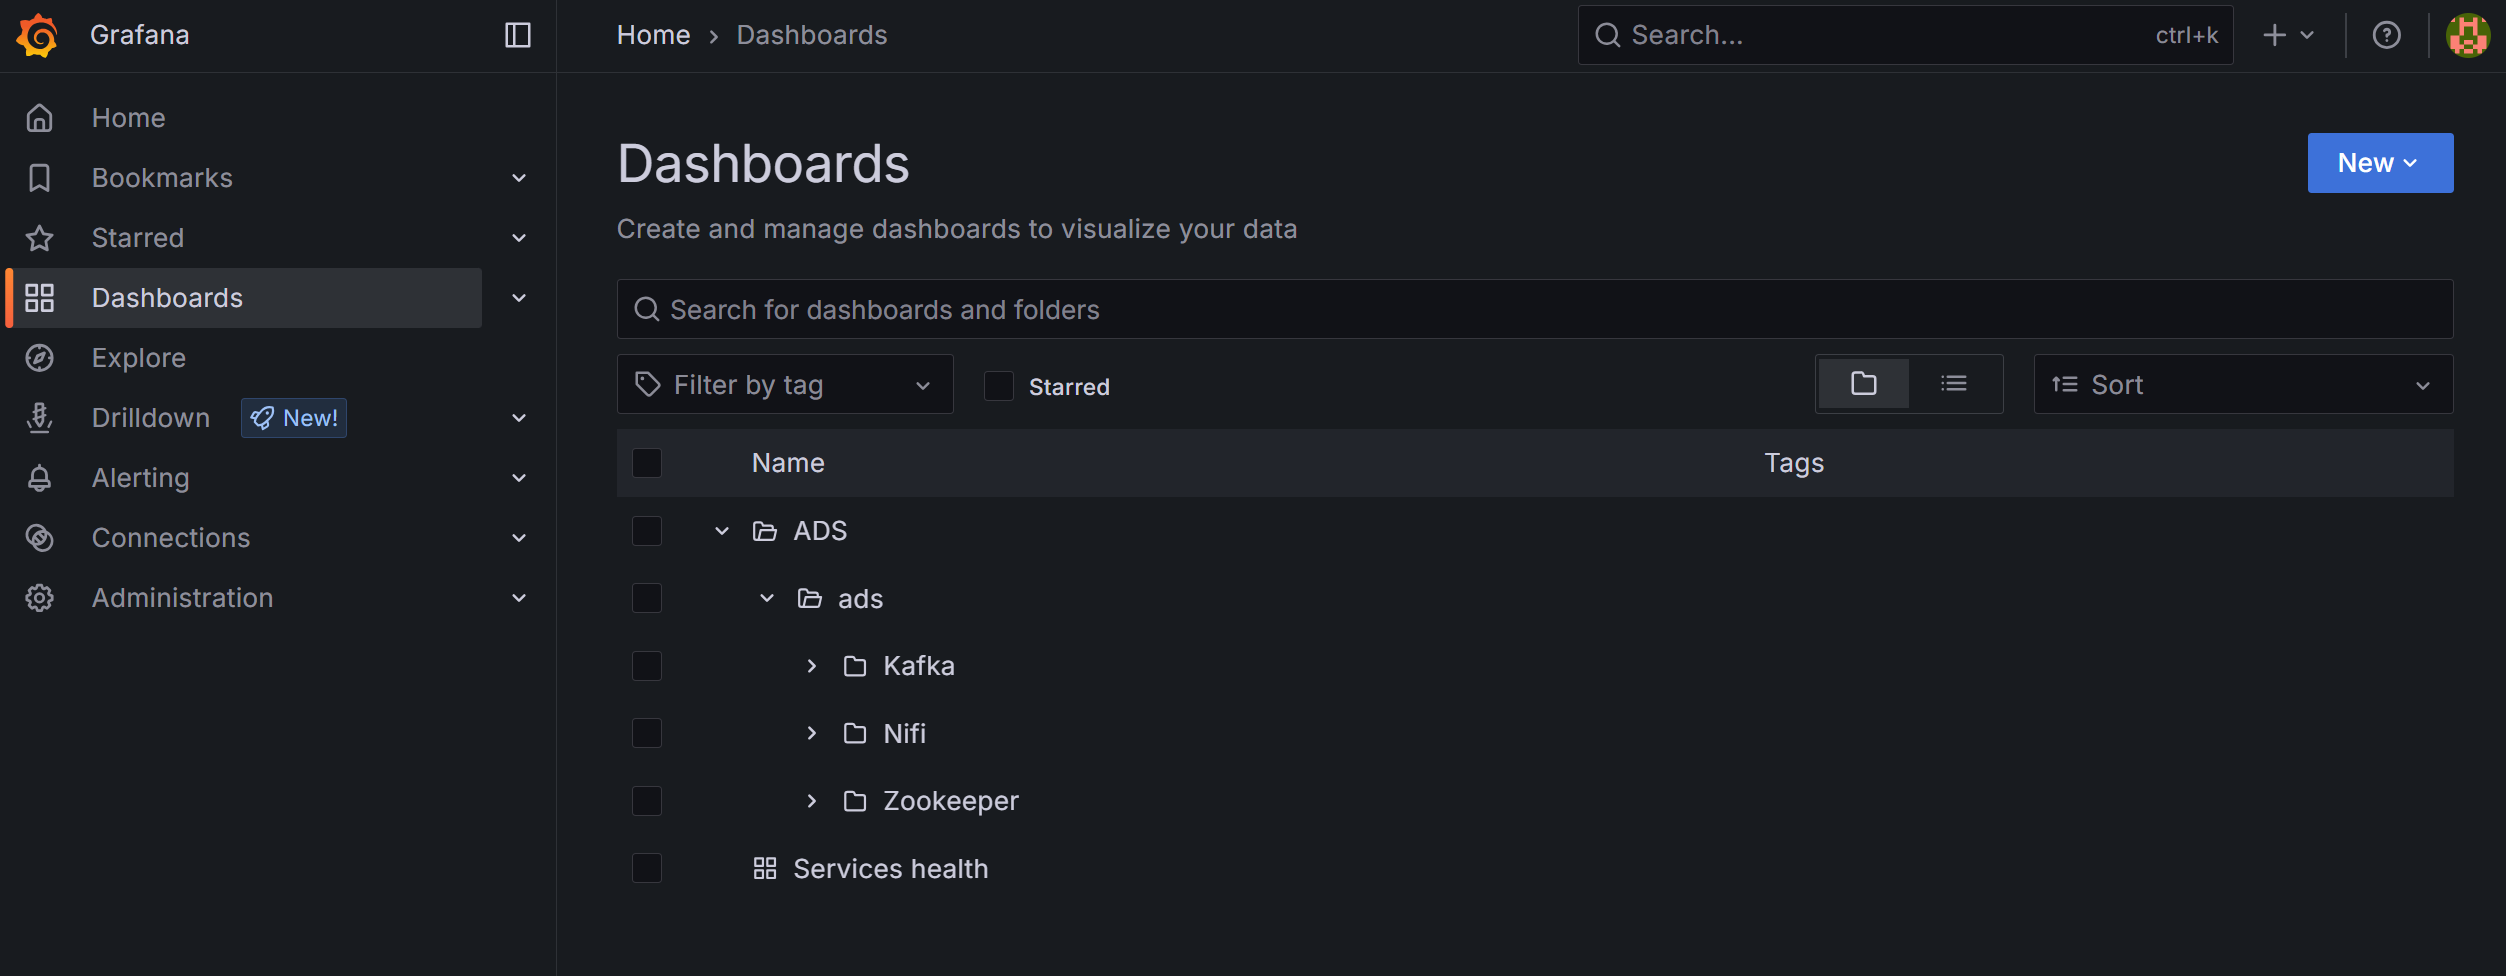
After configuring cluster ADS metric monitoring, they are displayed in the VictoriaMetrics web interfaces.
The optimal way to manage VictoriaMetrics metrics of the ADS cluster is through the Grafana web interface.