

Install a cluster
Step 1. Installation
There are two ways to install cluster services:
-
Whole cluster. In this method all services are installed automatically one by one after applying the Install action to a cluster.
-
Single services. In this method each service is installed manually after applying one or more actions to it. This way is also suitable for installing new services in the already deployed cluster.
In both cases each service starts automatically after installation.
|
IMPORTANT
The installation must be performed on a clean host without prior installation of related or similar software.
|
Whole cluster
To install all cluster services within a single action, follow the steps:
-
Apply the Install action to the cluster selected on the Clusters page by clicking the

 icon in the Actions column.
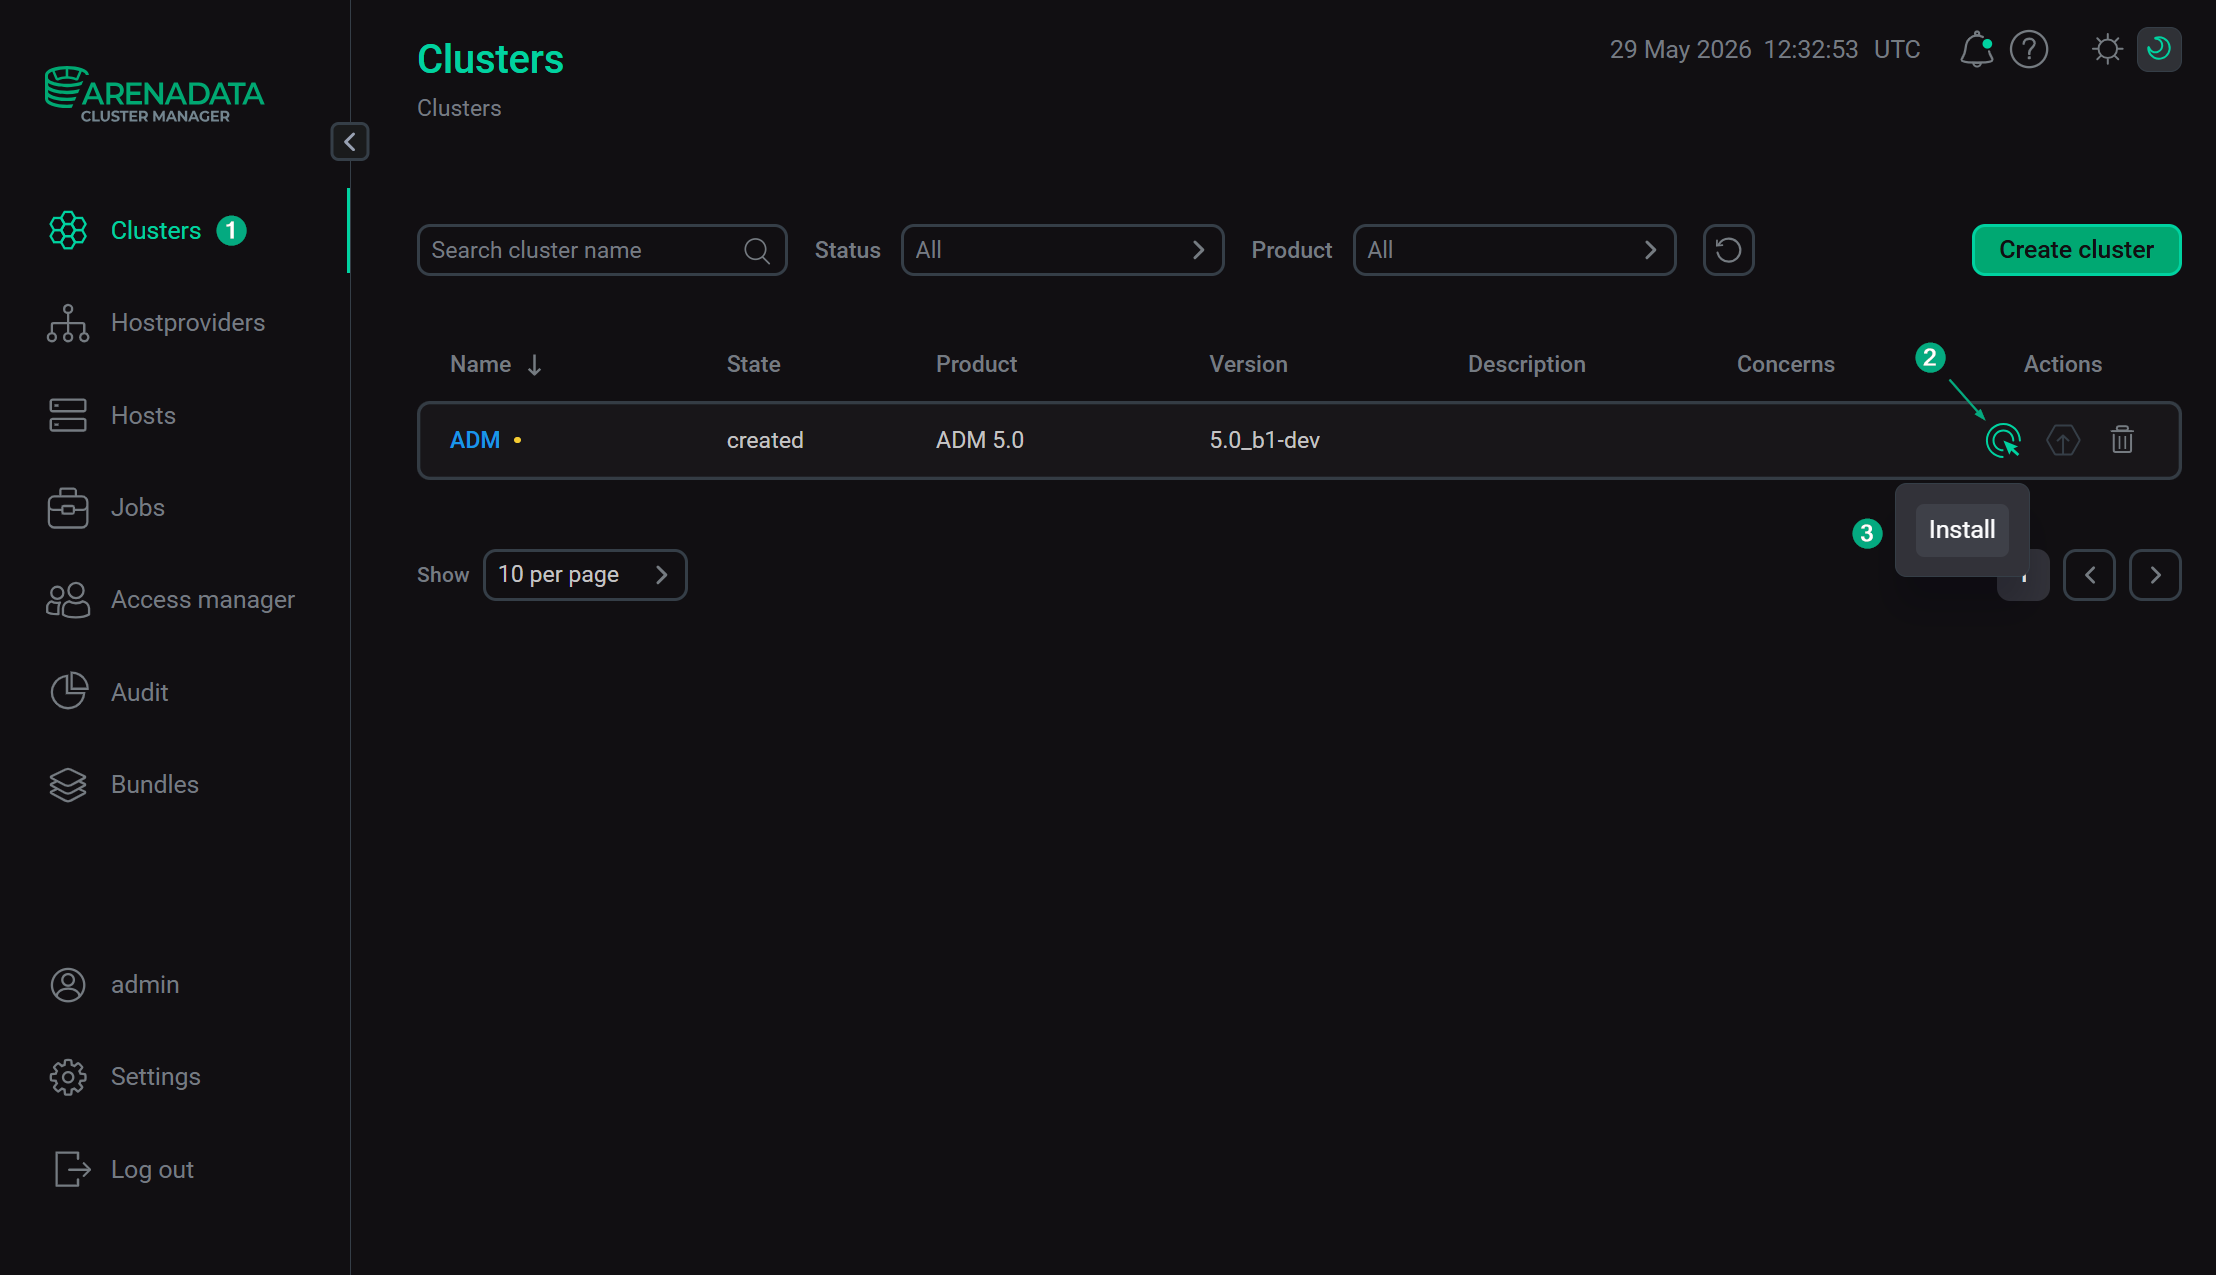 Switch to the whole cluster installation
 -
Verify the requested action in the opened window.
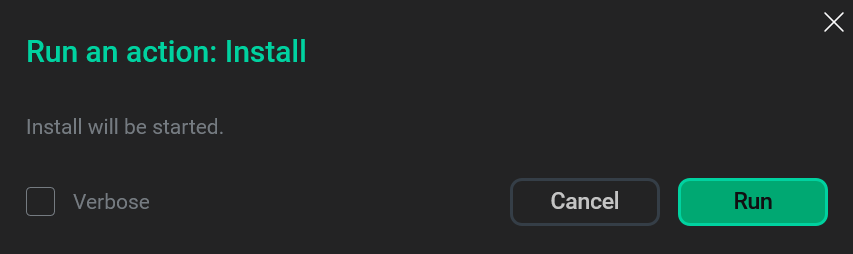 Verify the action
 -
Wait until the job is completed.
Single services
To install one or several cluster services manually, add these services to the cluster and then perform the actions described below.
|
CAUTION
Notice that services are installed one by one. Do not install another service until the installation of the previous one is completed.
|
-
Open the Services tab on the cluster page. For each service that should be installed, click the
icon in the Actions column and select the Install action. Switch to installation of single services
 -
Verify the action in the opened window.
Verify the action -
Wait until the job is completed. Then check that the service state has changed from
createdtoinstalled. -
Repeat the previous actions for other services that should be installed.
Step 2. View installation results
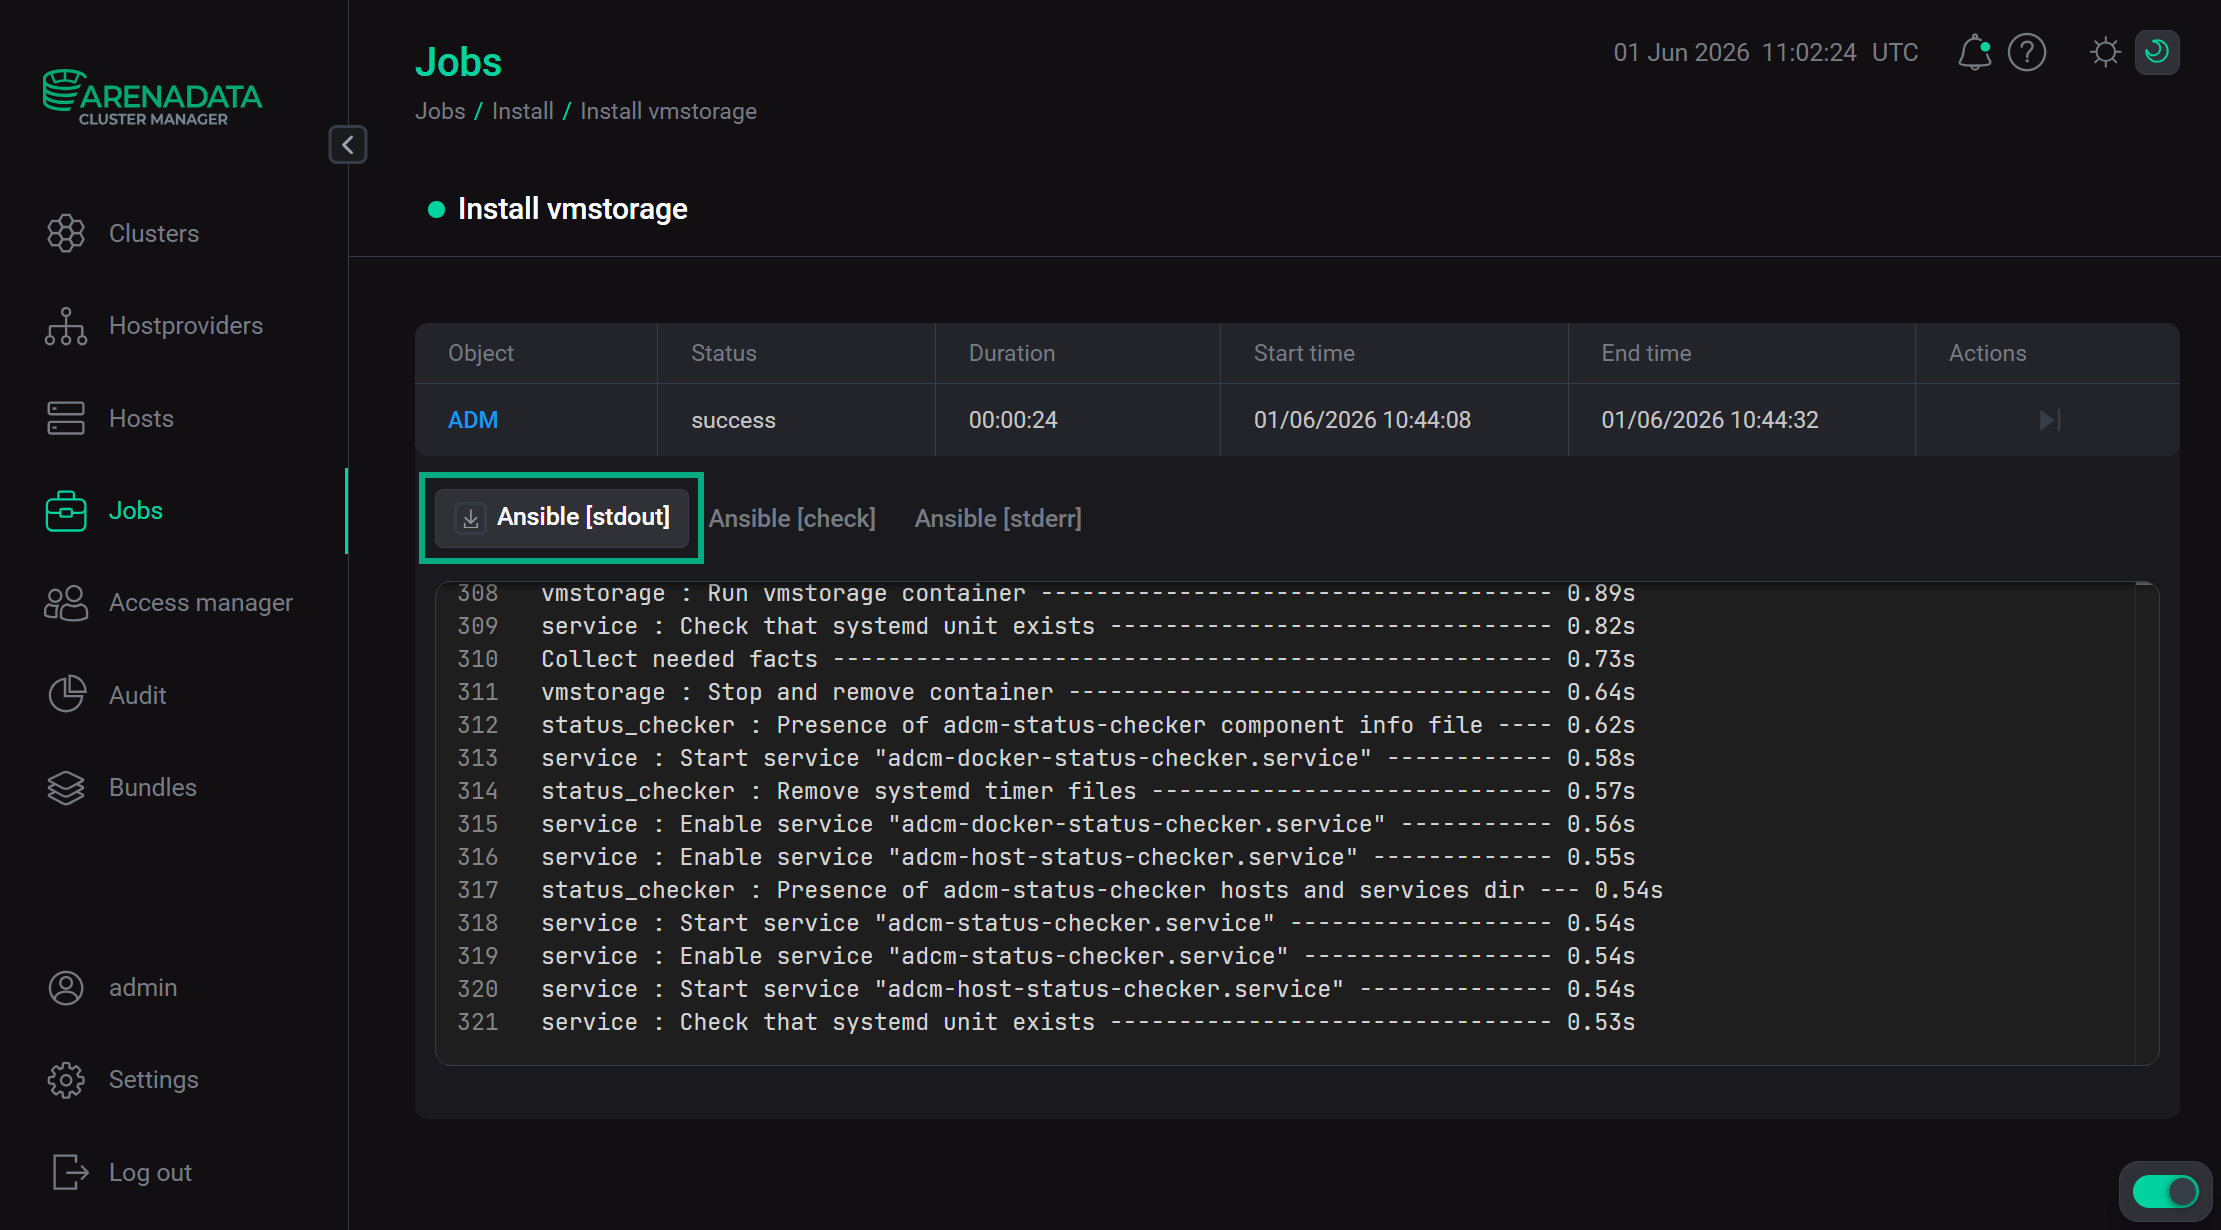
ADCM starts a single job for installation process, as well as for any other task. You can find out about the status of jobs more specifically on the Jobs page.
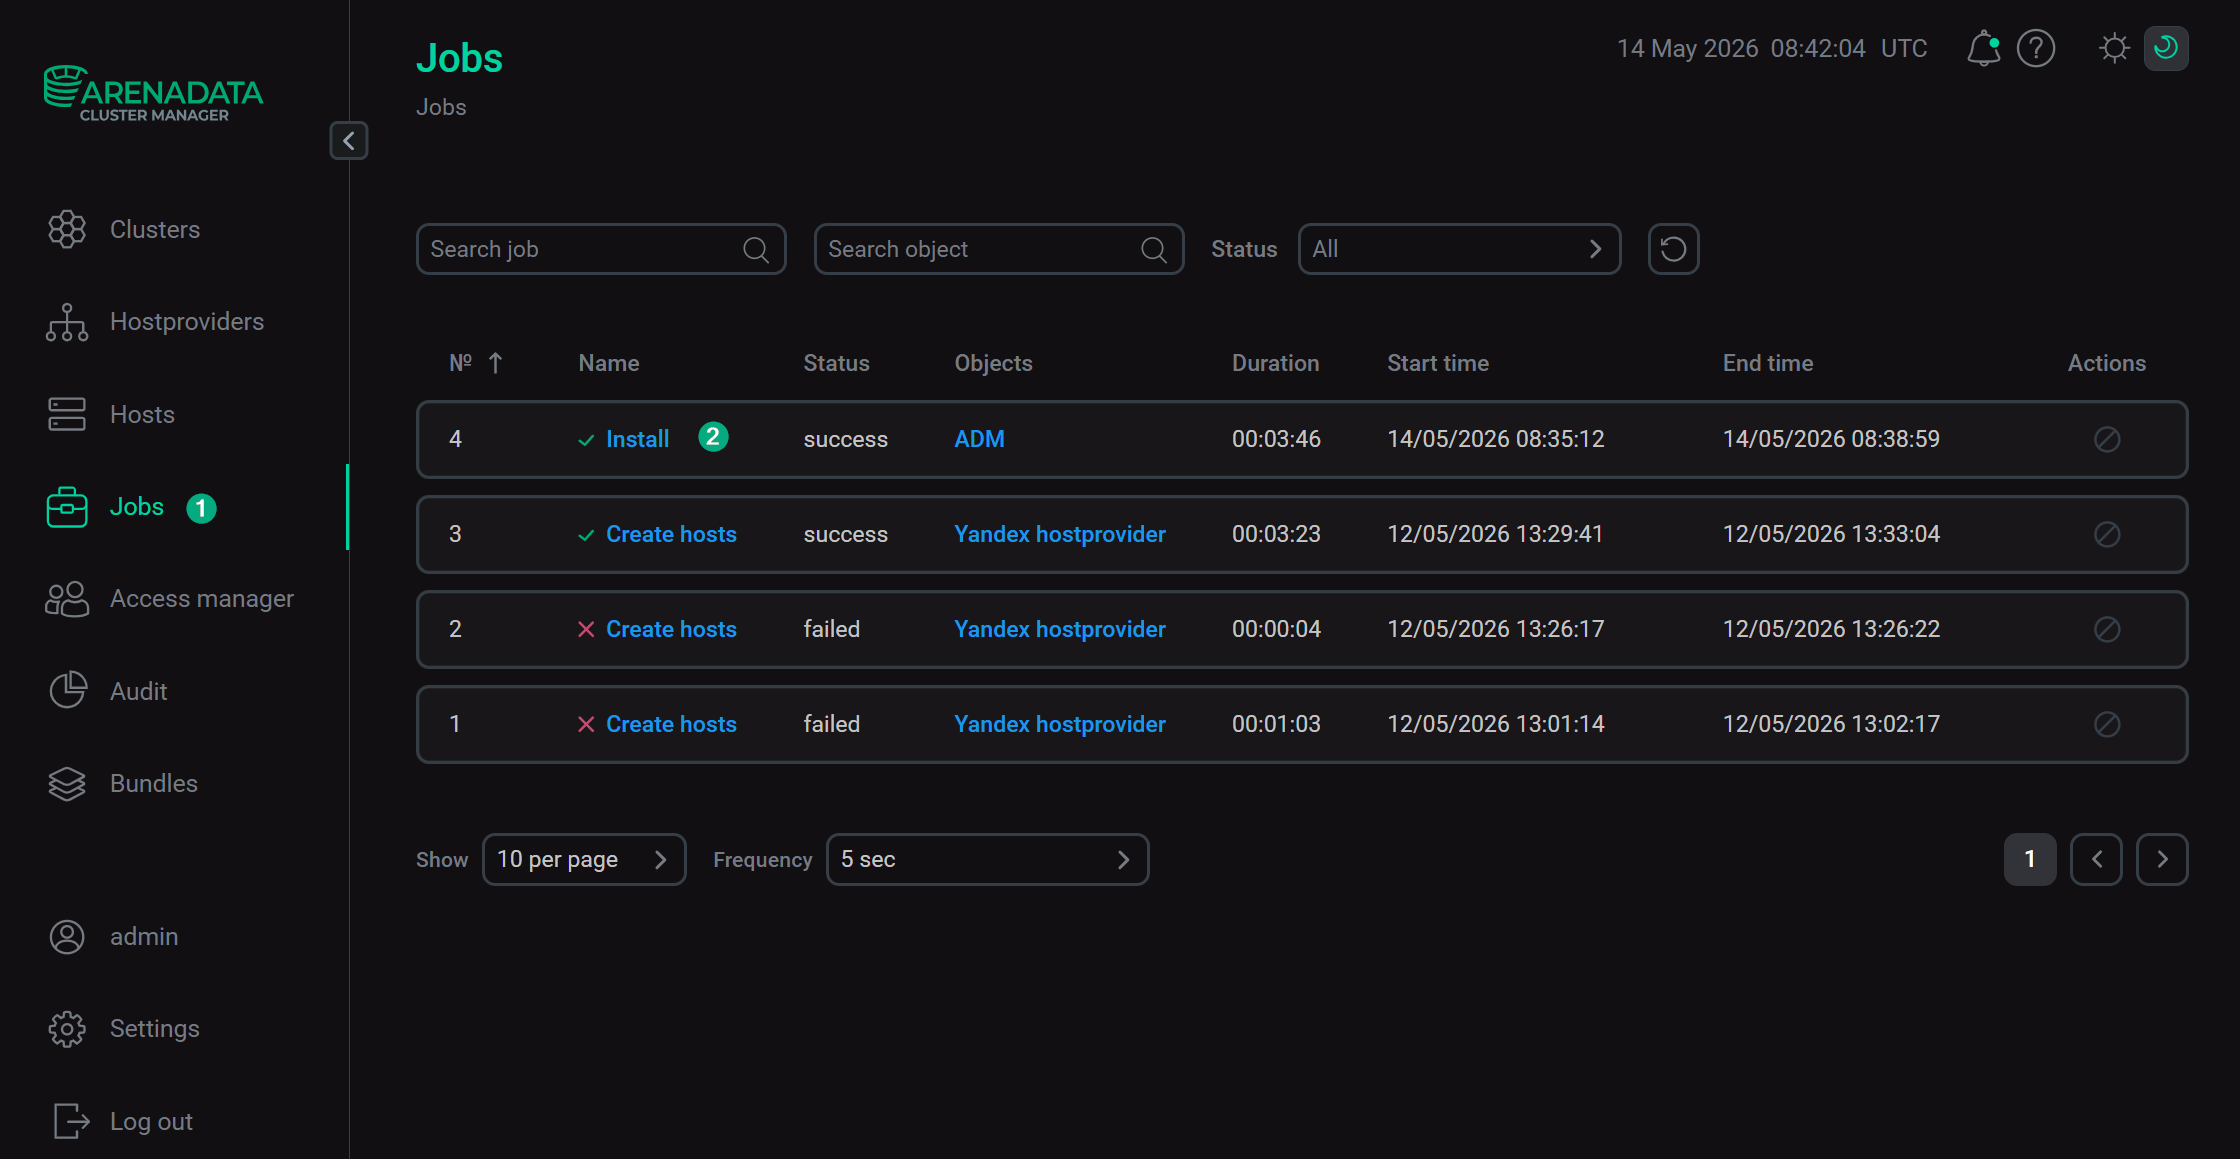
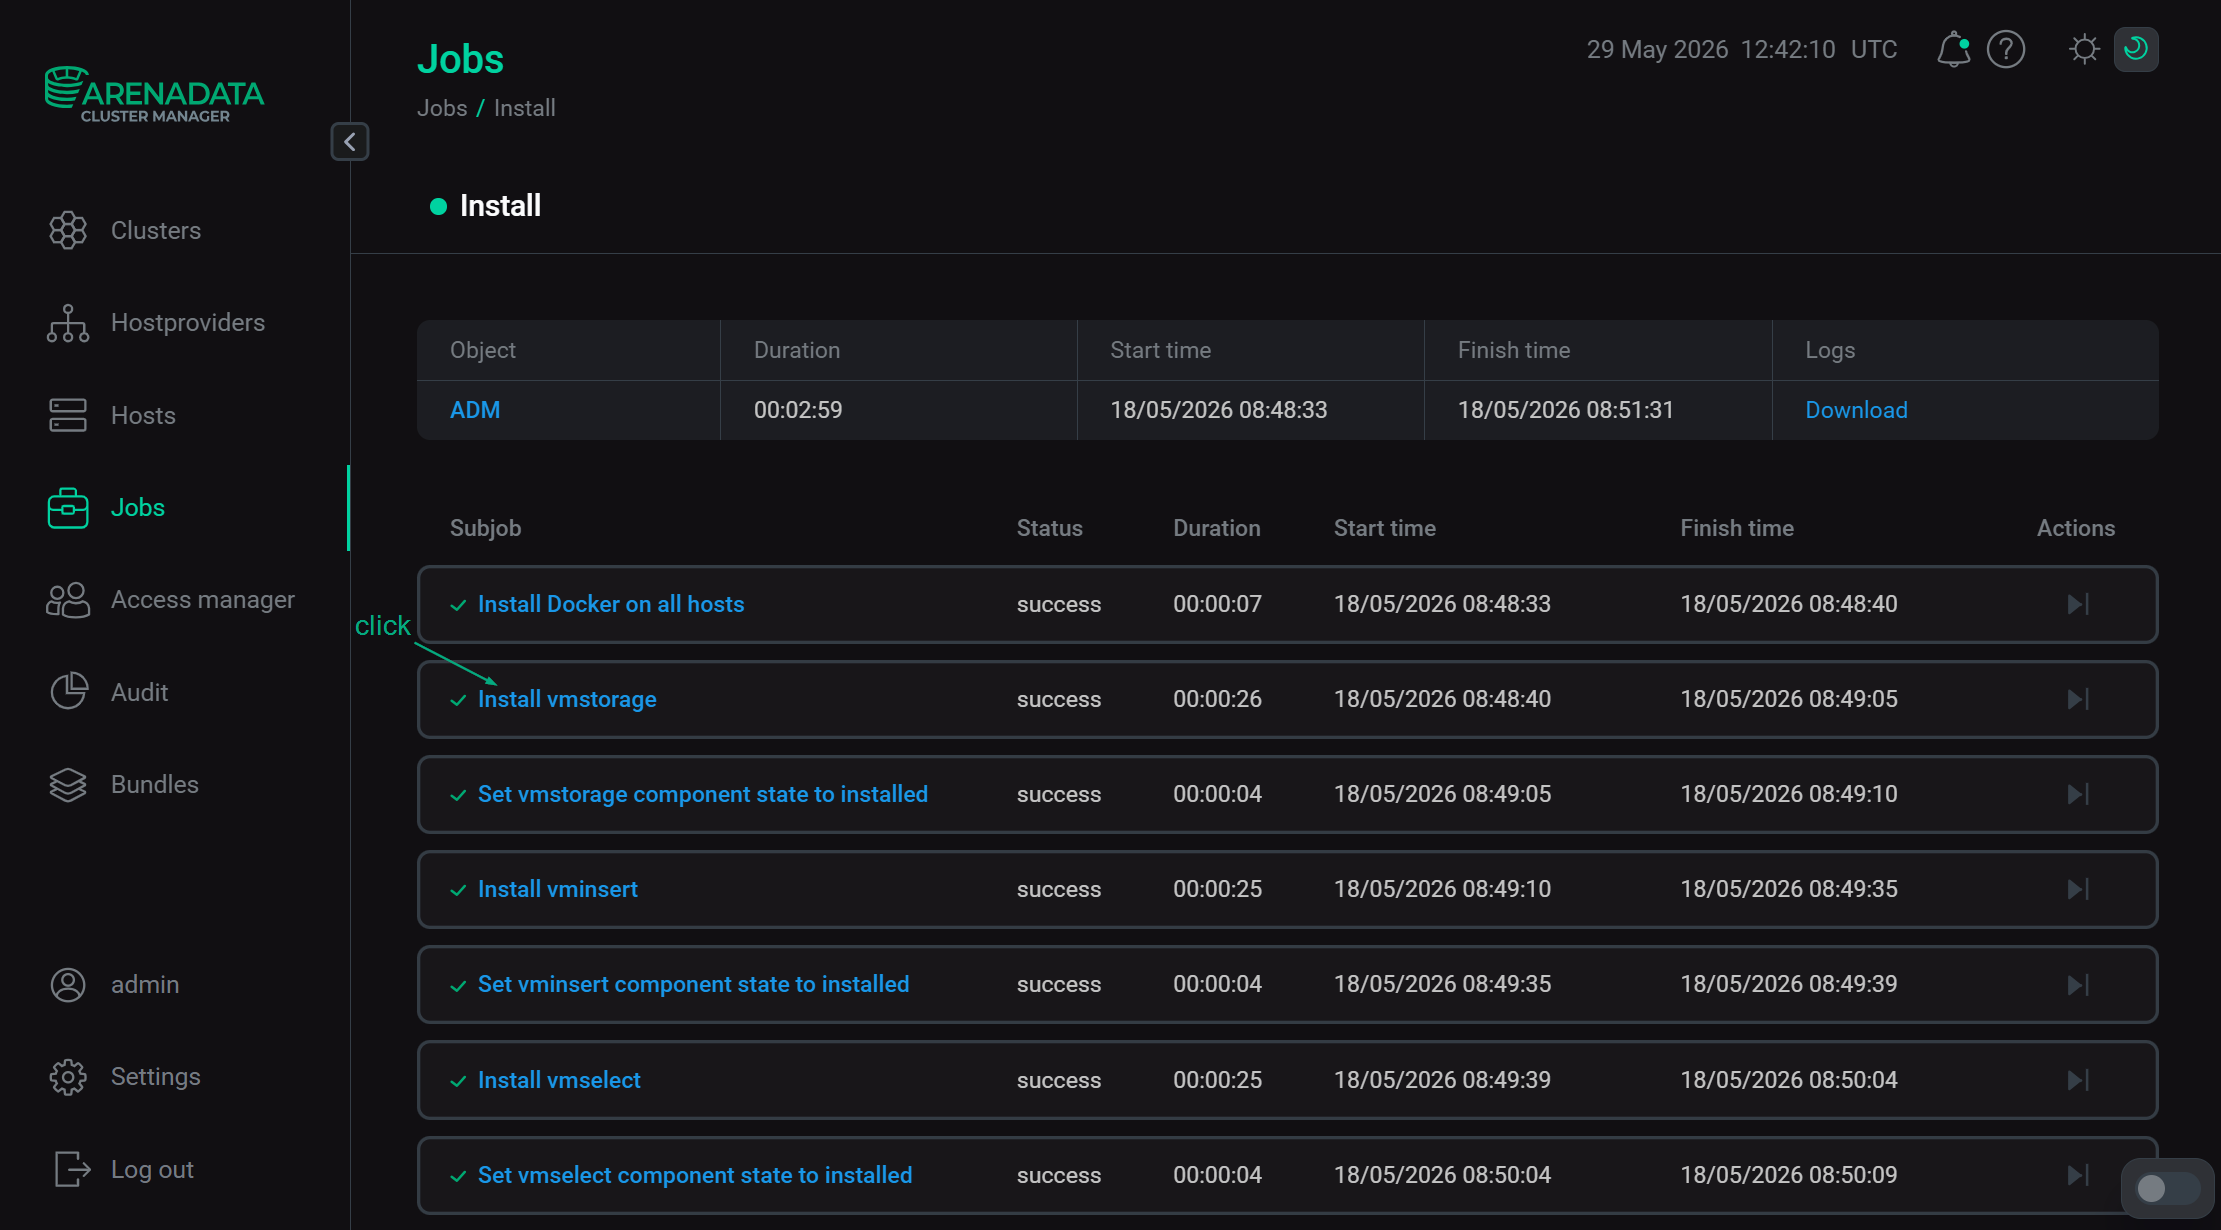
The successful completion of the service installation is determined by the transition of the job from the running status to the success status on the Jobs page. If the job fails, it switches to the failed status. In this case, it is possible to see more detailed information about the errors that occurred by clicking the failed job on the Jobs page. The window with the job’s inner steps is opened. Click the subjob’s name for additional information on the current step.
A job page contains two sections: ansible [ stdout] and ansible [ stderr ]. These are technical logs of the job that include information from standard I/O streams stdout/stderr. These logs can help to understand what caused the problems.
There can also be the optional third section ansible [ check ]. These are the logs of the most frequent errors checks. The description of these errors is more simple and specific, than in two previous technical logs.
The contents of all three sections should be studied if errors occur.
Step 3. Check the cluster state after the installation
As a result of successful installation, the cluster and its services change their state according to the following rules:
-
The cluster state, displayed in the State field on the Clusters page, is being changed from
createdtoinstalled.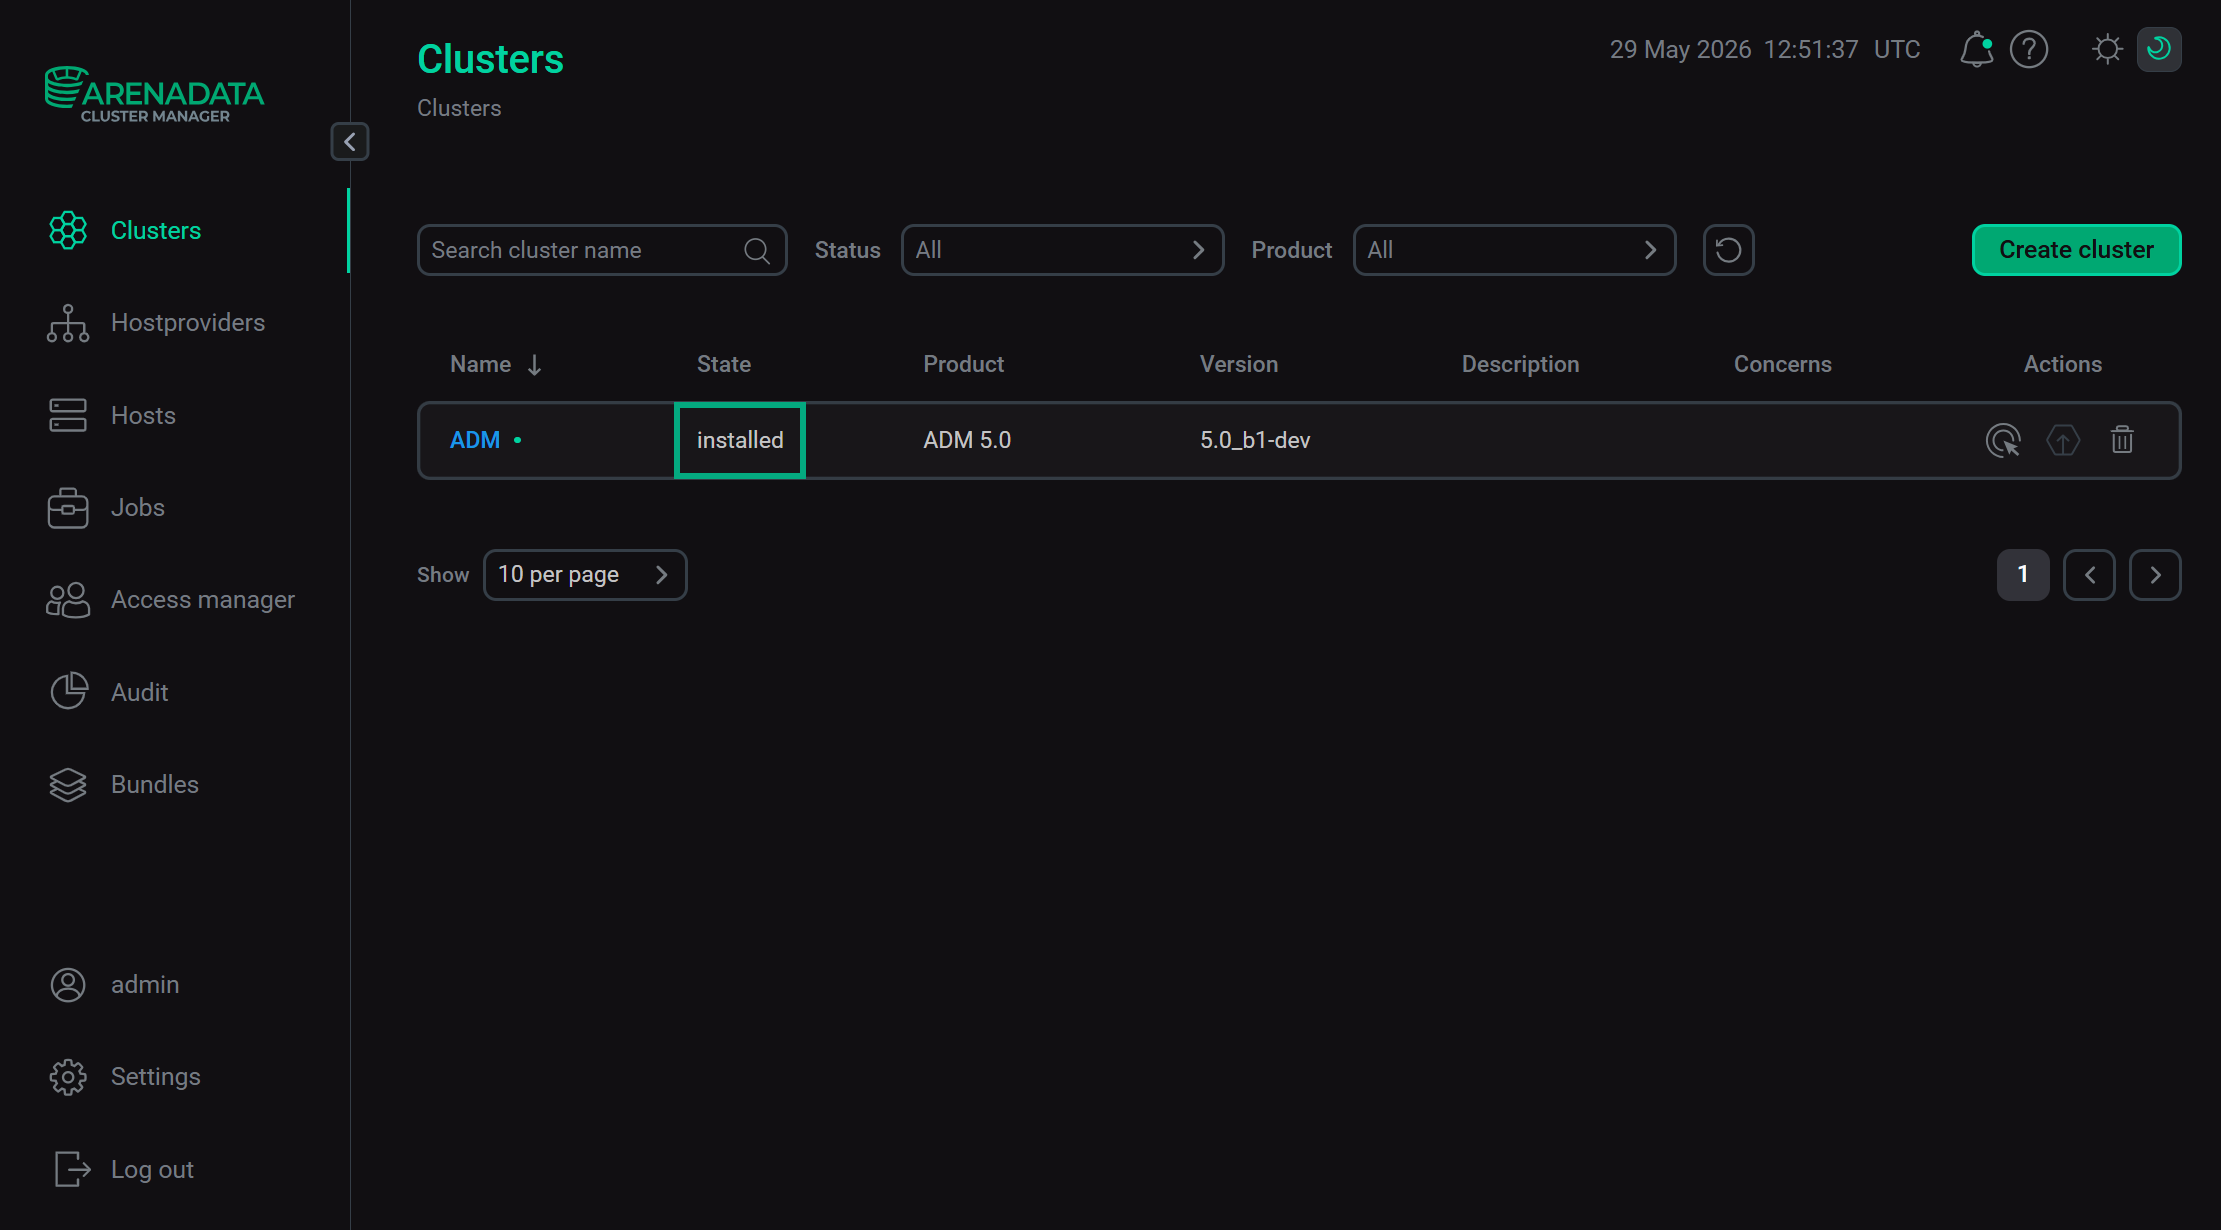 The cluster state after successful installation
 -
The state of cluster services, displayed on the Services tab of the cluster page, is being changed from
createdtoinstalled.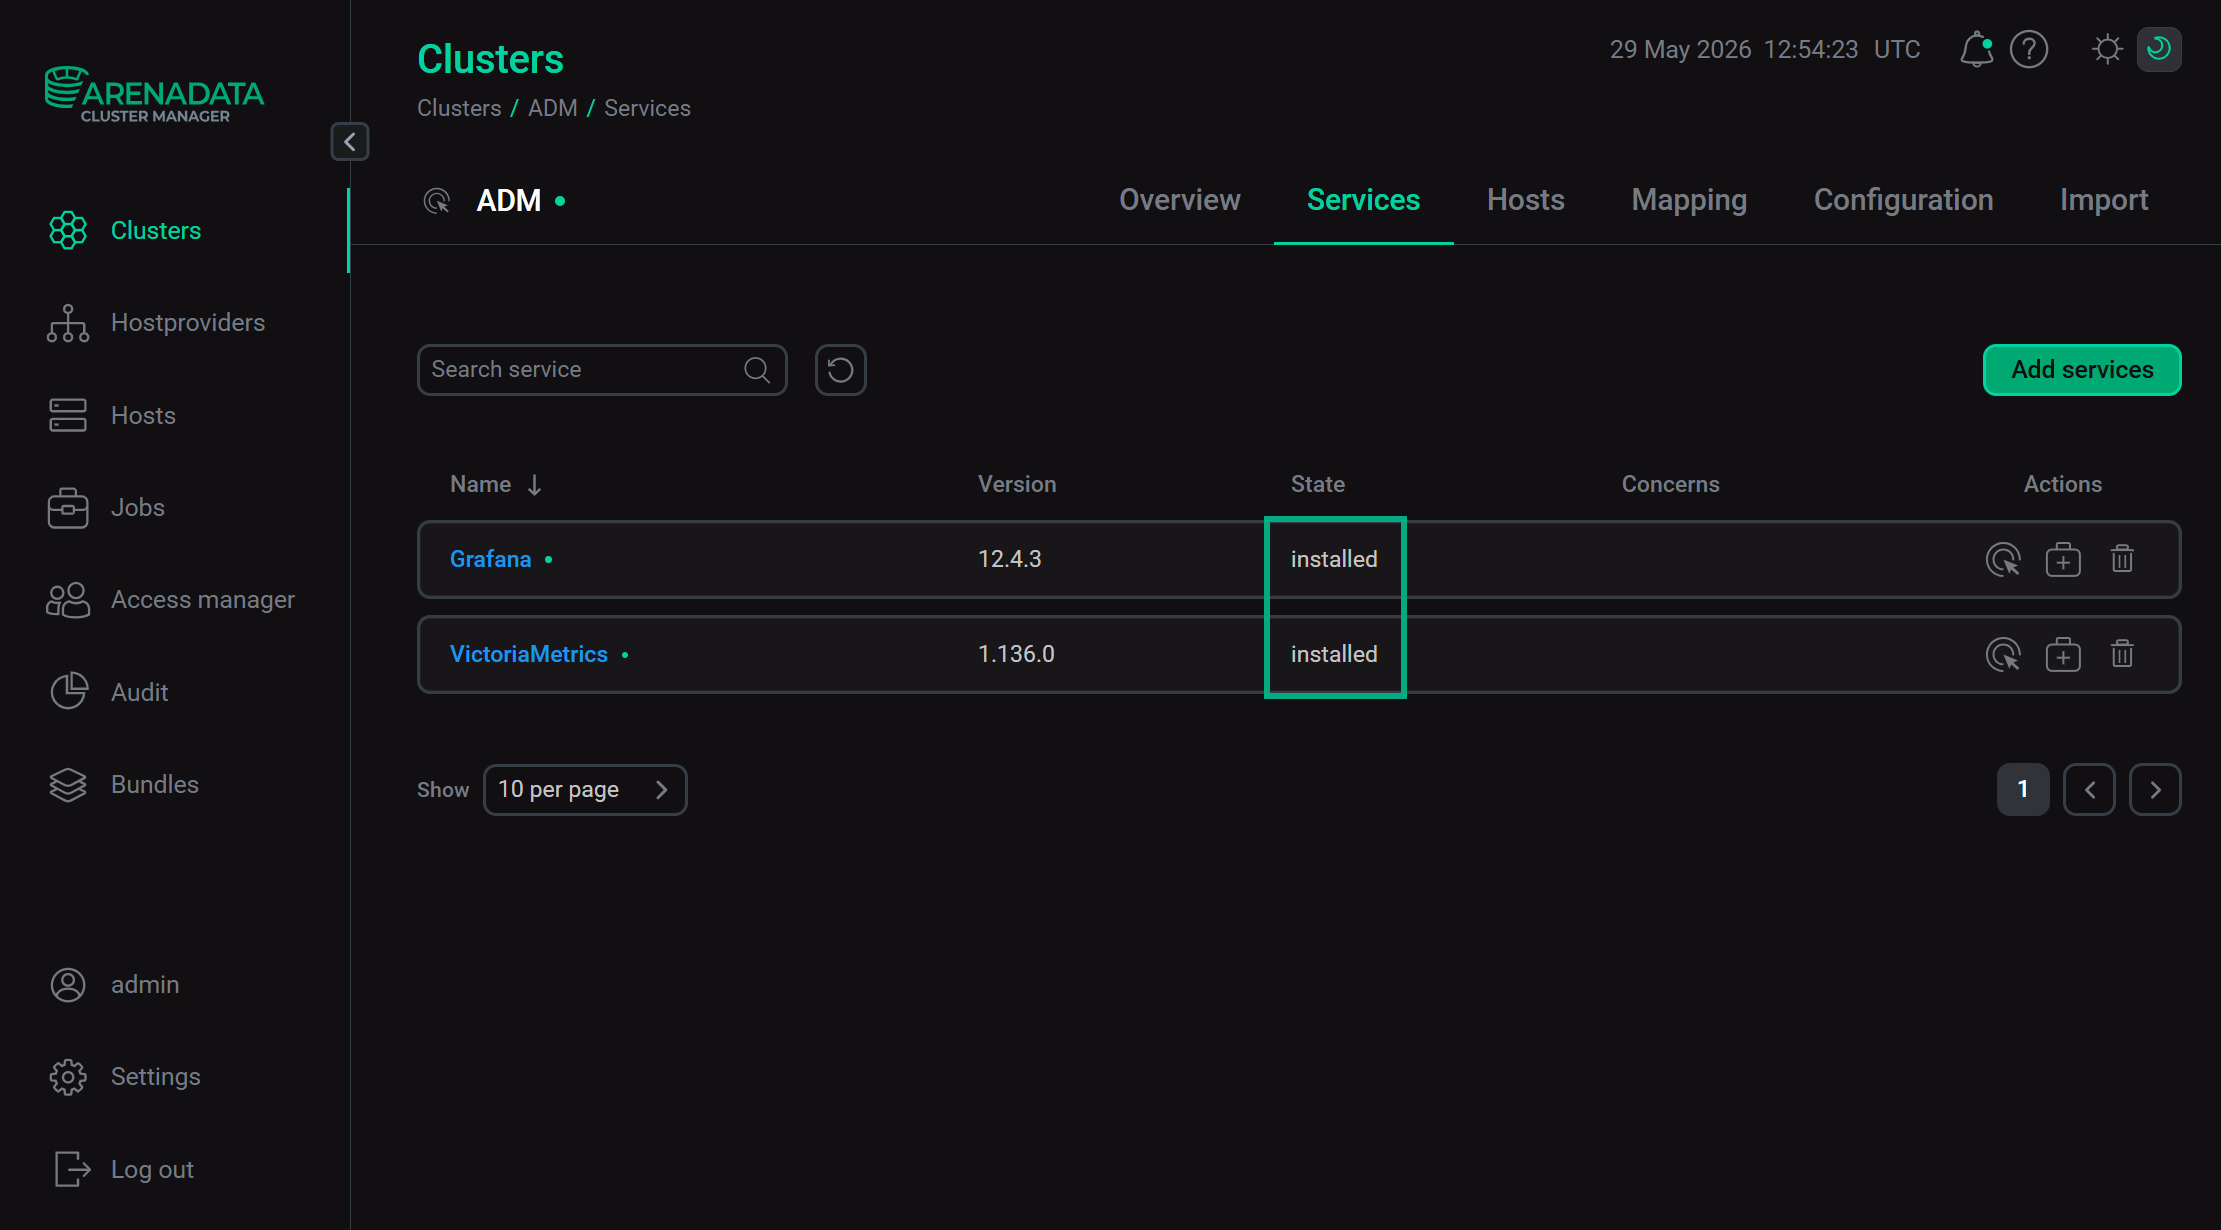 The state of cluster services after successful installation
Step 4. View metrics
Grafana web interface
In the address bar of your browser, enter an address of the host on which Grafana is deployed and add a port number — the value of the Grafana port parameter is located in the Configuration section of the Grafana service (the default value is 3000). For example, http://10.92.40.107:3000.
To log in, use admin as a username, and the Admin password parameter value (also found in the Configuration section of the Grafana service) as a password.
VictoriaMetrics web interfaces
VictoriaMetrics has three separate web interfaces:
-
VictoriaMetrics Insert
-
VictoriaMetrics Select
-
VictoriaMetrics Storage
To access VictoriaMetrics web interfaces, enter an address of the host where VictoriaMetrics is deployed with its respective port number into the browser address bar. Find specific port numbers on the Configuration → Ports Configuration tab (see Configure services):
-
VictoriaMetrics Insert: the vminsert HTTP port parameter (the default value is
8480). Example: http://10.92.40.169:8480. -
VictoriaMetrics Select: the vmselect HTTP port parameter (the default value is
8481). Example: http://10.92.40.169:8481. -
VictoriaMetrics Storage: the vmstorage HTTP port parameter (the default value is
8482). Example: http://10.92.40.169:8482.
|
NOTE
Links to the Grafana and VictoriaMetrics web interfaces are also available on the Info tab of the corresponding services. To access them, go to your cluster page, select the required service on the Services tab, and open the Info tab.
|