

Integrate with ADS cluster
In order to determine that a new cluster should be monitored, it is necessary to add a separate service Monitoring clients and integrate it with the previously created monitoring cluster.
The steps for building integration between a monitoring cluster and ADS cluster are described below. All actions should be performed on the base of ADS cluster.
Step 1. Add a monitoring service
The steps for adding services to a cluster are listed below:
-
Select a cluster on the Clusters page. To do this, click a cluster name in the Name column.
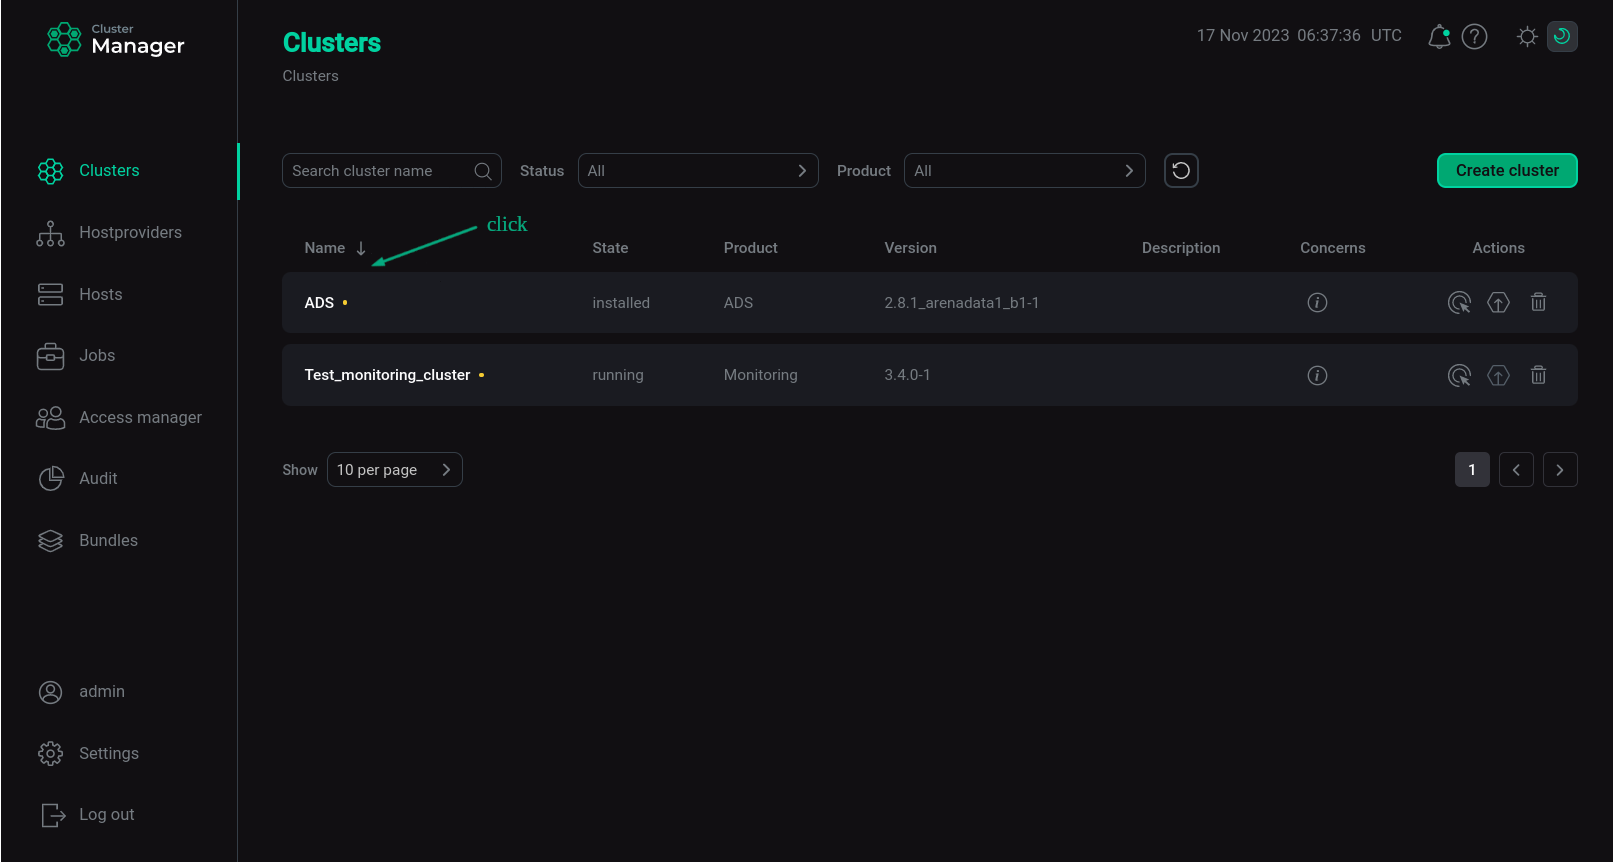 Select a cluster
 -
Open the Services tab on the cluster page and click Add services (Add service in first versions of ADCM).
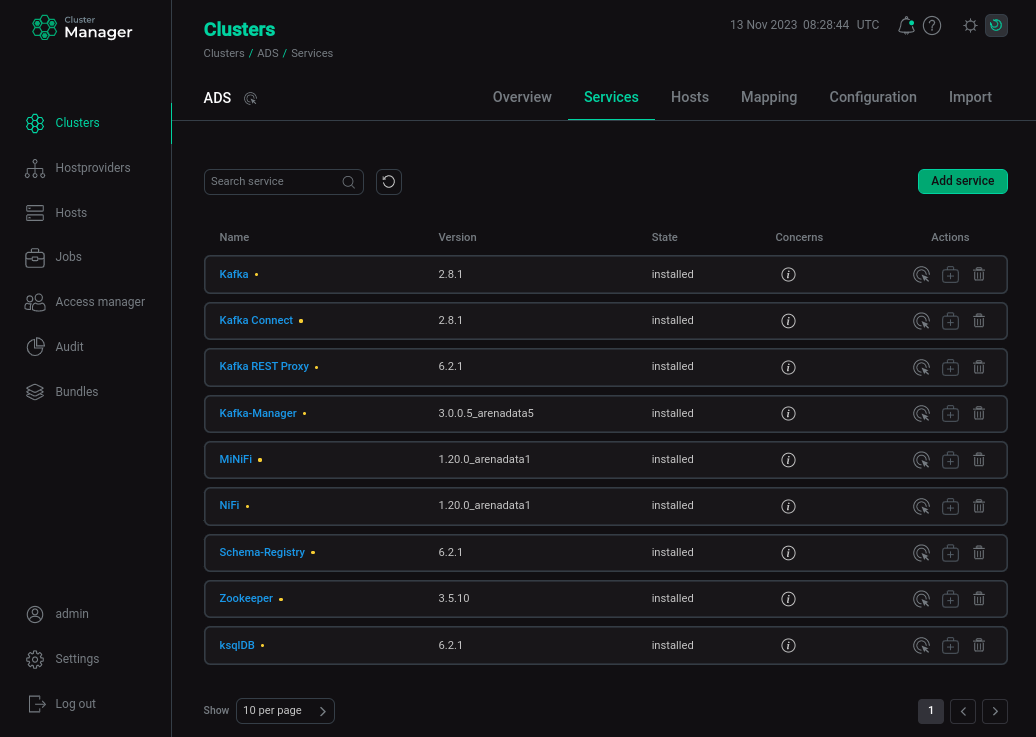 Switch to adding services
 -
Select the service Monitoring Clients in the opened dialog and click Add.
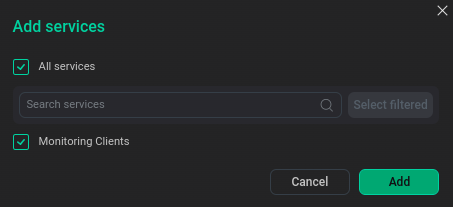 Select services
 -
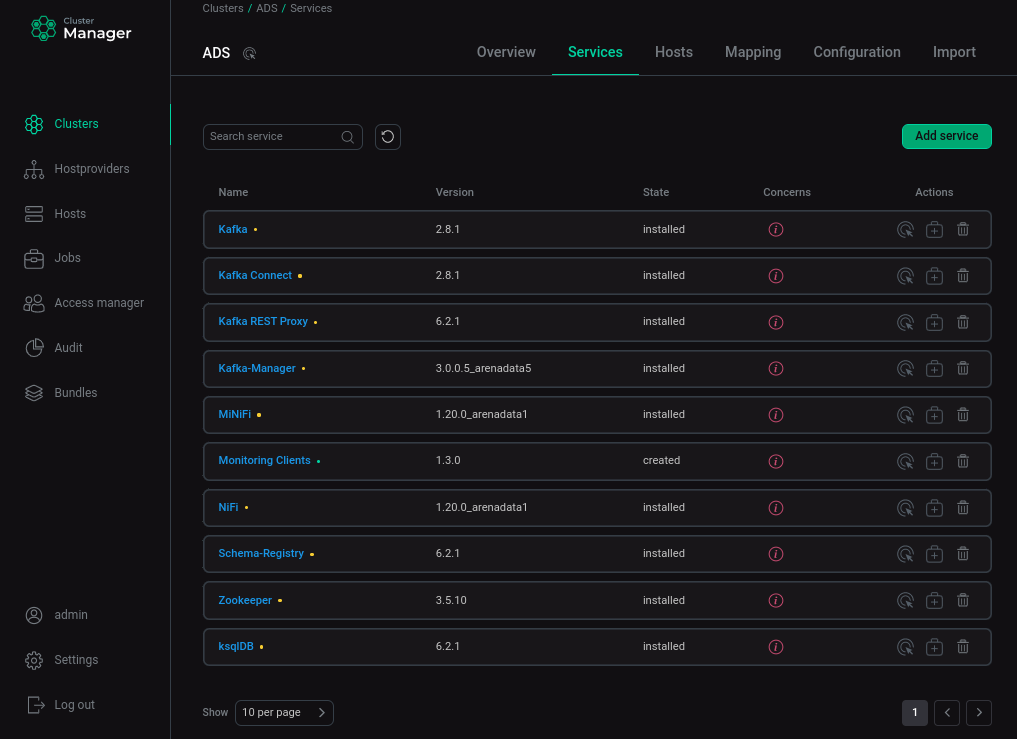
As a result, the successfully added service is displayed on the Services tab.
Step 2. Map monitoring components
The steps for adding components to hosts are listed below:
-
Select a cluster on the Clusters page. To do this, click a cluster name in the Name column.
Select a cluster -
Open the Mapping tab on the cluster page, add monitoring components to the cluster hosts and click Save.
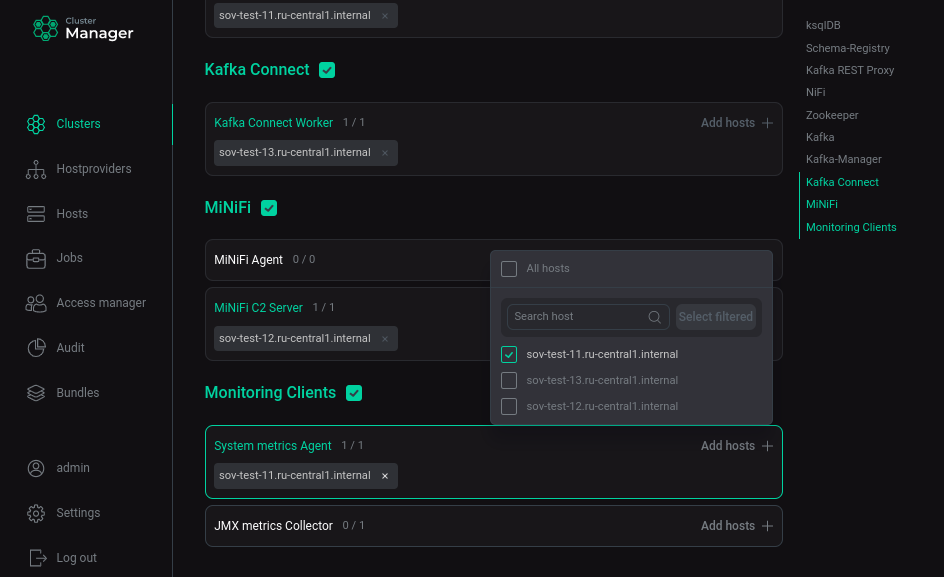 Map components to hosts
|
IMPORTANT
|
Step 3. Import monitoring settings
-
Select a cluster on the Clusters page. To do this, click a cluster name in the Name column.
Select a cluster -
Open the Import tab on the cluster page and go to the Services tab.
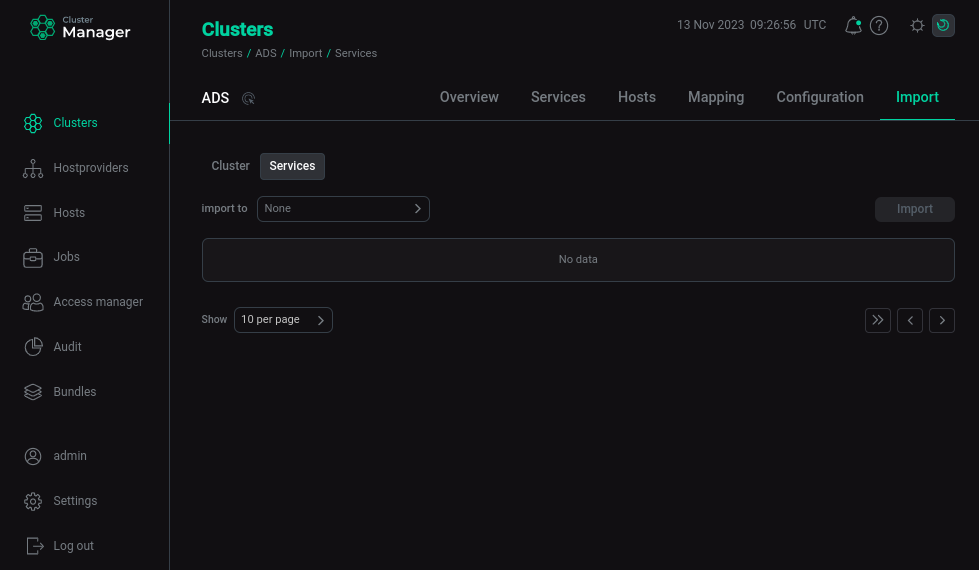 Switch to setting up import of services
 -
In the Import to drop-down list, select the Monitoring Clients service.
-
Select the Graphite and Grafana services of the previously created monitoring cluster.
-
Click Import.
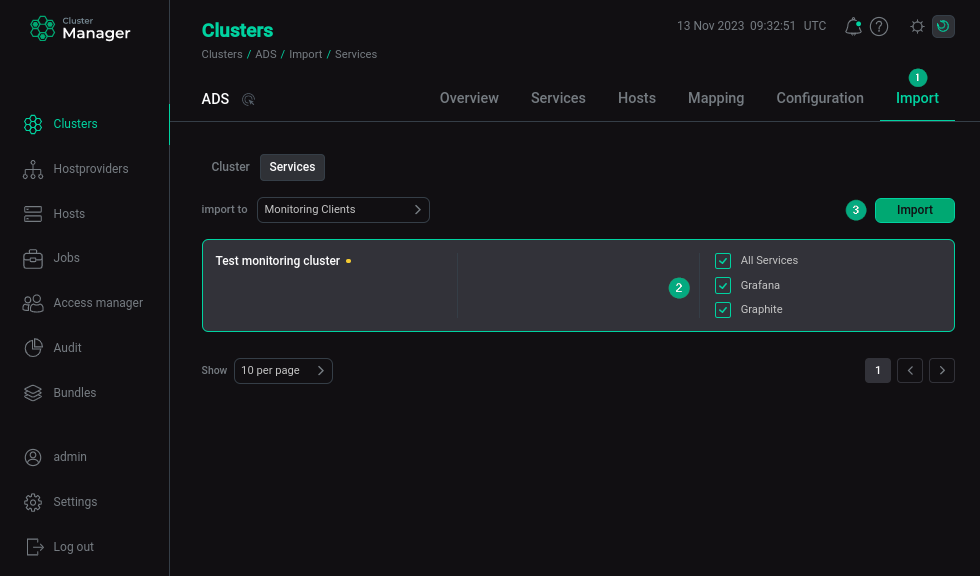 Integration with a monitoring cluster
Step 4. Install a monitoring service
-
Open the Services tab in the cluster menu. Click the

 icon in the Actions column and select the Install action in the row that refers to the
Monitoring Clients.
icon in the Actions column and select the Install action in the row that refers to the
Monitoring Clients.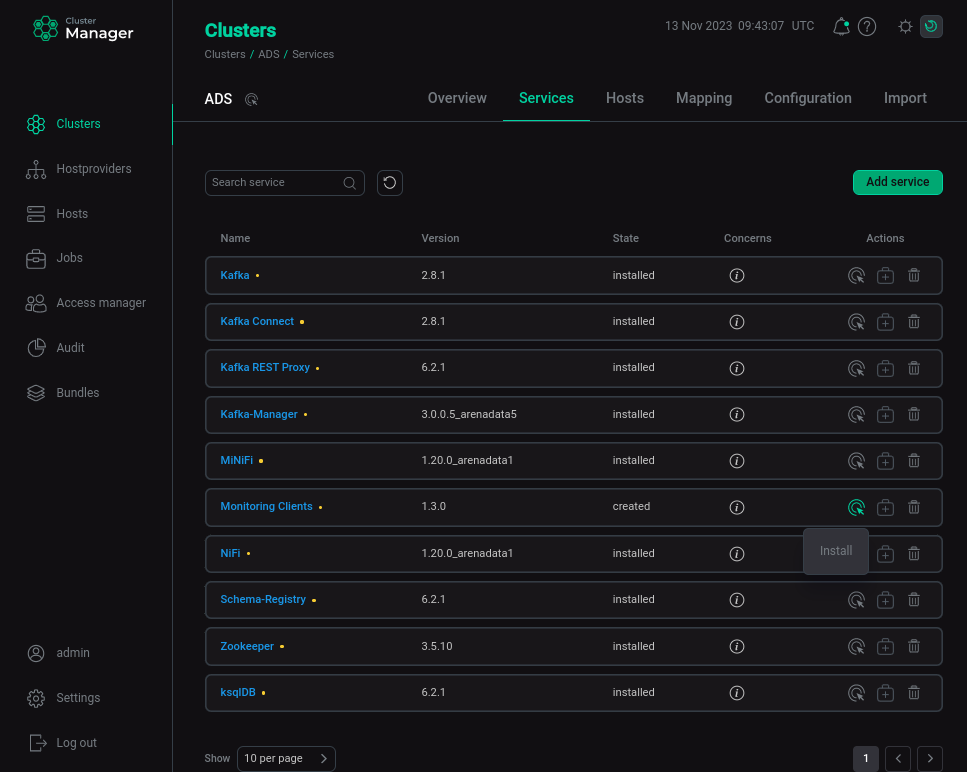 Switch to installing the monitoring service
 -
In the dialog box that opens, select required installation parameters and click Run.
-
Verify the action in the opened window.
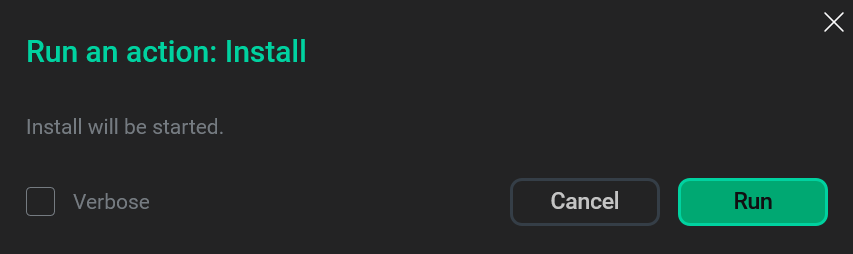 Verify the action
 -
Wait until the job is completed. After successful installation, the monitoring service changes its state from
createdtoinstalled.NOTEIn case of errors, you can find logs on the Jobs page.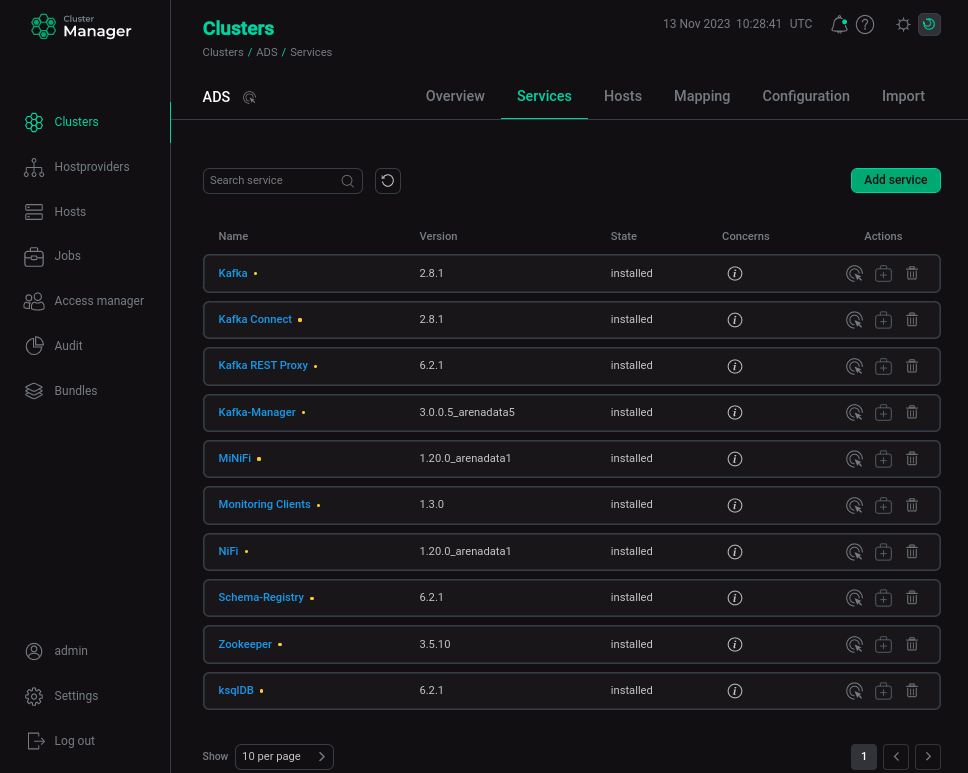 Monitoring installation is completed
Step 5. Verify results
To ensure that installation process is completed successfully, check the following:
-
System metrics are collected from the hosts of your cluster, not only from the host where the monitoring cluster has been deployed earlier.
-
Along with system metrics, service metrics are collected from the hosts of your cluster. For example, ADS cluster provides metrics for such services as Kafka, Nifi, Minifi.
You can check it both in the Graphite and Grafana web-interface.
Graphite
-
In the browser bar, enter an address of the host where the monitoring cluster is deployed. To specify the port number, use the value of the Web-interface TCP port parameter from the ip_and_ports section defined when configuring the Graphite service during the monitoring cluster installation. The value
80(used by default) can be omitted. -
Expand a tree at the left side of the opened form. System and service metrics are displayed there, grouped by hosts. You can select some of these metrics to view their change dynamics in the form of a graph at the right side of the screen.
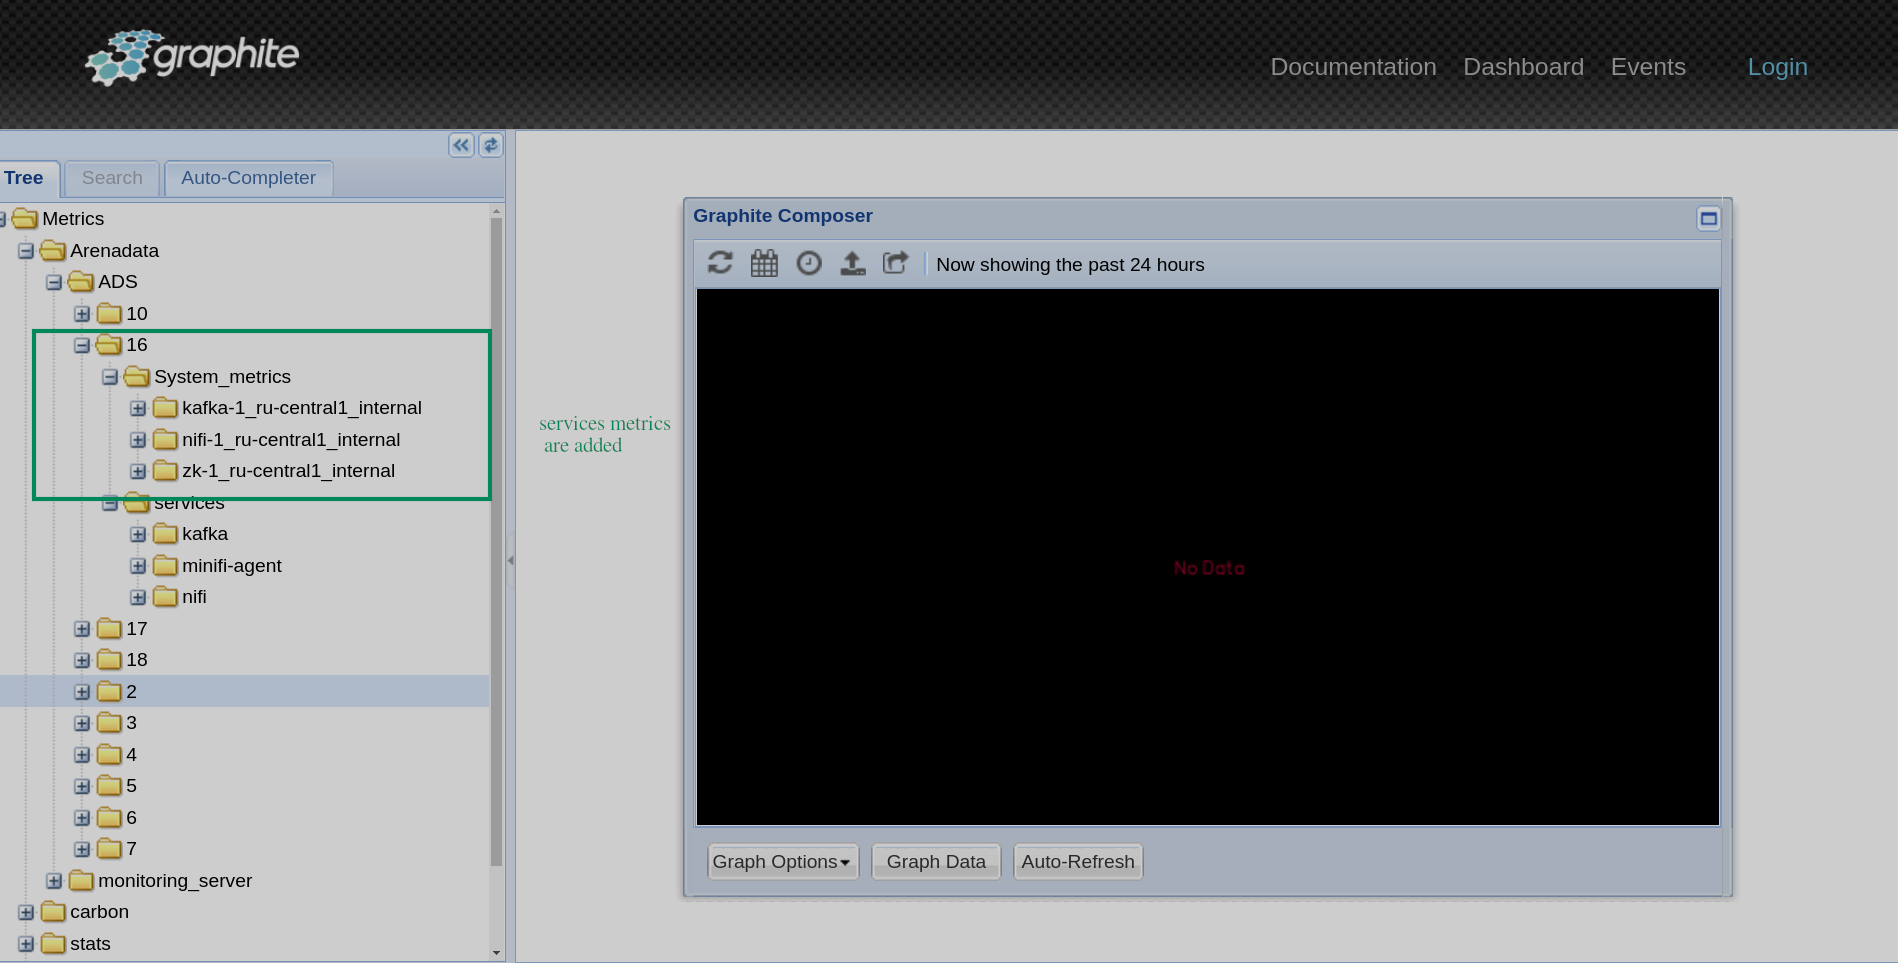 New hosts and service metrics are available in Graphite
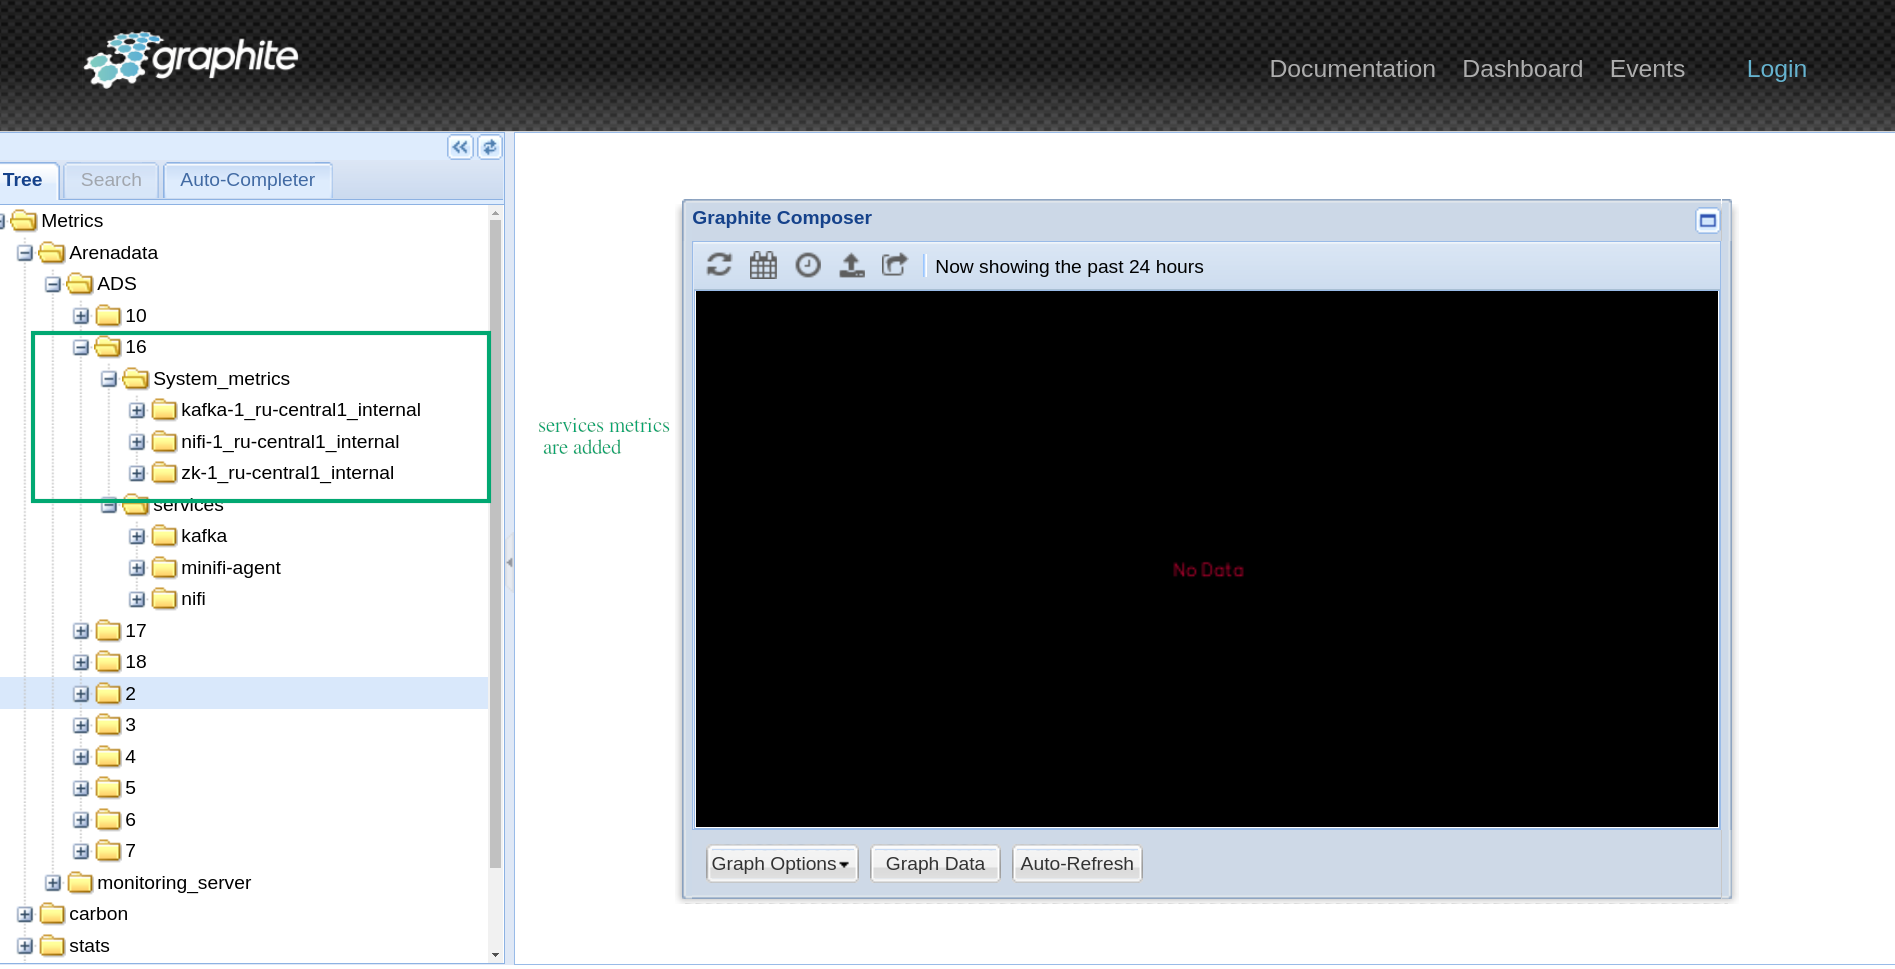 New hosts and service metrics are available in Graphite
Grafana
-
In the browser bar, enter an address of the host where the monitoring cluster is deployed. To specify the port number, use the value of the Port parameter from the ip_and_ports section defined when configuring the Grafana service during the monitoring cluster installation (by default,
3000). -
Select the Home menu item in the opened form.
-
Notice that new dashboards are available. Select one of them to view the service metrics that are collected from your cluster.
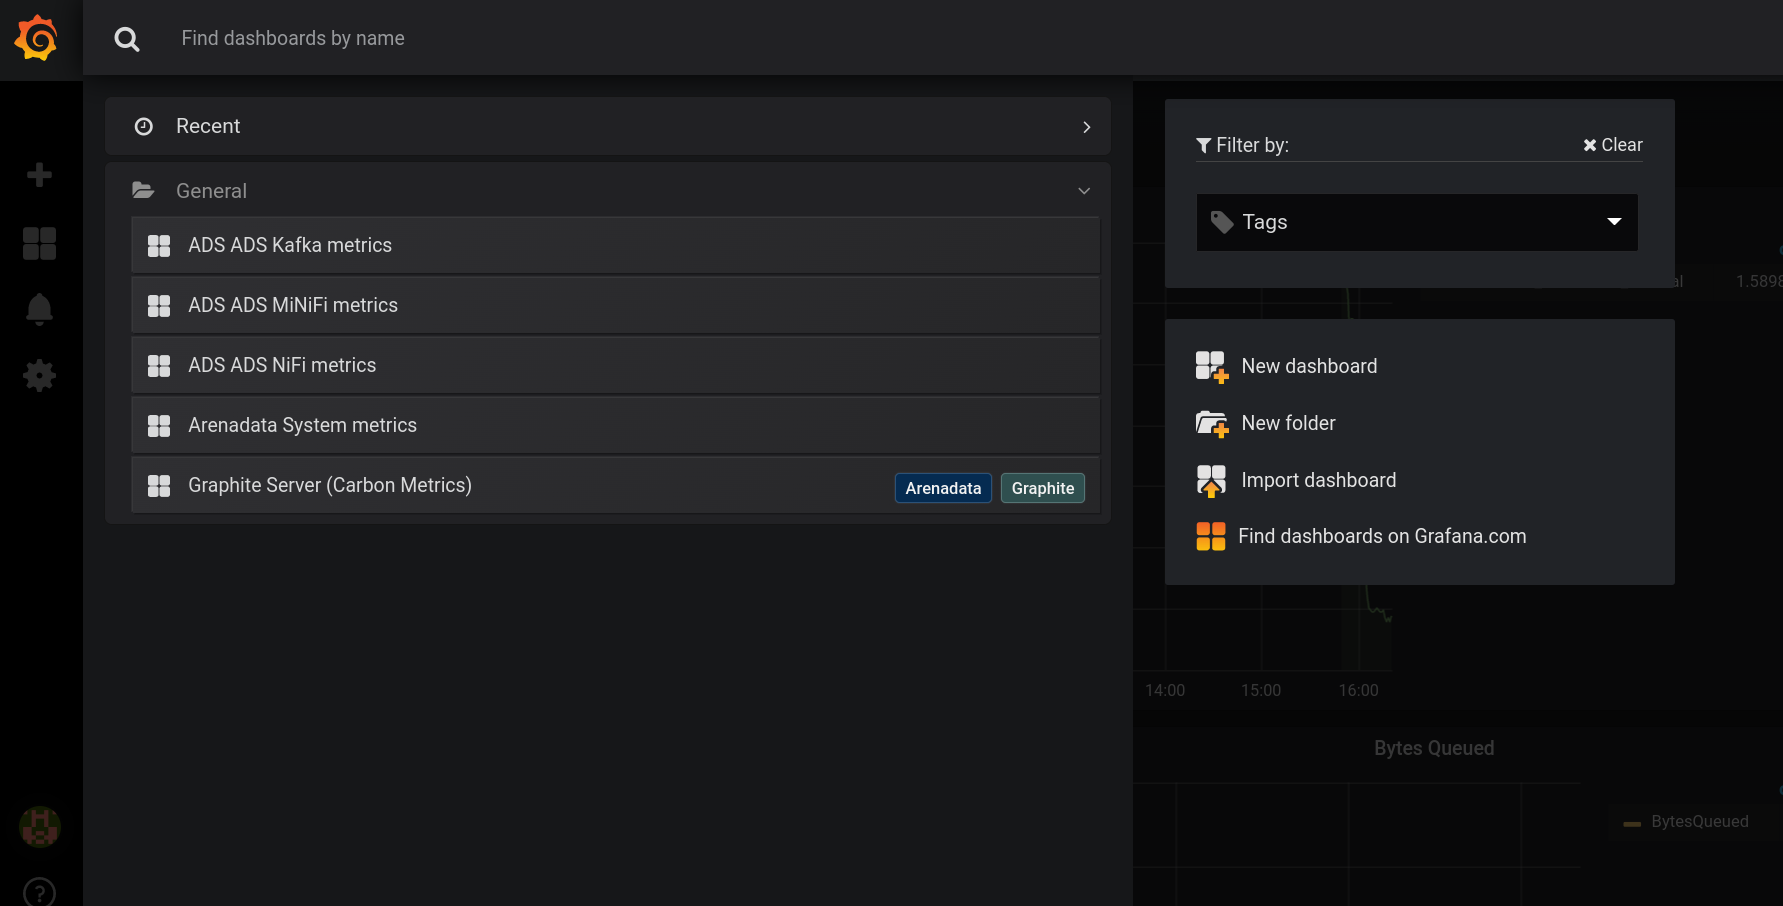 Switch to service metrics
 -
View available graphs.
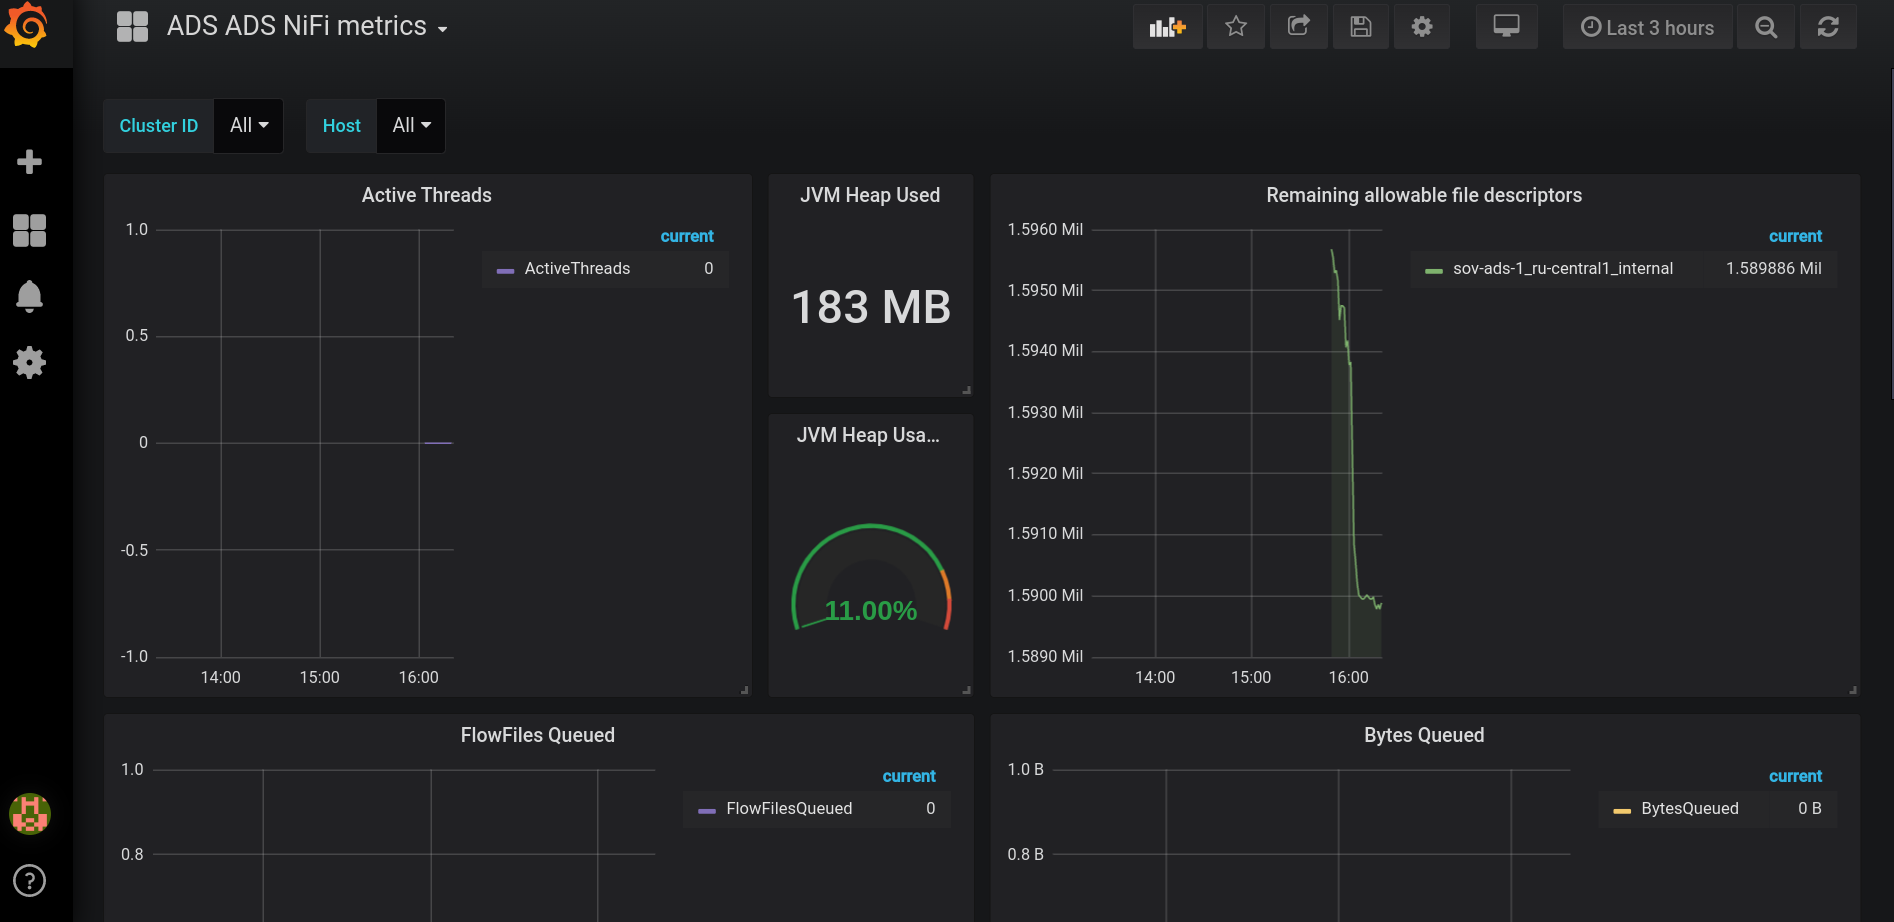 View service metrics