Databases panel
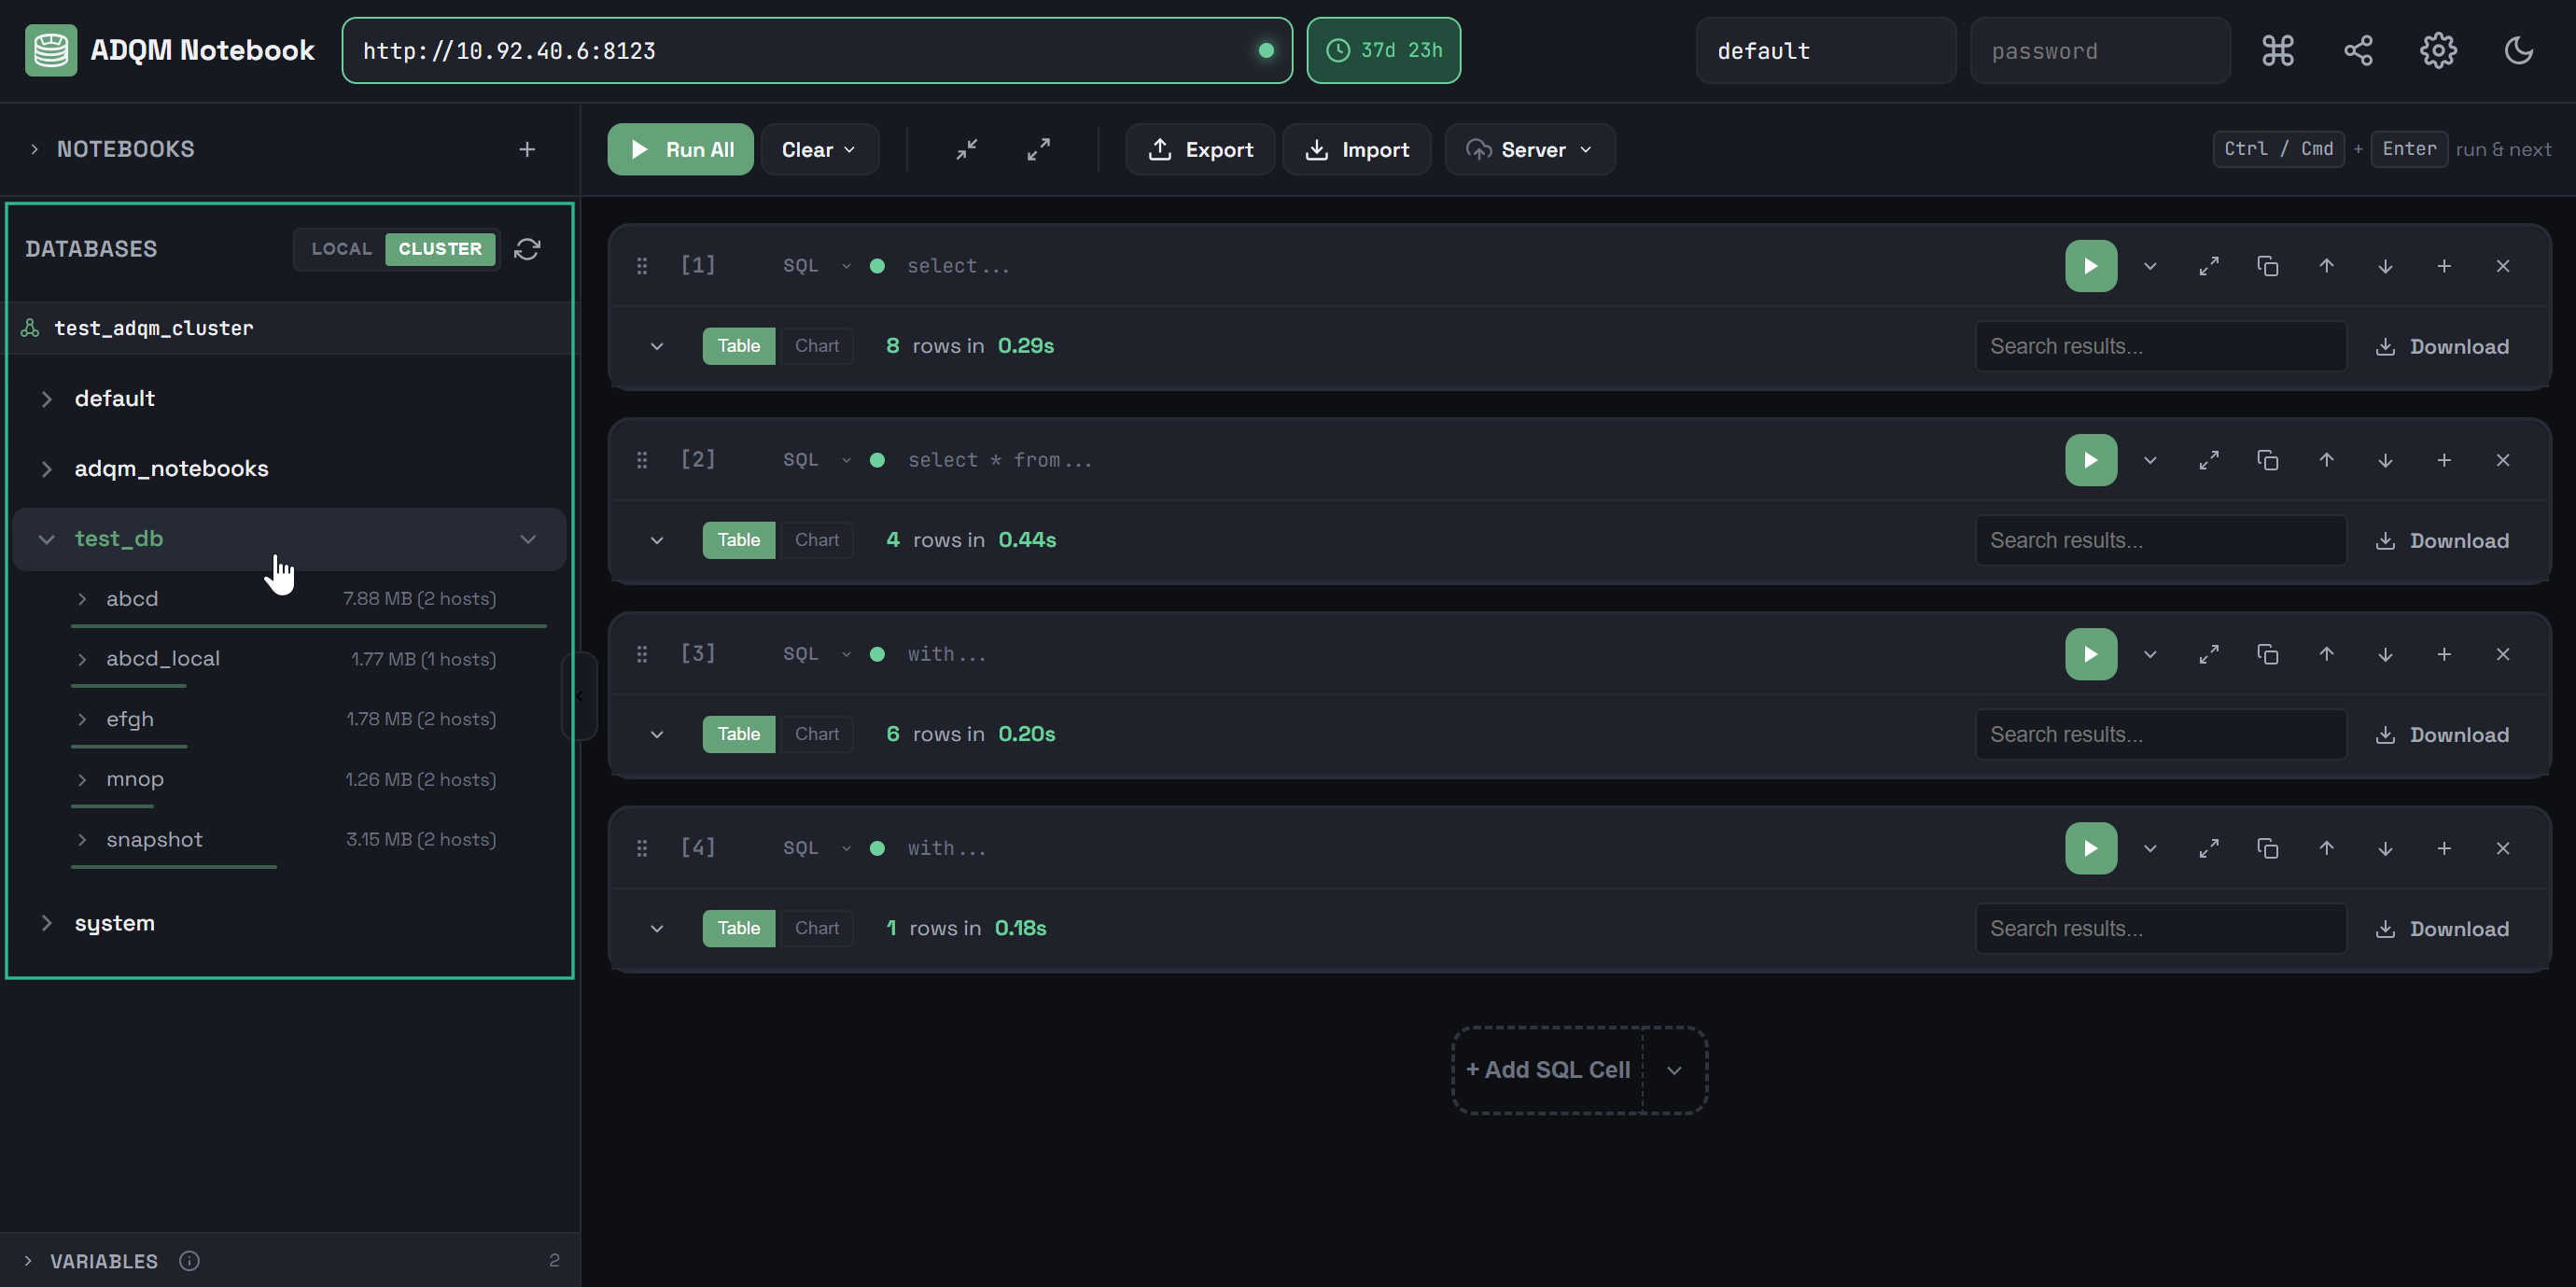
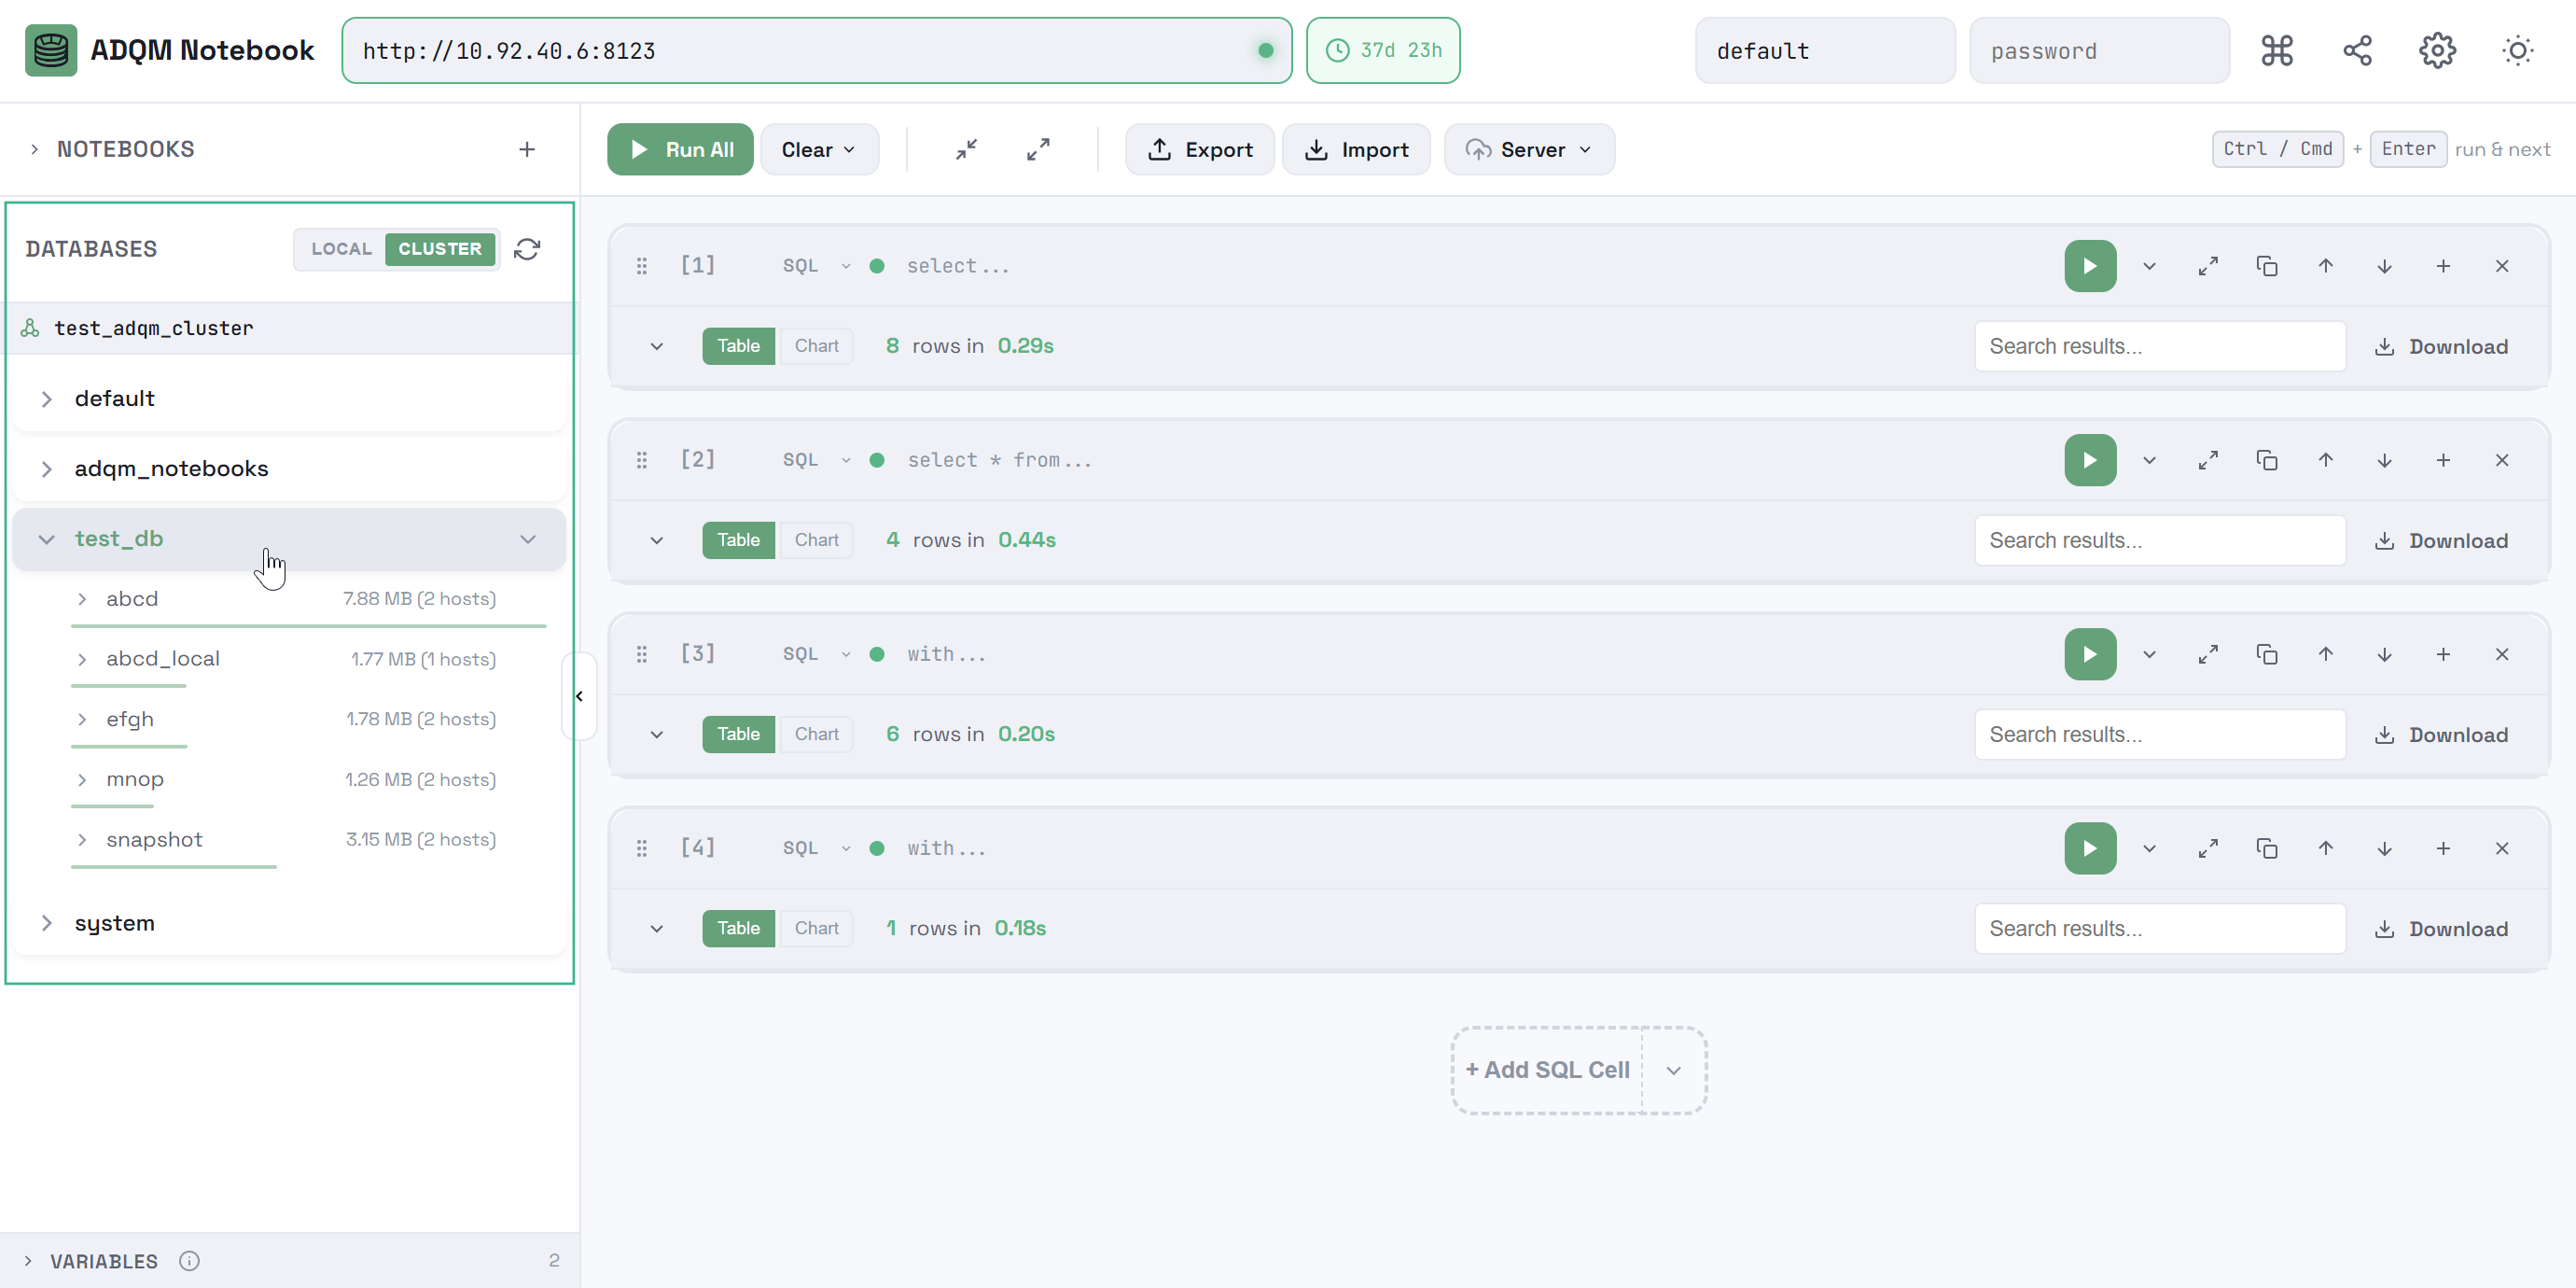
The DATABASES panel interactively displays information about ADQM databases and tables. If no logical cluster is defined in the ADQM configuration, the panel displays databases located on the current ADQM host.
If the configuration contains a definition of one or more clusters, the panel contains two tabs:
-
LOCAL — displays databases on the current ADQM host (the
information_schemadatabase is hidden); -
CLUSTER — displays a hierarchical tree of the cluster’s databases and tables (also without
information_schema). If the configuration defines a single cluster, it will be displayed on the tab by default. If multiple ADQM clusters are configured, the cluster to display in the DATABASES panel can be selected from the drop-down list.
When ADQM Notebook works via Chproxy, the LOCAL/CLUSTER switch is missing — the panel always displays the tree of databases and tables for the selected cluster.
Clicking the ![]()
![]() Refresh icon updates information on databases and tables.
Refresh icon updates information on databases and tables.
Above the list of databases/tables/columns, there is a field for filtering data — when you enter any substring, filtering is performed at the all-objects levels simultaneously.
Tables
To expand a database and view the tables it contains, click a database row. Each table row displays the table size, and a color indicator allows you to visually compare the table size with the largest table in the database. On the CLUSTER tab, it also displays the number of shards and replicas where the table data is located.
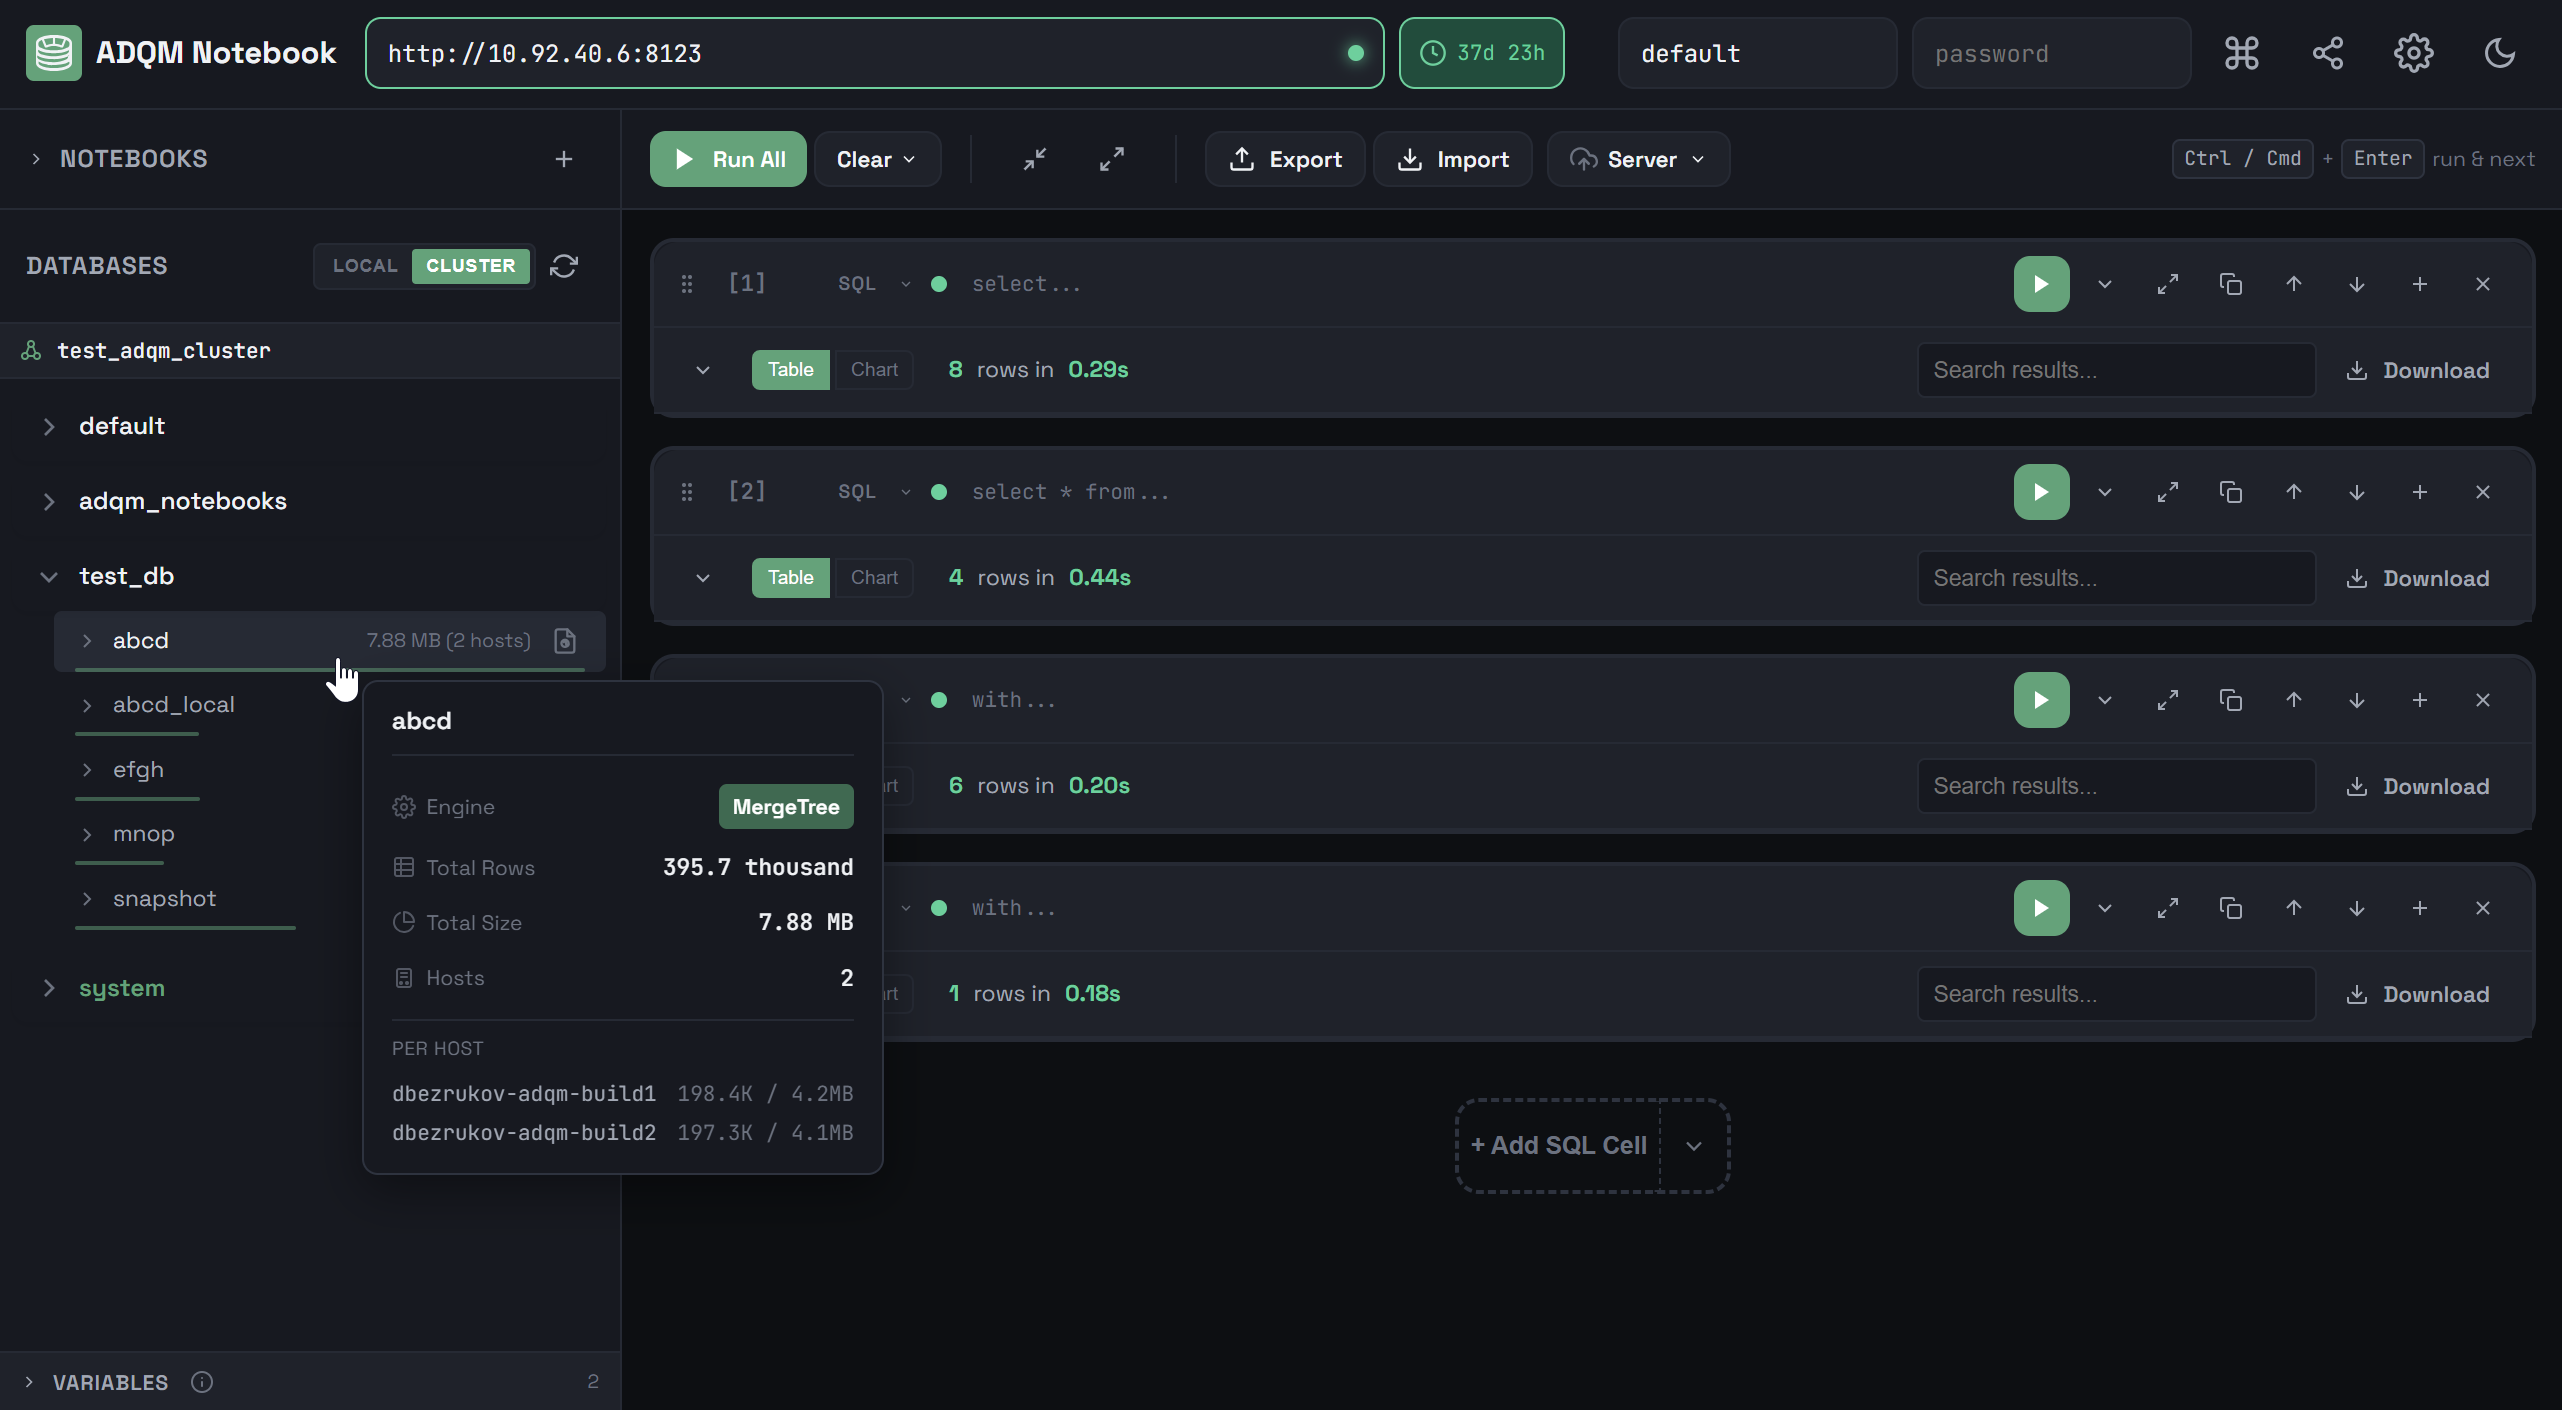
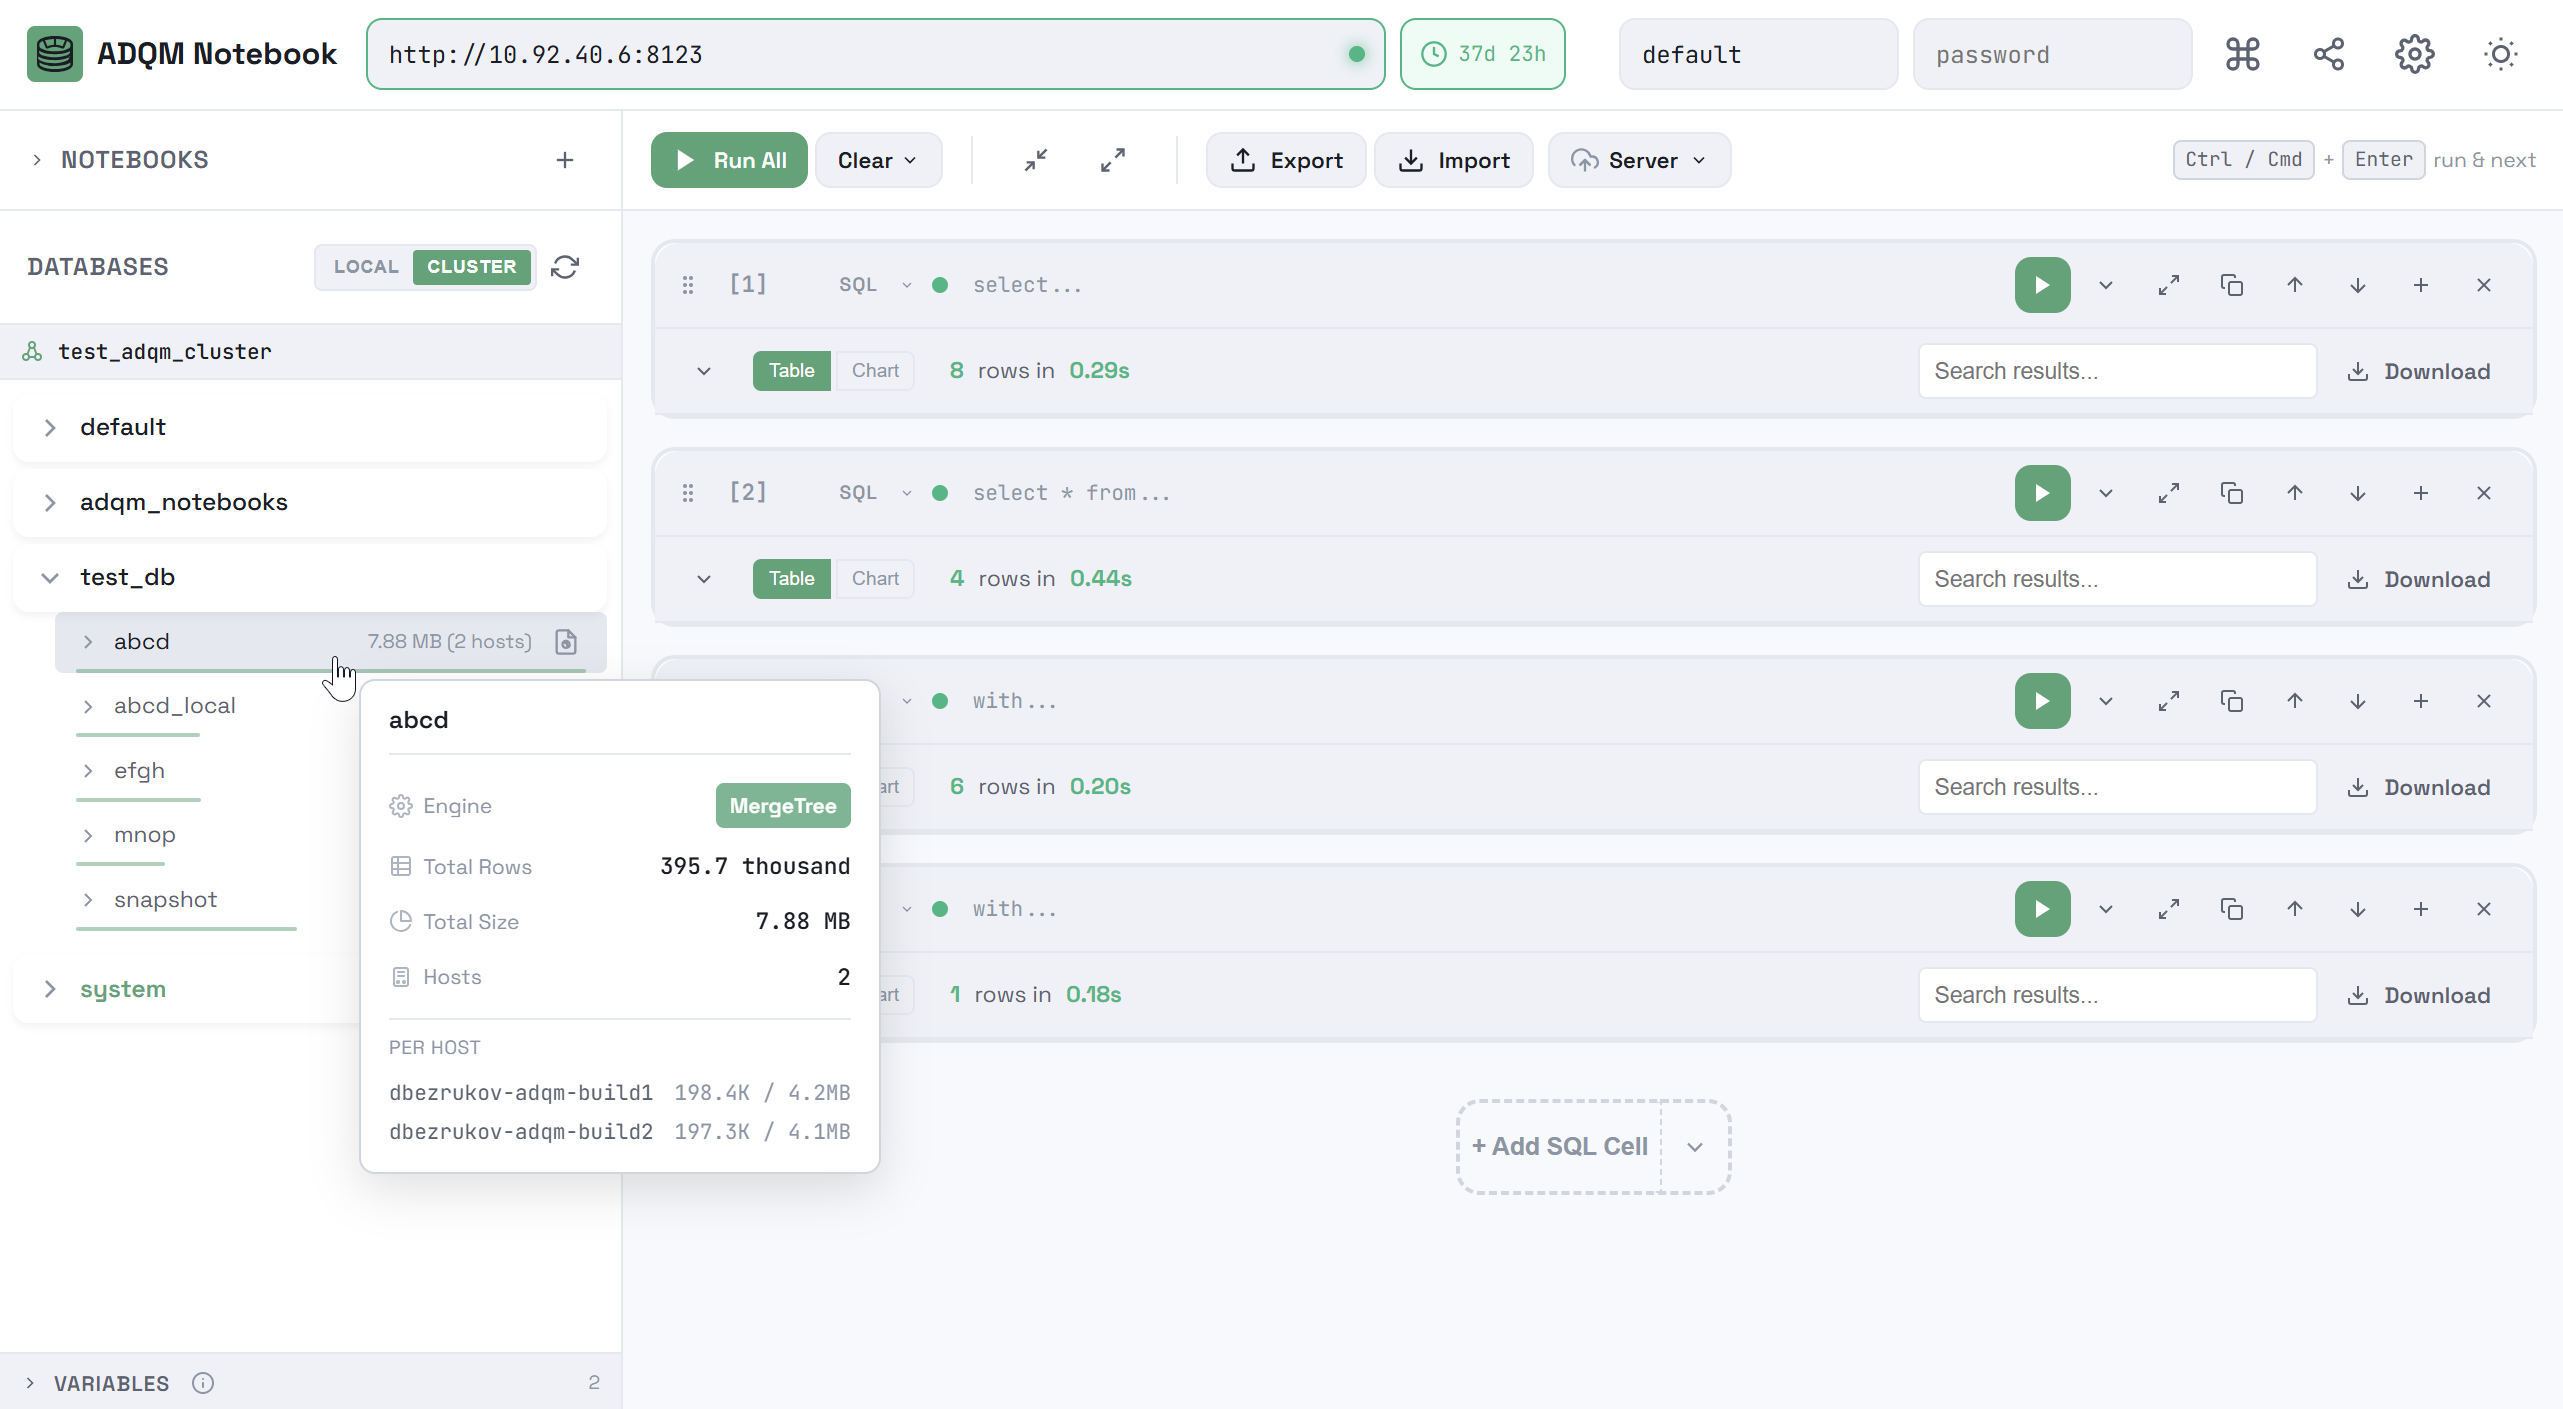
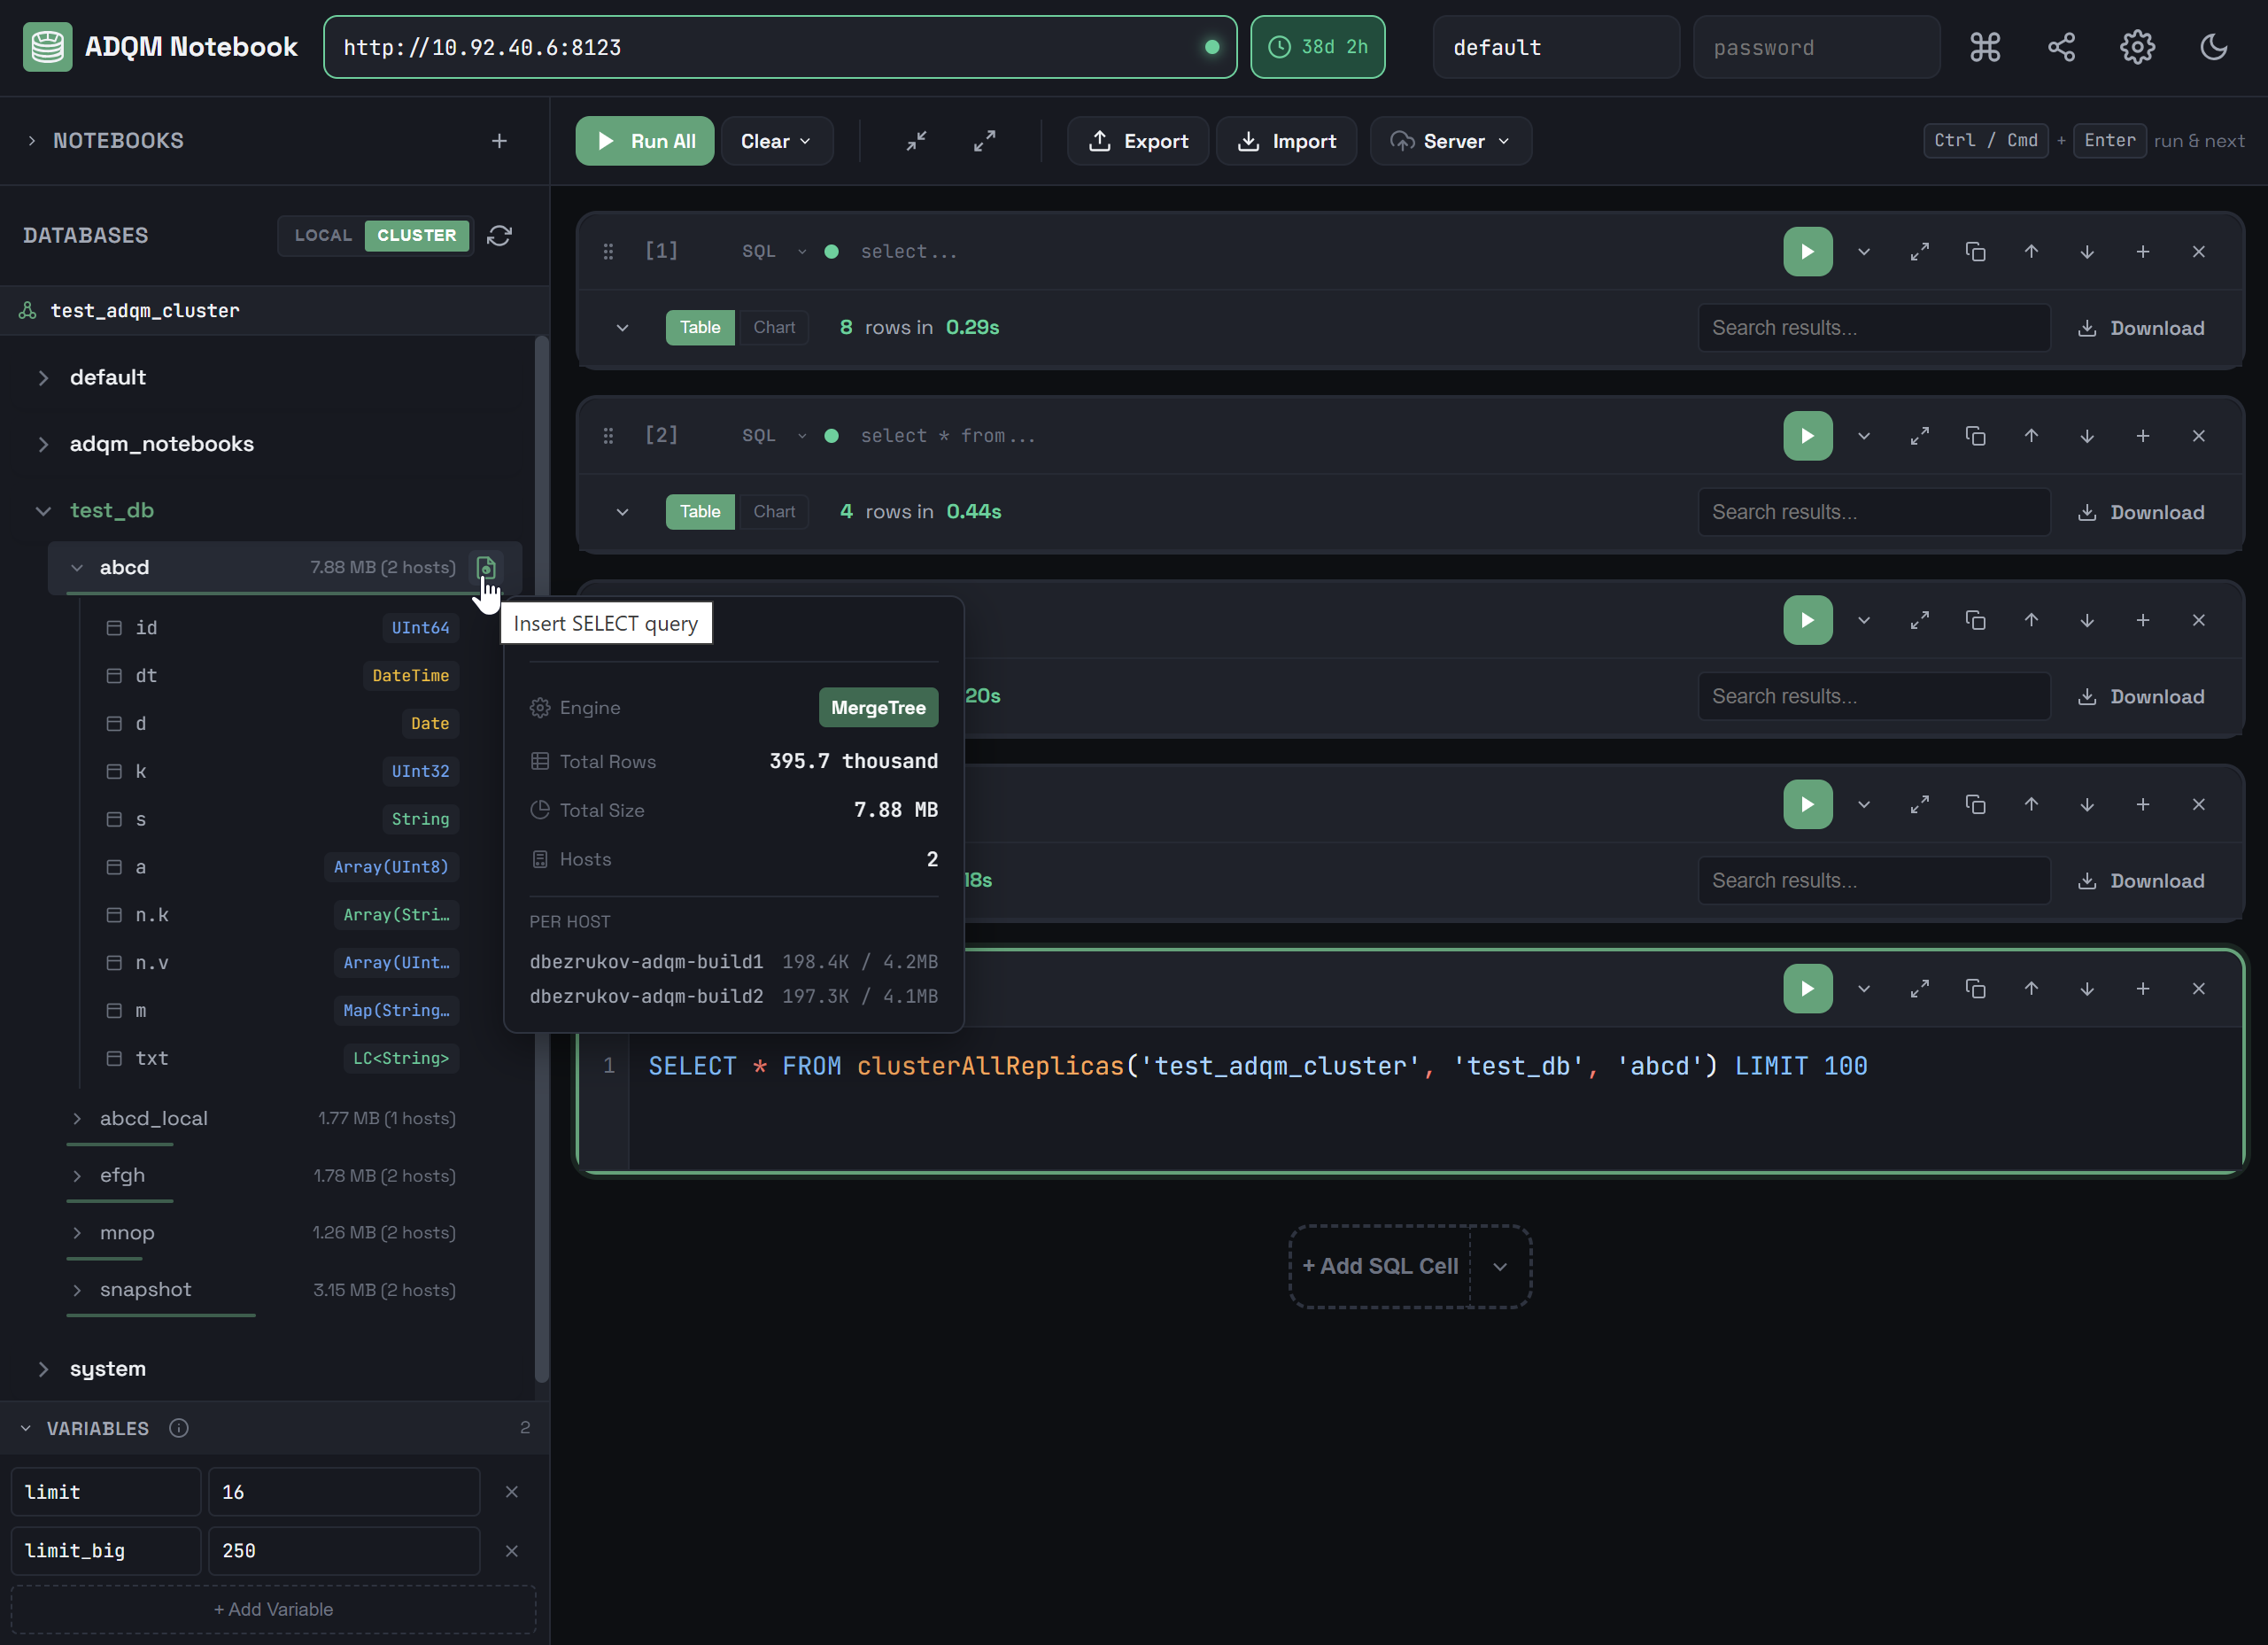
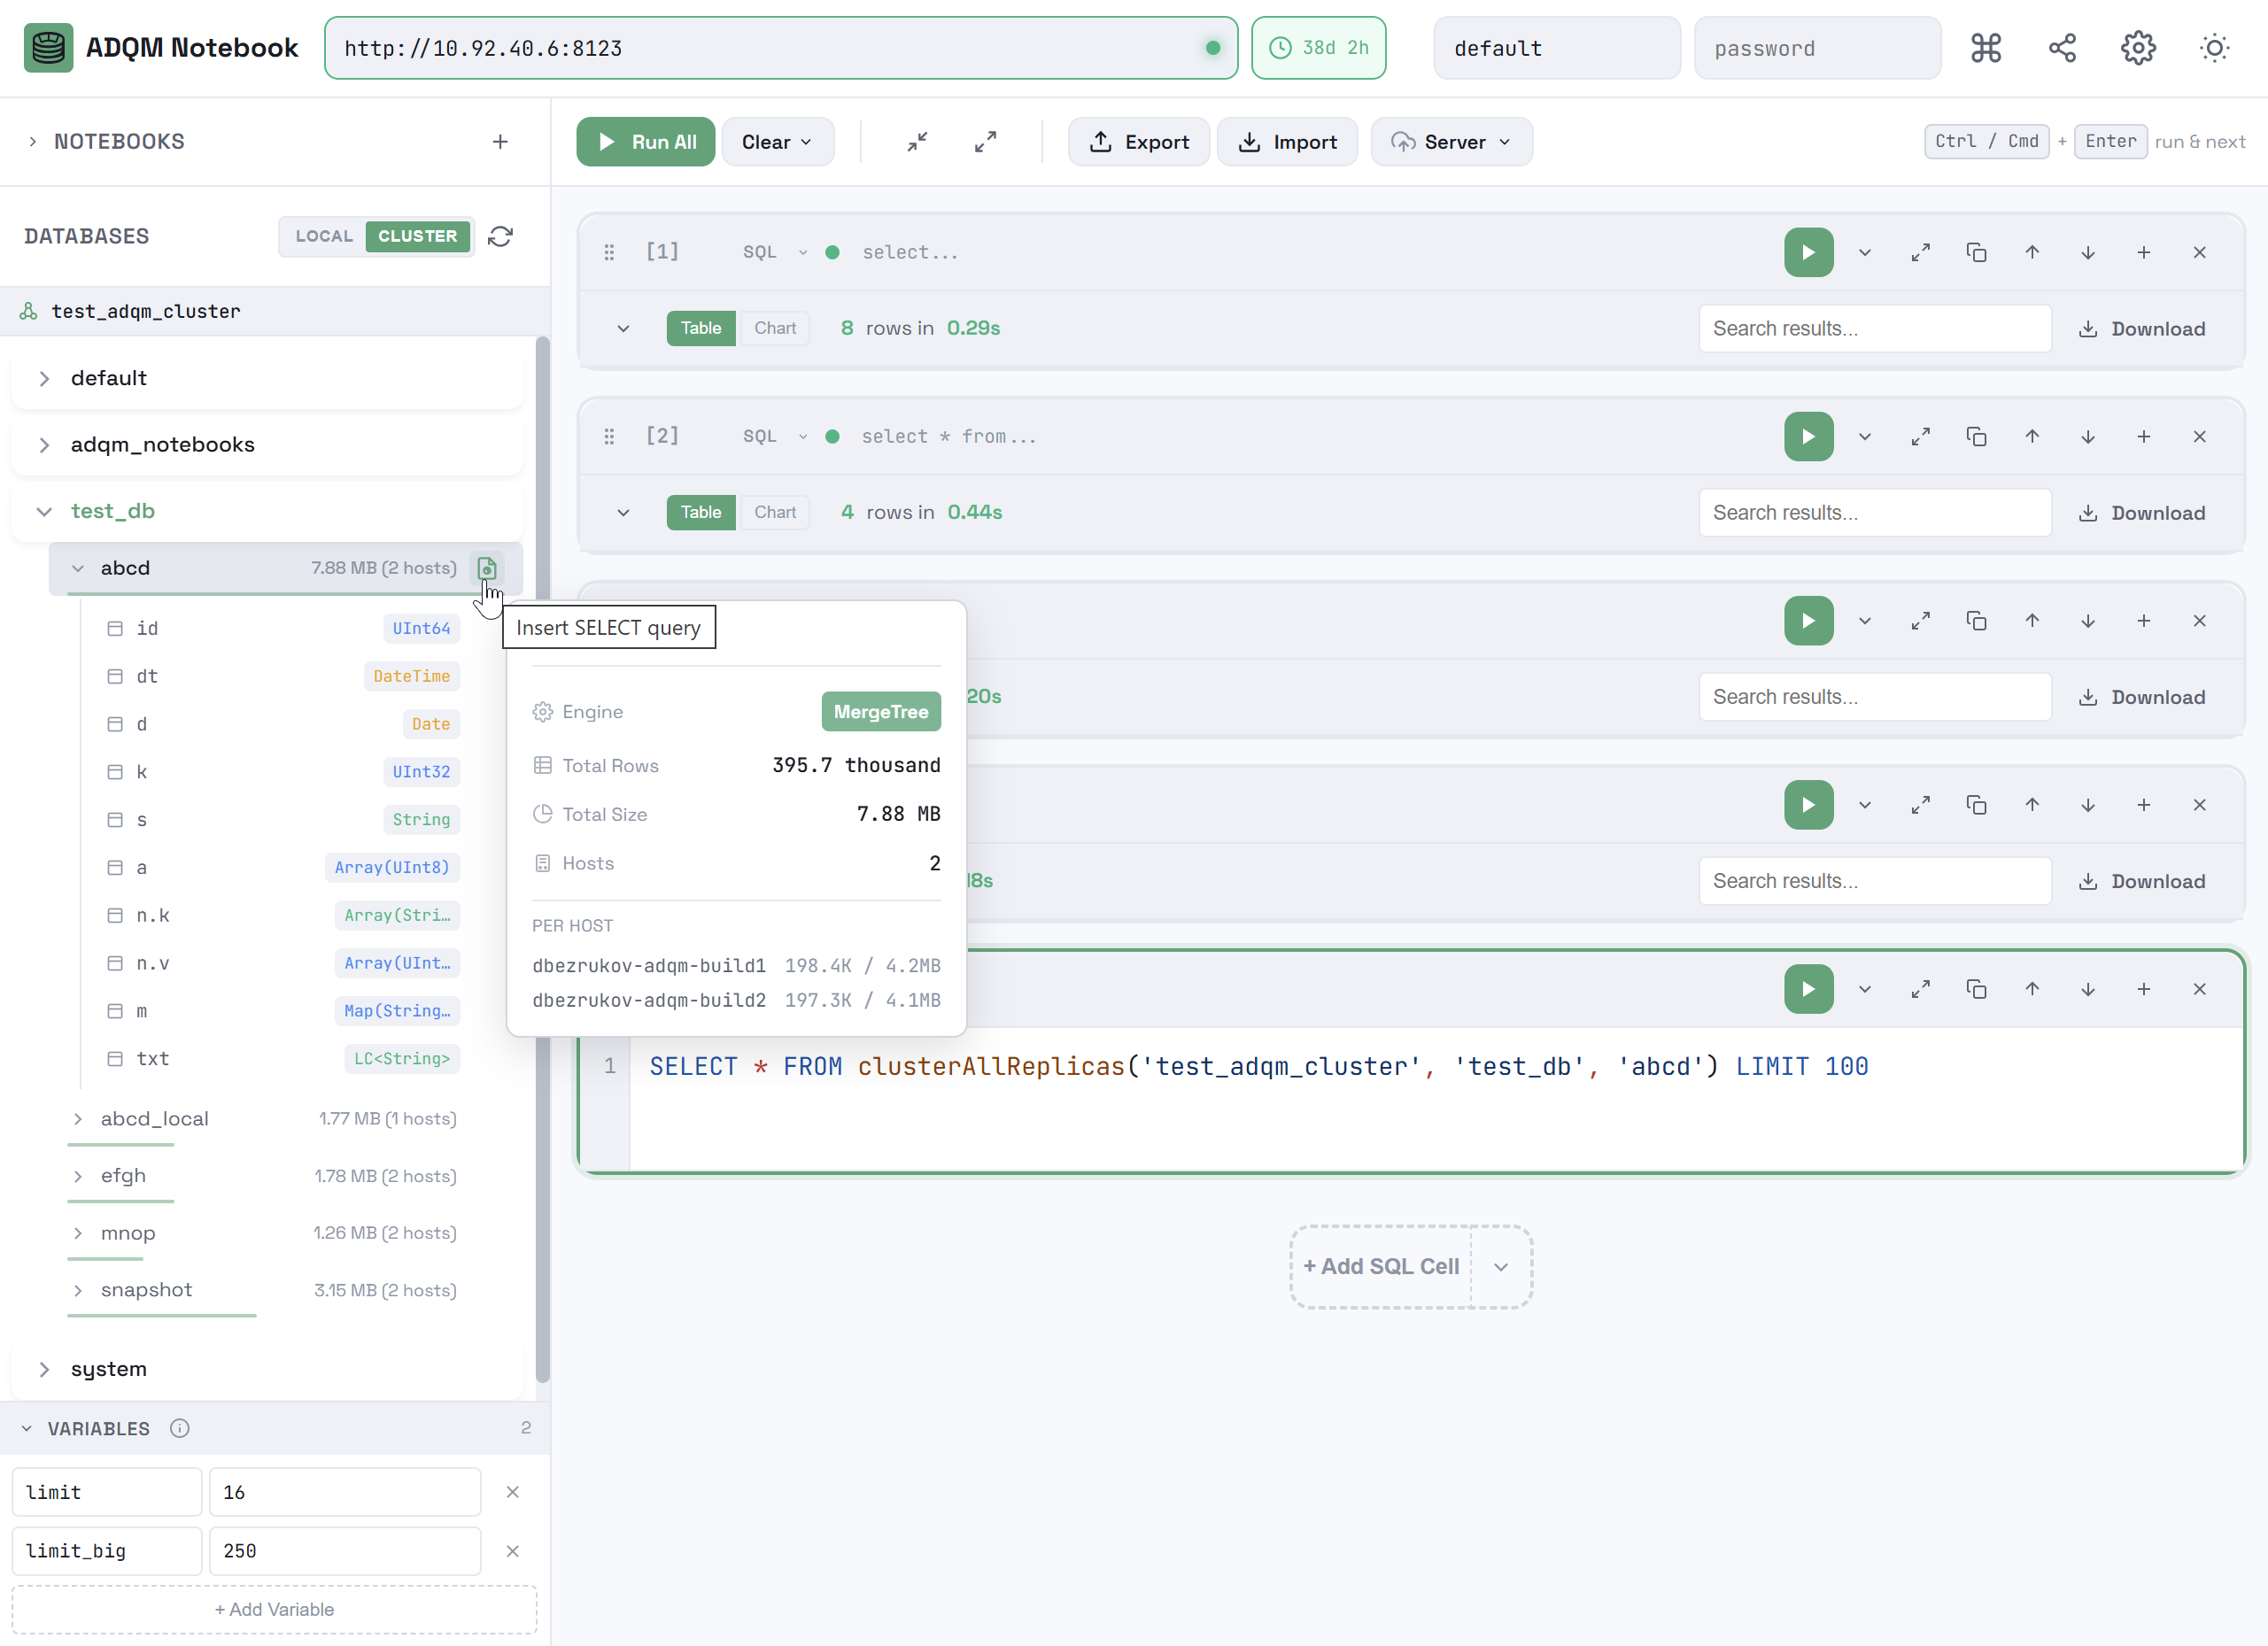
When hovering over a row that corresponds to a data table, you can view additional information about the table in a tooltip: table engine, total number of rows, total size, and data distribution across hosts (on the CLUSTER tab).
Right-clicking a table row opens a context menu that you can use to automatically insert a query accessing this table into the selected SQL cell (or into a new one if no cell is selected) for execution on a local host or cluster, depending on whether the LOCAL or CLUSTER tab is selected in the DATABASES panel.
You can insert the following queries from the context menu:
-
SELECT * … LIMIT 100 — a query to read 100 rows from a table.
LOCALSELECT * FROM "<database_name>"."<table_name>" LIMIT 100CLUSTERSELECT * FROM clusterAllReplicas('<cluster_name>', '<database_name>', '<table_name>') LIMIT 100 -
SELECT count(*) — a query to get the total number of rows in a table.
LOCALSELECT count(*) FROM "<database_name>"."<table_name>"CLUSTERSELECT count(*) FROM clusterAllReplicas('<cluster_name>', '<database_name>', '<table_name>') -
DESCRIBE TABLE — a query to get detailed information about the table structure.
LOCAL and CLUSTERDESCRIBE TABLE "<database_name>"."<table_name>" -
SHOW CREATE TABLE — a query to get the command used to create a table.
LOCAL and CLUSTERSHOW CREATE TABLE "<database_name>"."<table_name>"
In each of the above query examples, the name of the table for which the context menu is called, as well as the name of the database and cluster, are referred as <table_name>, <database_name>, and <cluster_name>, respectively — when you paste the query into a cell, these placeholders will be automatically substituted with the actual names of the corresponding objects.
Table columns
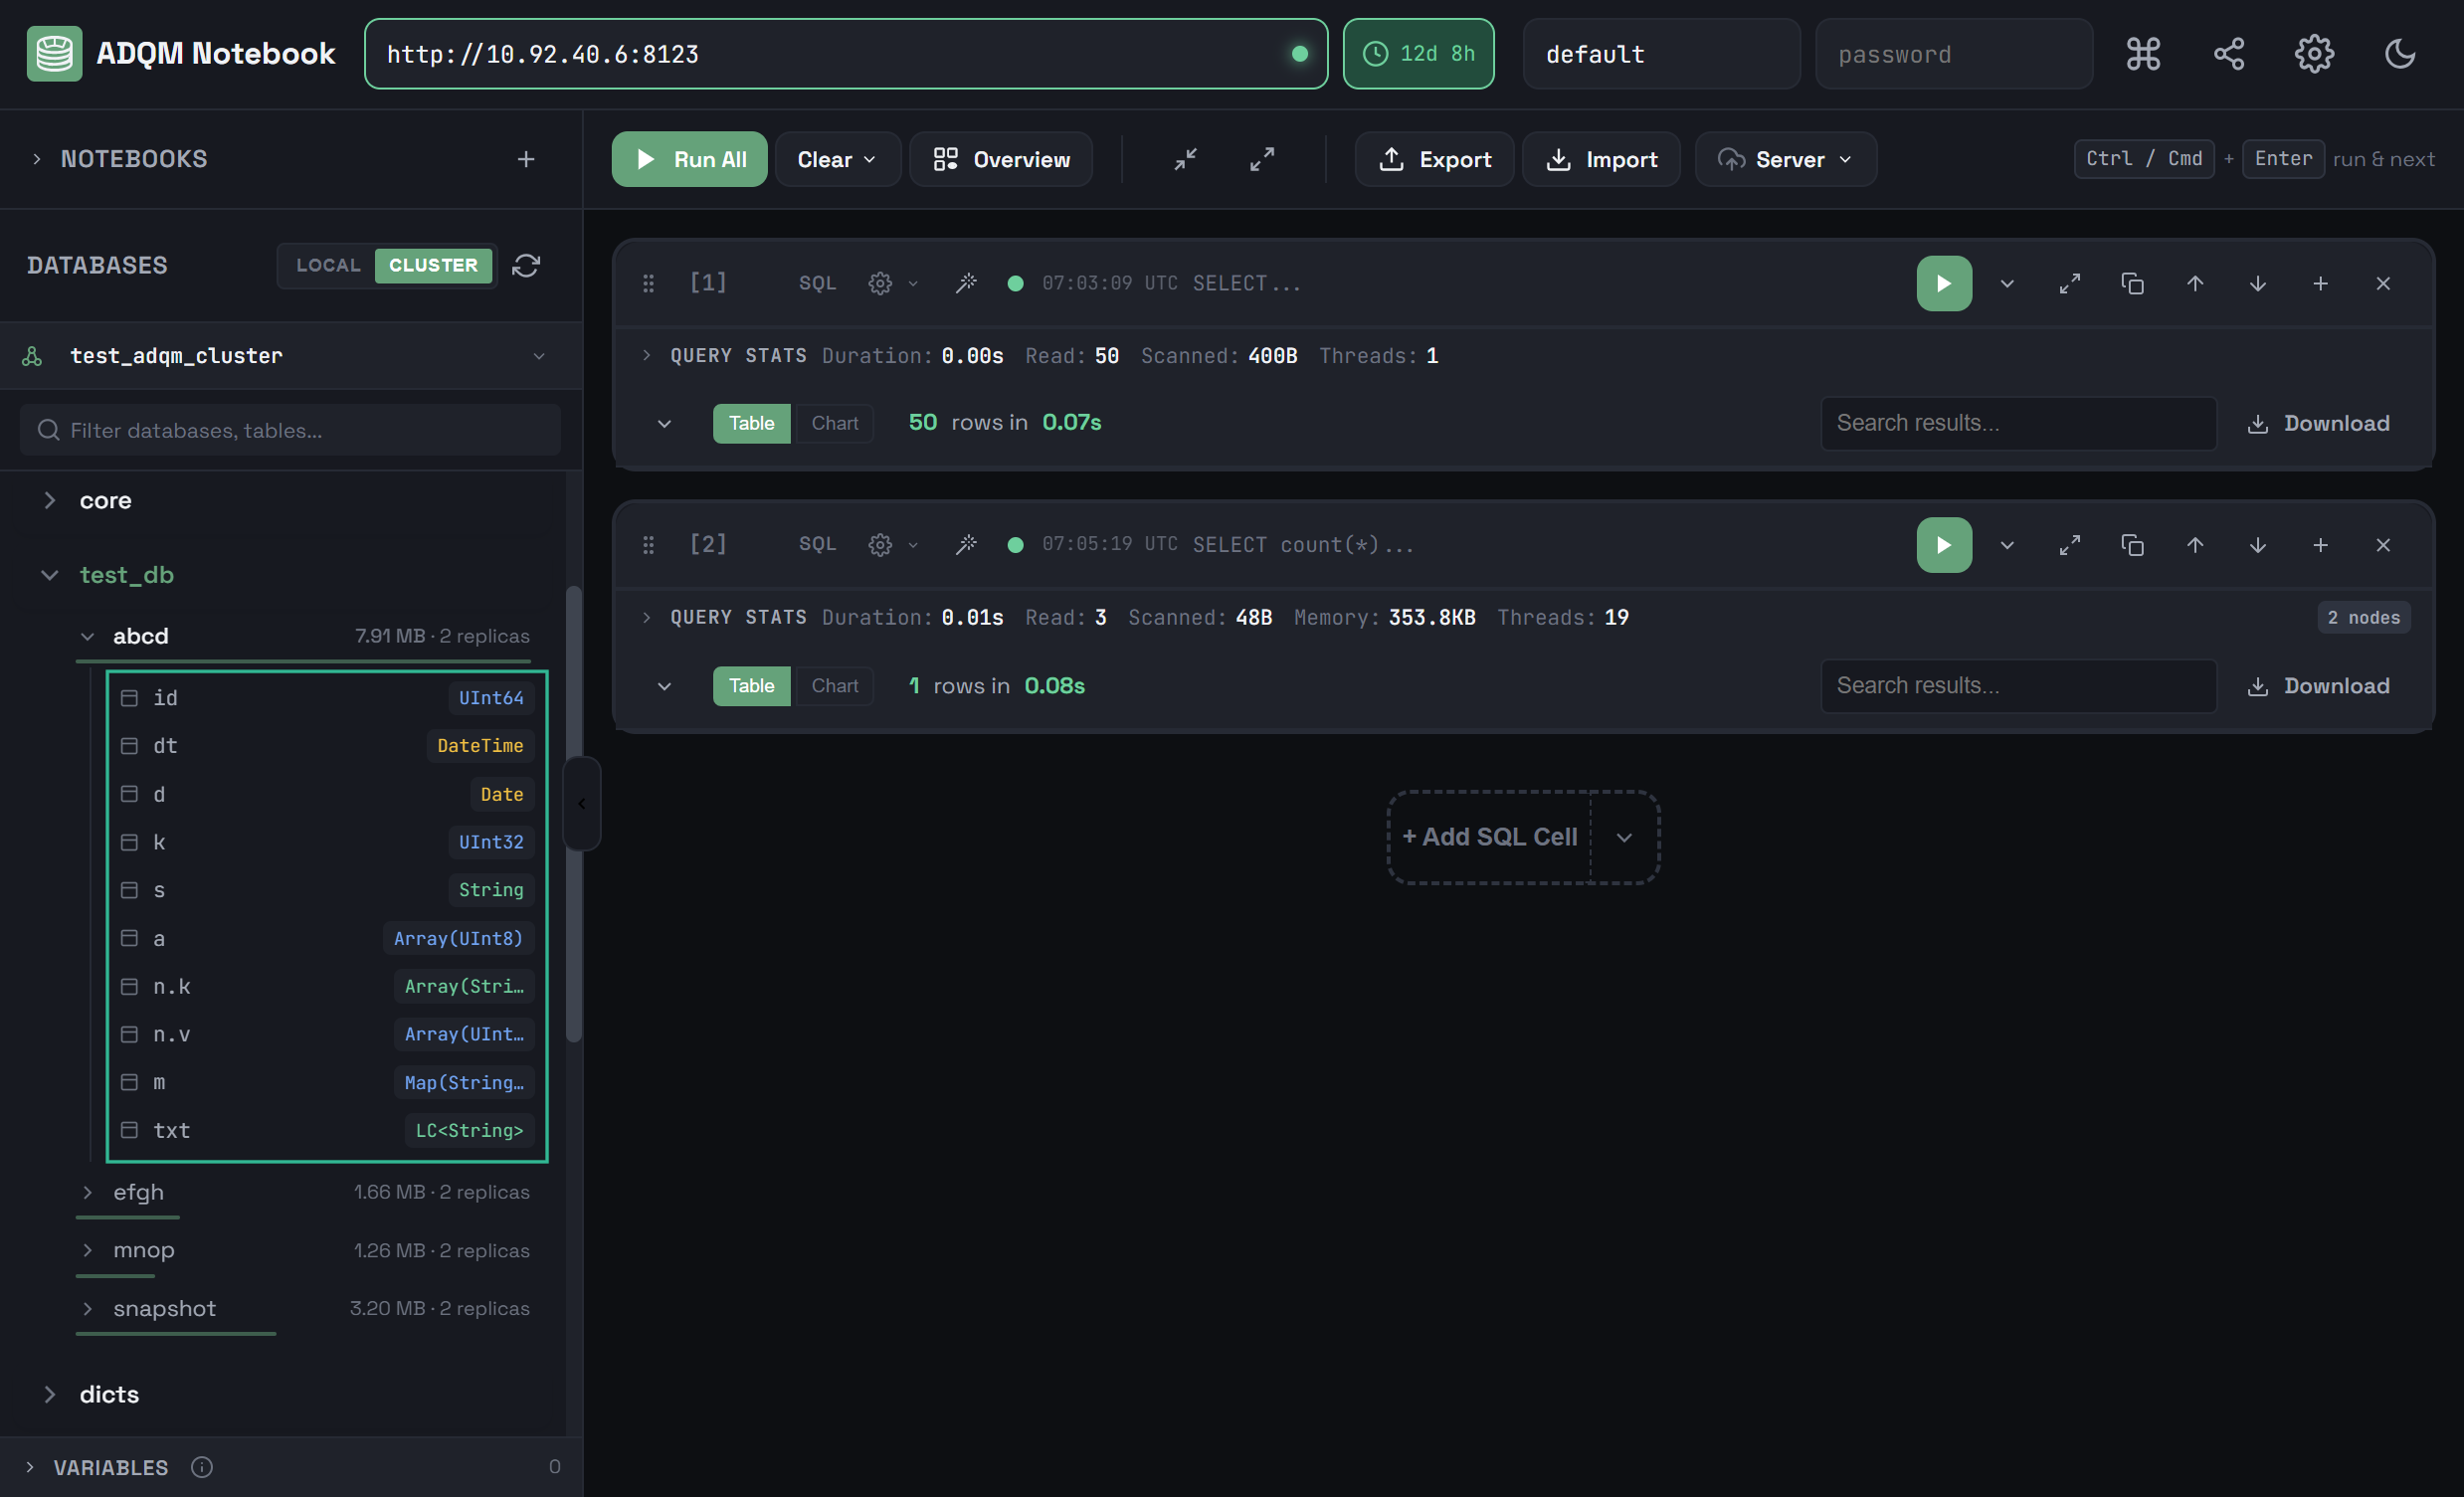
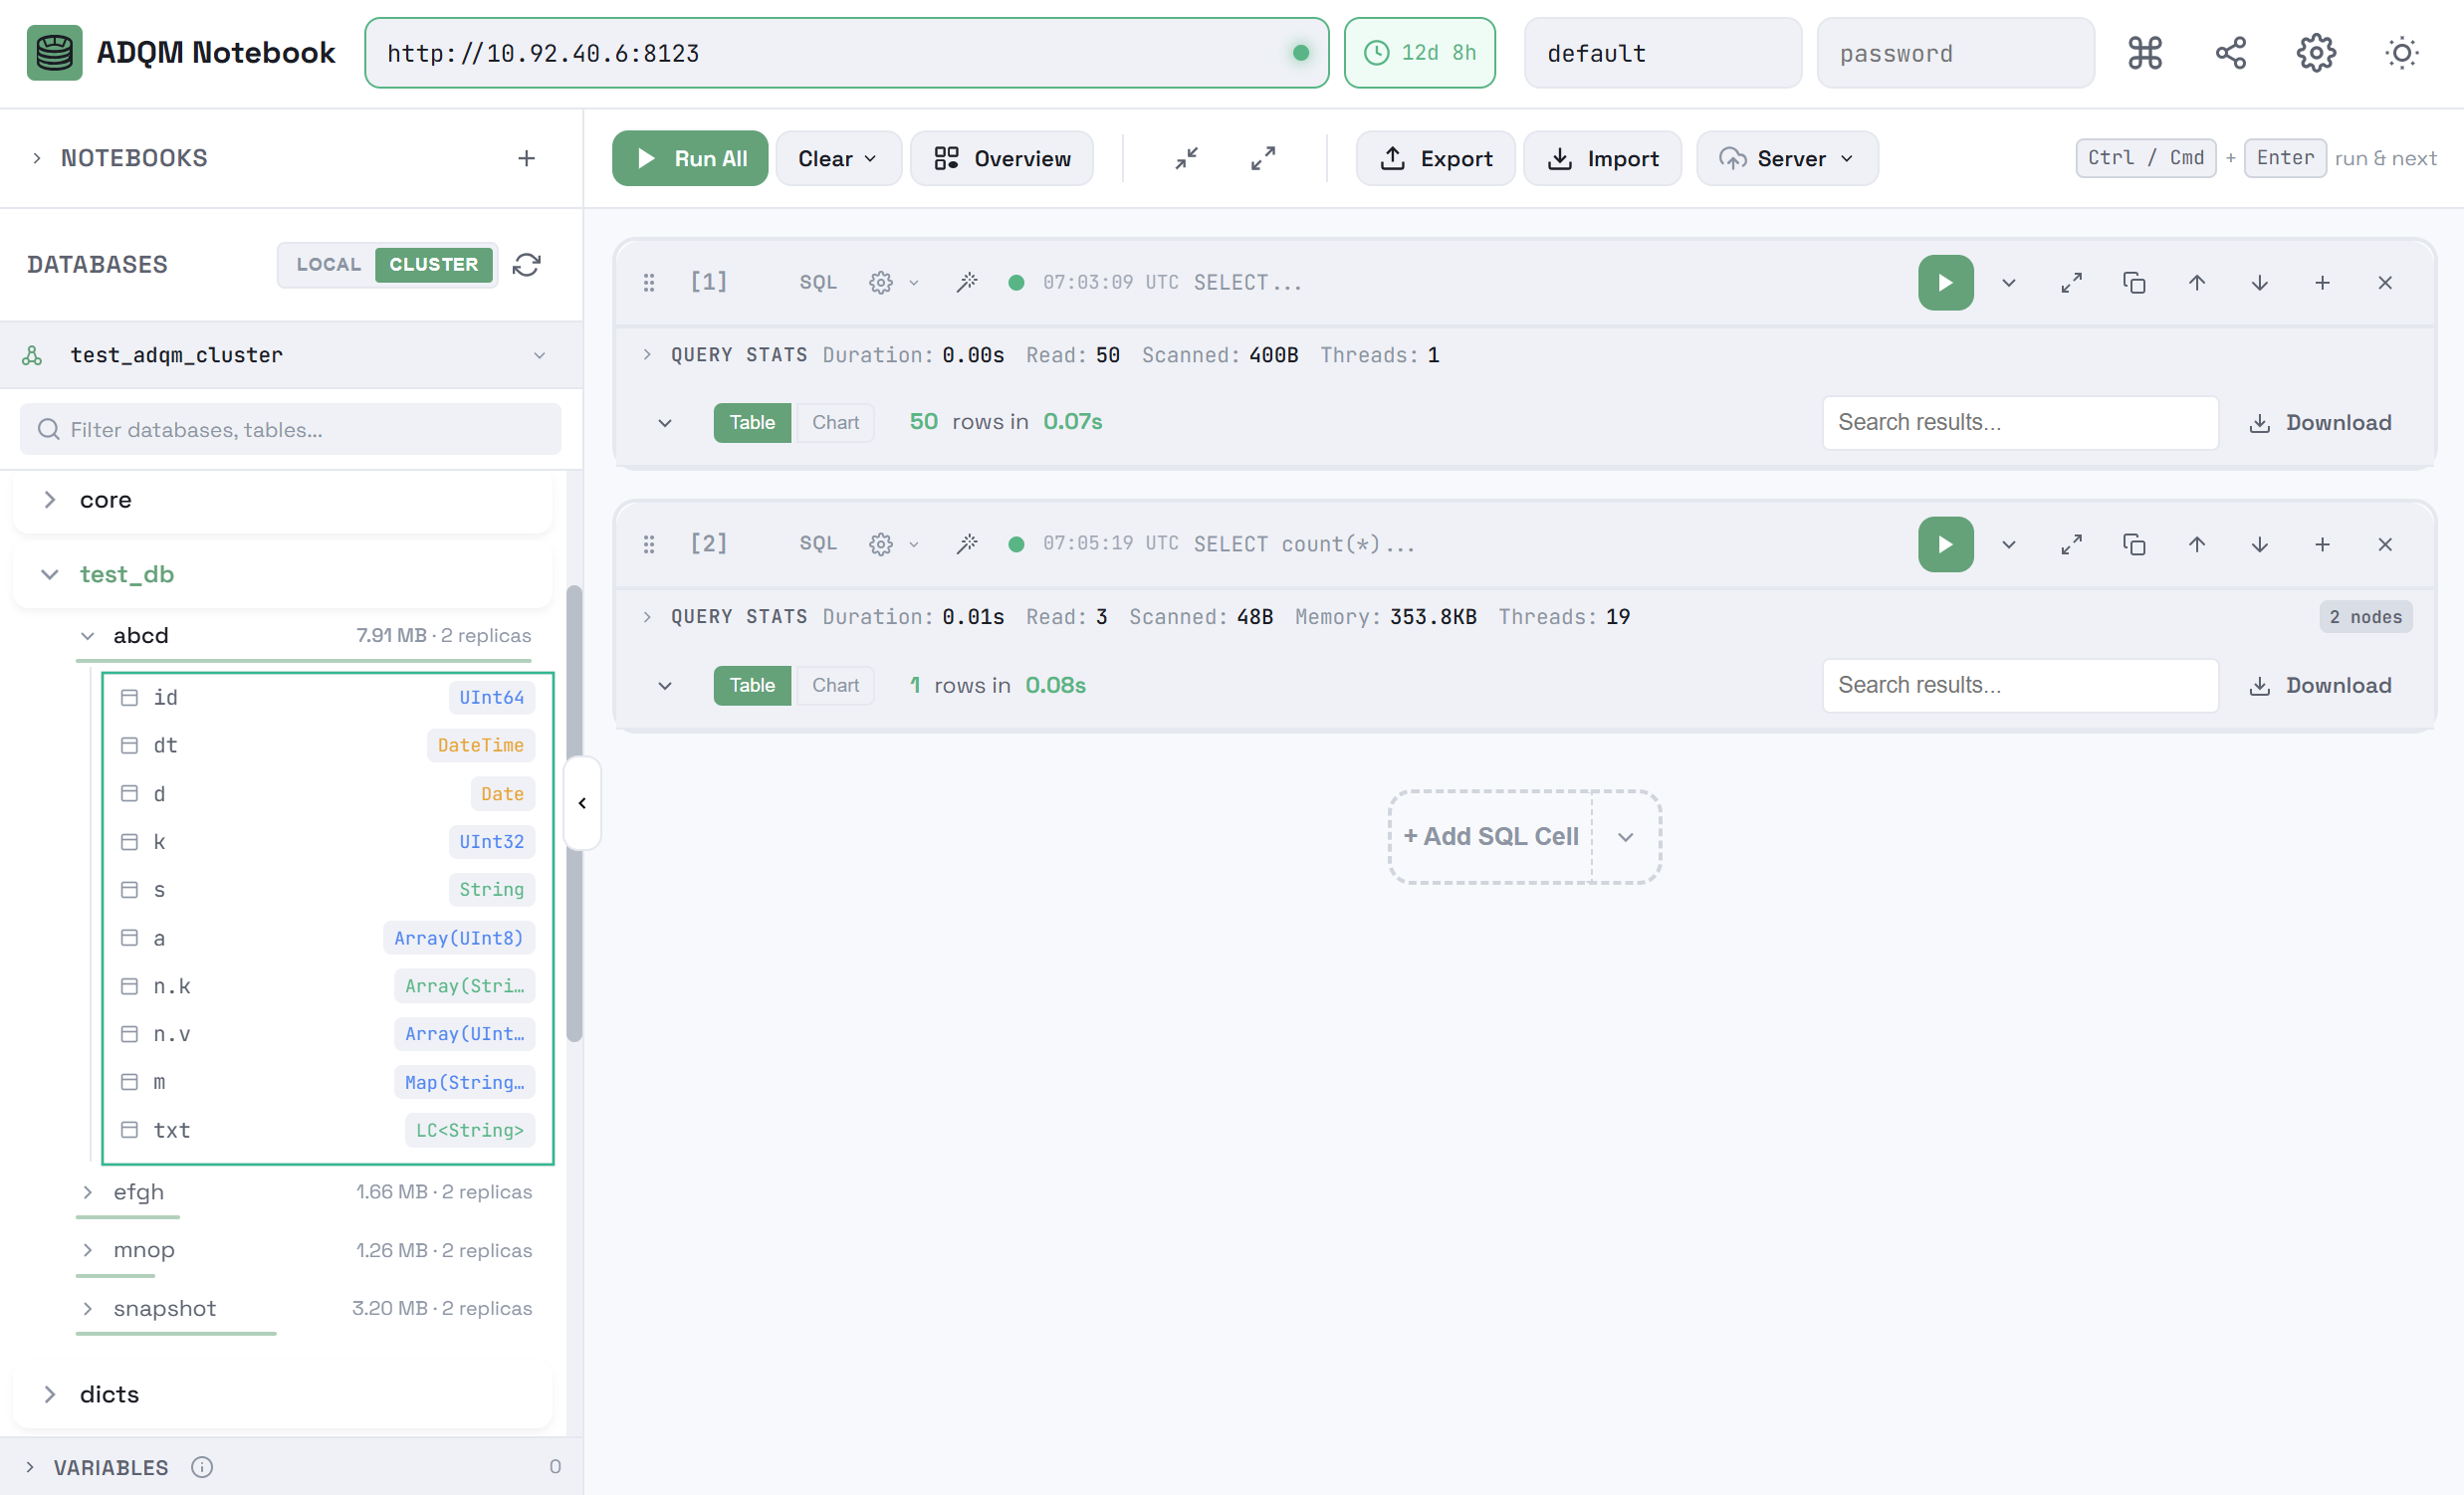
To expand a table and view its columns, click a table row. For each column, its name and data type are displayed.
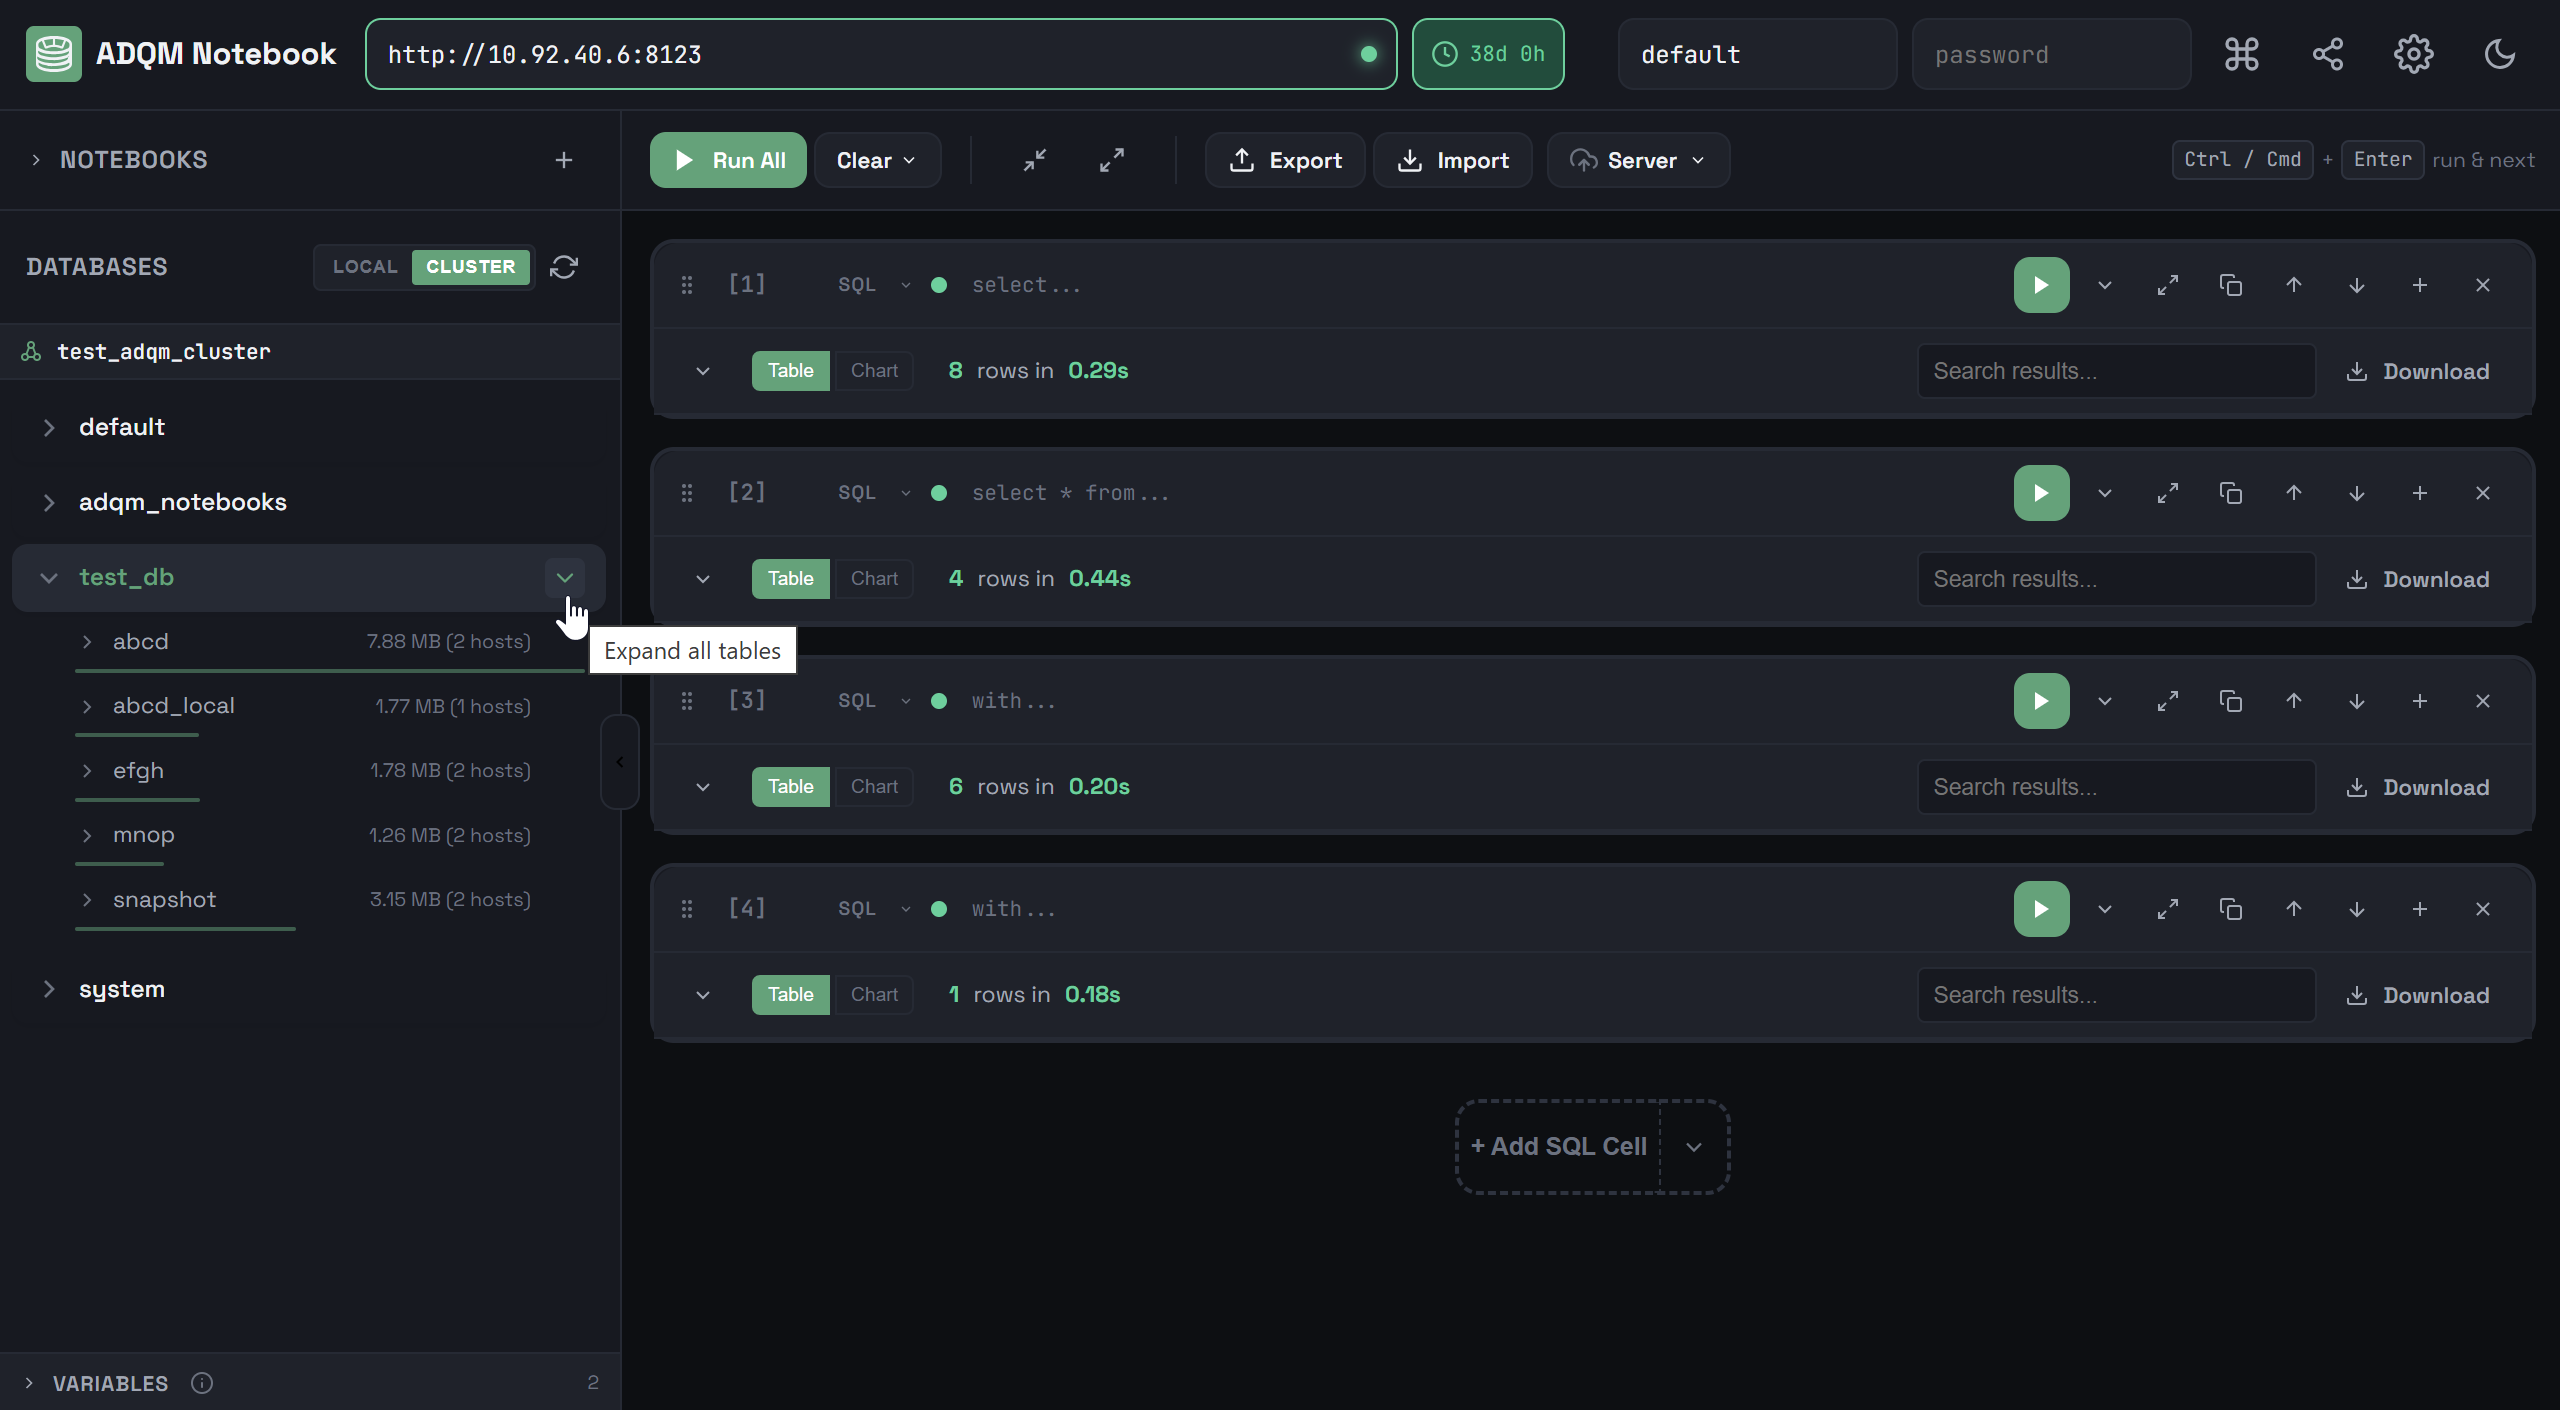
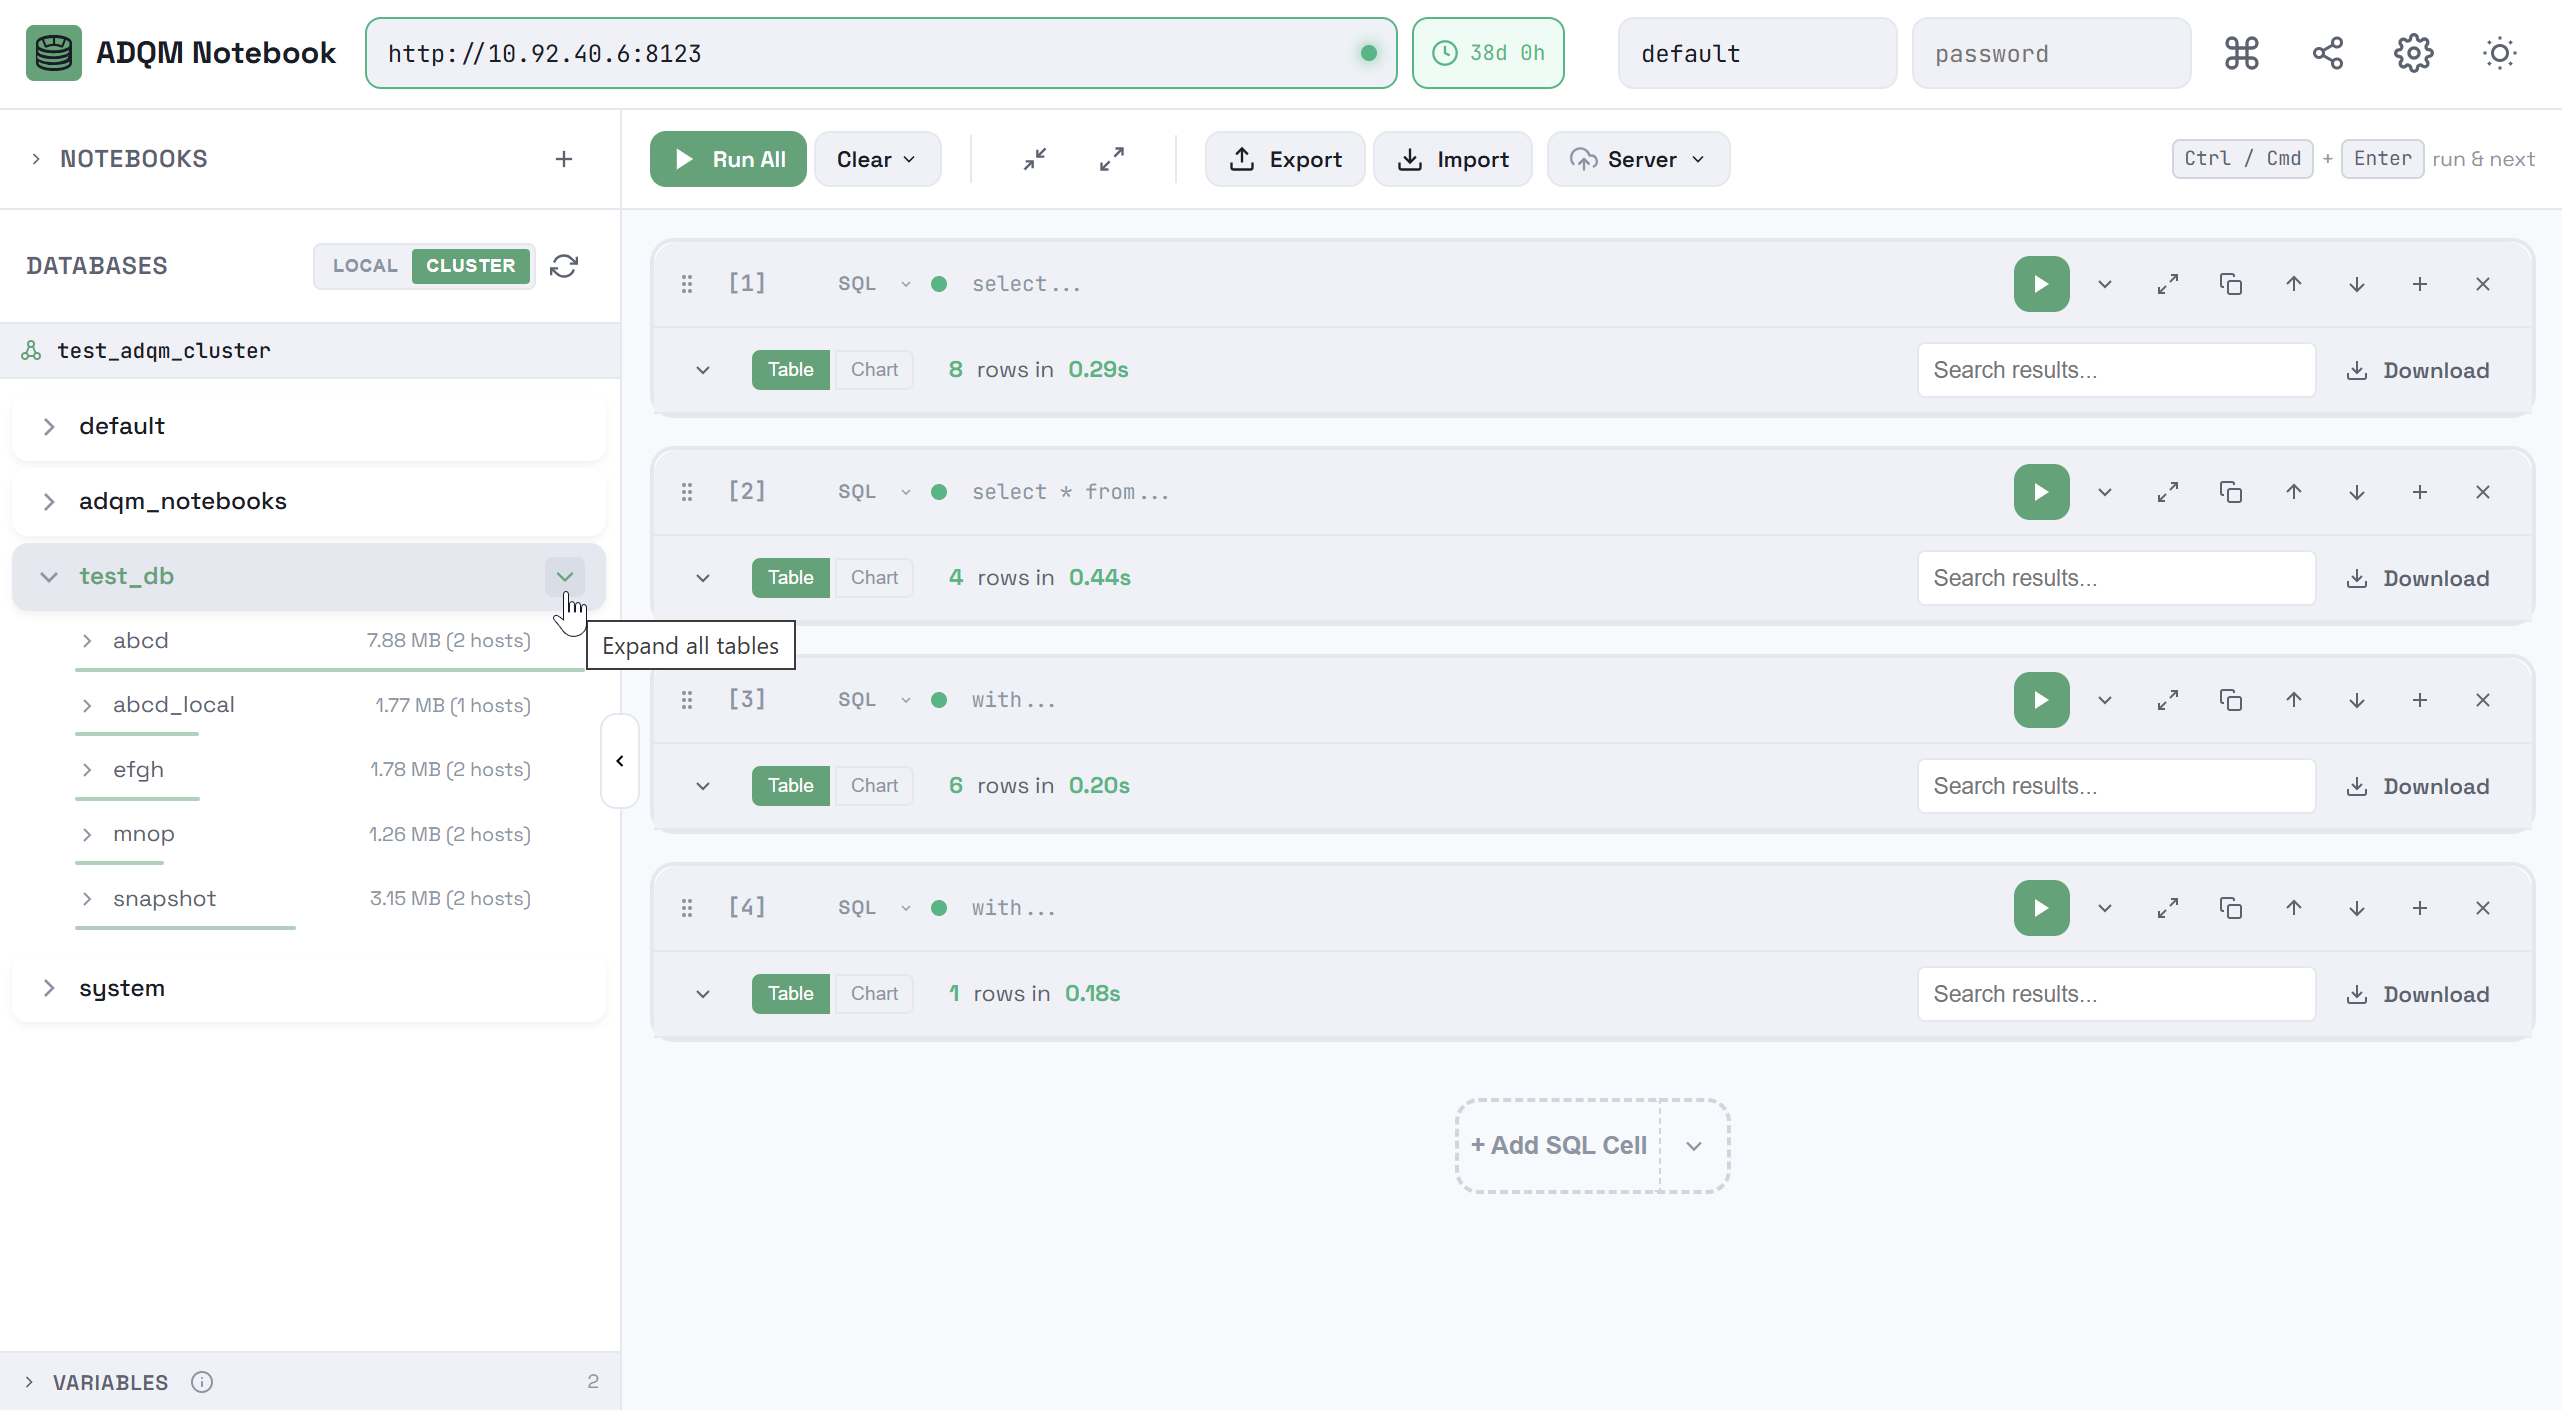
To expand the structure of all tables within a database, in the database row, click the ![]()
![]() Expand all tables icon, which becomes visible when you hover the mouse cursor over the database in the DATABASES panel (if all tables are already expanded, the
Expand all tables icon, which becomes visible when you hover the mouse cursor over the database in the DATABASES panel (if all tables are already expanded, the ![]()
![]() Collapse all tables icon in the database row allows collapsing them).
Collapse all tables icon in the database row allows collapsing them).
Context menu
Right-clicking a row corresponding to a table column opens a context menu that allows you to quickly insert the column name or one of the predefined queries referencing the column into the query editor of the selected SQL cell (or into a new cell if no one is selected) for execution on a local host or ADQM cluster, depending on the tab selected in the DATABASES panel (LOCAL or CLUSTER).
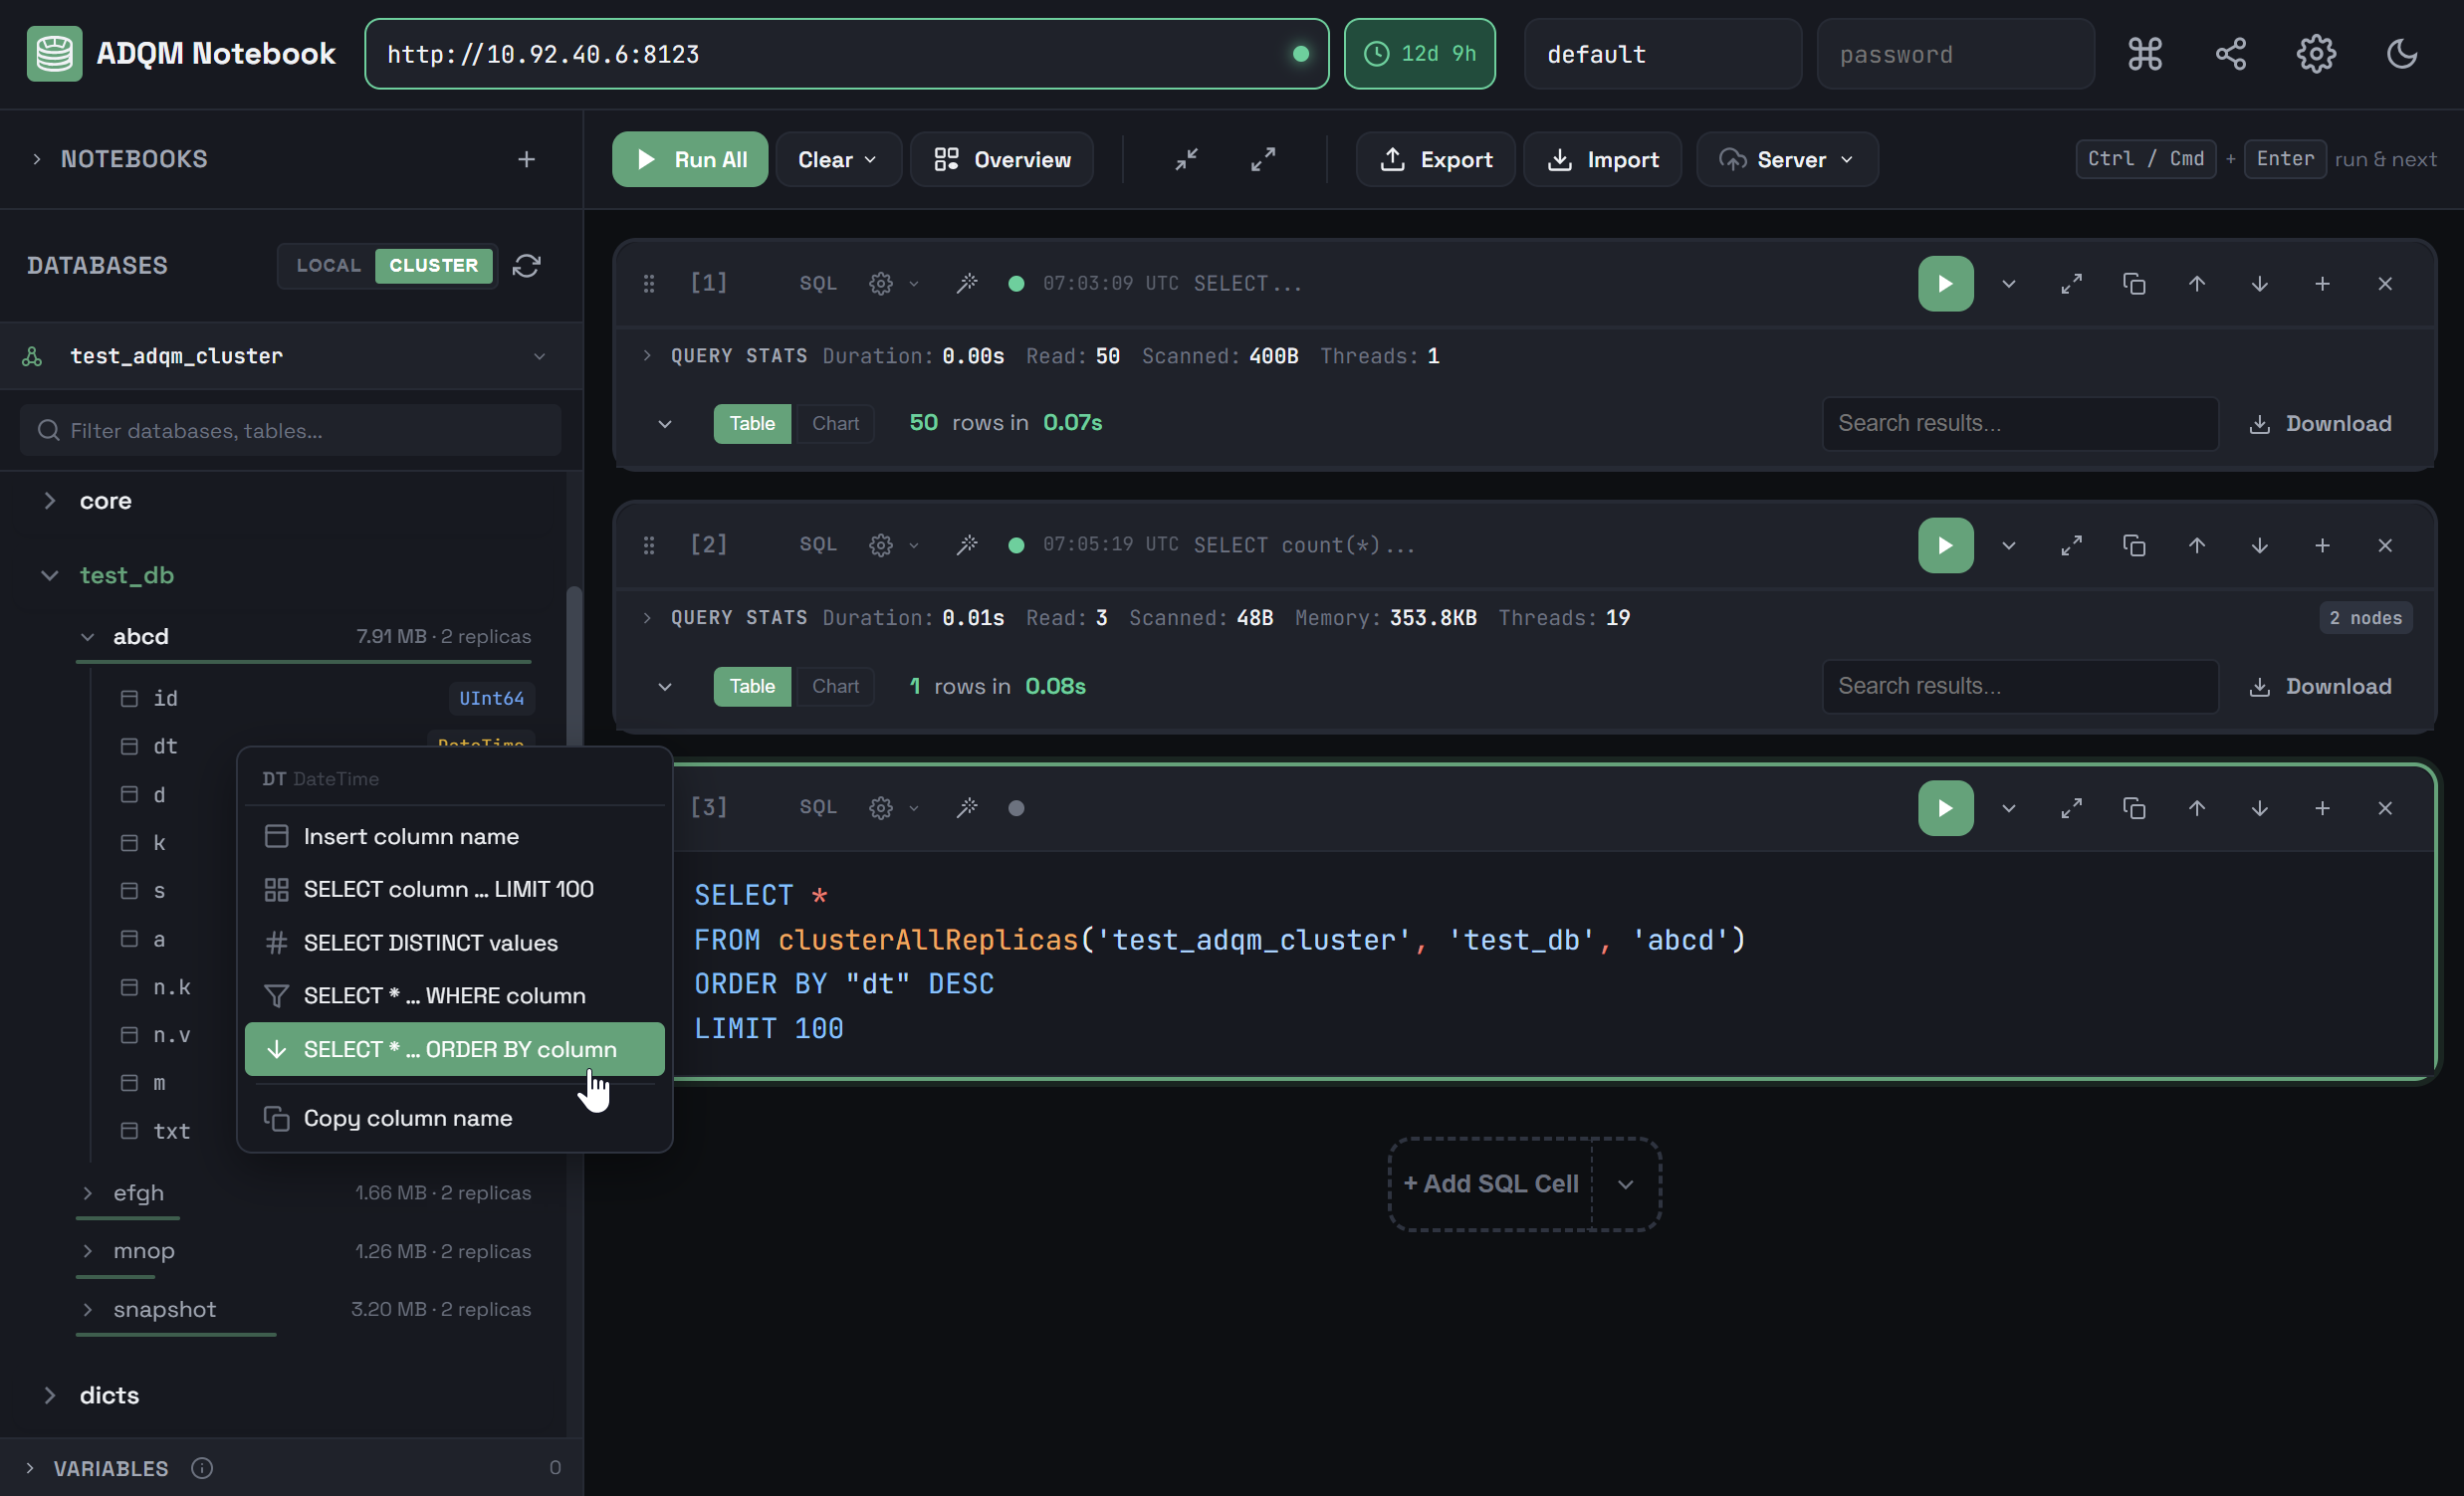
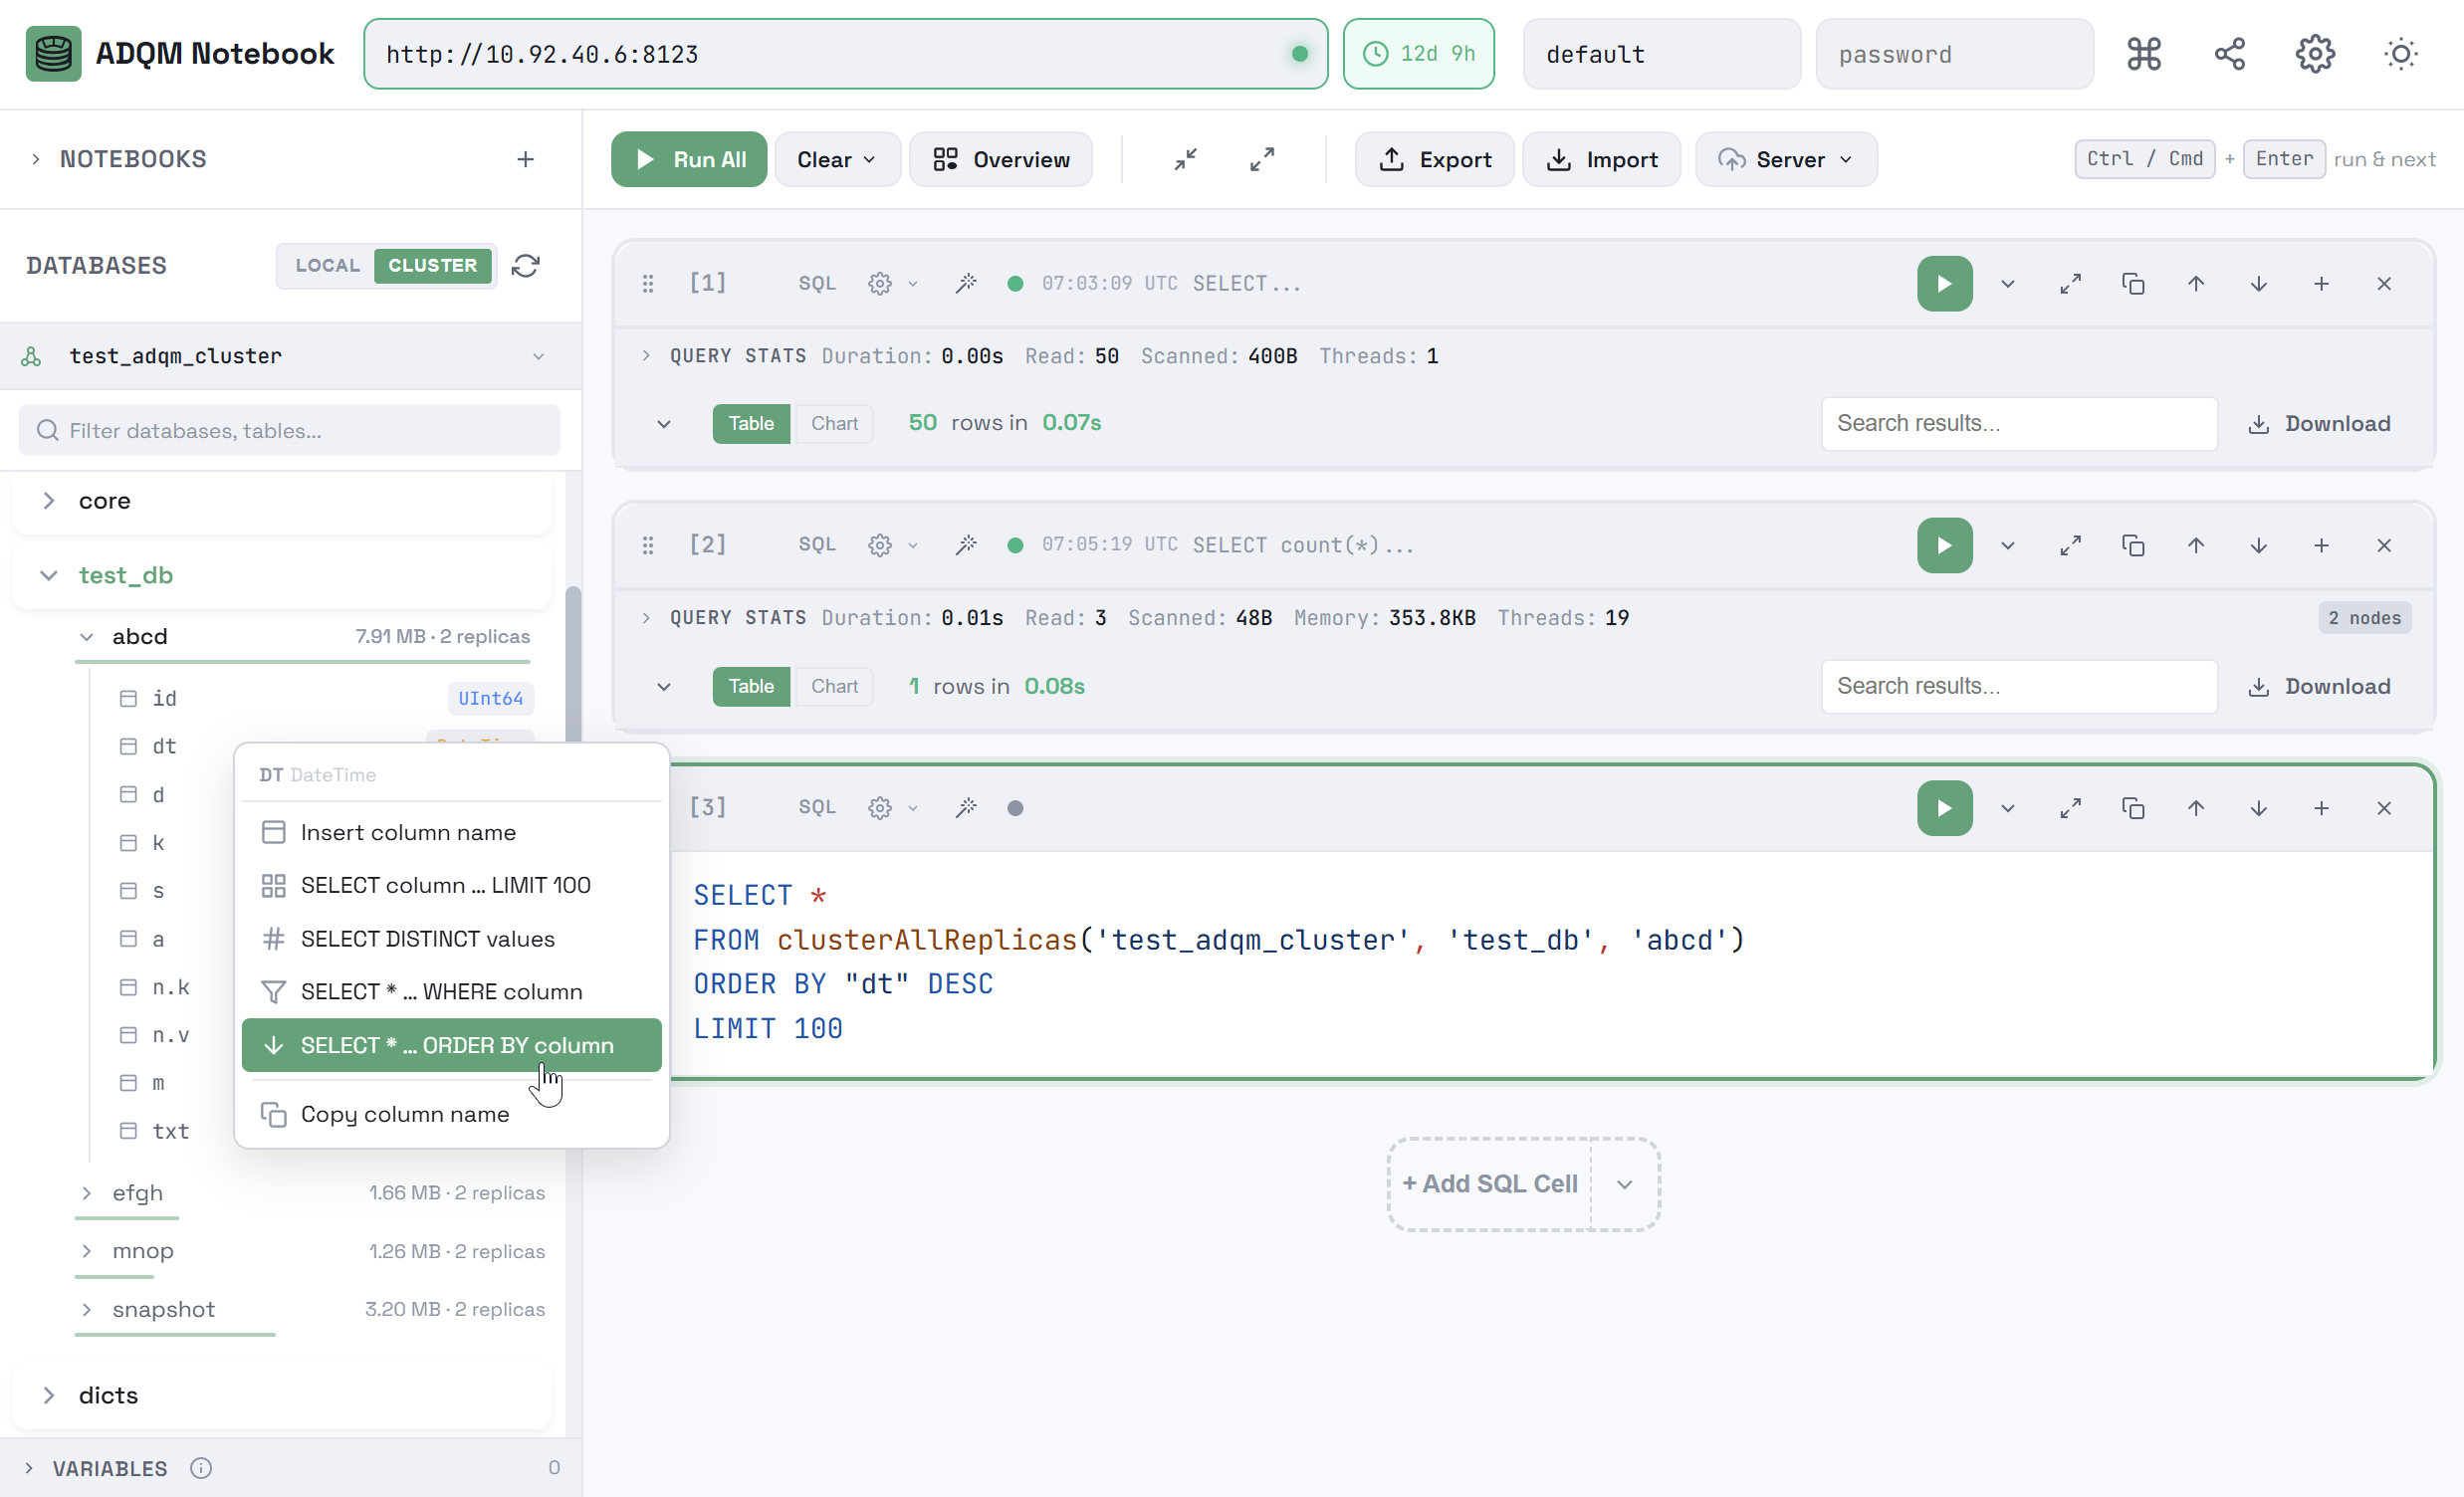
The following actions are available in the context menu:
-
Insert column name — insert a name of the table column. You can also do the same by clicking a row corresponding to the table column in the DATABASES panel.
-
SELECT column … LIMIT 100 — insert a query that reads values of the column from the first 100 rows of the table.
LOCALSELECT "<column_name>" FROM "<database_name>"."<table_name>" LIMIT 100CLUSTERSELECT "<column_name>" FROM clusterAllReplicas('<cluster_name>', '<database_name>', '<table_name>') LIMIT 100 -
SELECT DISTINCT values — insert a query that selects unique values (up to 100) from the table column and calculates their number.
LOCALSELECT "<column_name>", count(*) AS cnt FROM "<database_name>"."<table_name>" GROUP BY "<column_name>" ORDER BY cnt DESC LIMIT 100CLUSTERSELECT "<column_name>", count(*) AS cnt FROM clusterAllReplicas('<cluster_name>', '<database_name>', '<table_name>') GROUP BY "<column_name>" ORDER BY cnt DESC LIMIT 100 -
SELECT * … WHERE column — insert a query template for reading data from a table with a filter based on the column value, which you should add to the query text (after
=in theWHERE "<column_name>" =expression).LOCALSELECT * FROM "<database_name>"."<table_name>" WHERE "<column_name>" = LIMIT 100CLUSTERSELECT * FROM clusterAllReplicas('<cluster_name>', '<database_name>', '<table_name>') WHERE "<column_name>" = LIMIT 100 -
SELECT * … ORDER BY column — insert a query that selects data from a table sorting results by the column in descending order.
LOCALSELECT * FROM "<database_name>"."<table_name>" ORDER BY "<column_name>" DESC LIMIT 100CLUSTERSELECT * FROM clusterAllReplicas('<cluster_name>', '<database_name>', '<table_name>') ORDER BY "<column_name>" DESC LIMIT 100 -
Copy column name — copy the column name to the clipboard.
In each of the above queries, the name of the column for which the context menu is called, as well as the name of the table, database, and cluster, are referred as <column_name>, <table_name>, <database_name>, and <cluster_name>, respectively — when you paste a query into a cell, these placeholders will be automatically replaced with the actual names of the corresponding objects.
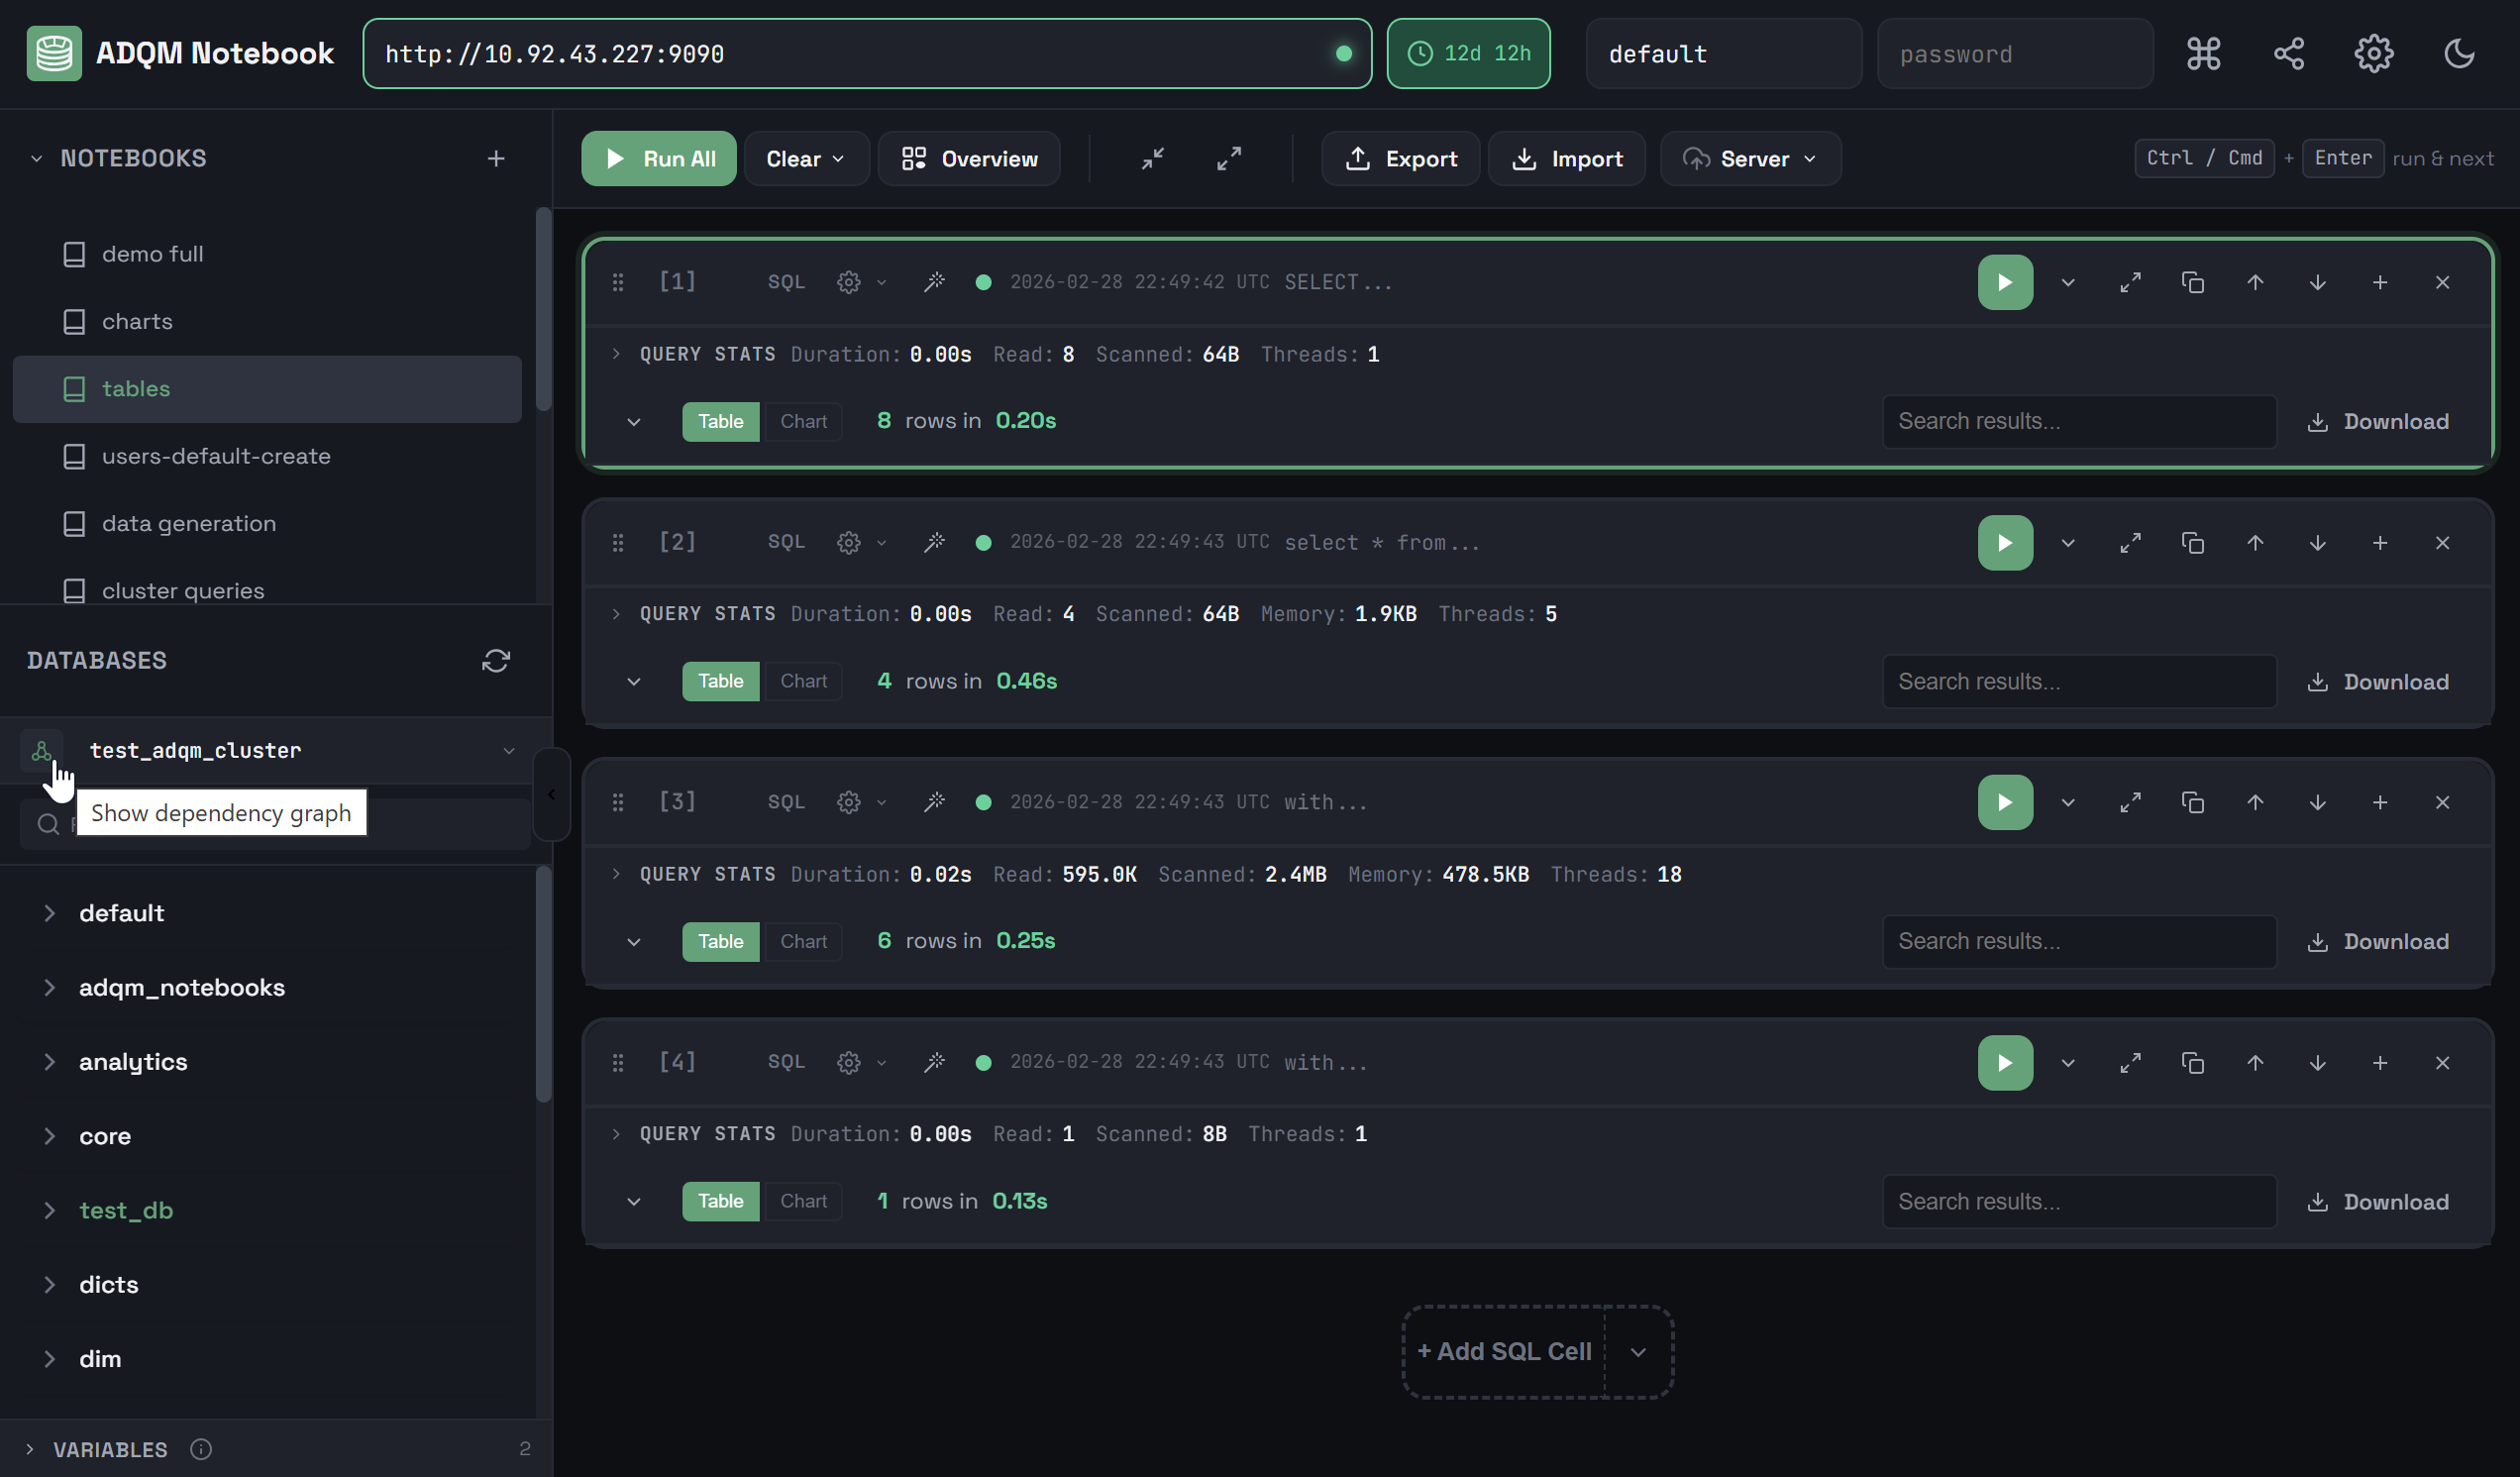
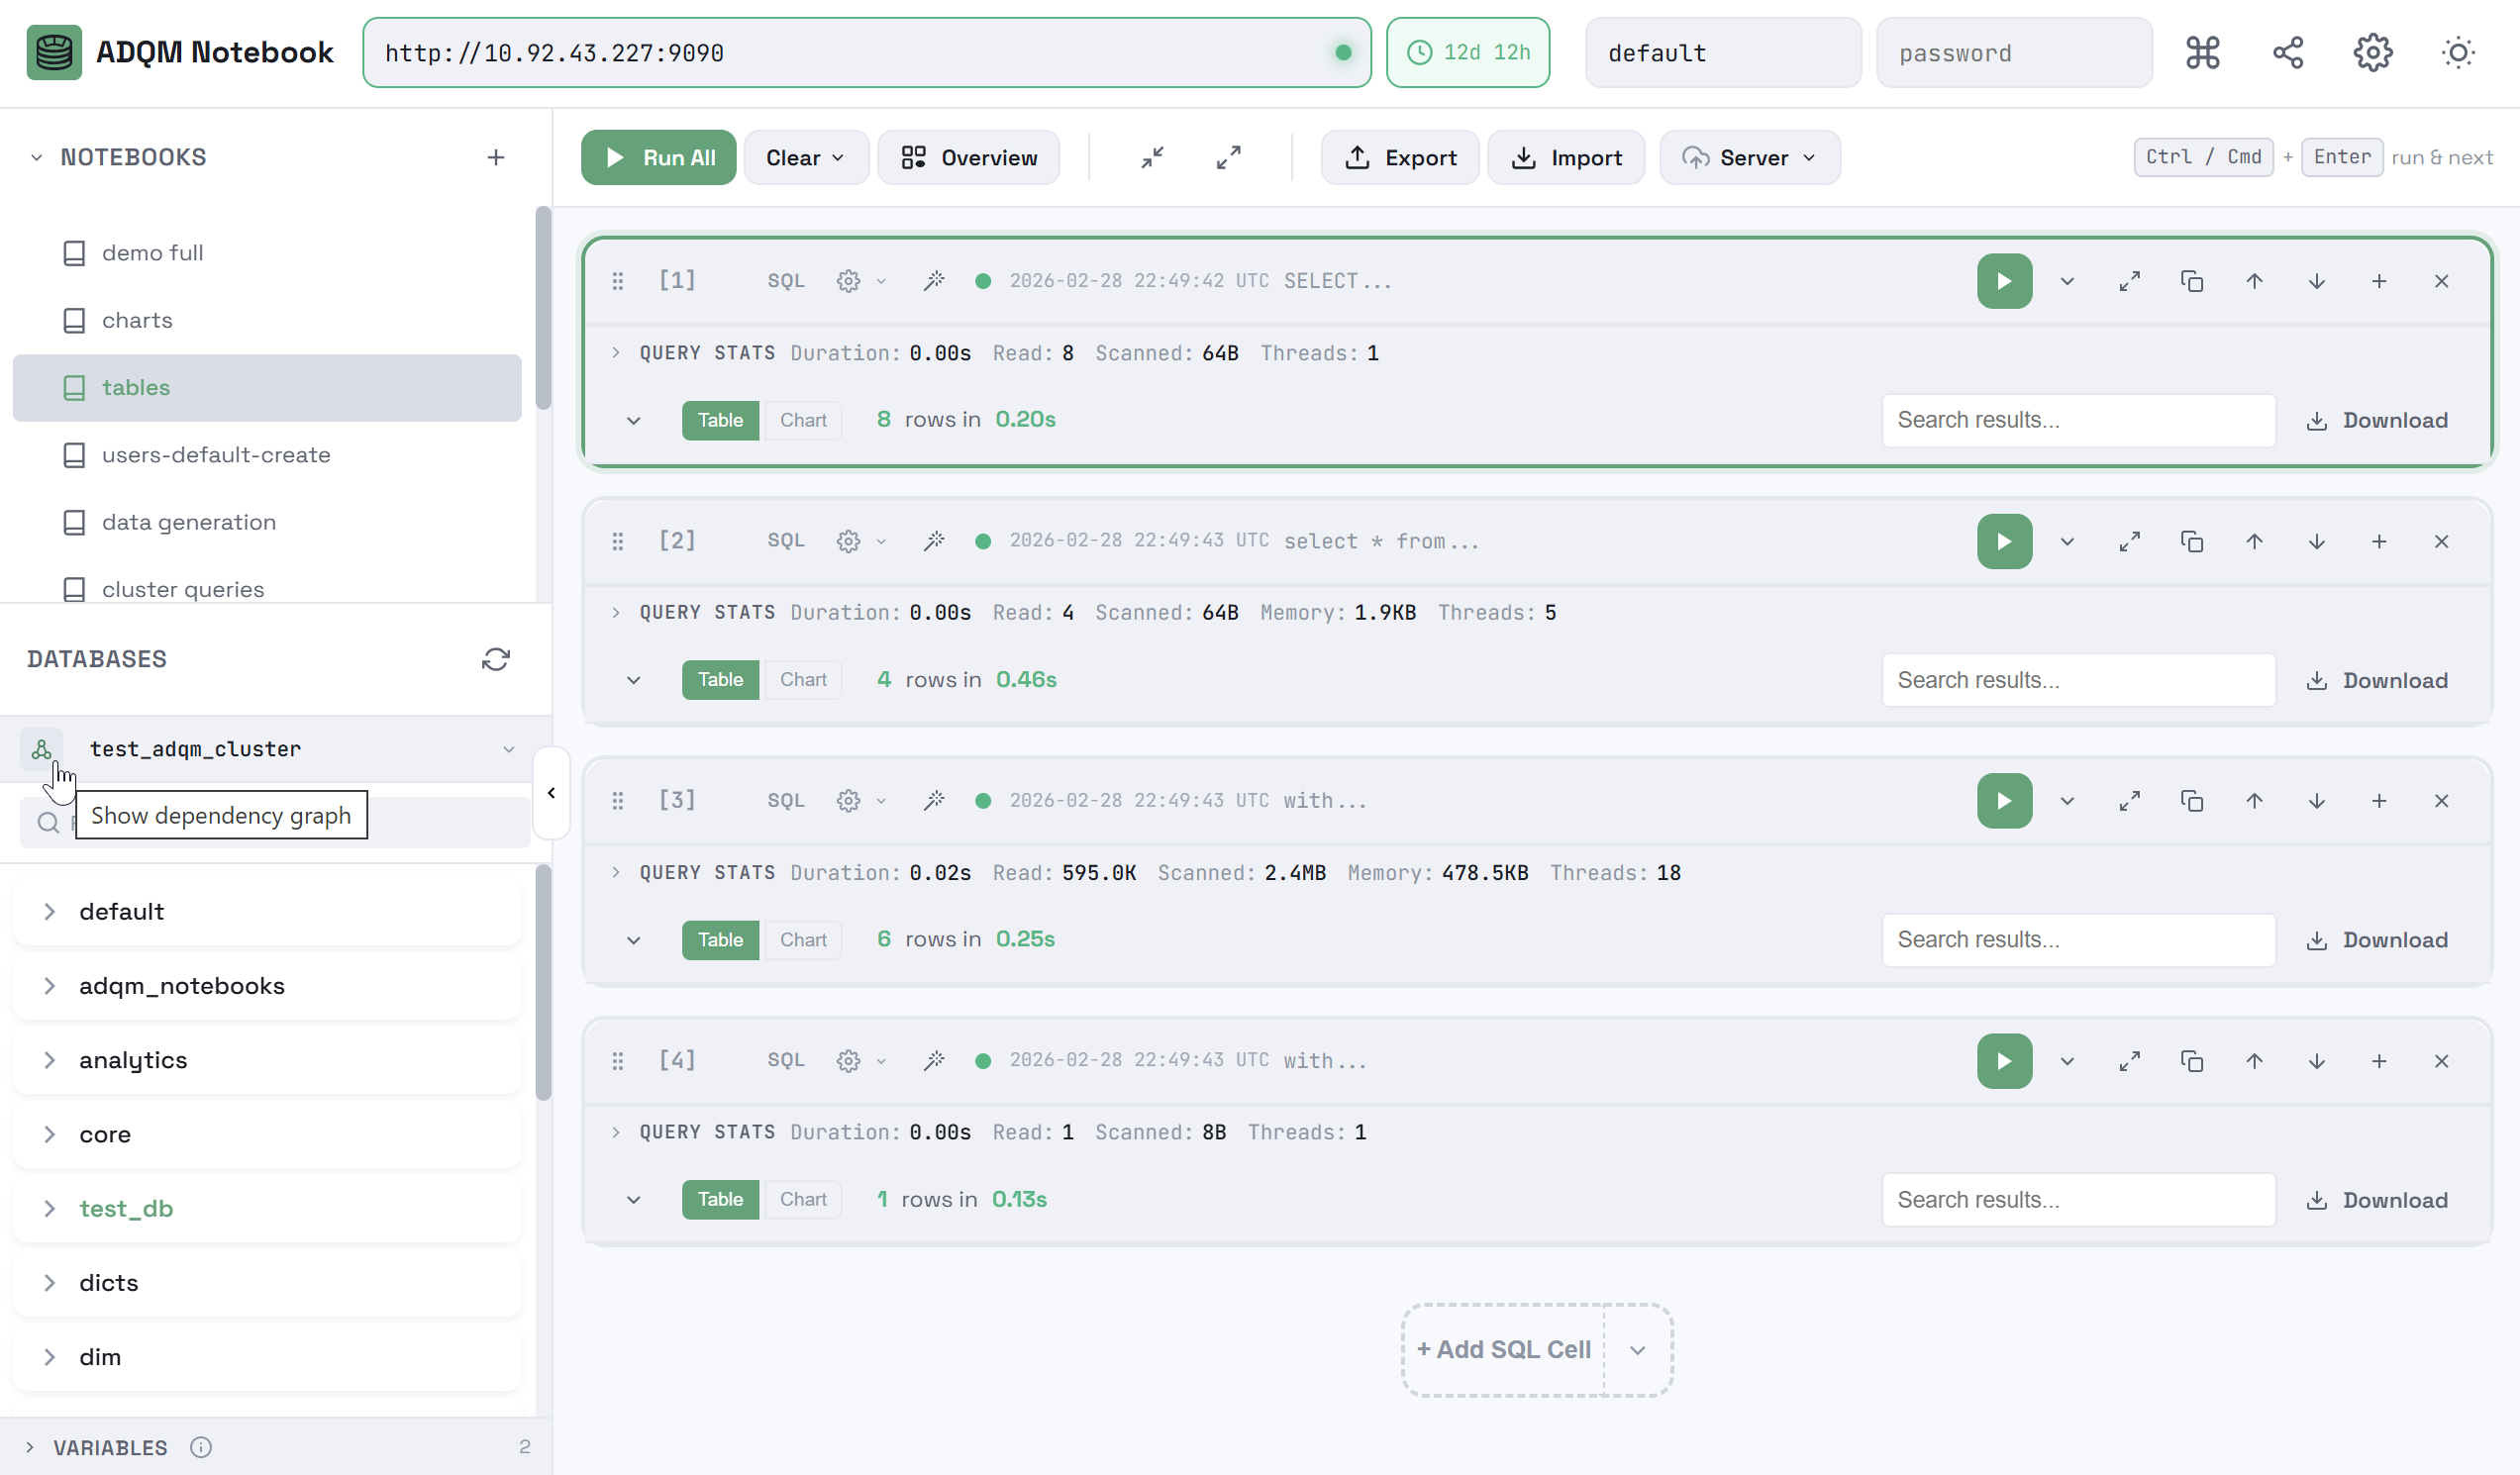
Graph of object dependencies
Click the ![]() Show dependency graph icon to the left of the cluster name to view dependencies between ADQM database objects.
Show dependency graph icon to the left of the cluster name to view dependencies between ADQM database objects.
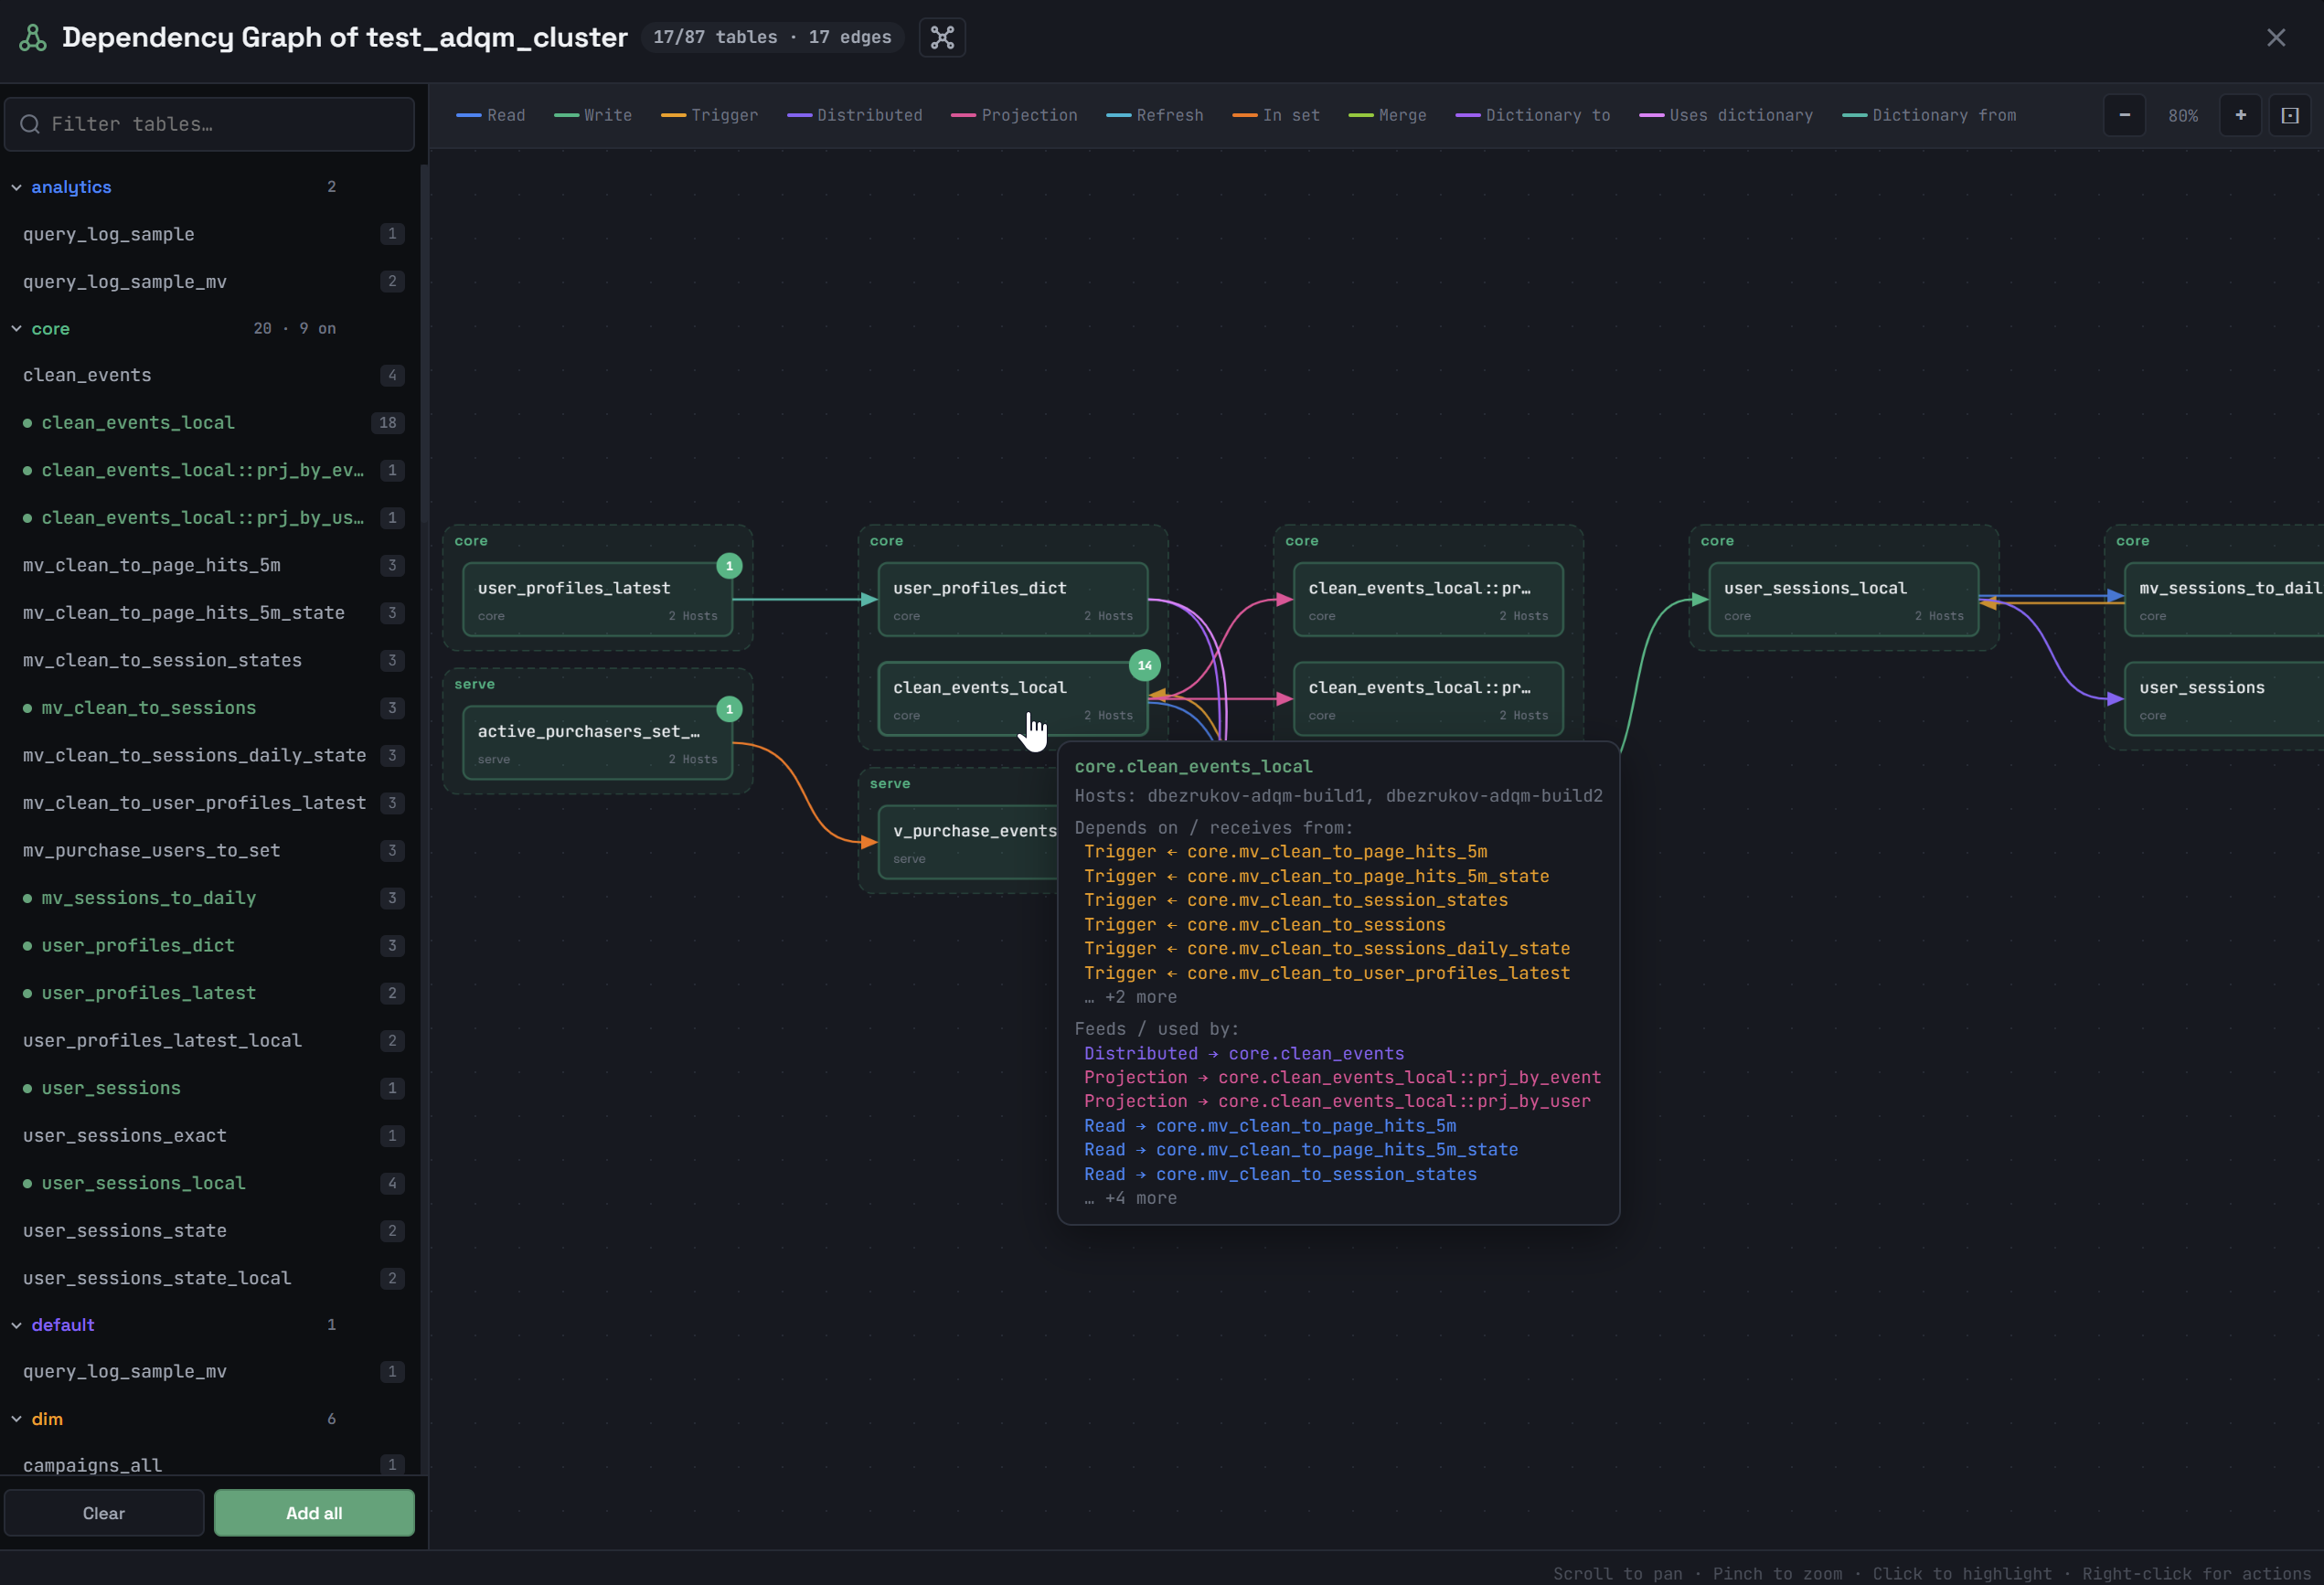
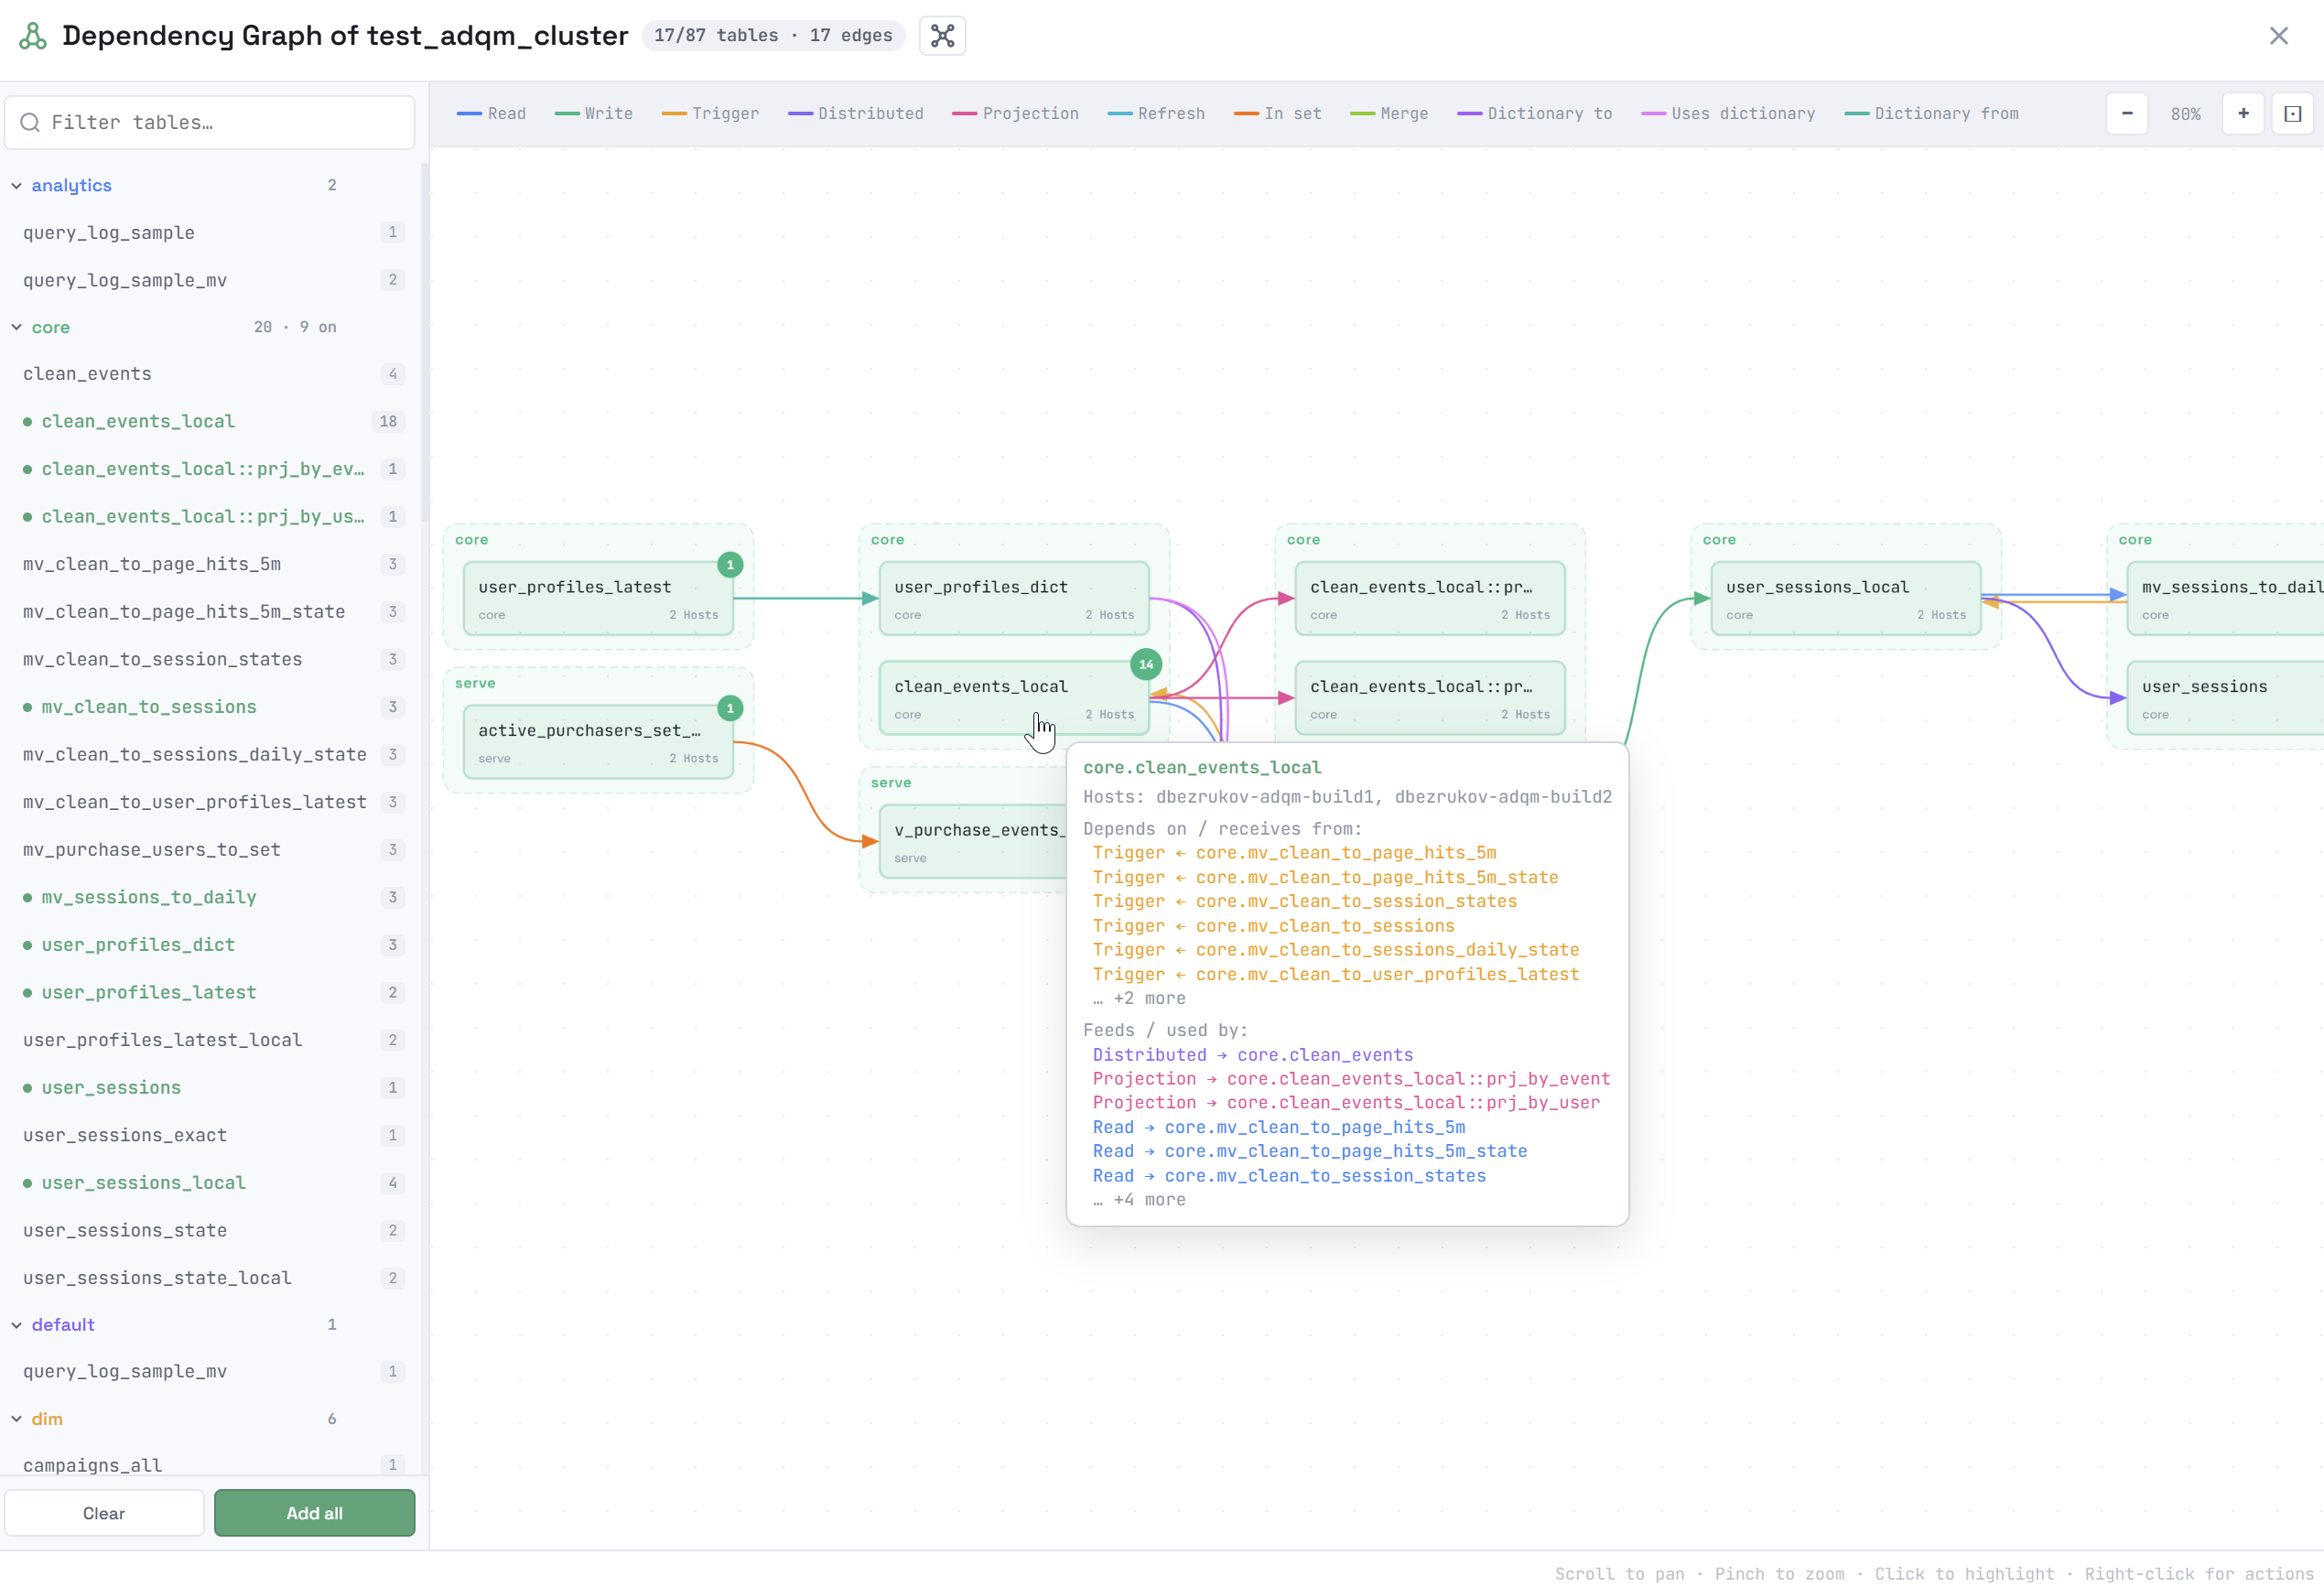
In the Dependency Graph of <cluster_name> window that opens, select objects whose dependencies you want to view by clicking their names in the list on the left. Supported object types: tables (the MergeTree-family, Merge, Set, Join, Kafka, Distributed table engines), views, materialized views, dictionaries, projections.
The total number of dependencies for an object is displayed to the right of its name. To select all objects, click Add all below the list. The Clear button removes all objects from the graph.
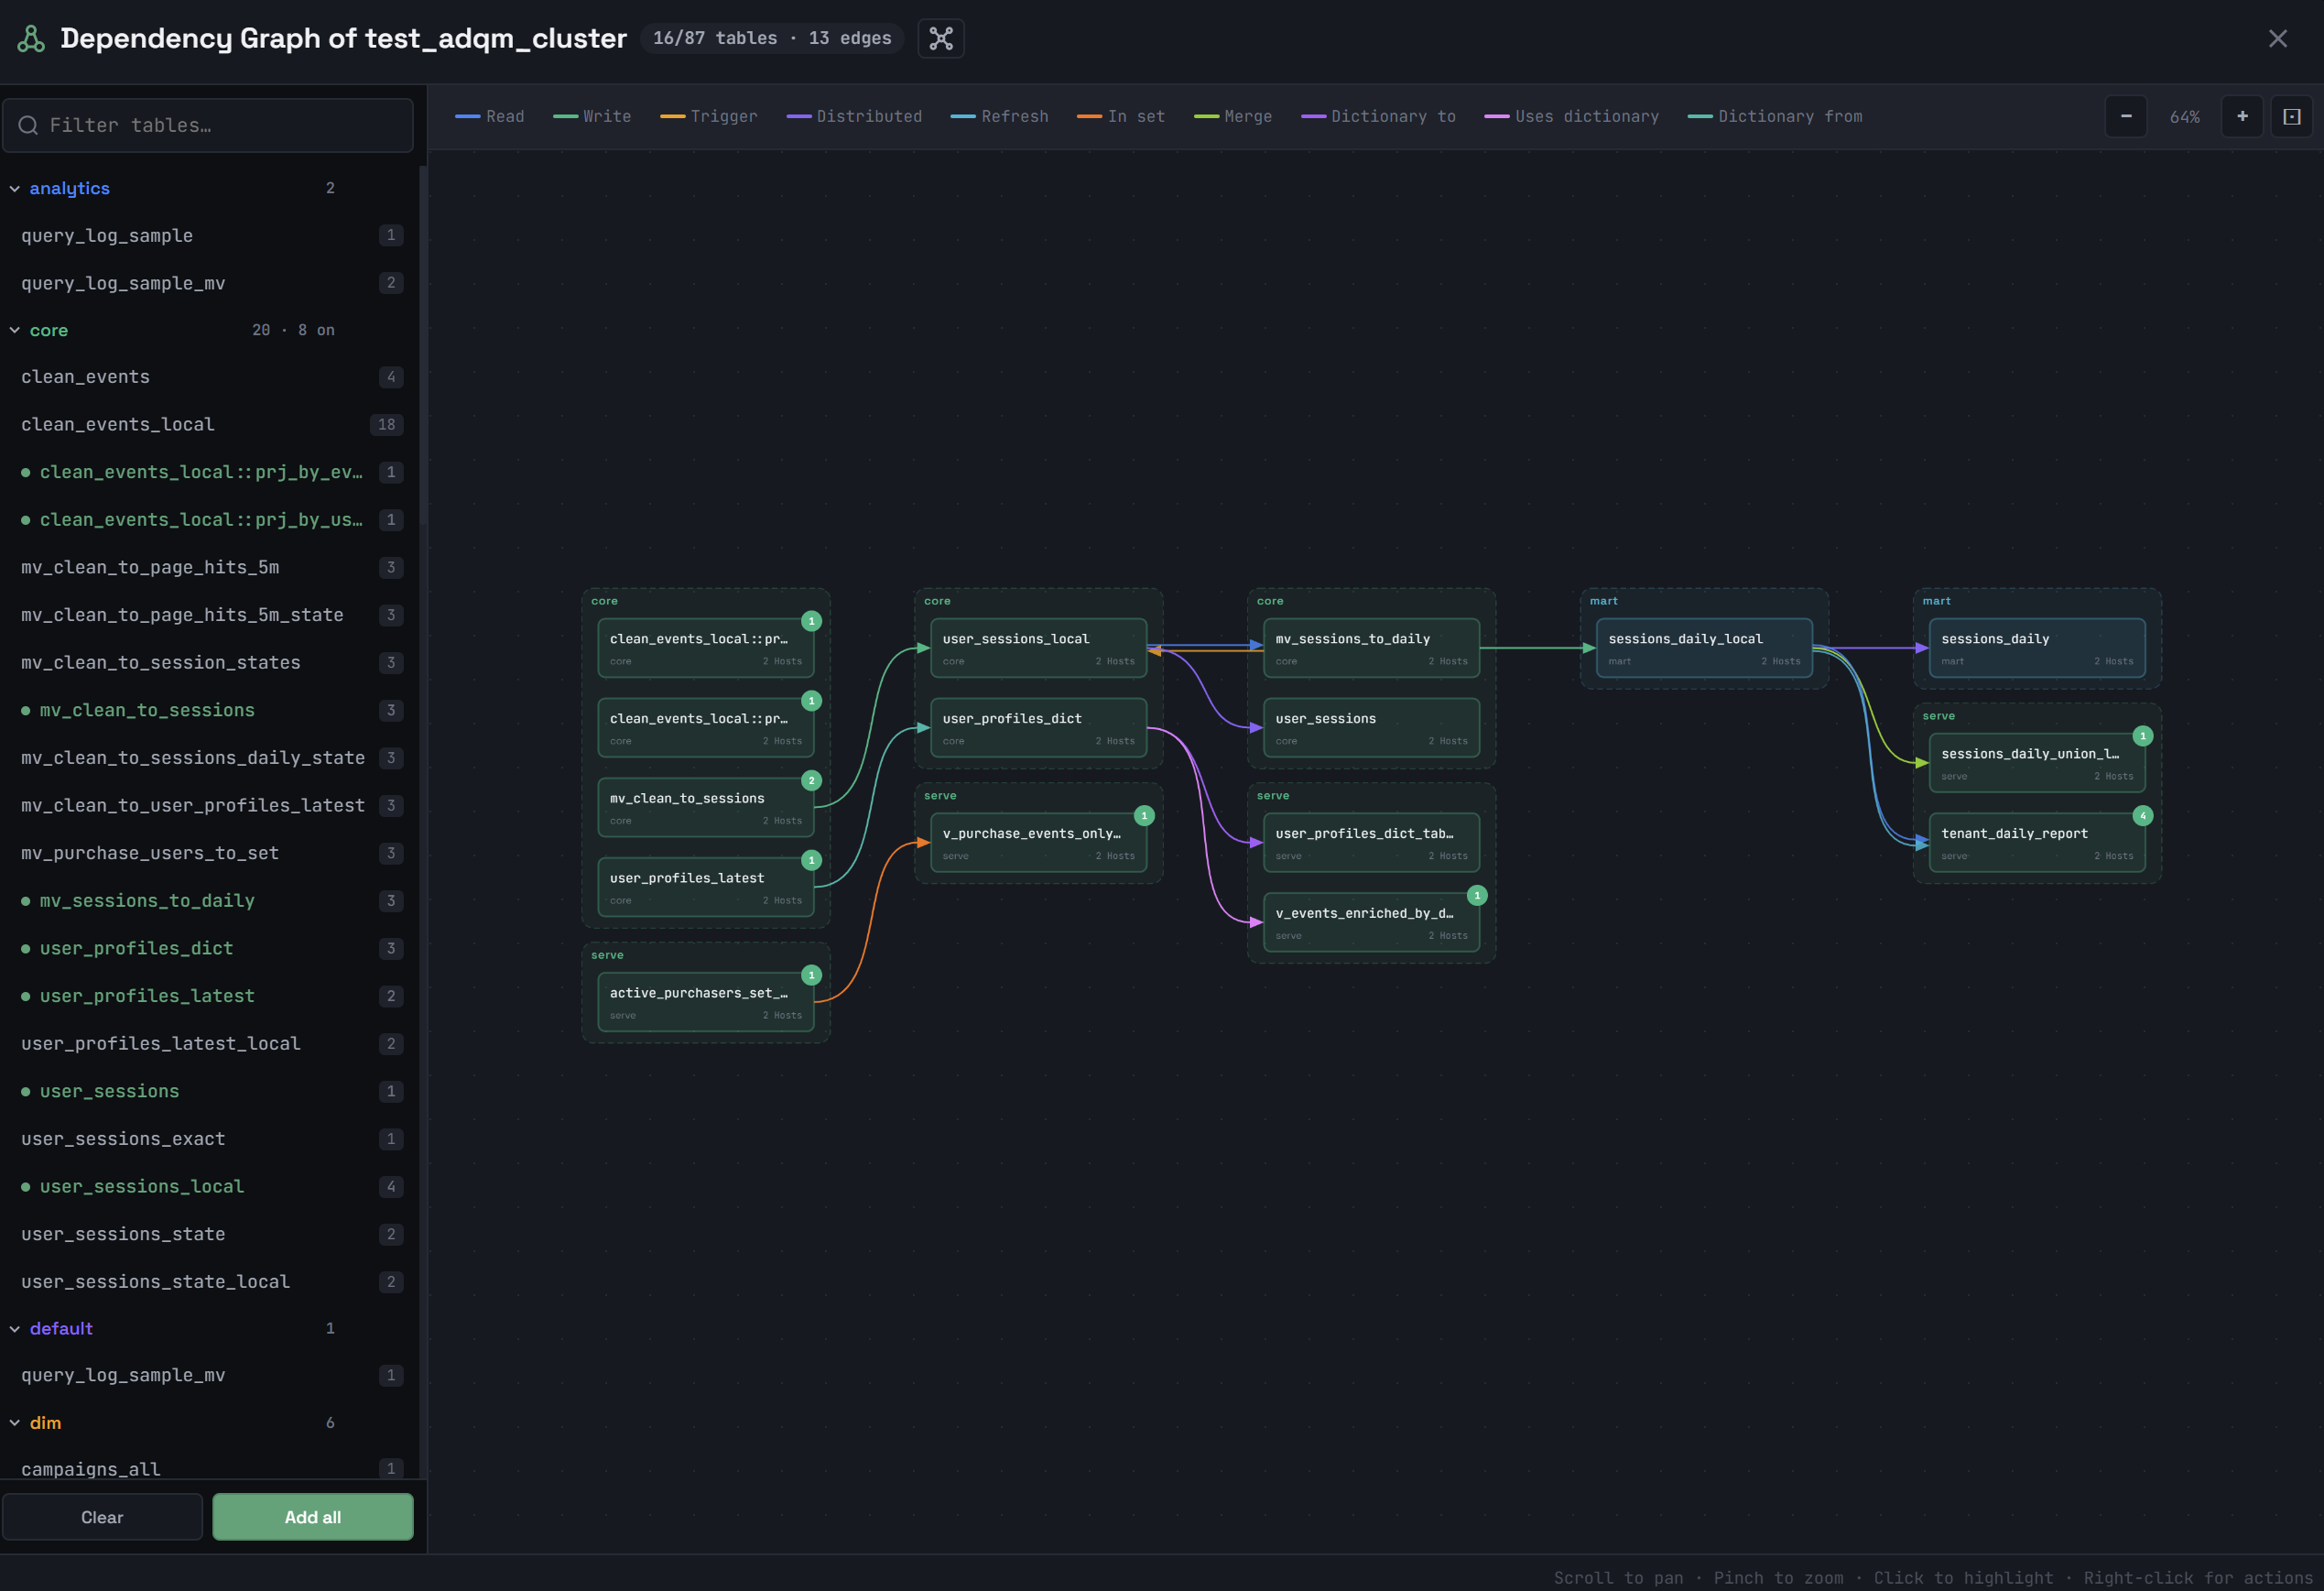
Selected objects will be drawn in the main area of the window and connected by arrows. An arrow color indicates the dependency type. The types of dependencies between objects in the graph and their corresponding colors are listed in the legend at the top of the window. Clicking a dependency type in the legend removes the corresponding links (arrows) between objects from the graph.
Possible types of dependencies:
-
Read — a table and object from which it reads data;
-
Write — a materialized view and target table into which the materialized view saves its results;
-
Trigger — a table and materialized view triggered when data is inserted into this table;
-
Distributed — a Distributed table and local table it references;
-
Projection — a projection and its source table;
-
Refresh — a refreshable materialized view and its explicit dependency (specified via
DEPENDS ON); -
In set — a table based on the Set engine and an object that uses it;
-
Merge — a table based on the Merge engine and a table from which it reads data;
-
Dictionary to — a table based on the Dictionary engine and its underlying dictionary;
-
Uses dictionary — a table using dictionary data via the
dictGetfunction, and a dictionary; -
Dictionary from — a dictionary and its data source.
When you hover over an object, a tooltip displays more detailed information about this object and its dependencies: which hosts the object is located on, which objects are the data source for it (the receives from dependencies), and for which objects it itself is the data source (the used by dependencies).
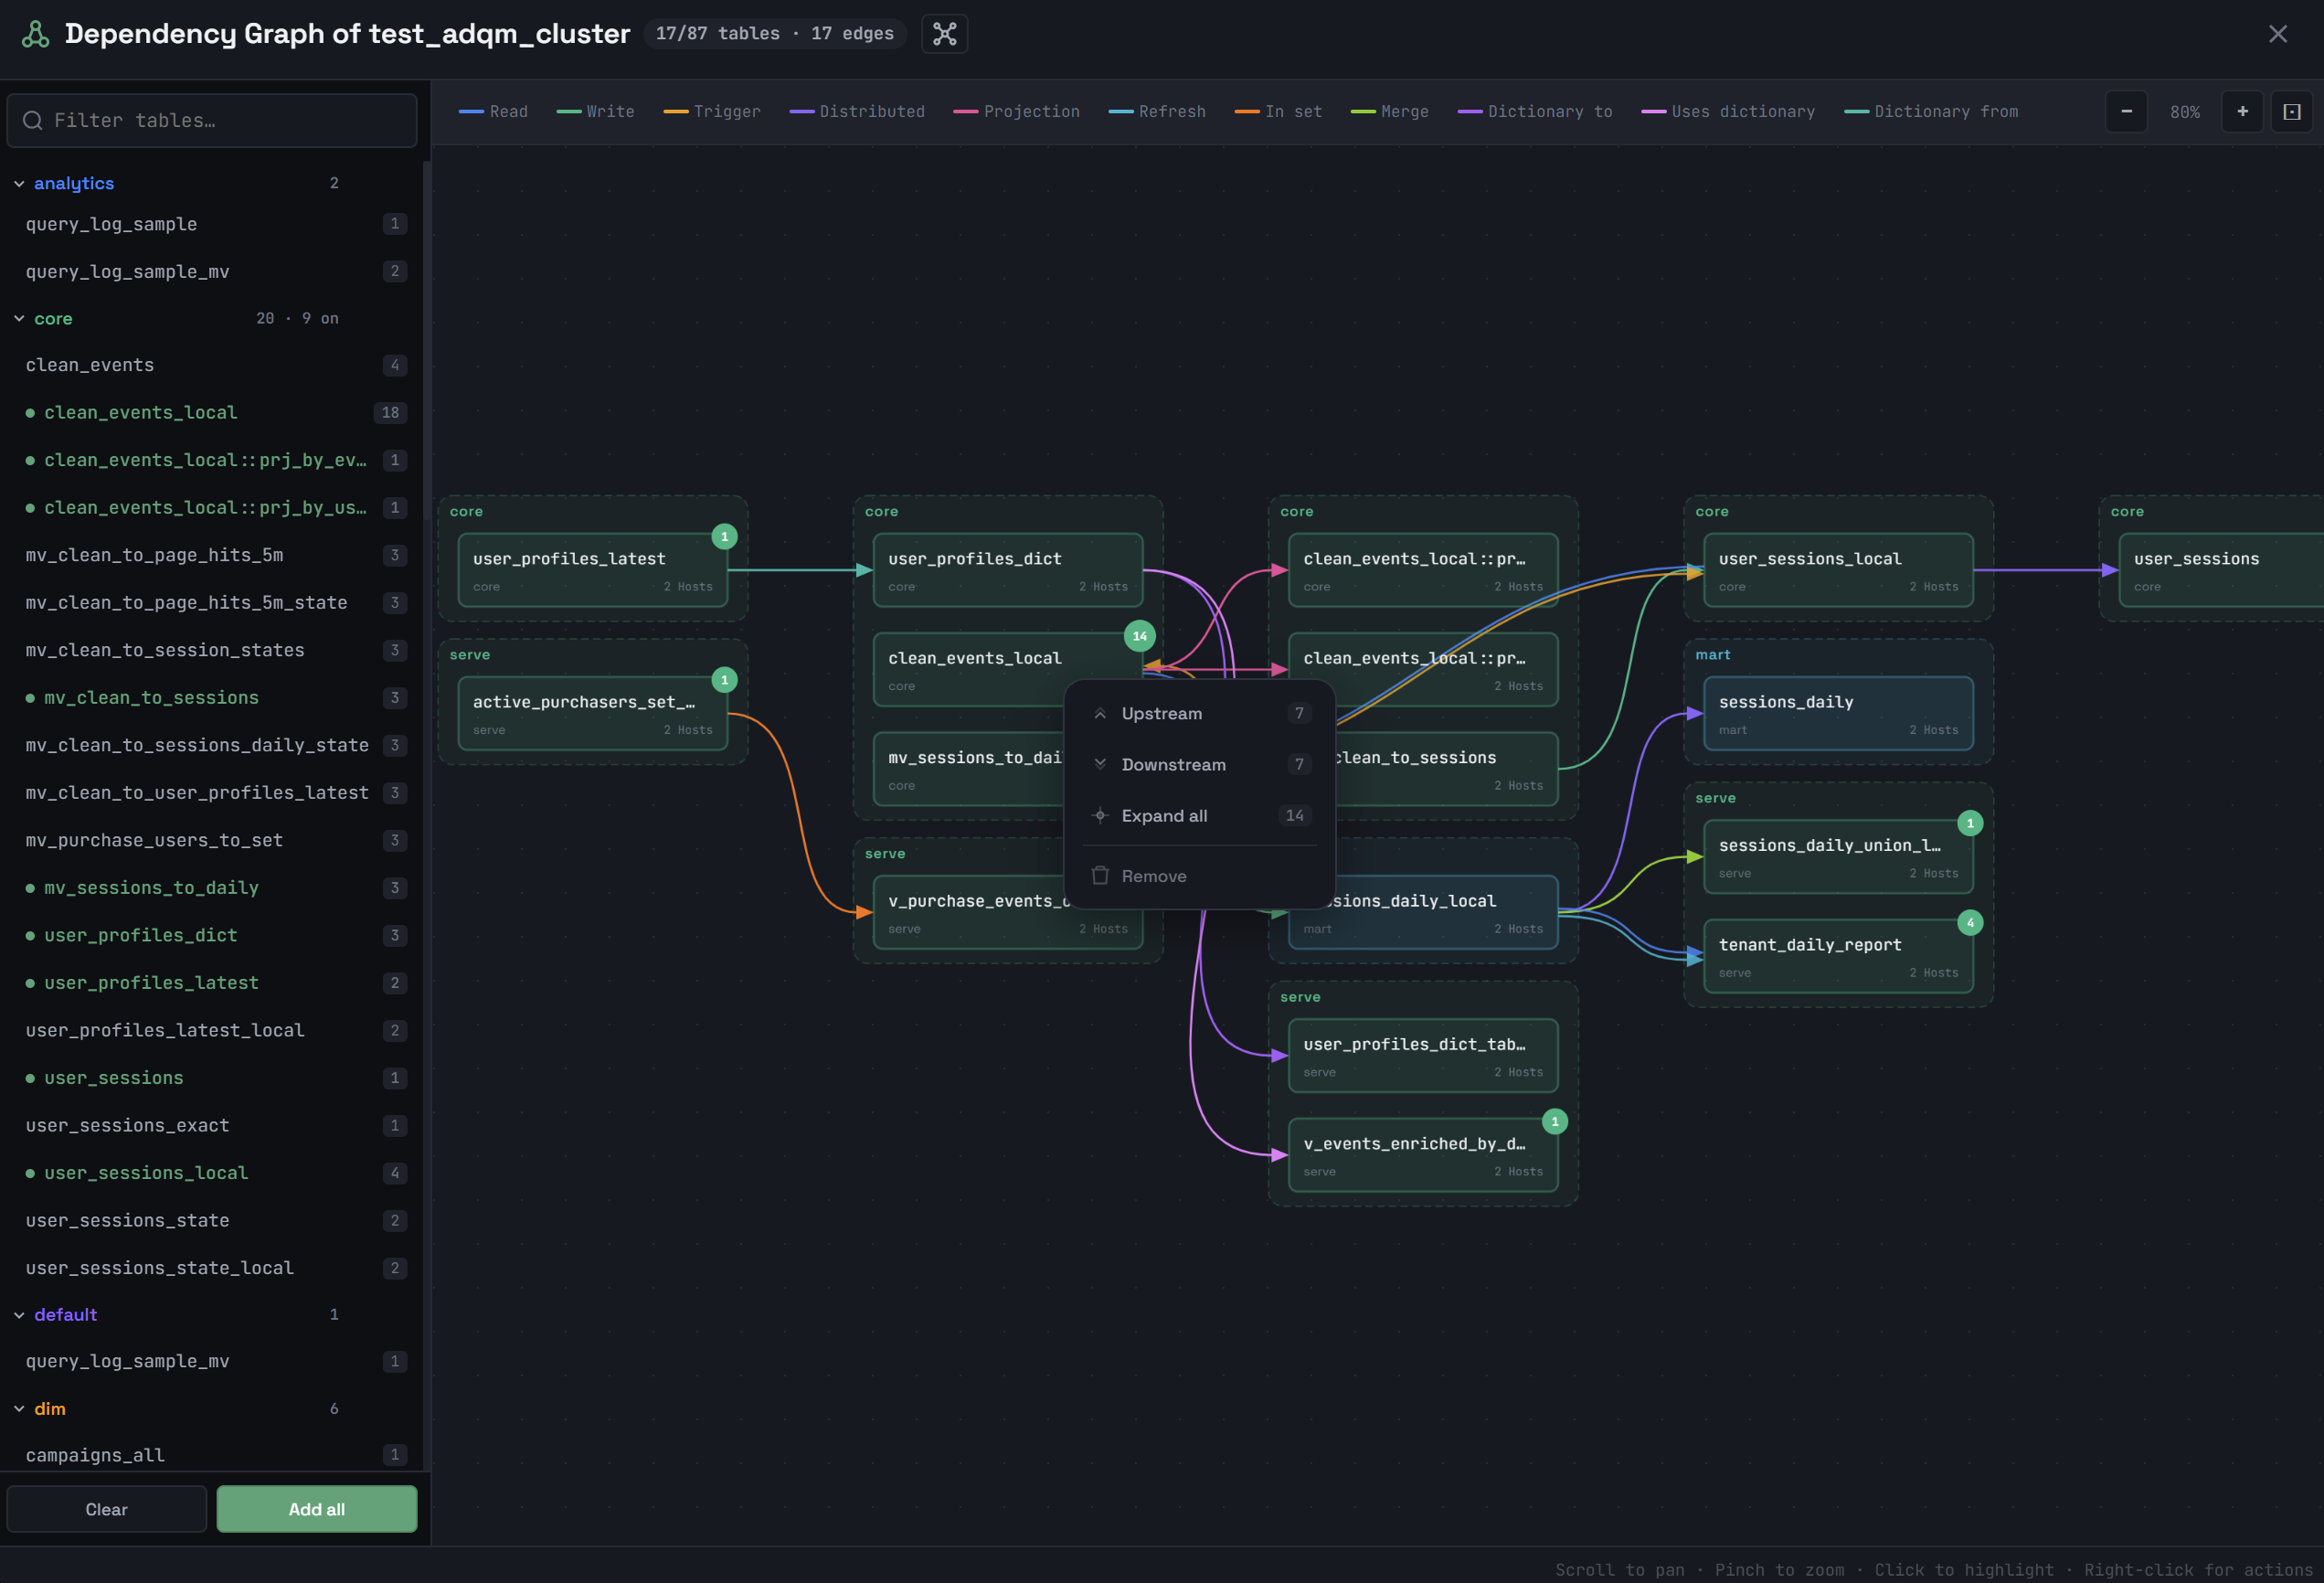
The upper-right corner of an object shows the number of its dependencies that are not yet built on the graph. To display all the dependencies of an object added to the graph, right-click it and select Upstream (the receives from dependencies), Downstream (the used by dependencies), or Expand all (all object dependencies) from the context menu. The Remove command removes an object from the graph.
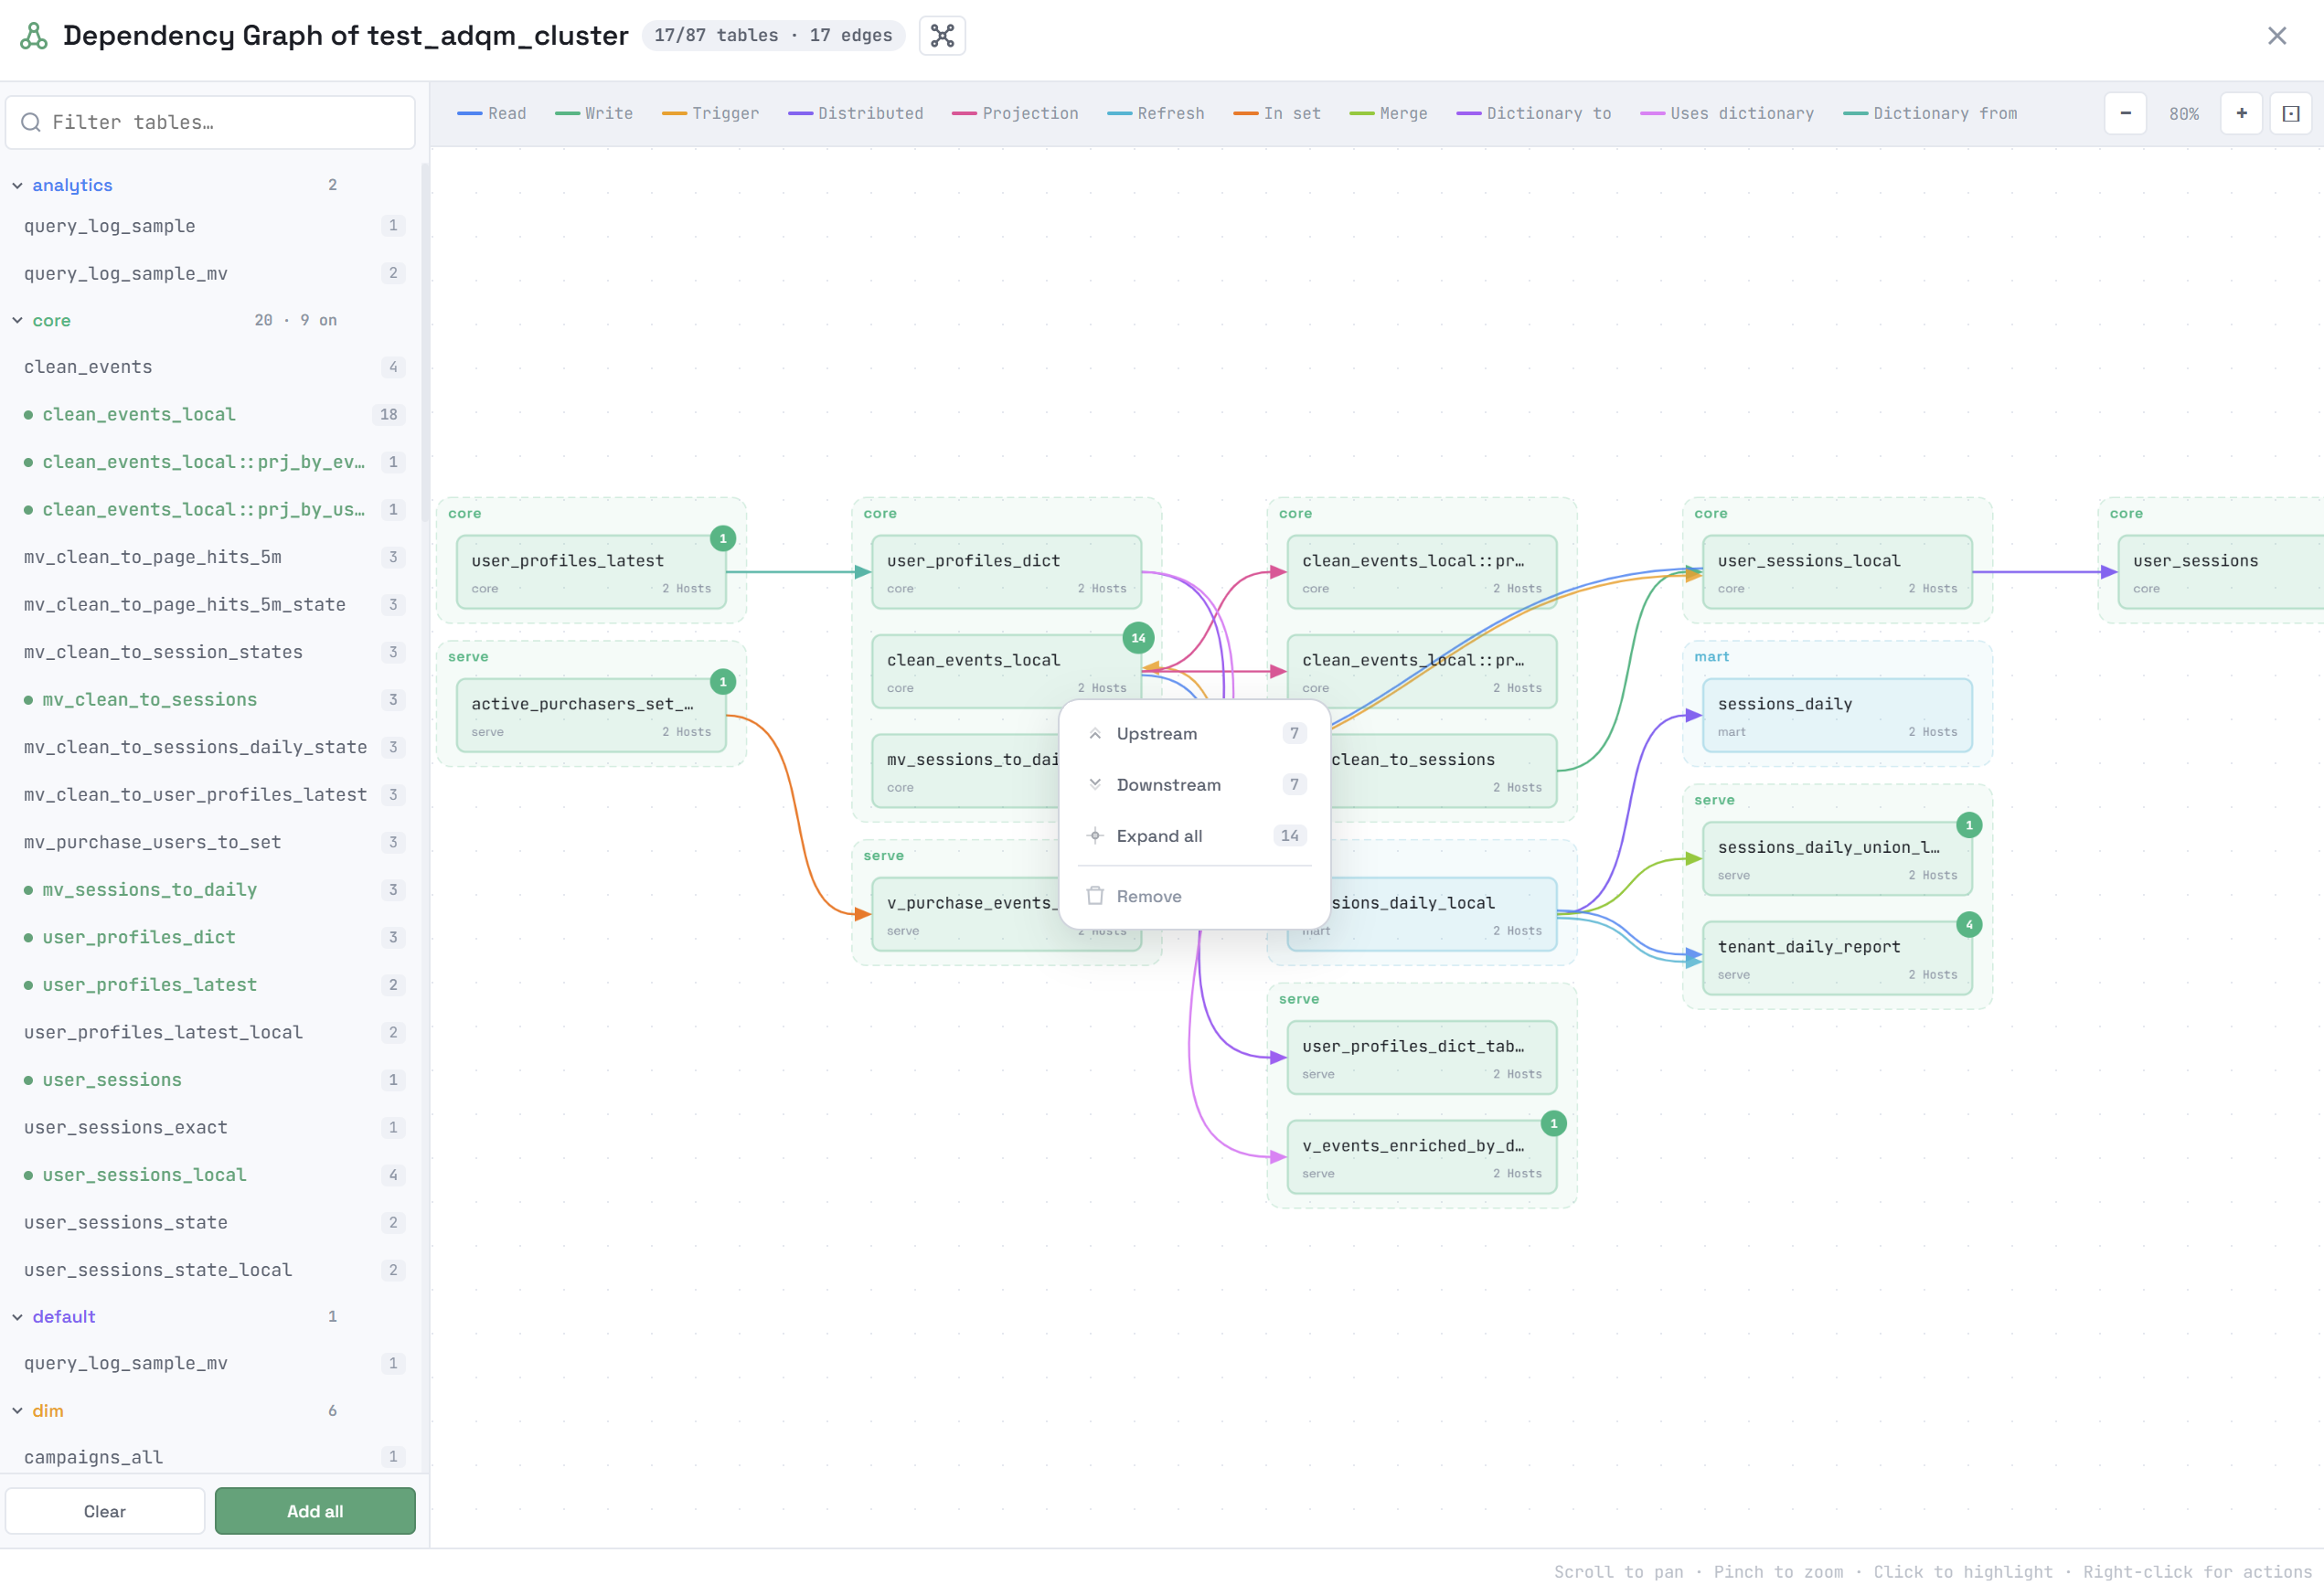
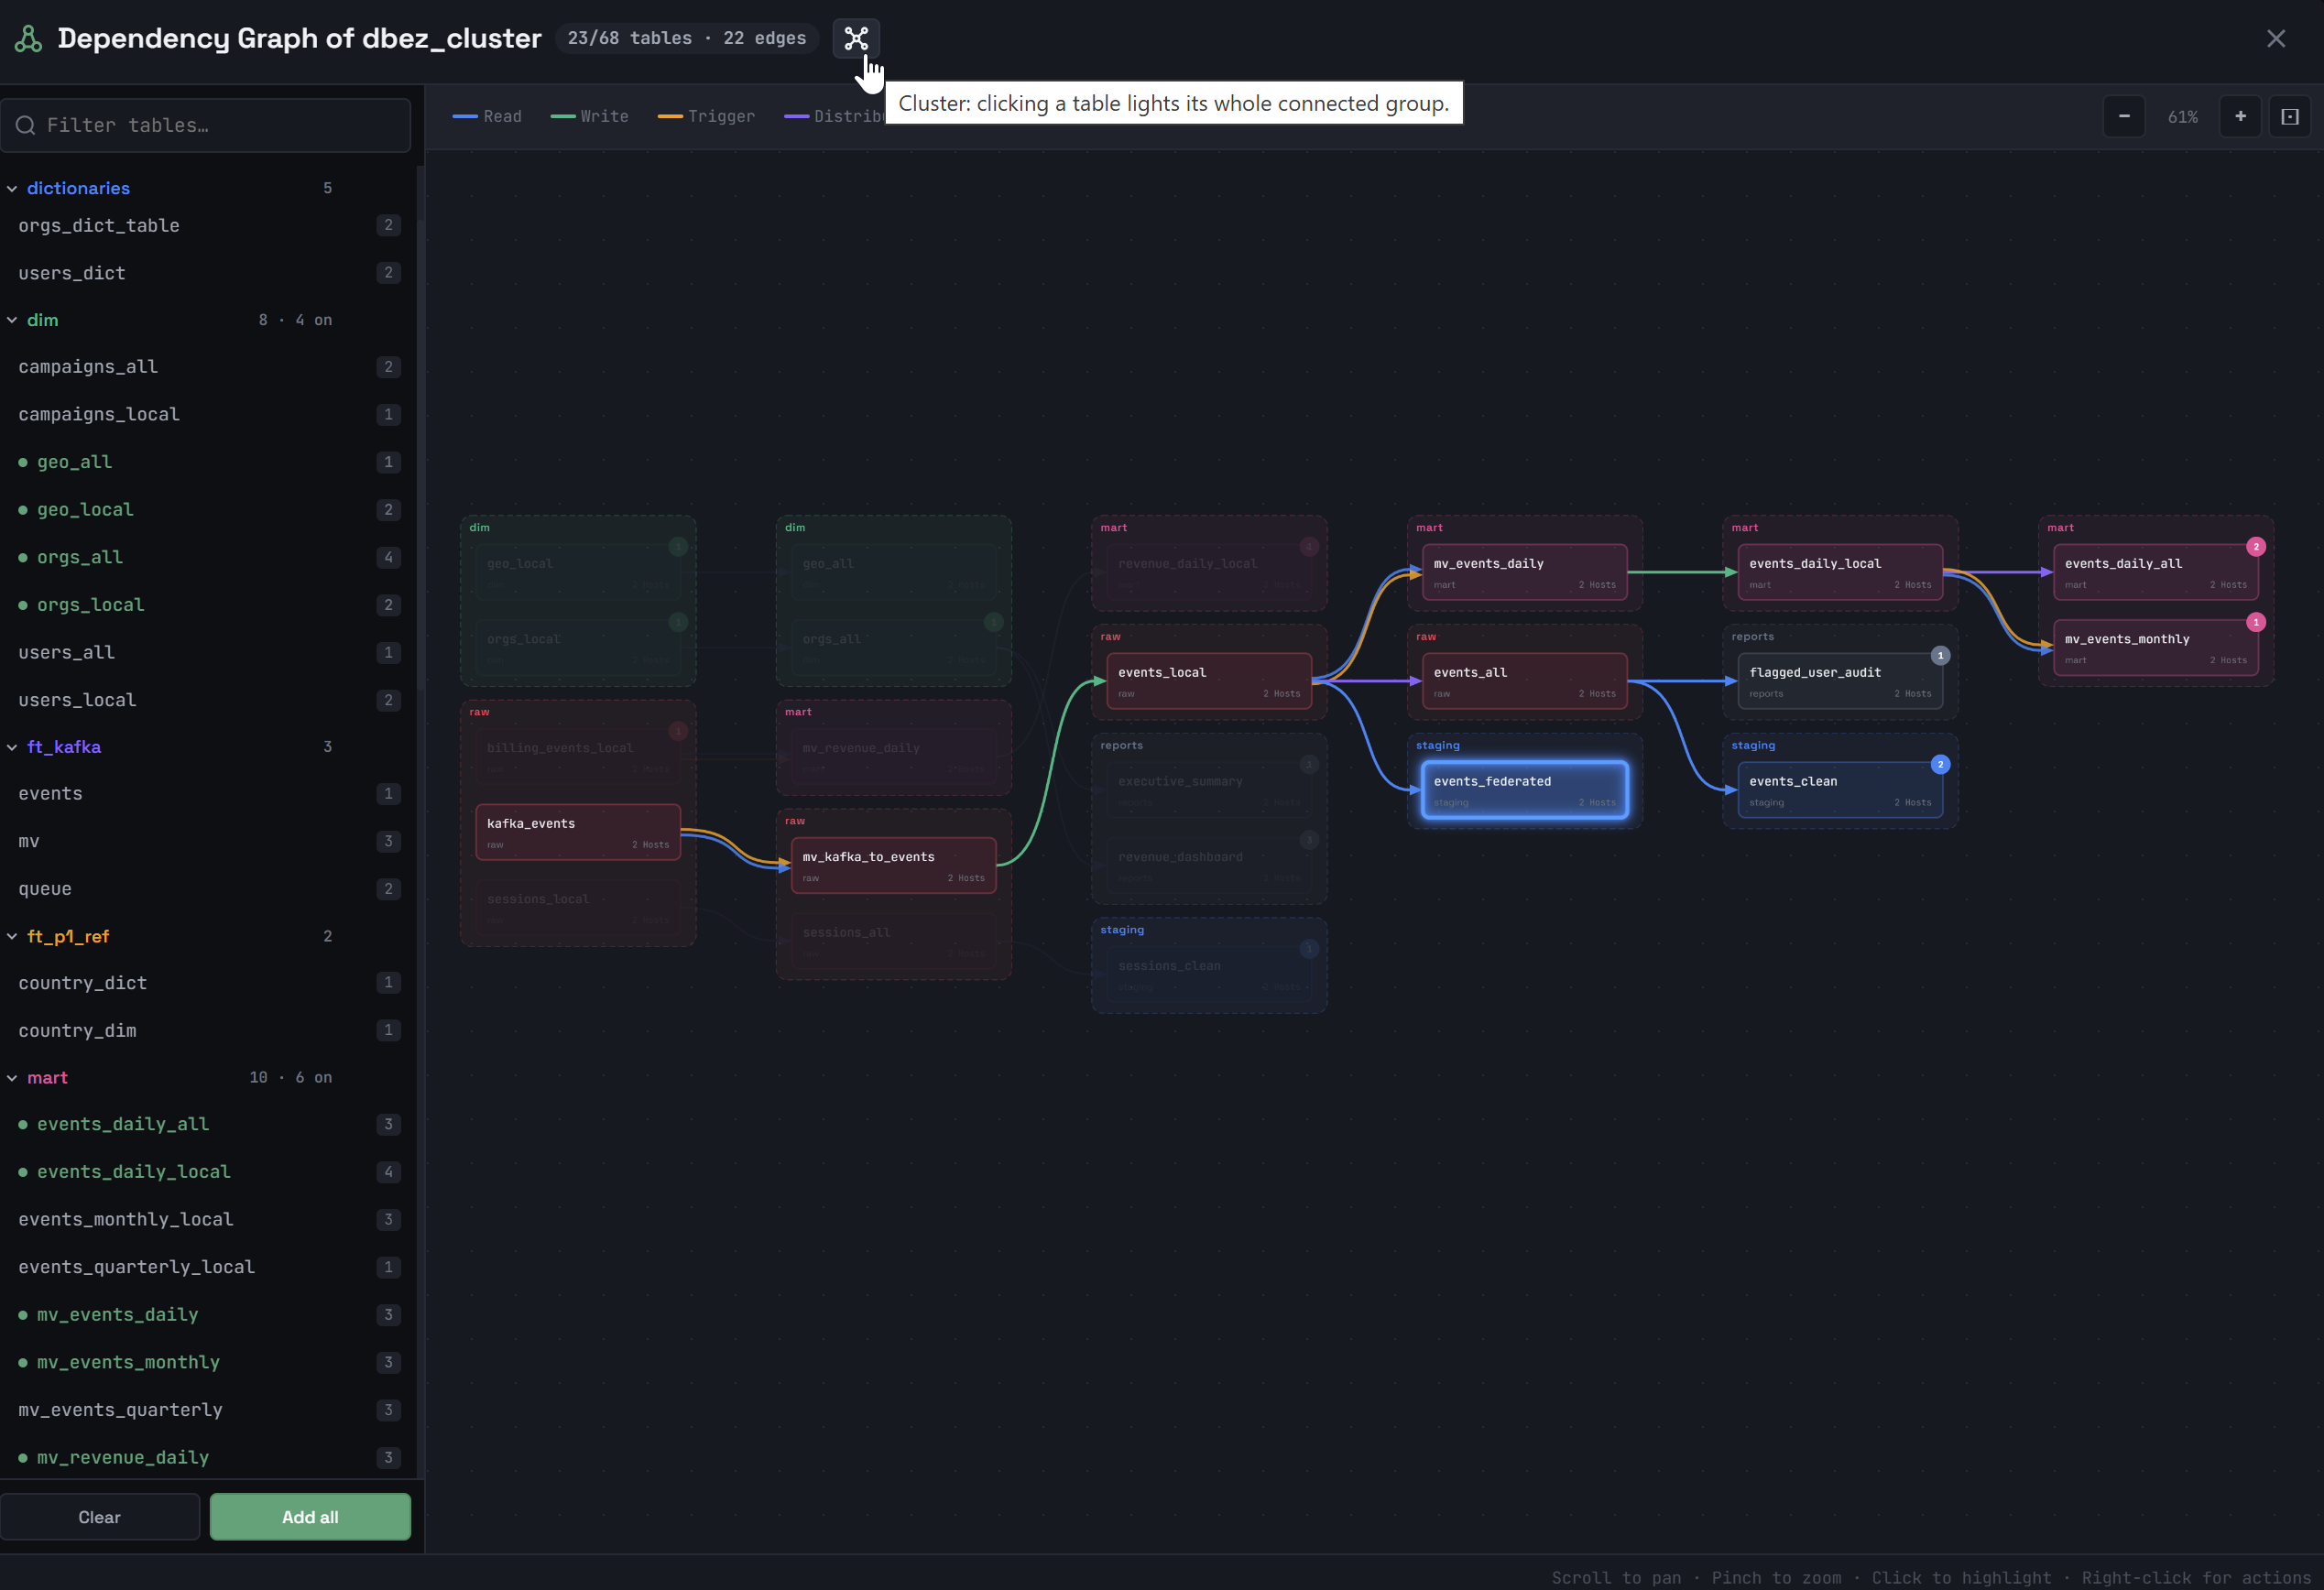
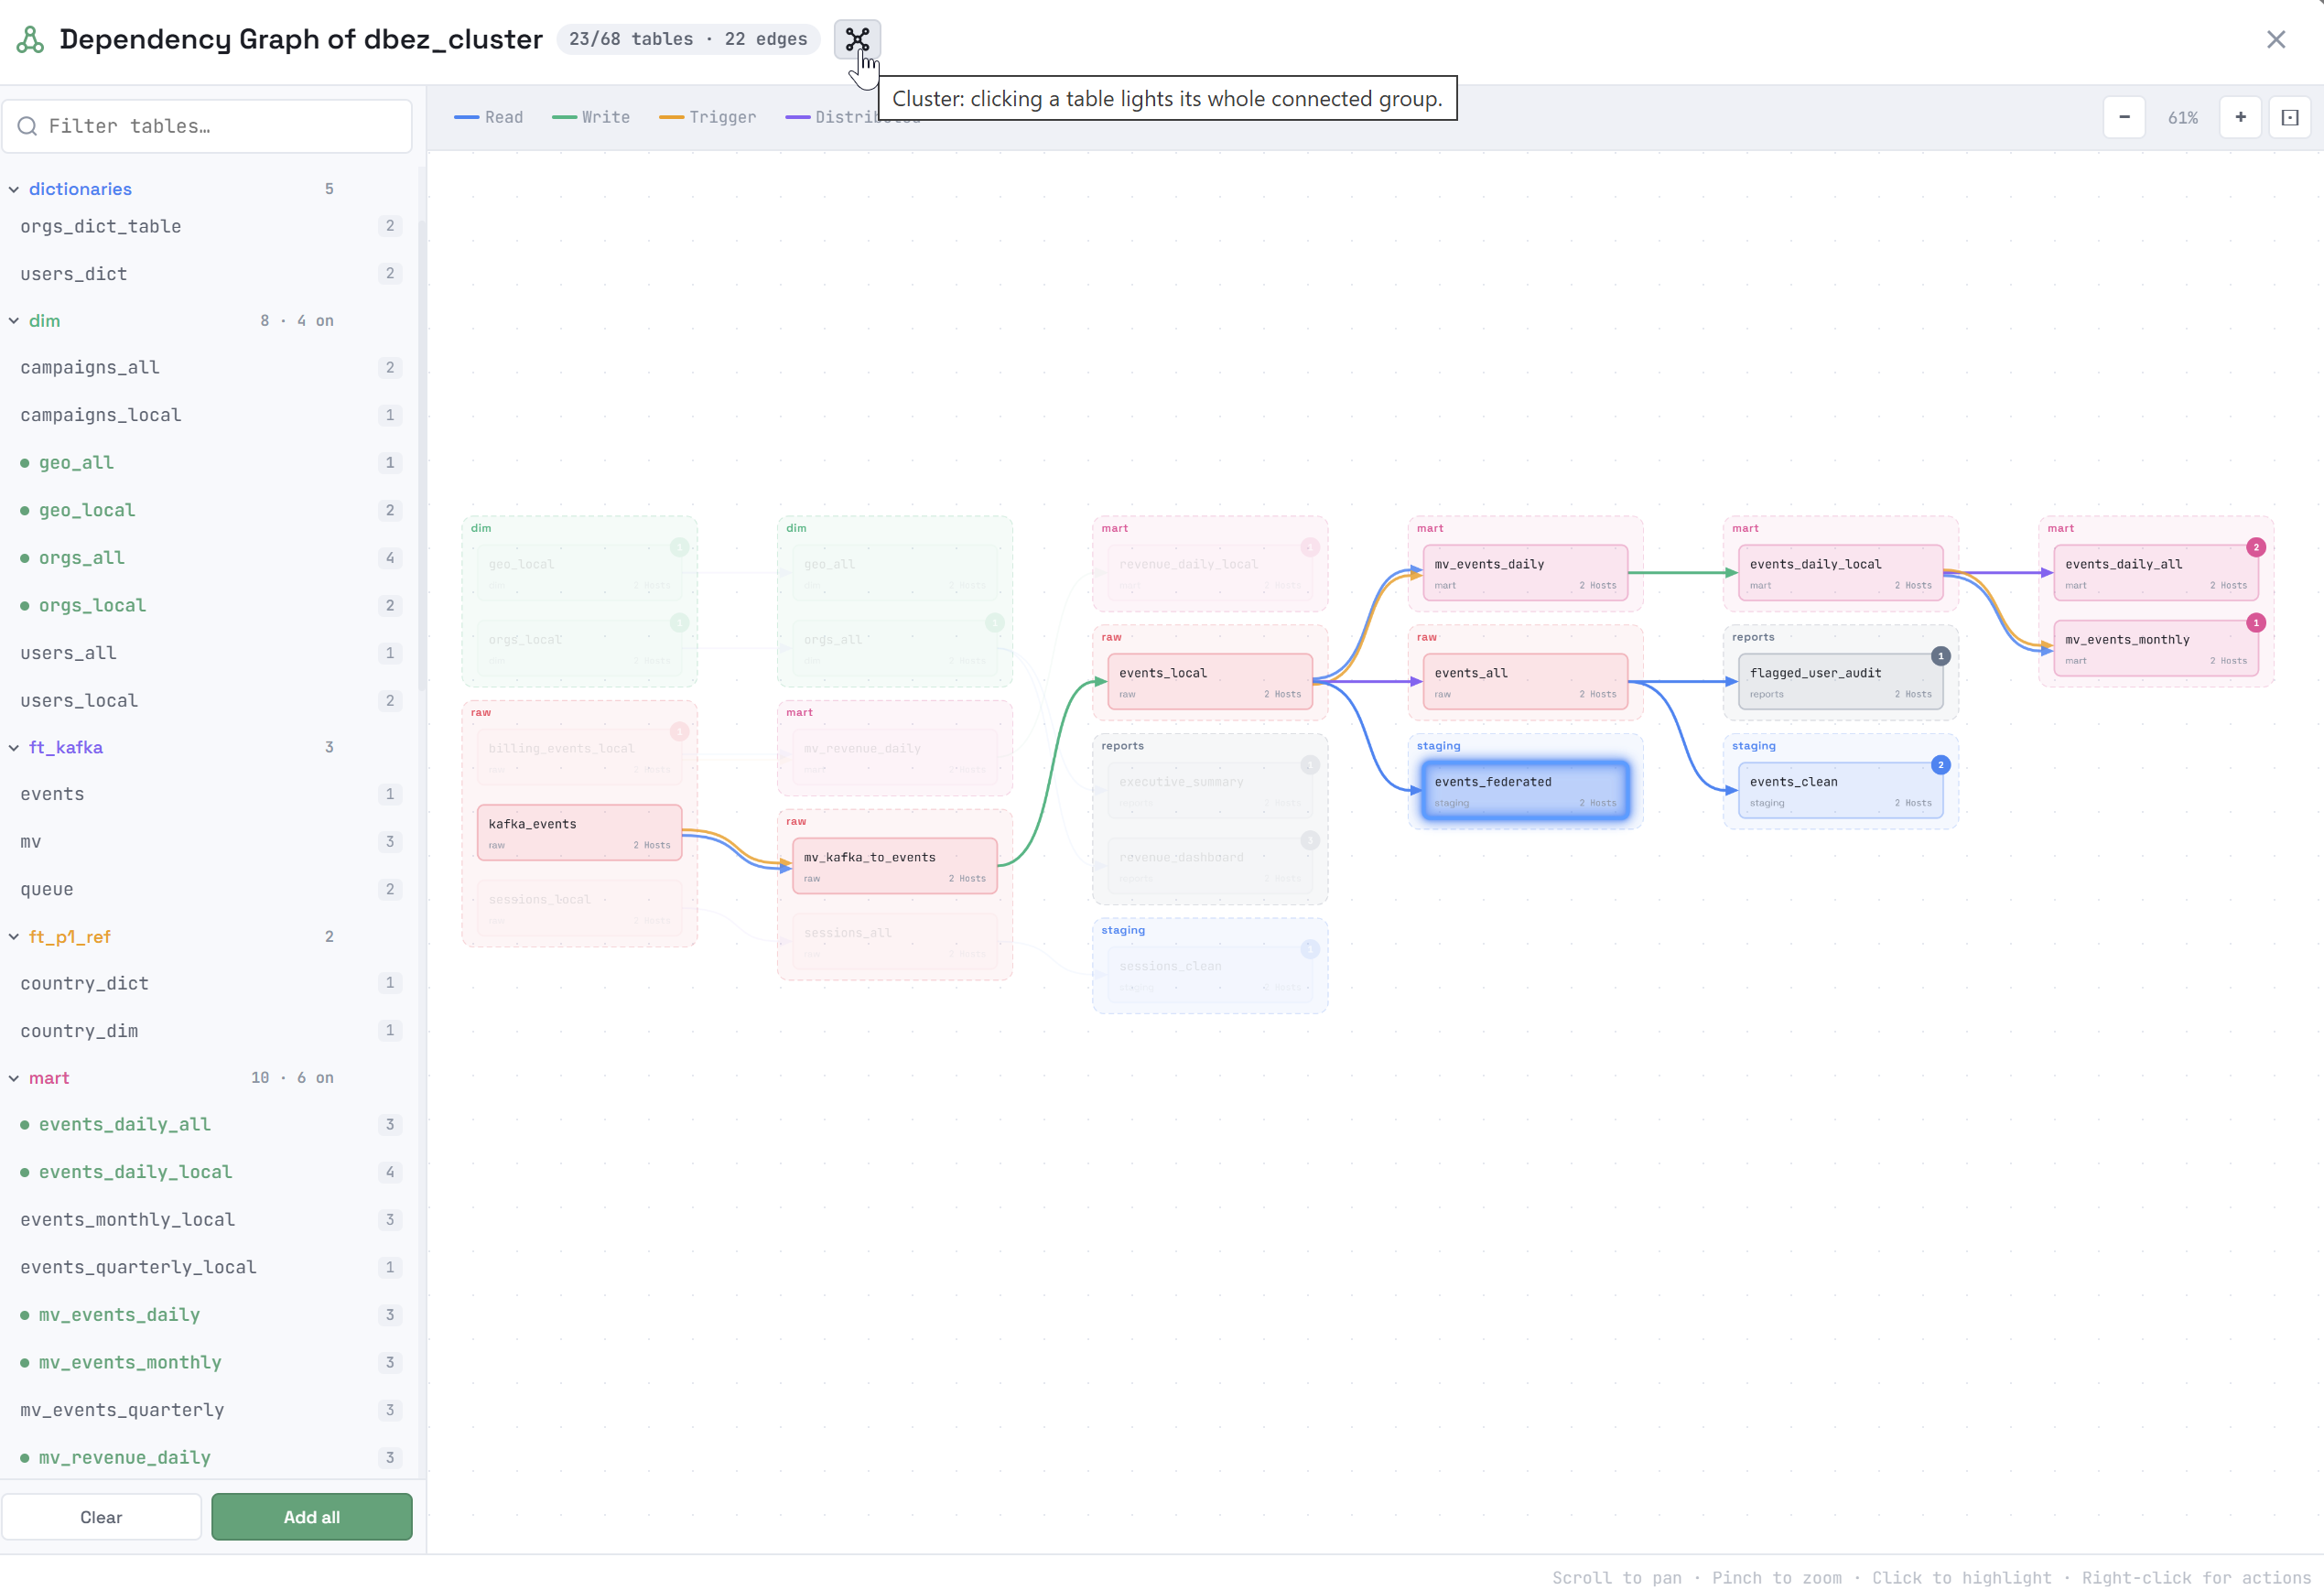
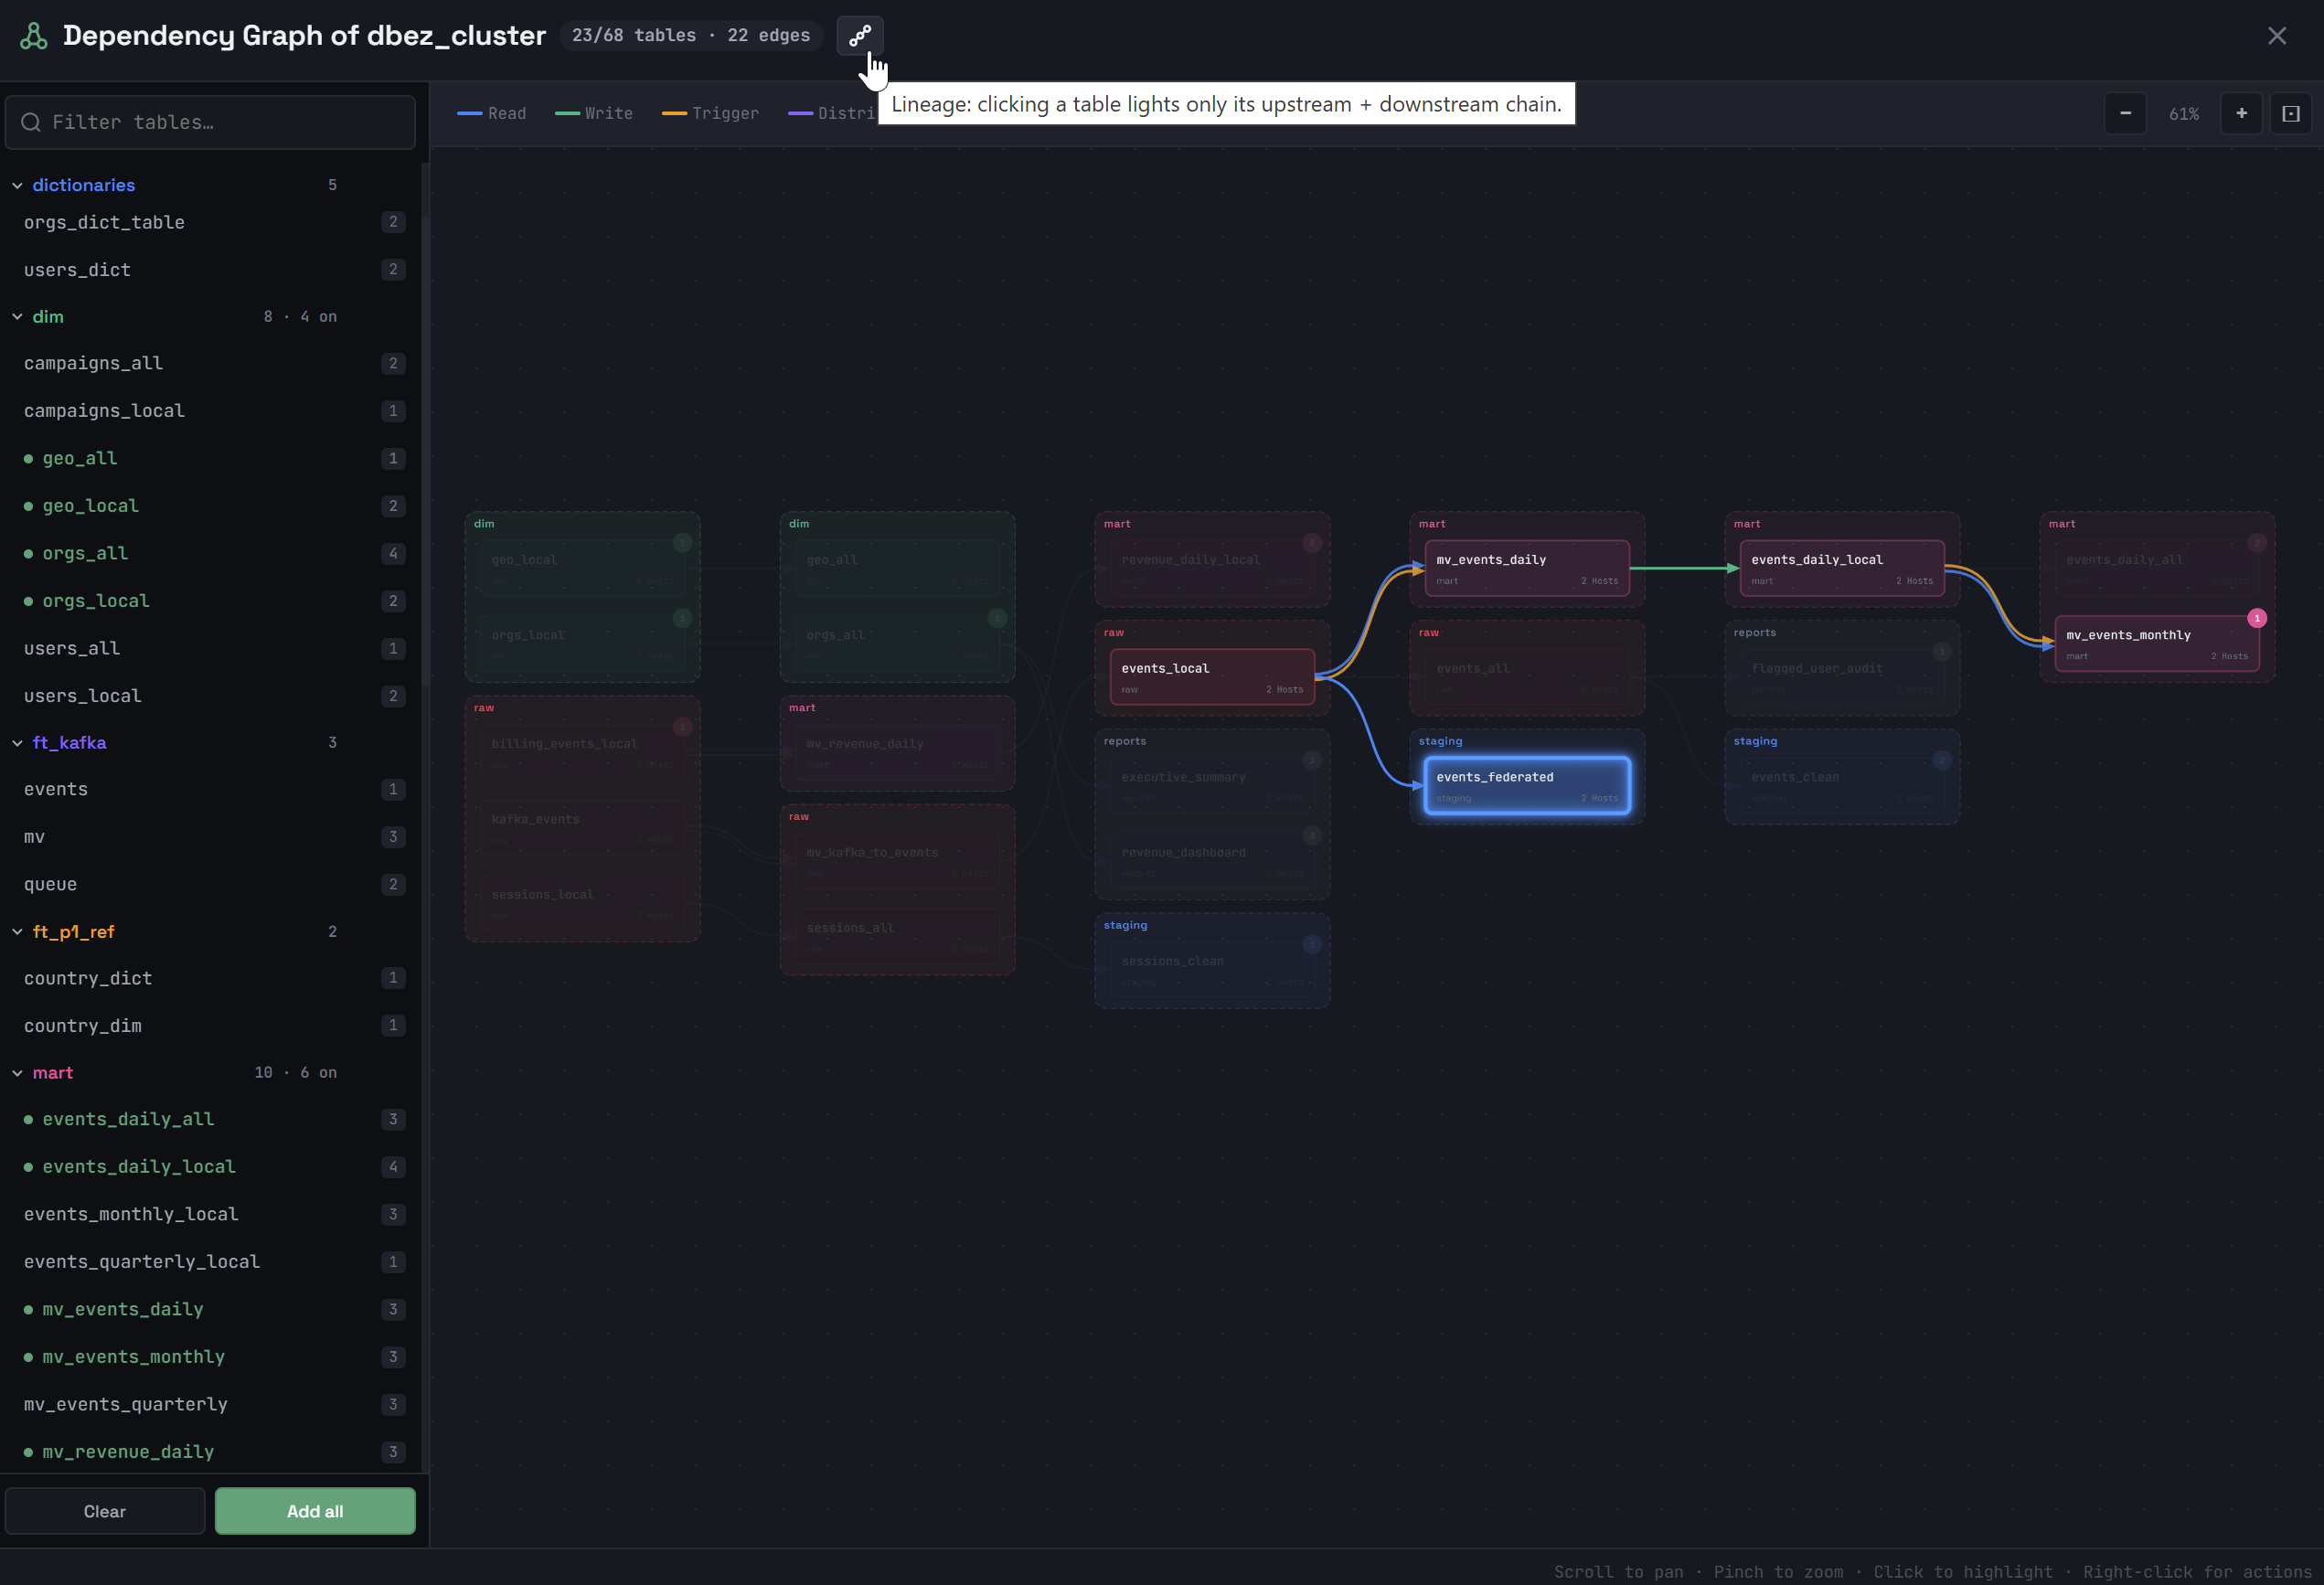
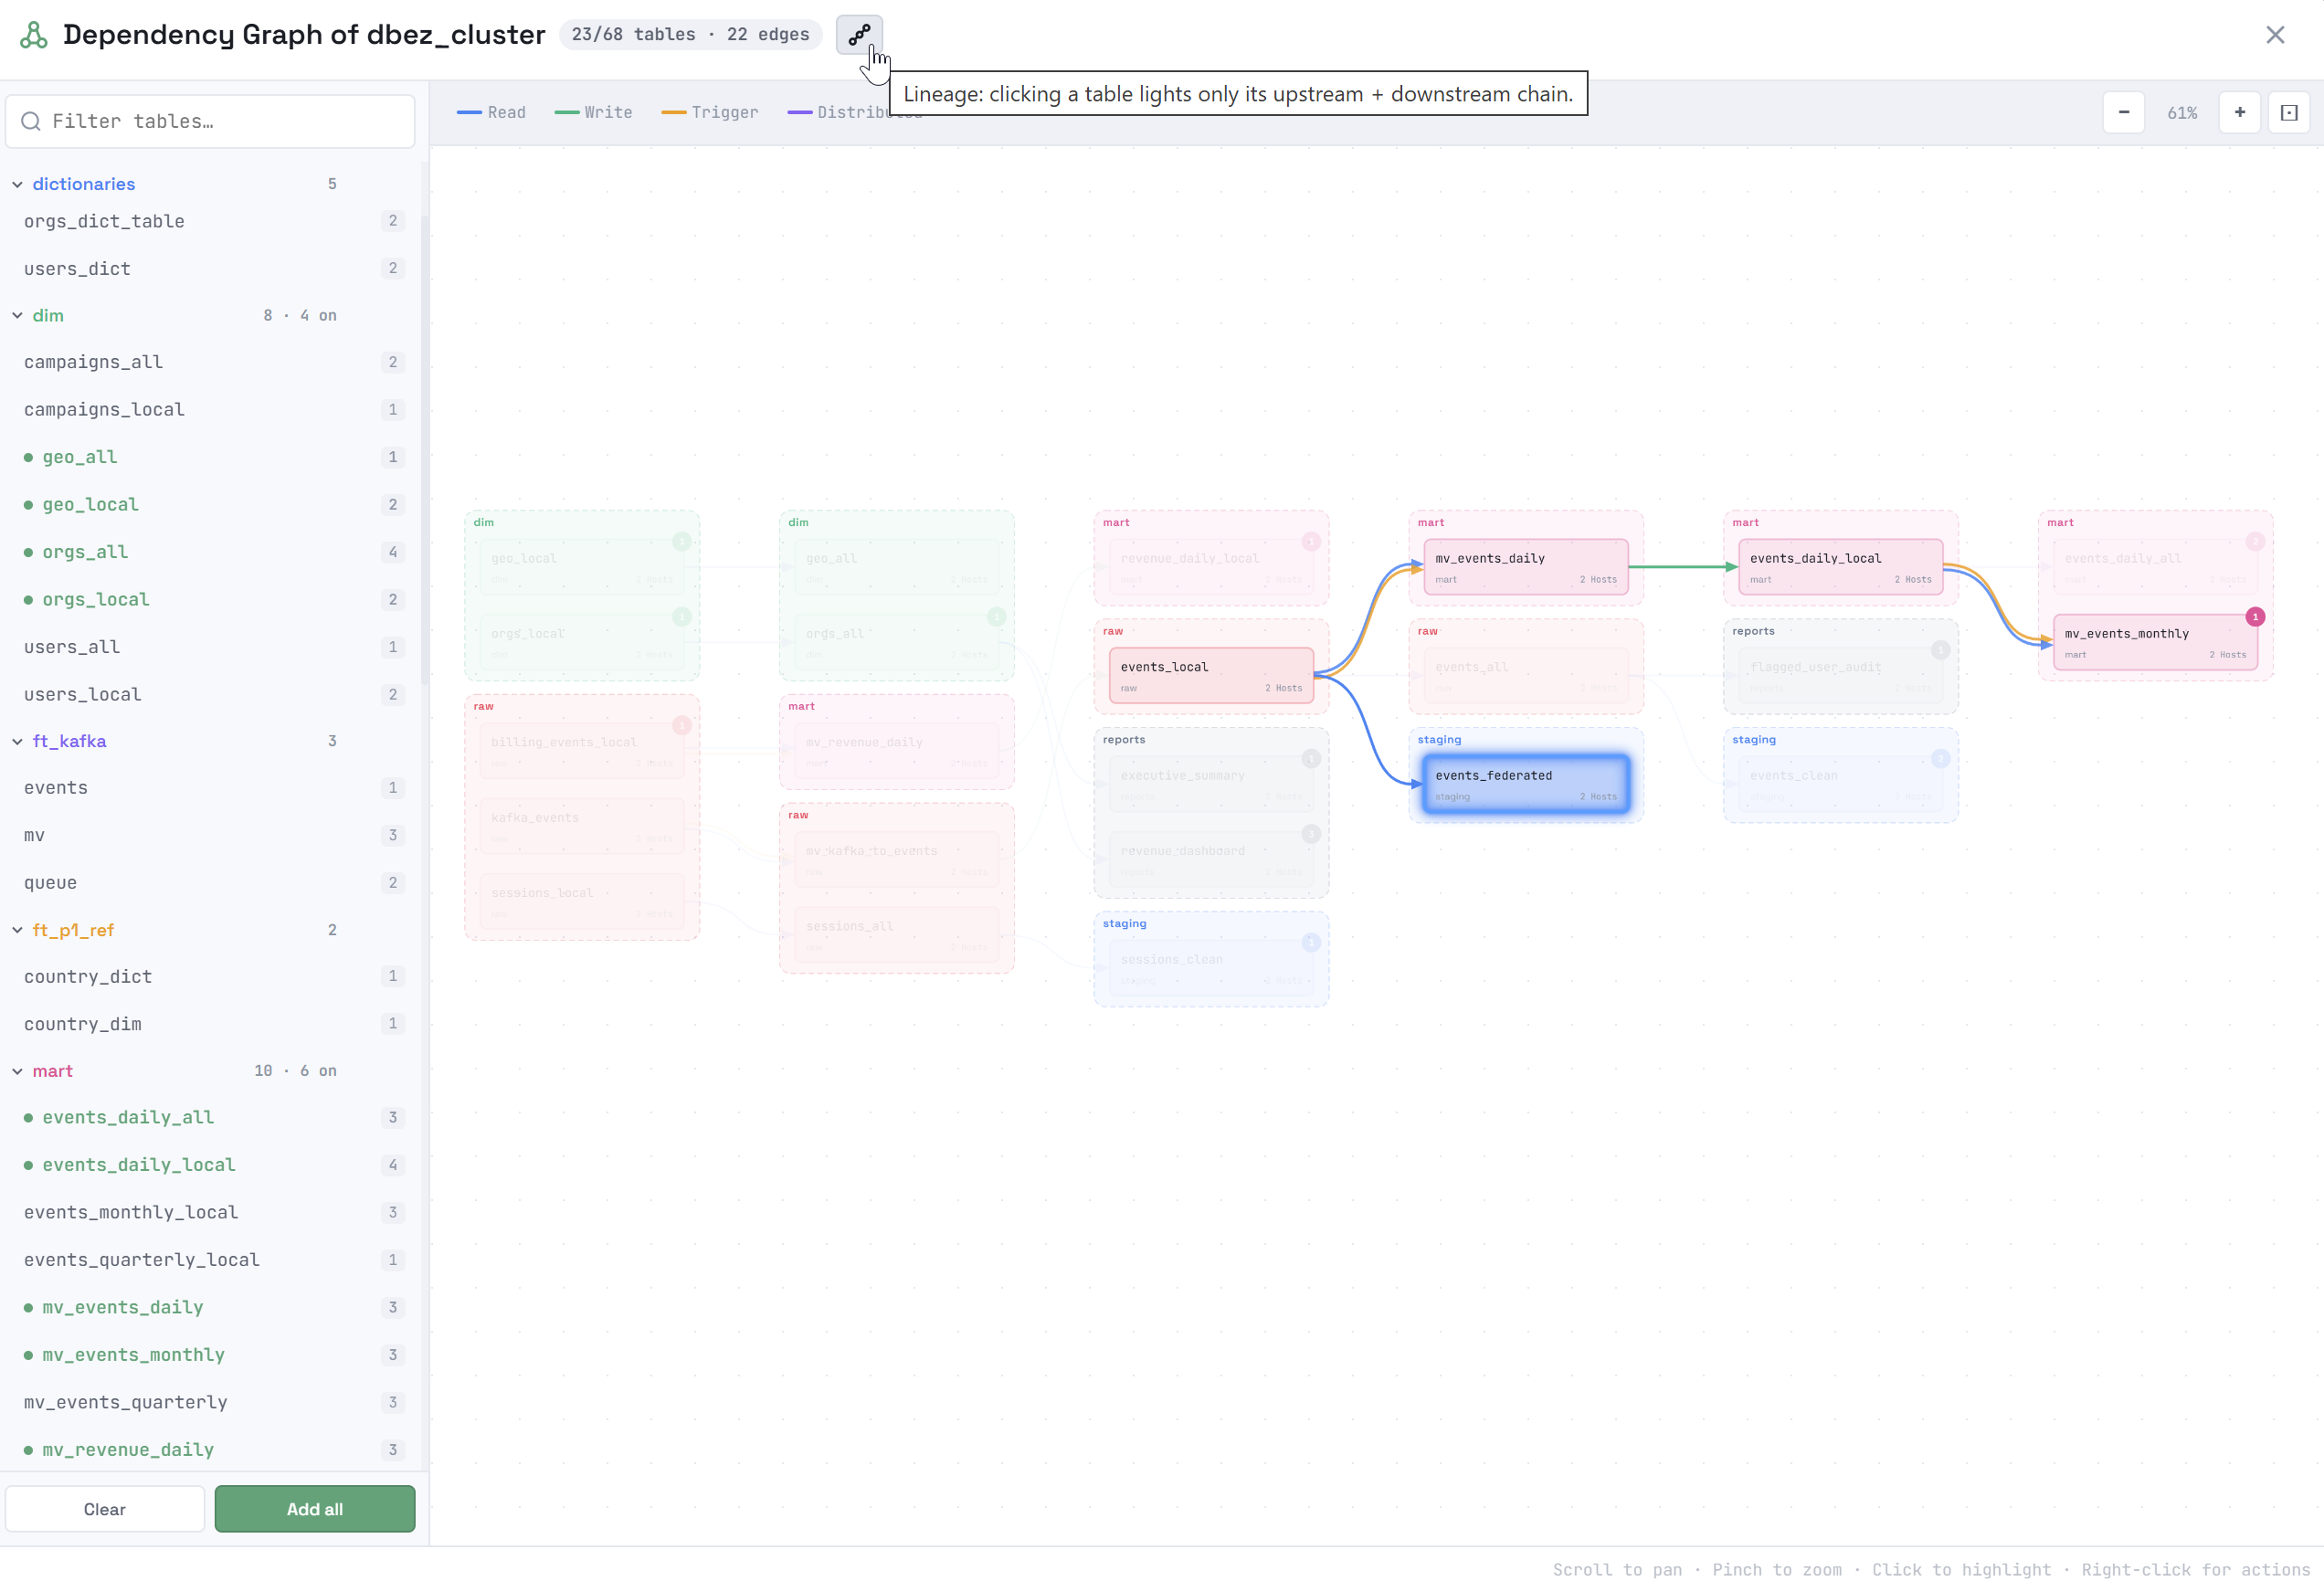
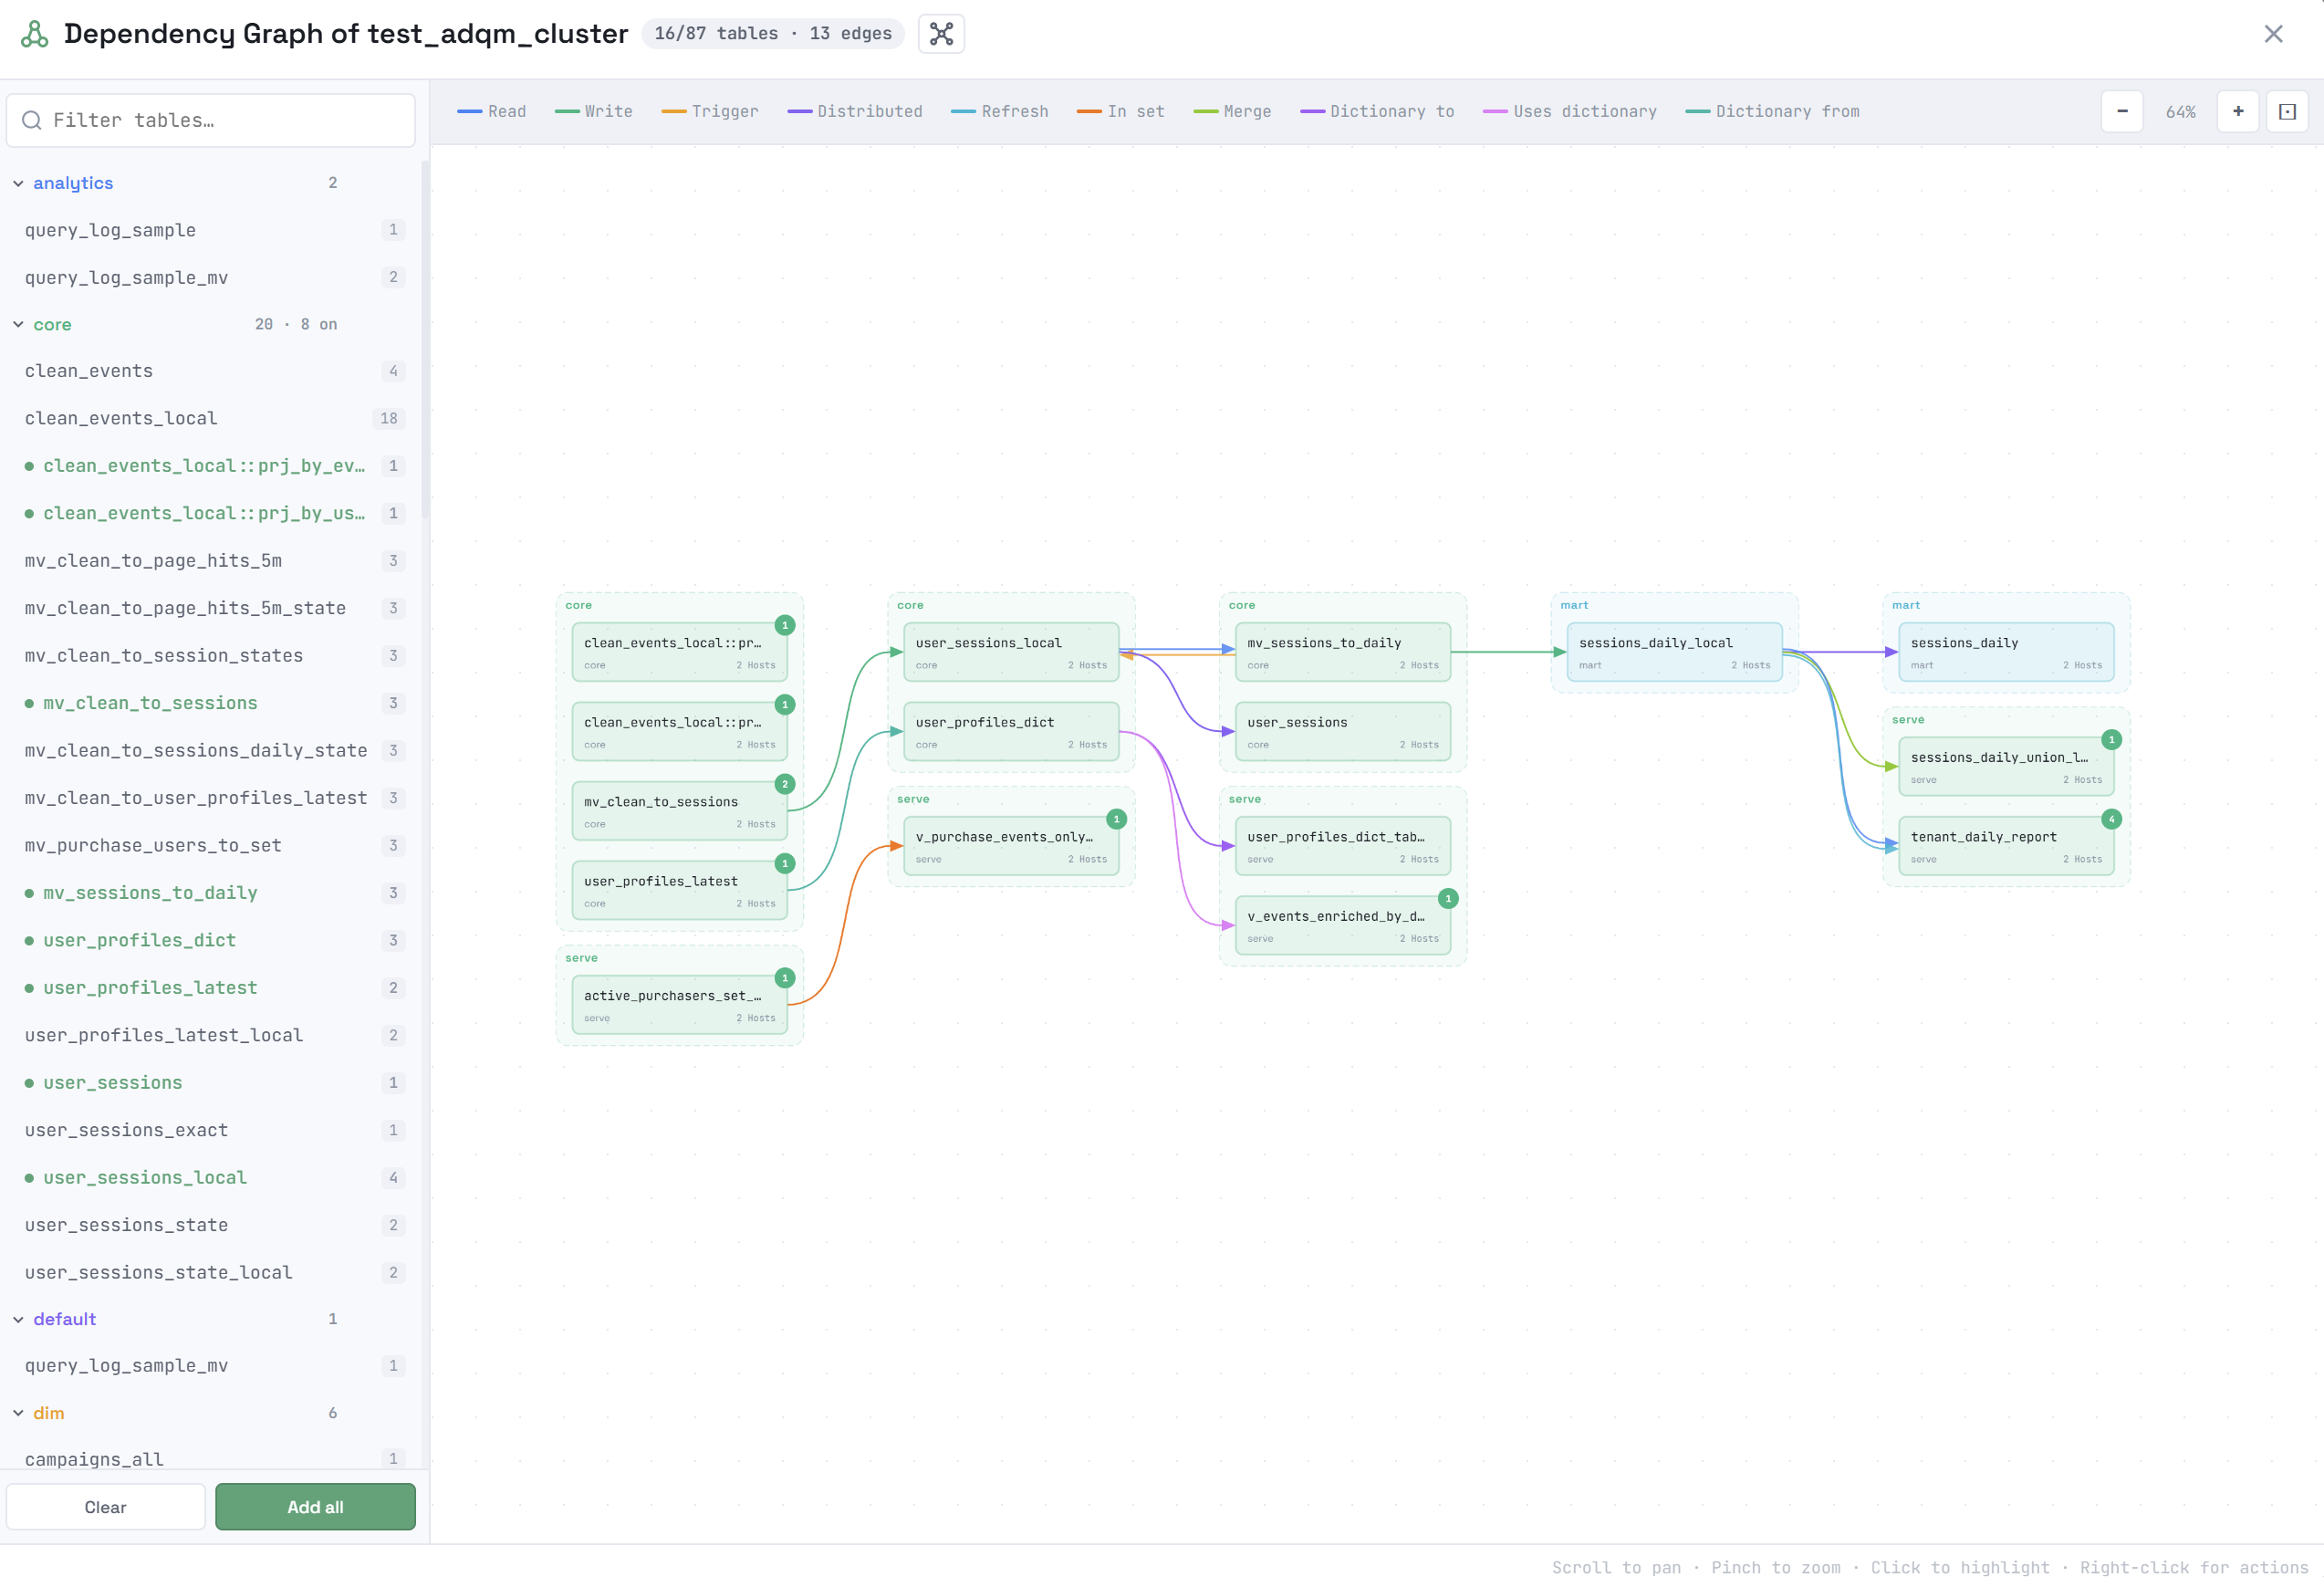
Clicking an object in the dependency graph highlights a subgraph, which includes the following objects depending on the option selected in the window title:
-

 Cluster — all connected objects. If you click another object in the same subgraph, the highlighted subgraph will not change.
 -

 Lineage — only the object’s ancestors and descendants (that is, a "neighboring" object that has the same source as the selected object, but does not belong to the directed path, is not included in the highlighted subgraph). Clicking another object in this subgraph will highlight another subgraph — that object’s lineage.