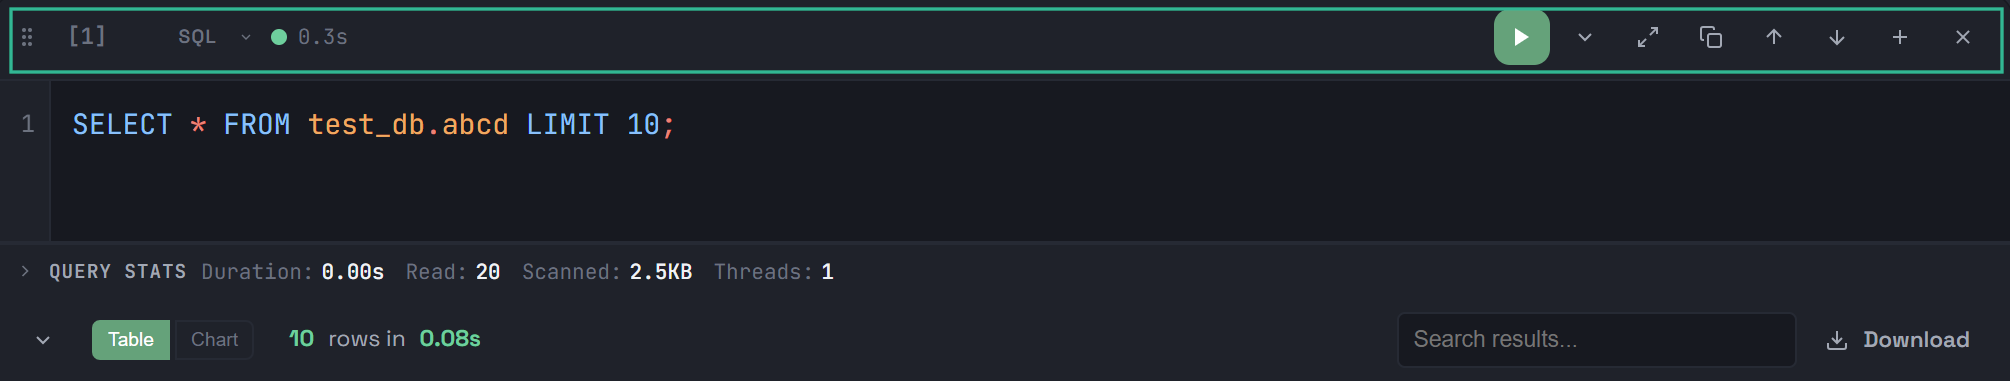
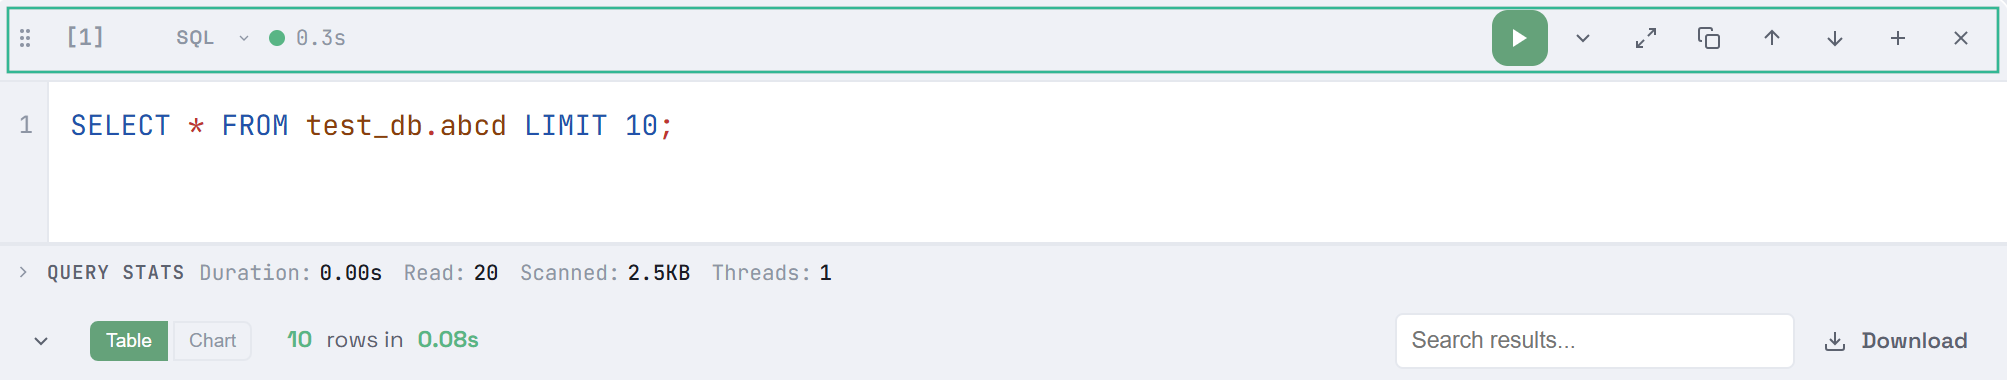
SQL cells
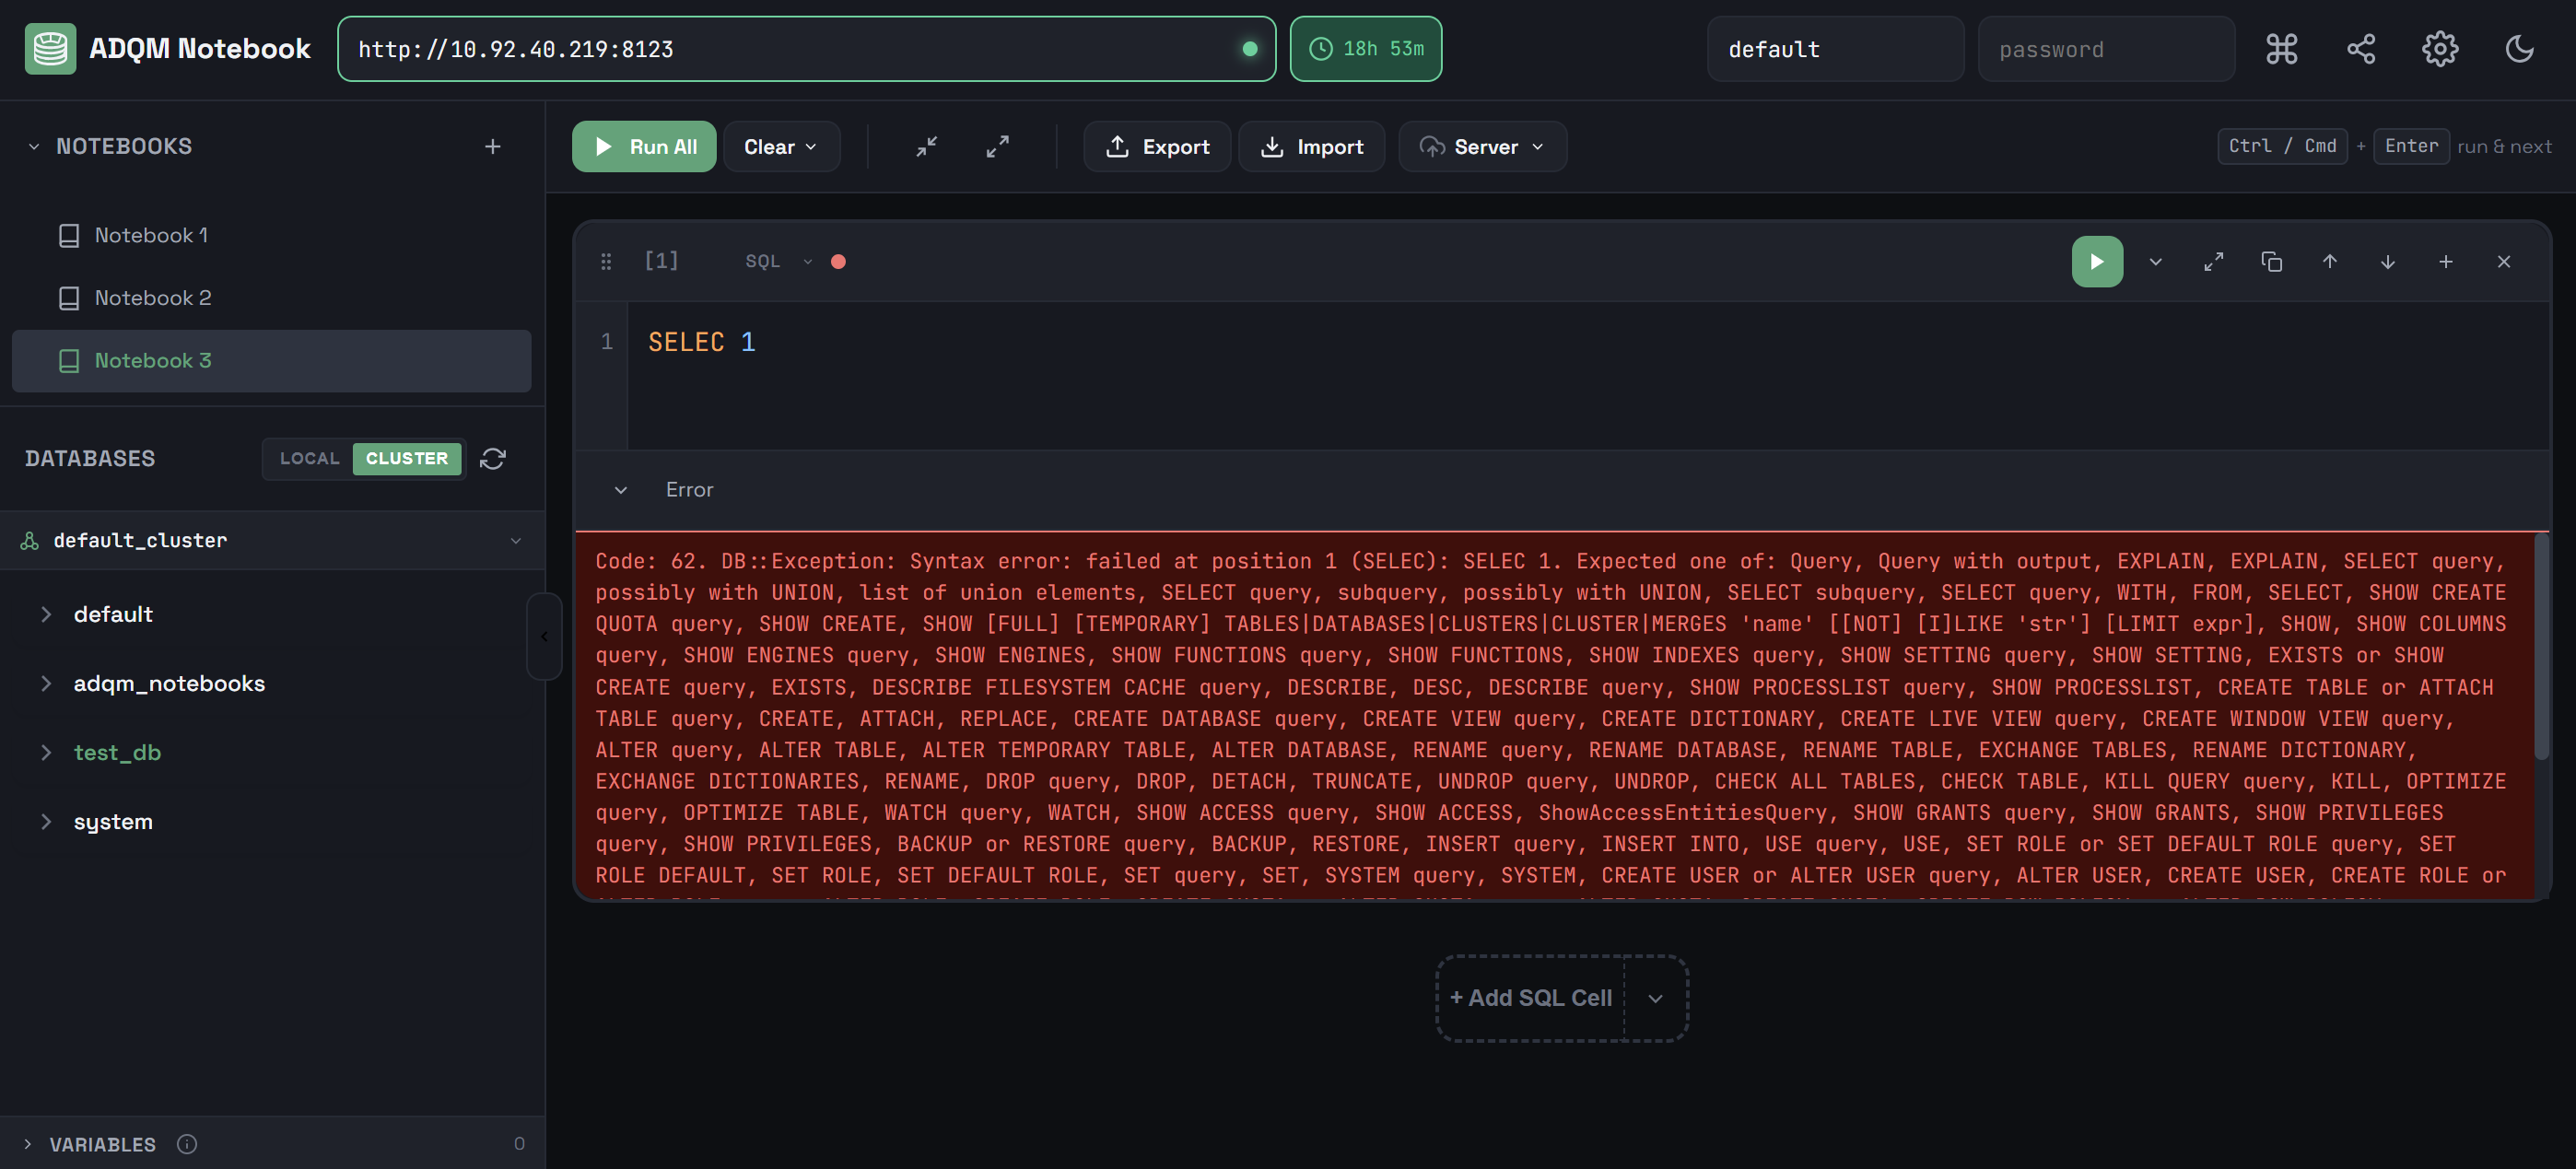
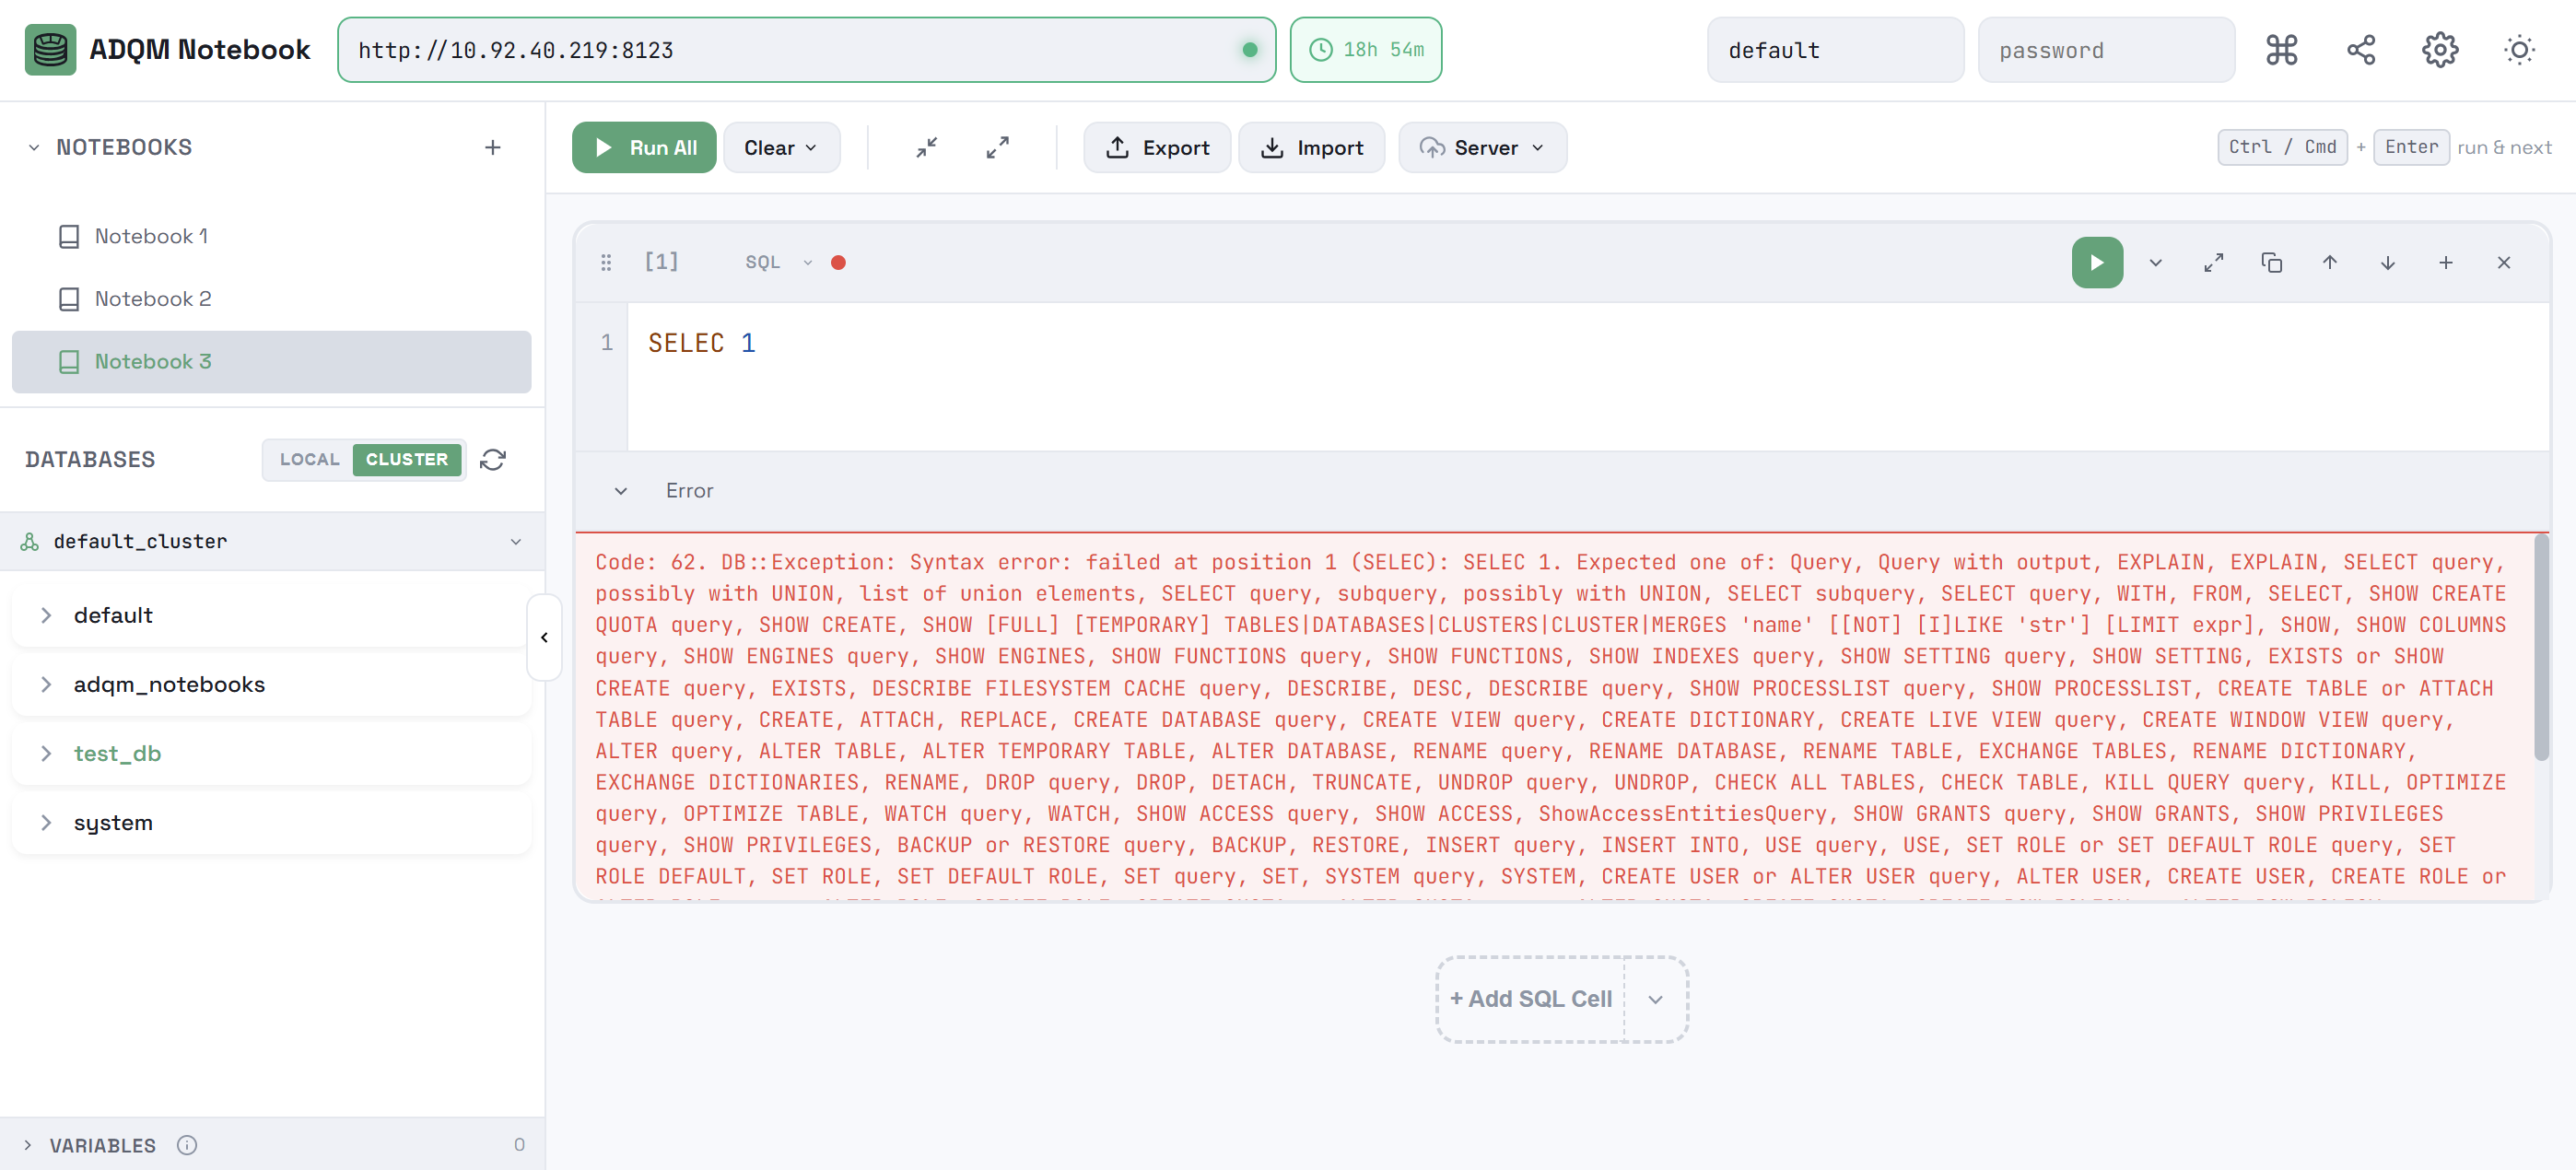
A new SQL cell contains the SQL query editor and control panel. After the query is executed, query execution statistics (QUERY STATS) and query results panel (or the Error panel, if an error occurred during the query execution) are added to the cell.
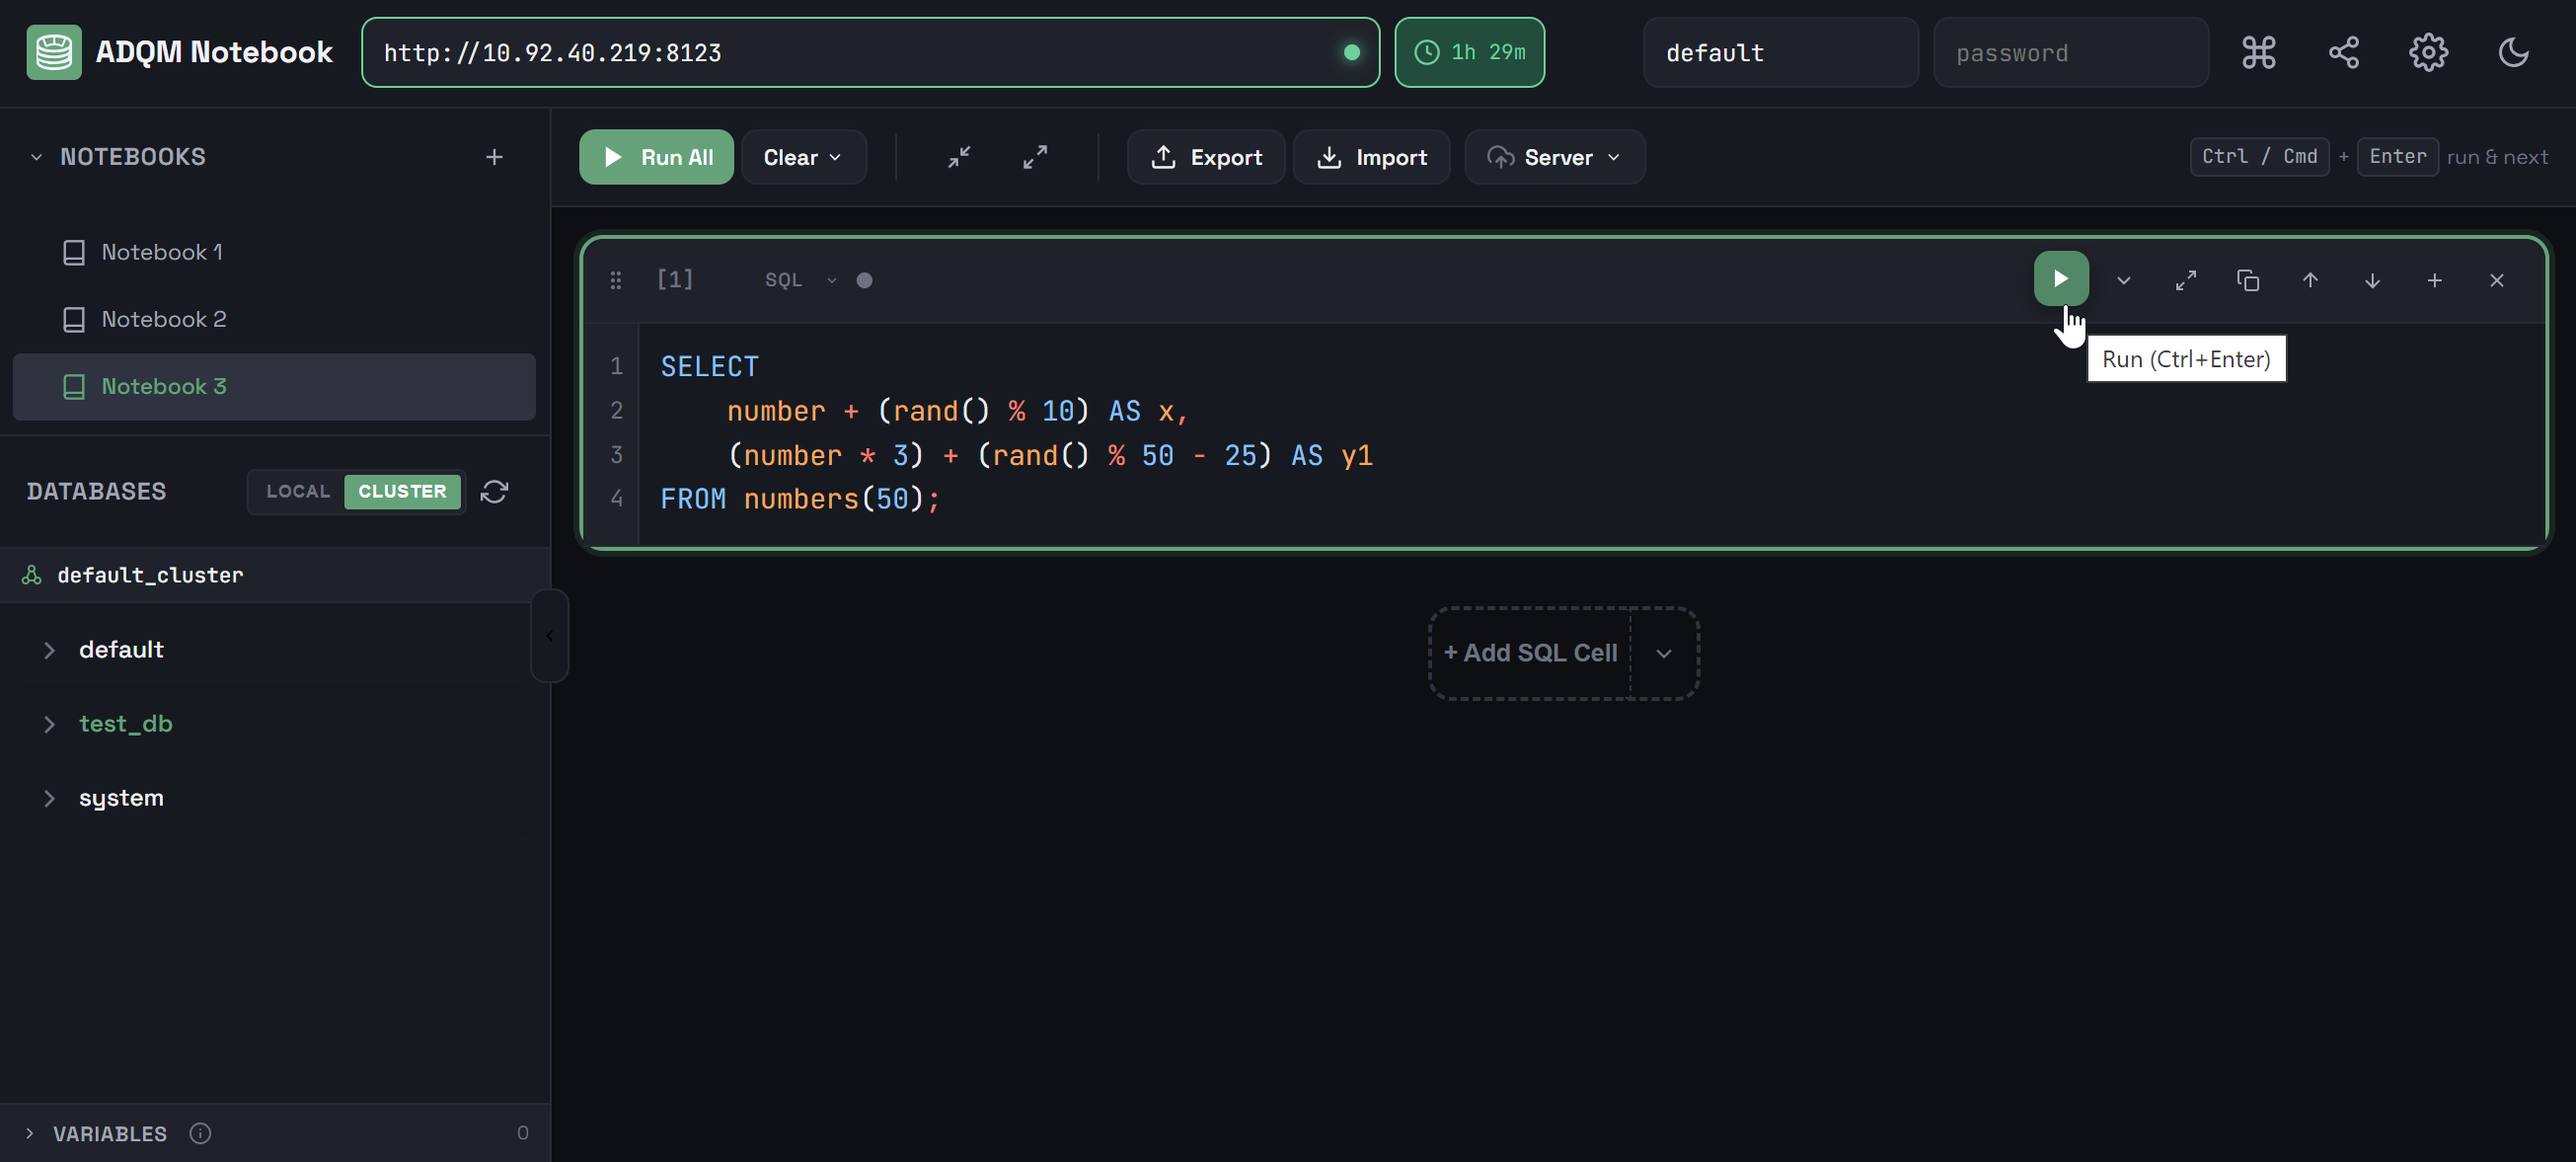
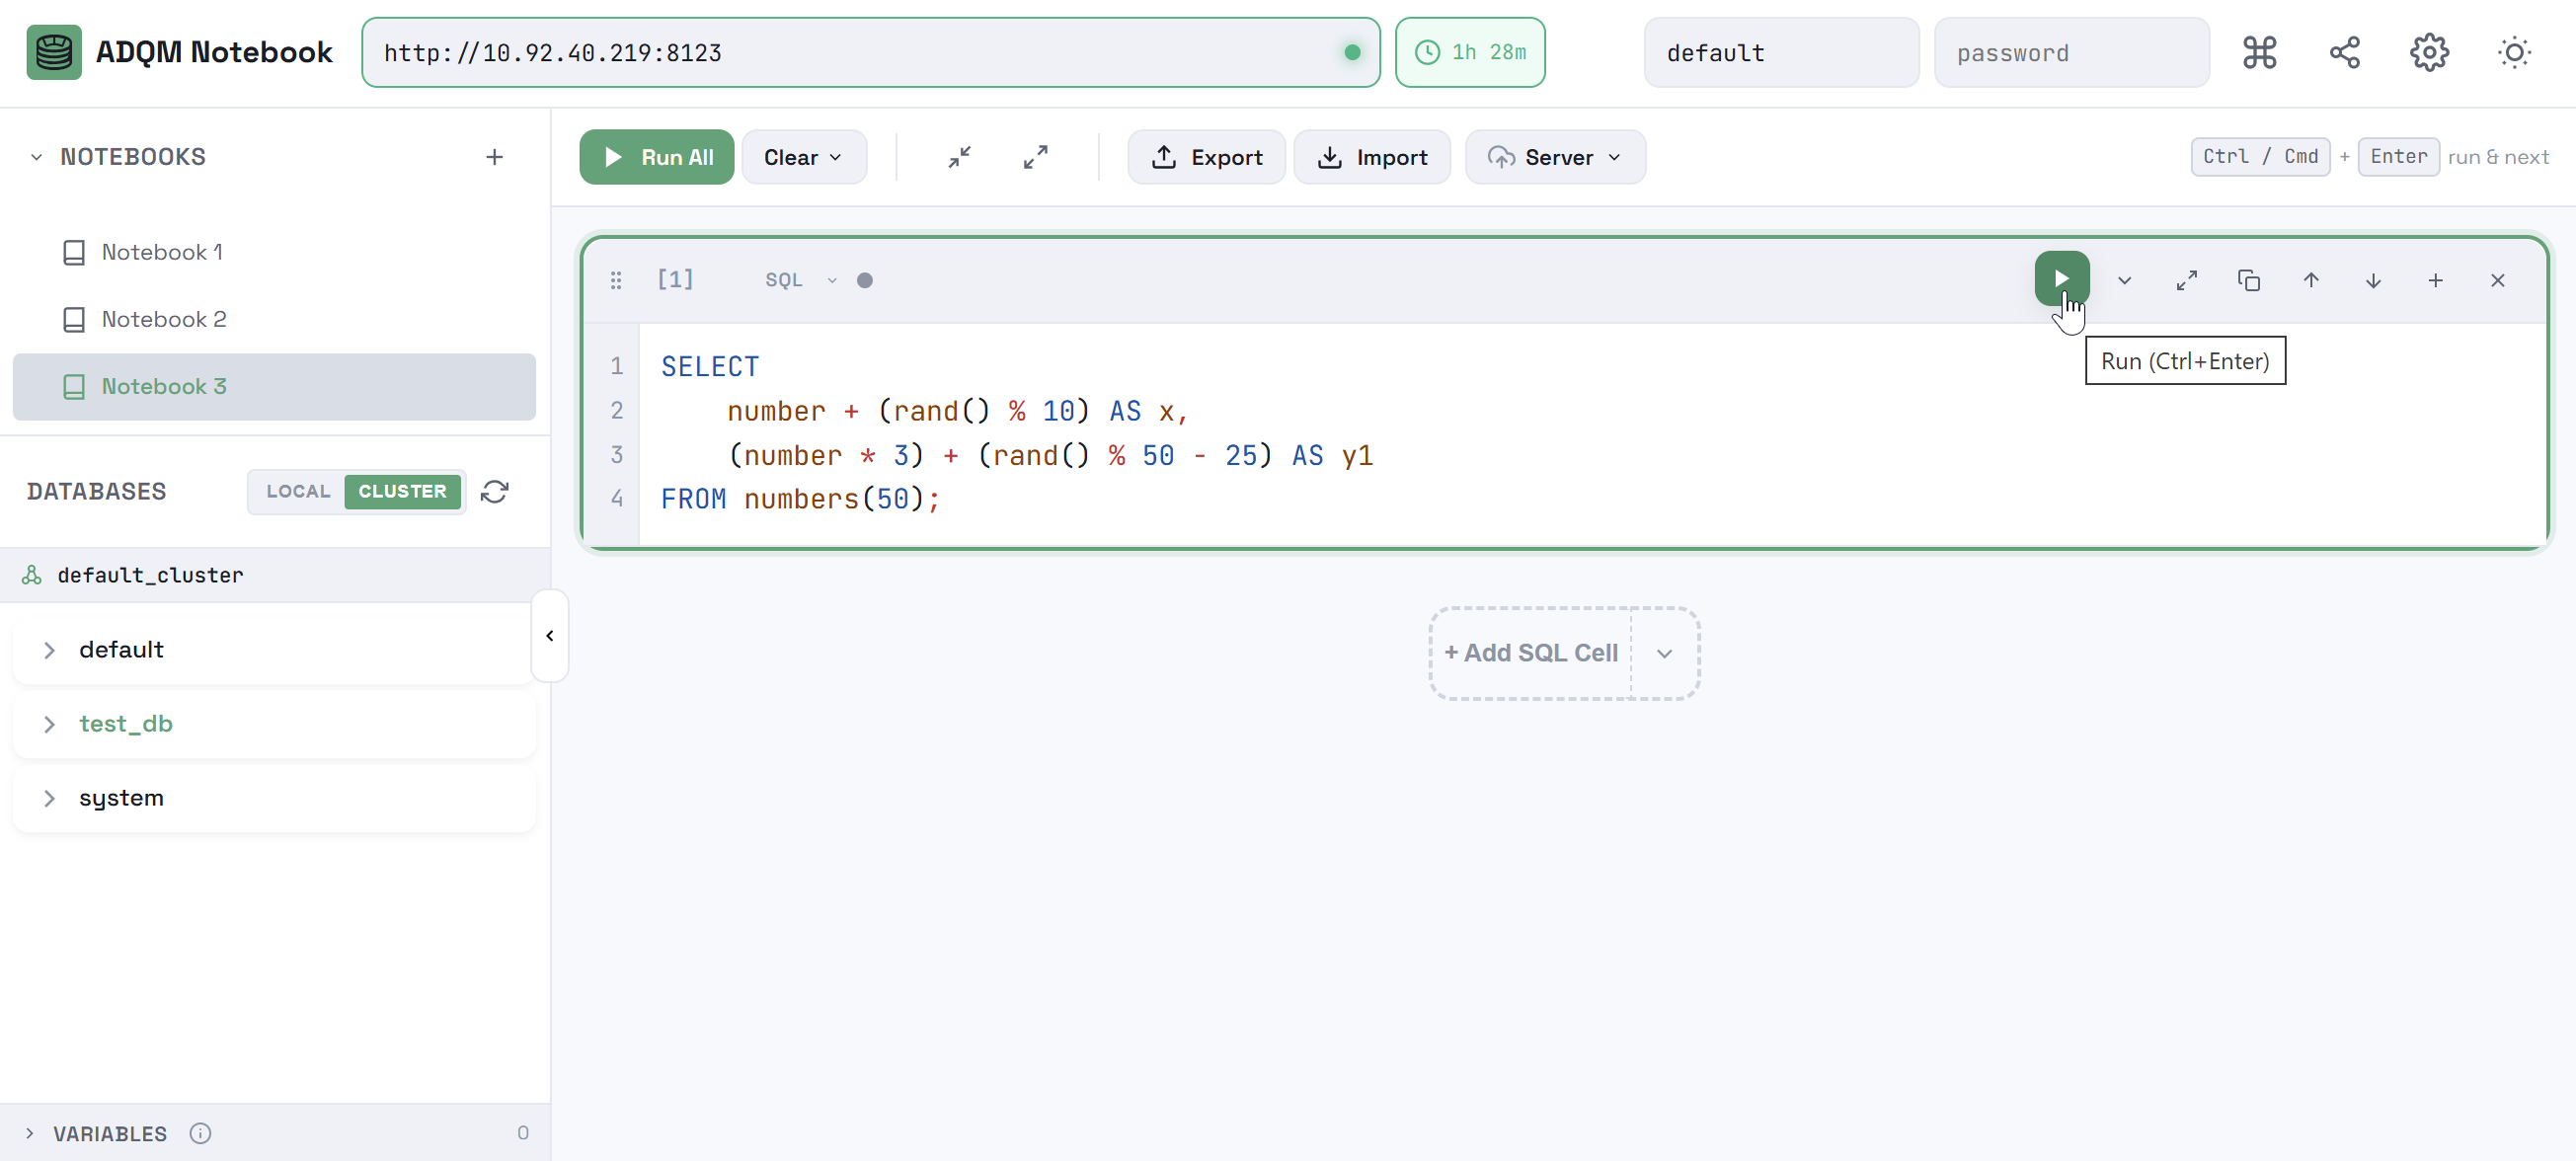
When created, a new notebook contains one SQL cell.
Query text
The SQL query editor provides the following functionality:
-
SQL syntax highlighting.
-
Line numbering (can be enabled/disabled in the settings, see below). Clicking a line number selects the entire line.
-
Automatic closing of brackets and quotation marks as you type (controlled by the corresponding setting).
-
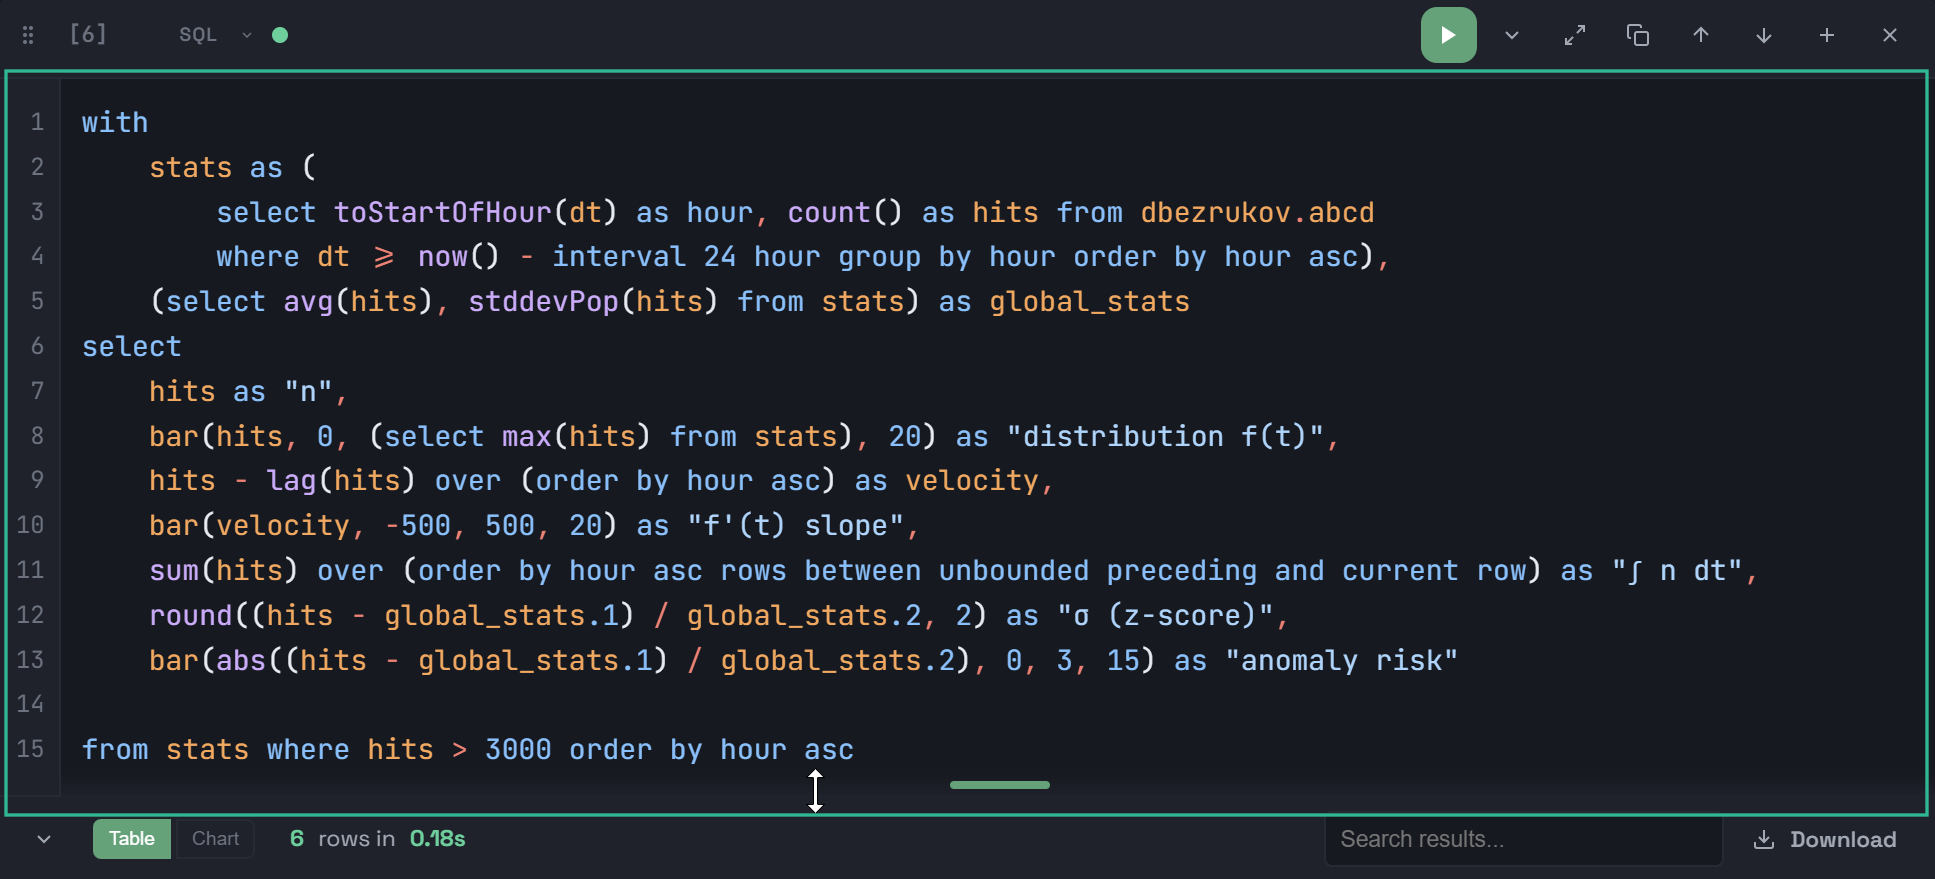
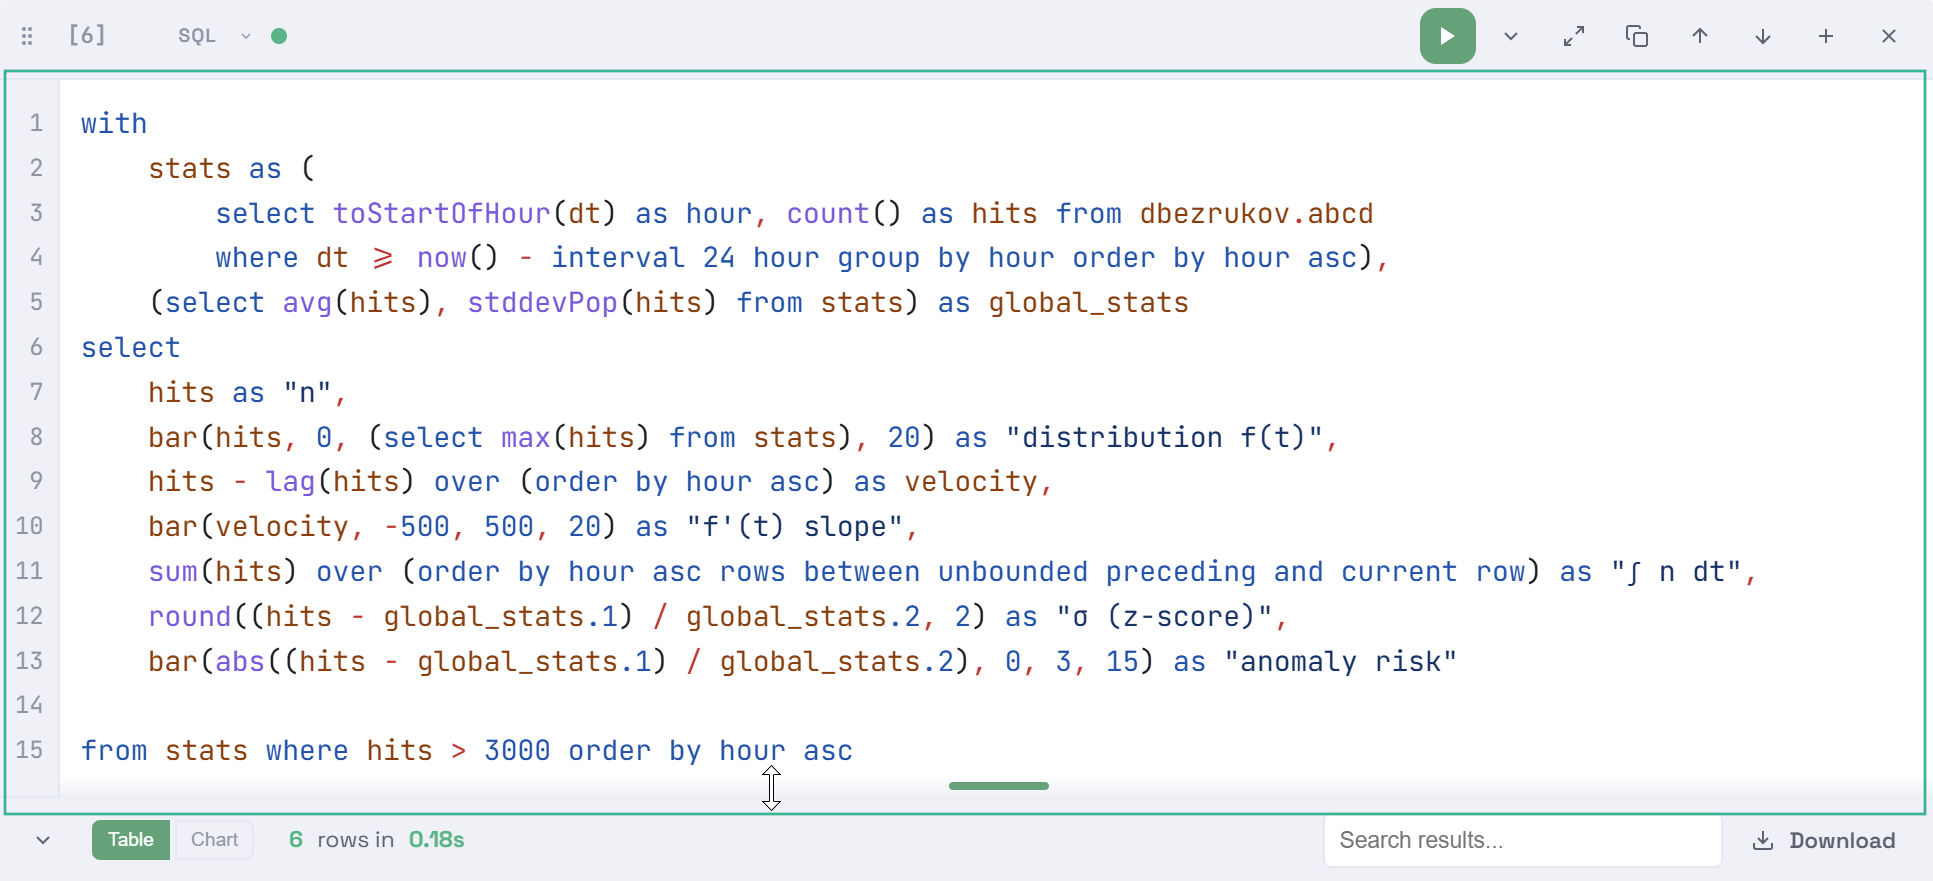
Automatic increasing/decreasing the editor based on the size of the SQL code. The editor can also be resized manually by dragging its bottom border. Double-clicking the resize handle at the bottom of the editor returns it to the size determined automatically depending on the size of the query text.
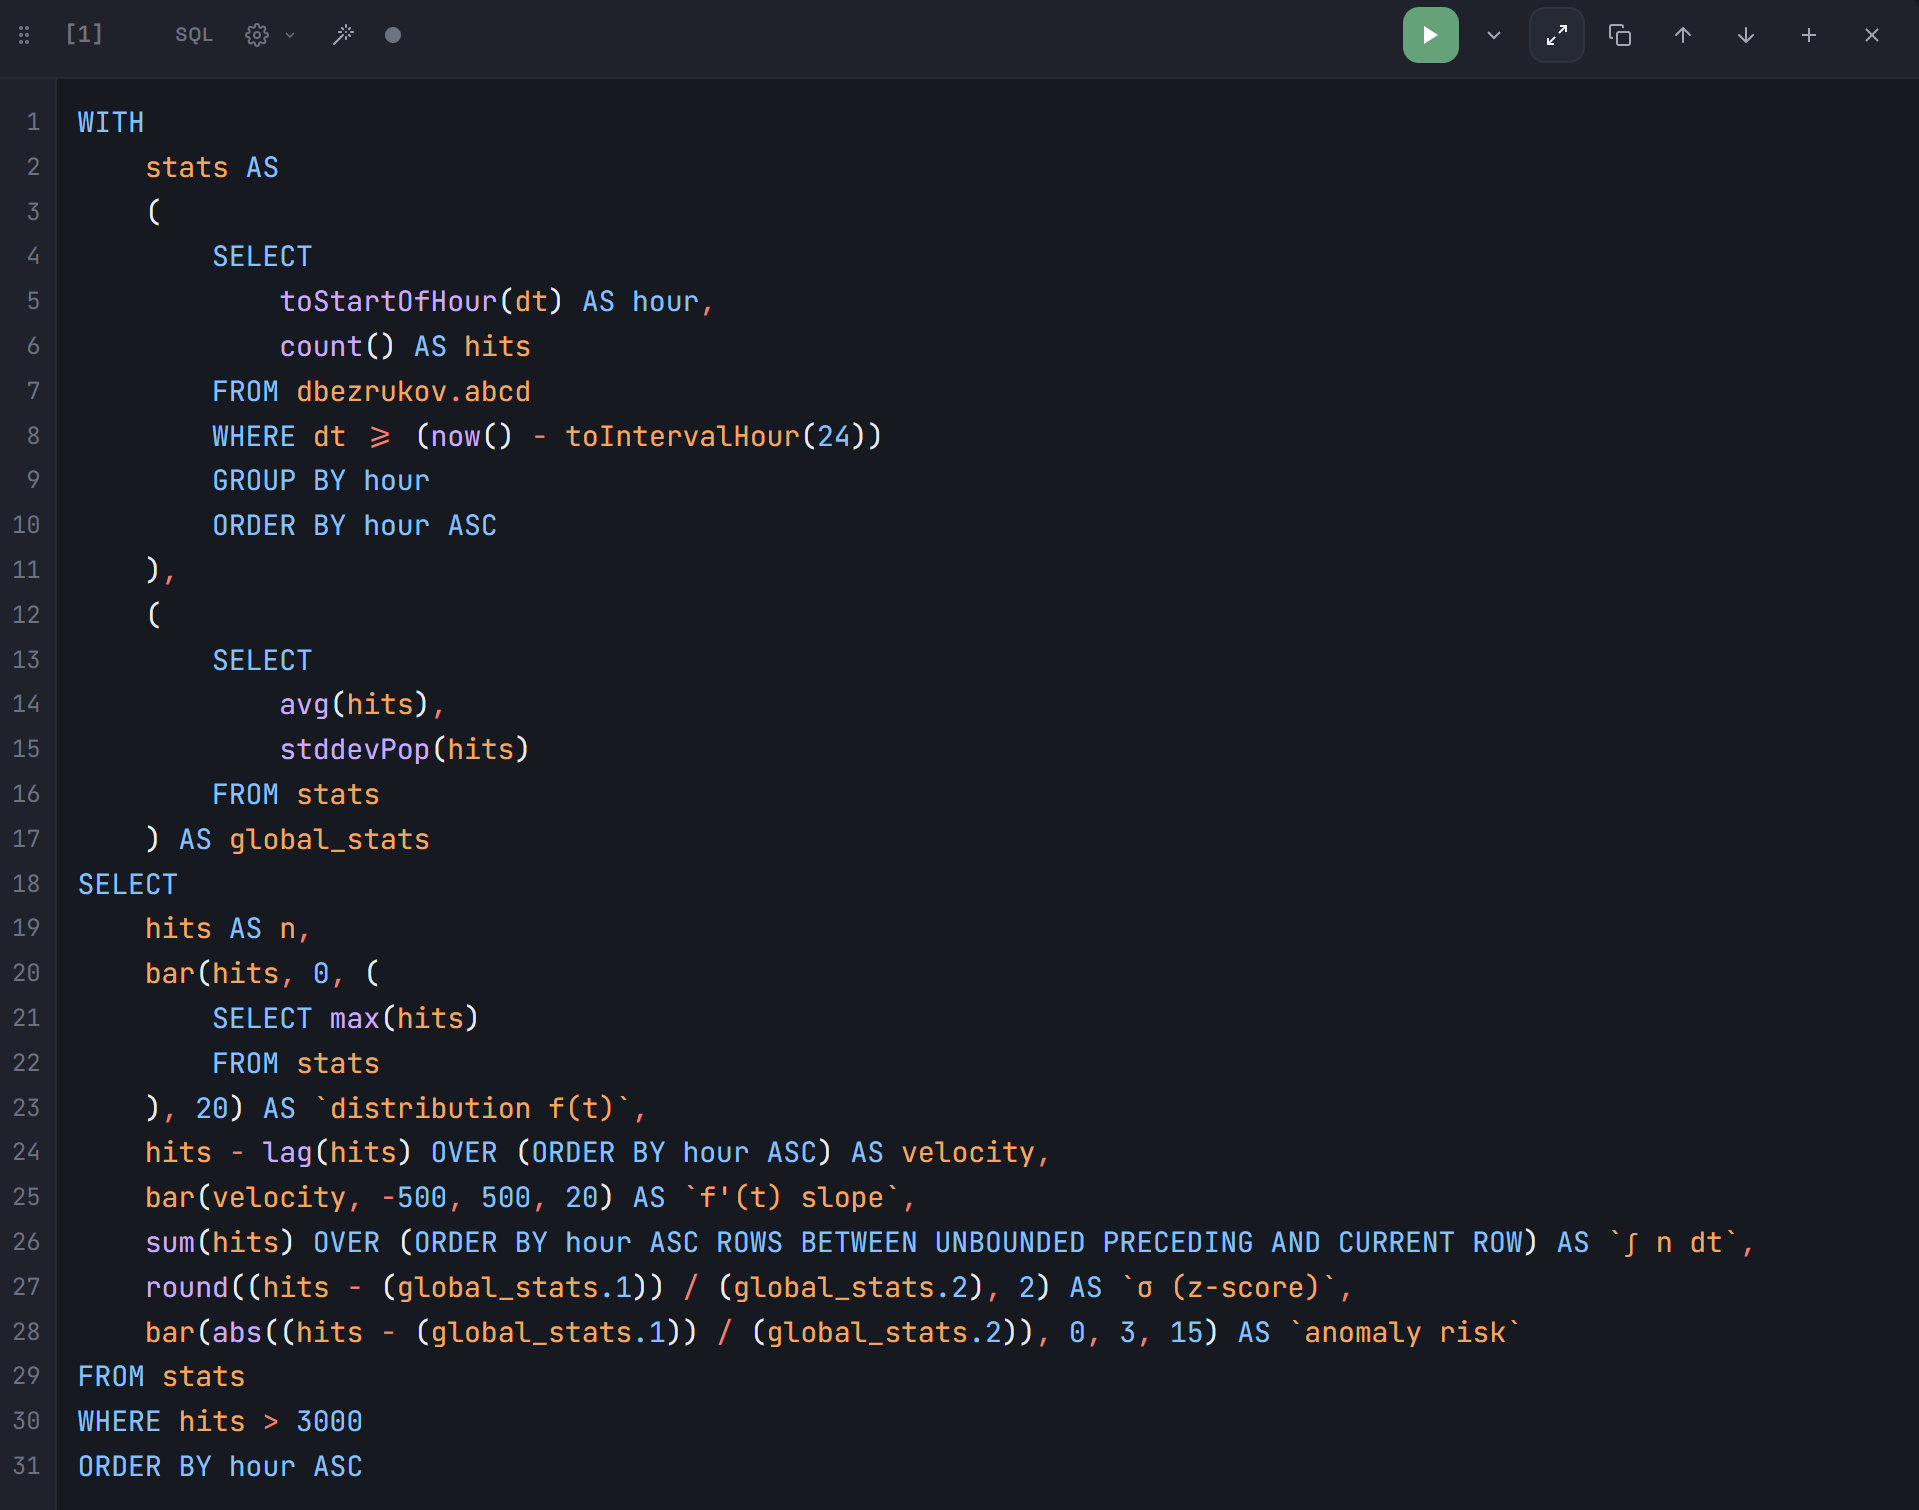
Beautify SQL
Use the ![]()
![]() Beautify SQL icon to automatically make your query code more readable as follows:
Beautify SQL icon to automatically make your query code more readable as follows:
-
use consistent indents and spaces to structure the code logically;
-
place major clauses (such as
SELECT,FROM,WHERE,JOIN, etc.) on separate lines; -
use uppercase for all SQL keywords (for example,
SELECT,AS,FROM,GROUP BY,ORDER BY); -
break long lists of columns to be selected into lines — one column per line.
|
NOTE
Beautify SQL applies formatting to the query text based on the results of EXPLAIN SYNTAX, so the ClickHouse server should be available for this functionality to work. |
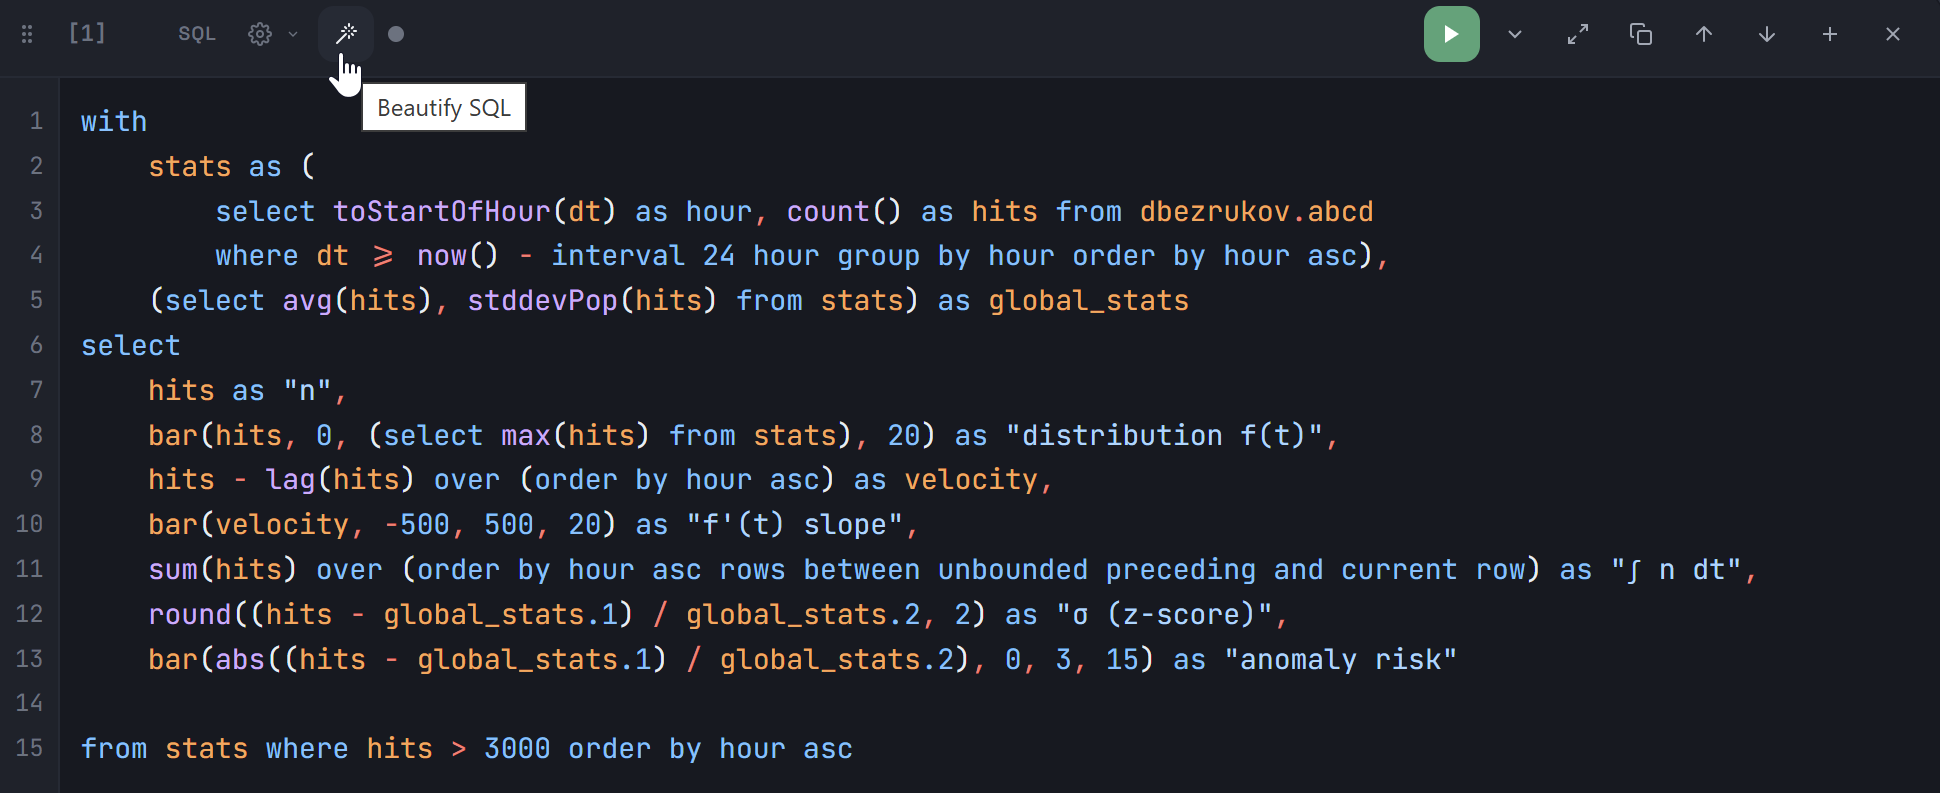
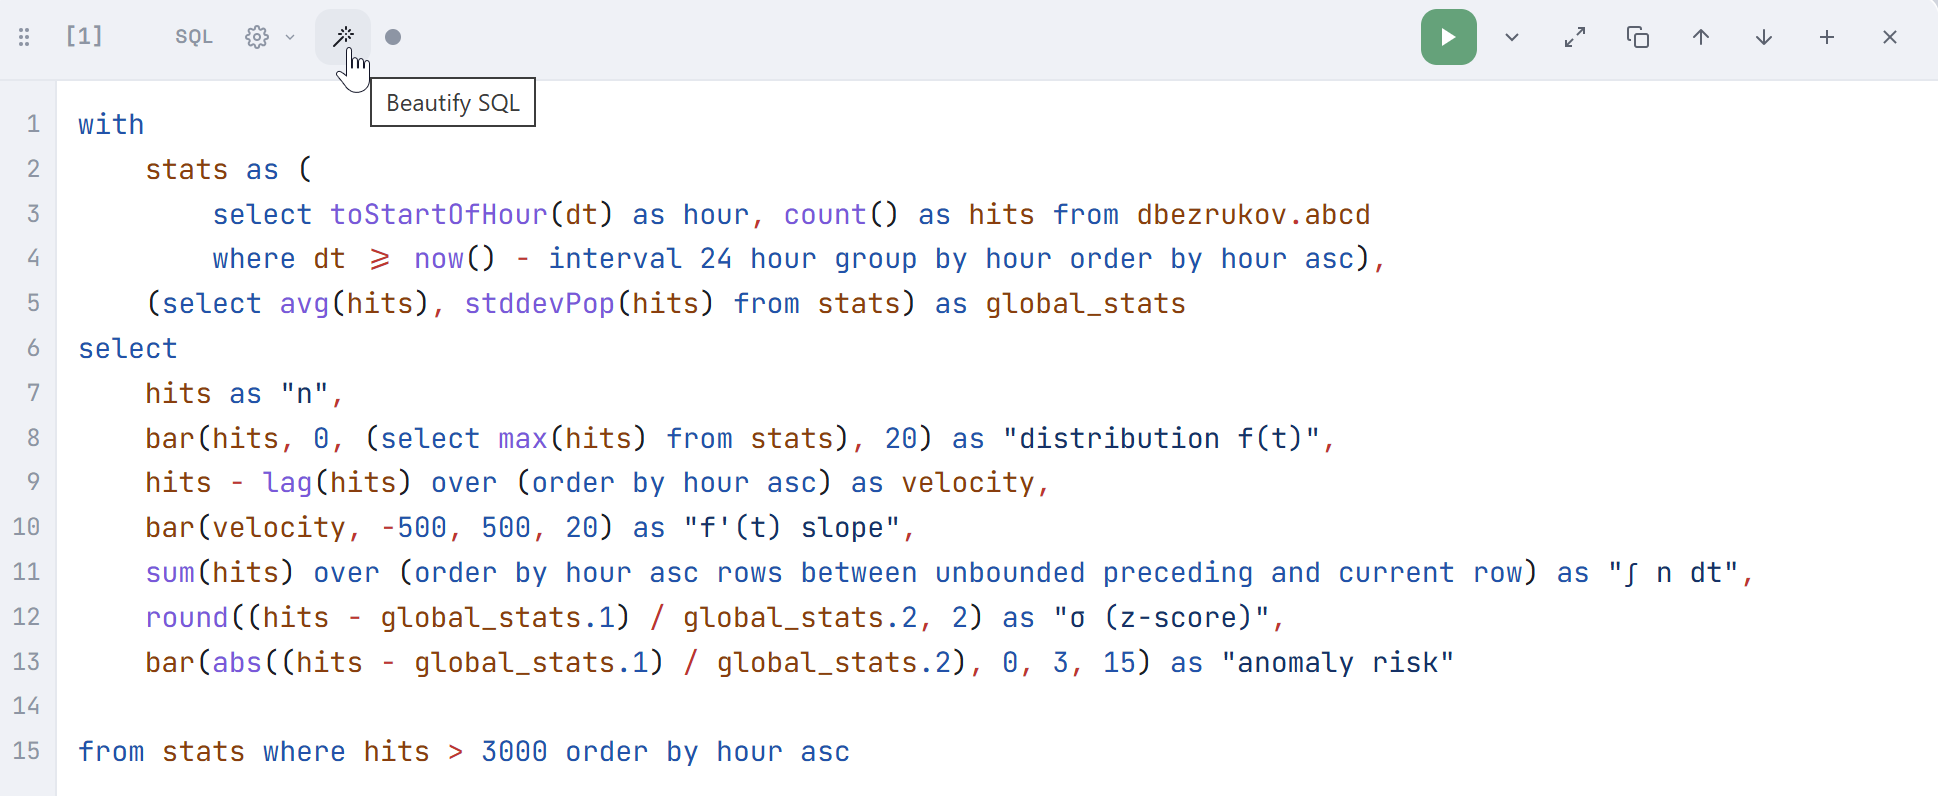
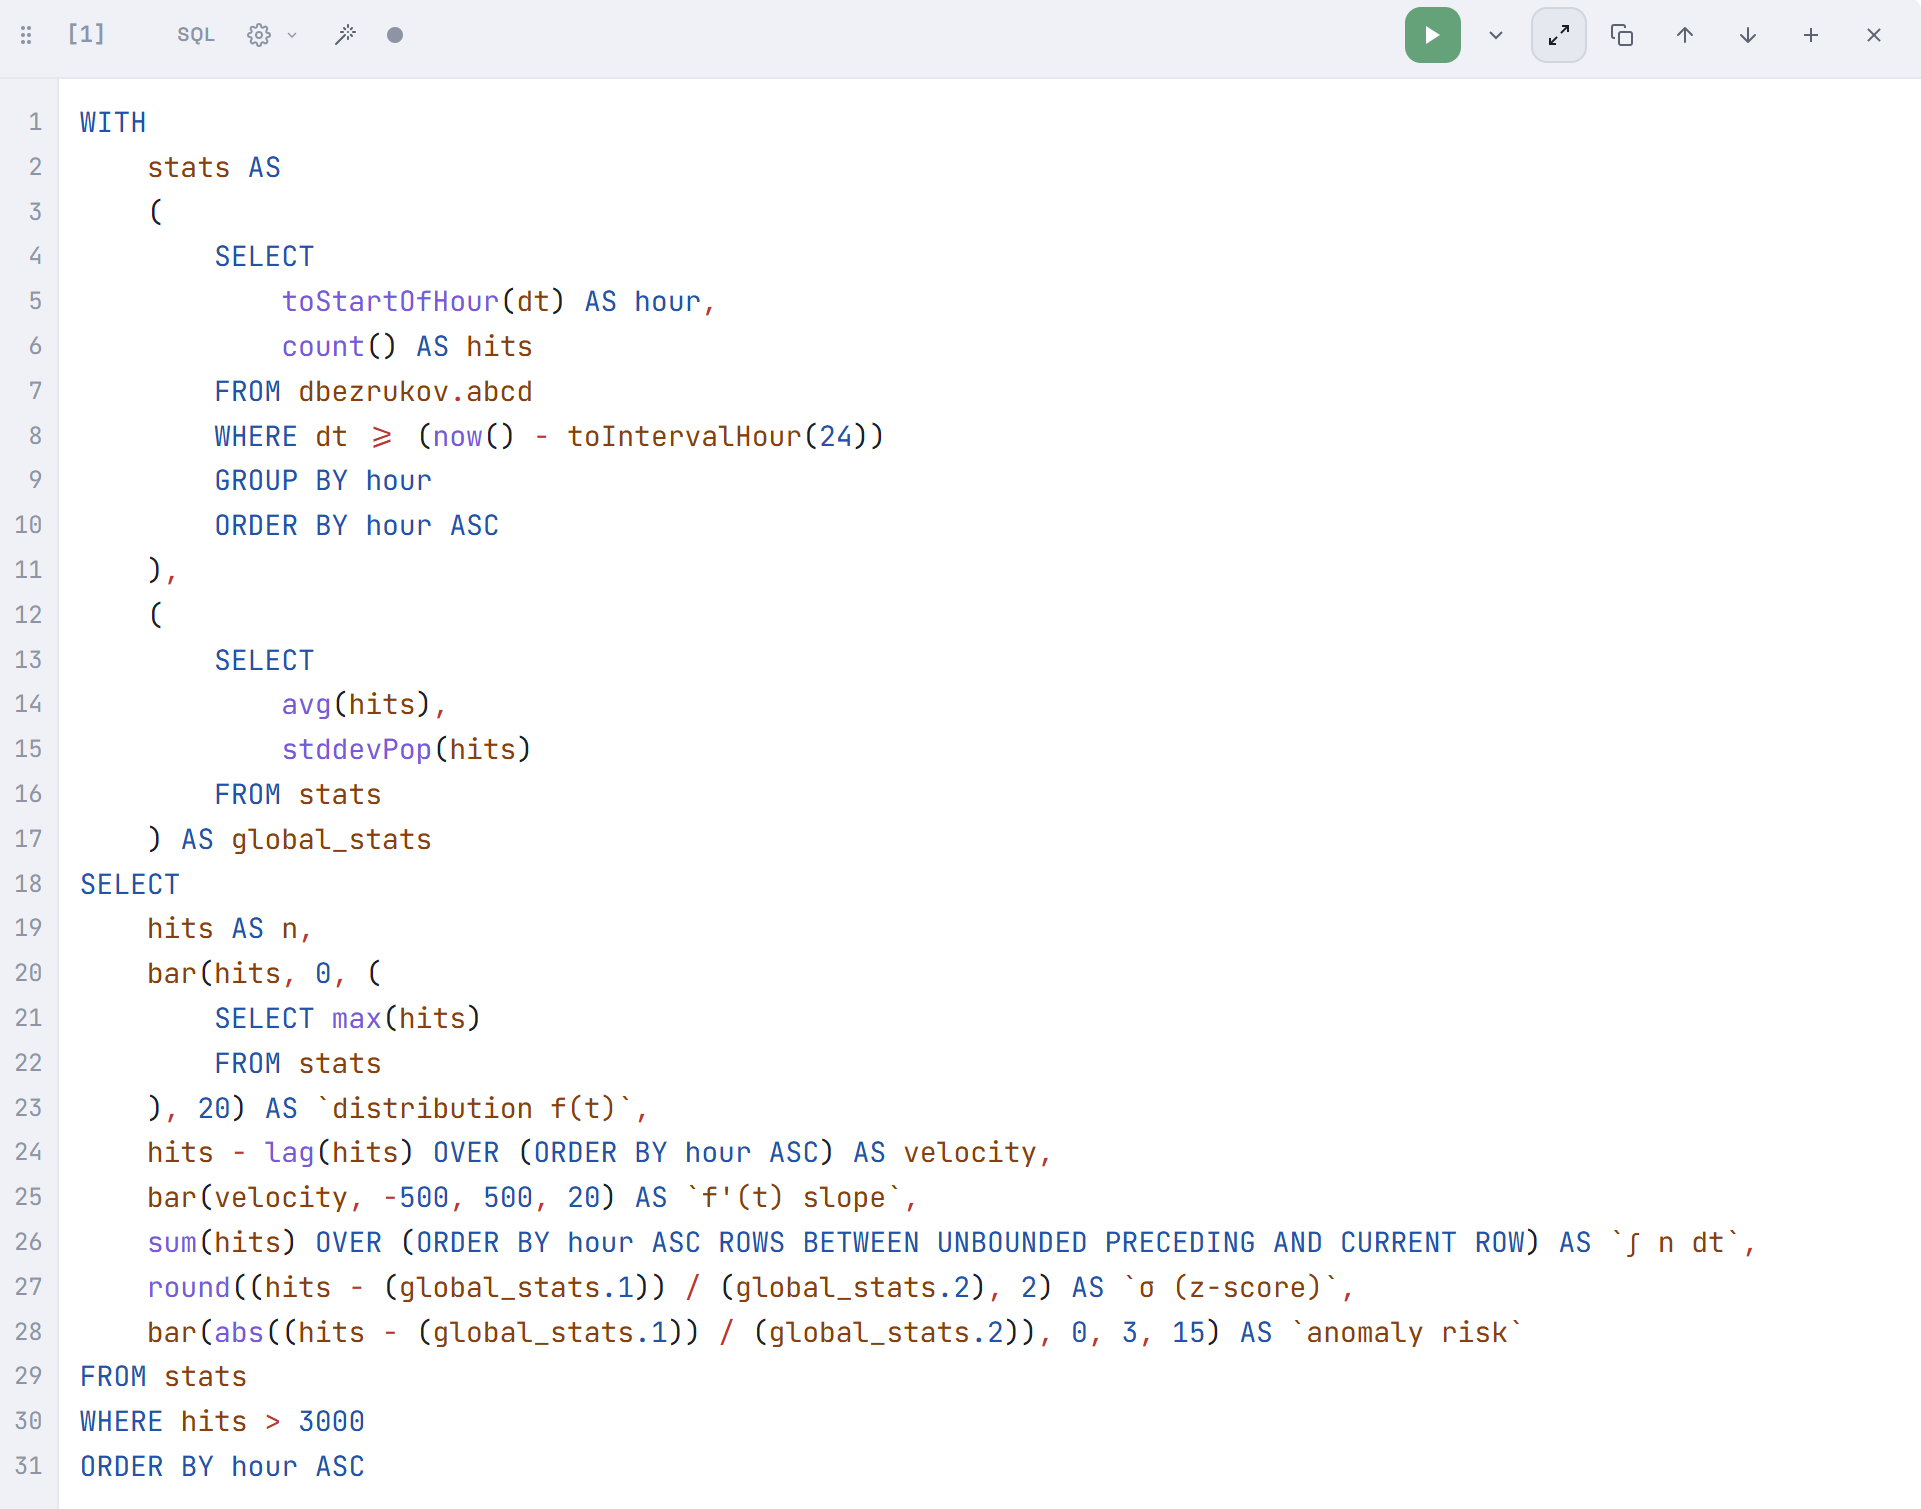
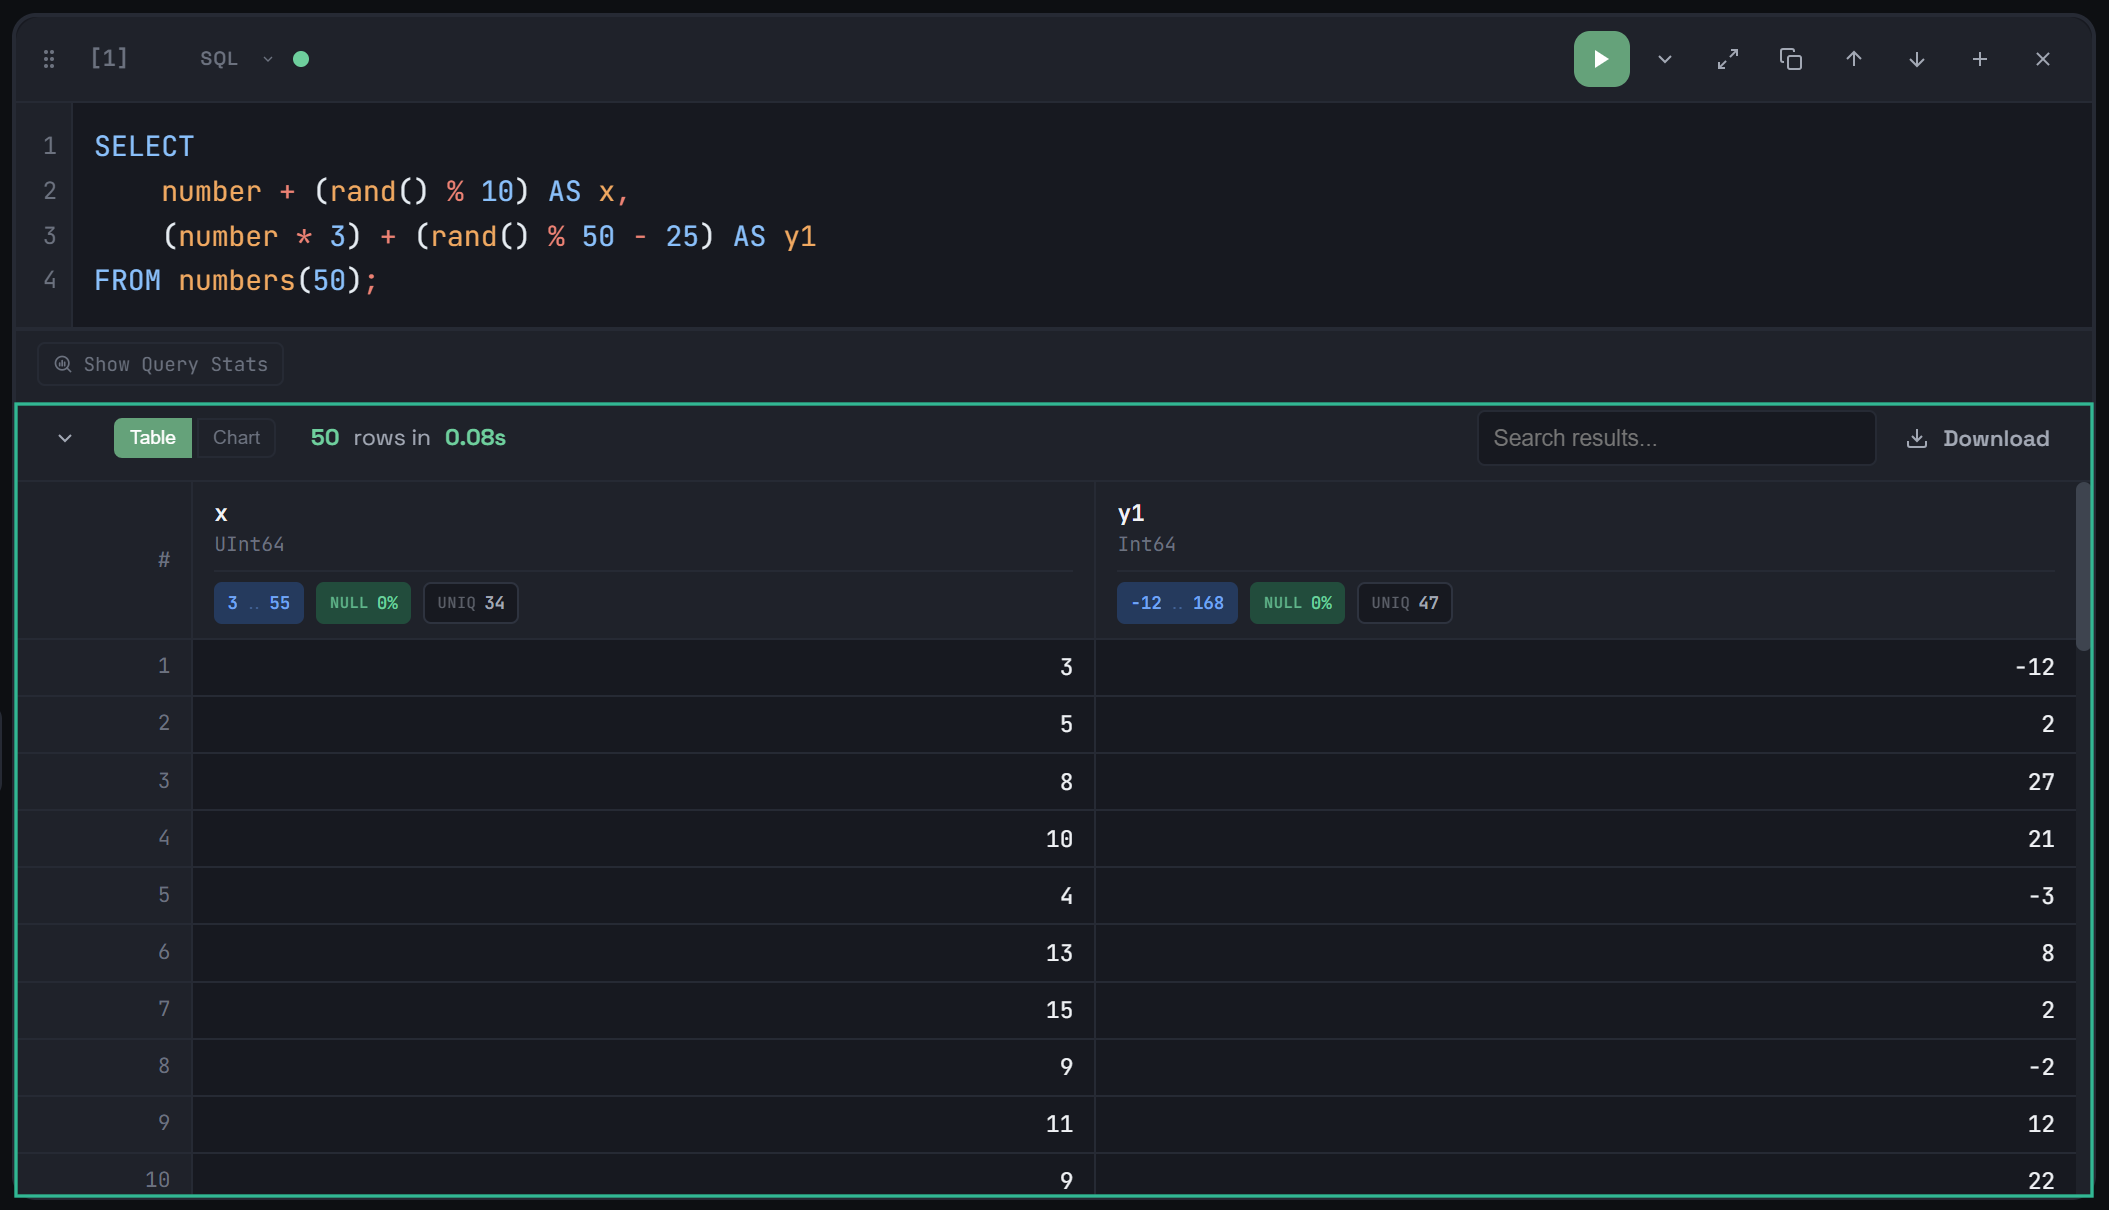
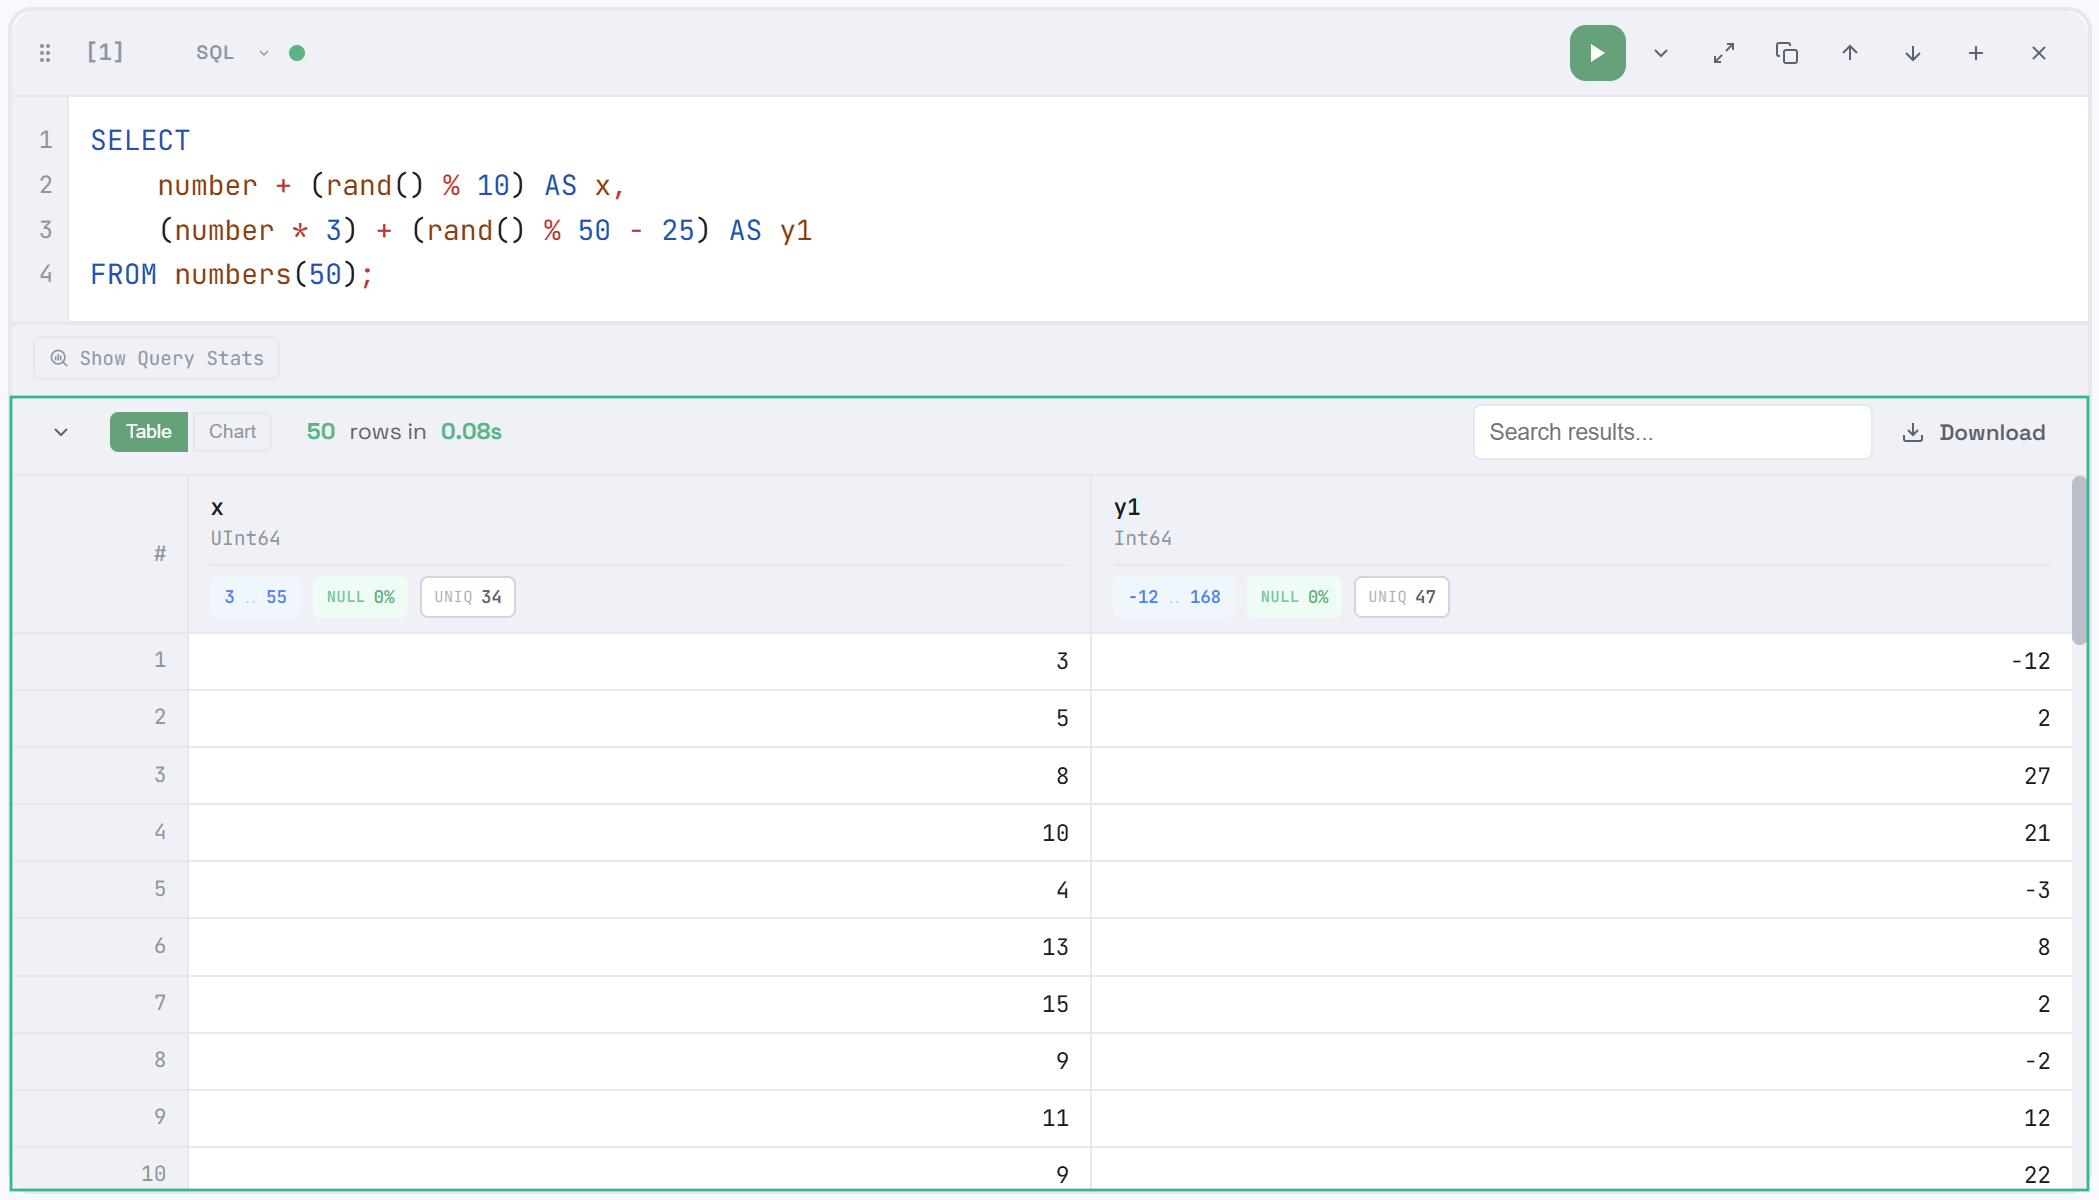
The code of the query shown in the image above, after applying the Beautify SQL option, will look like the following.
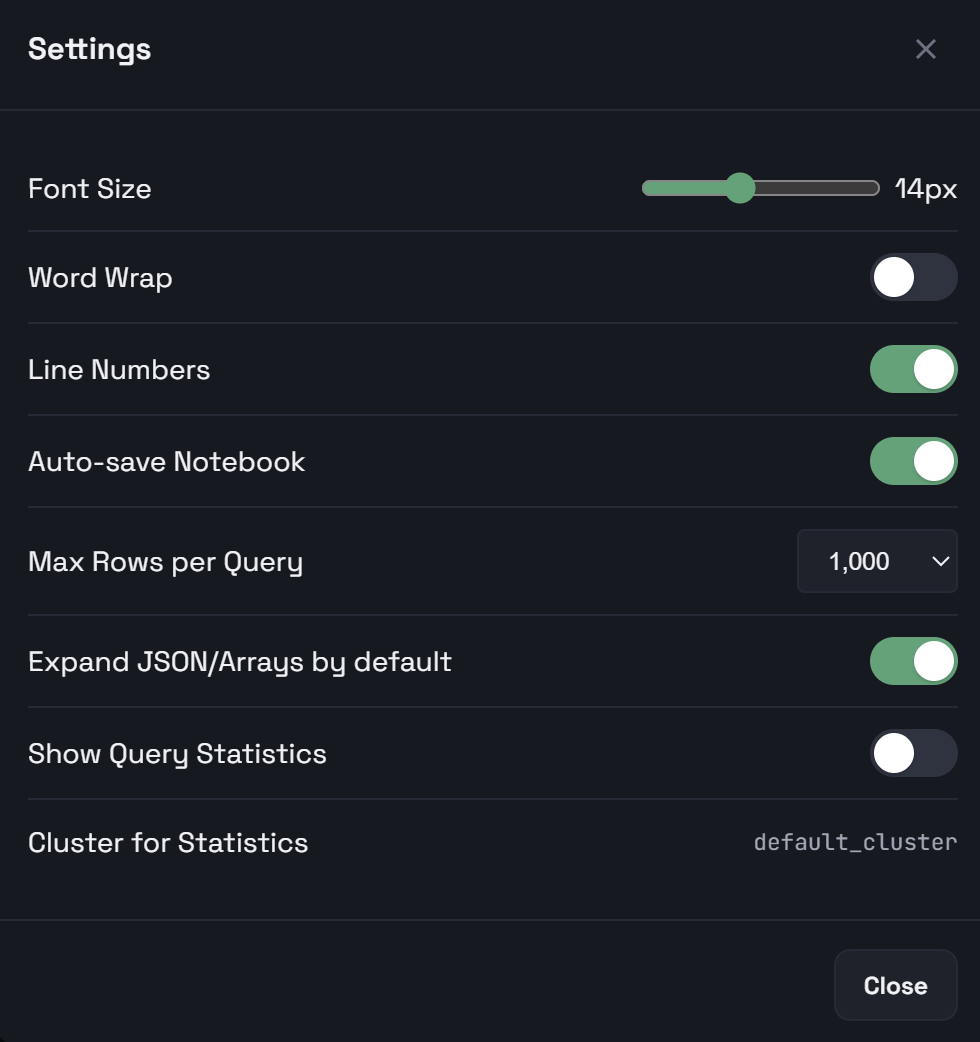
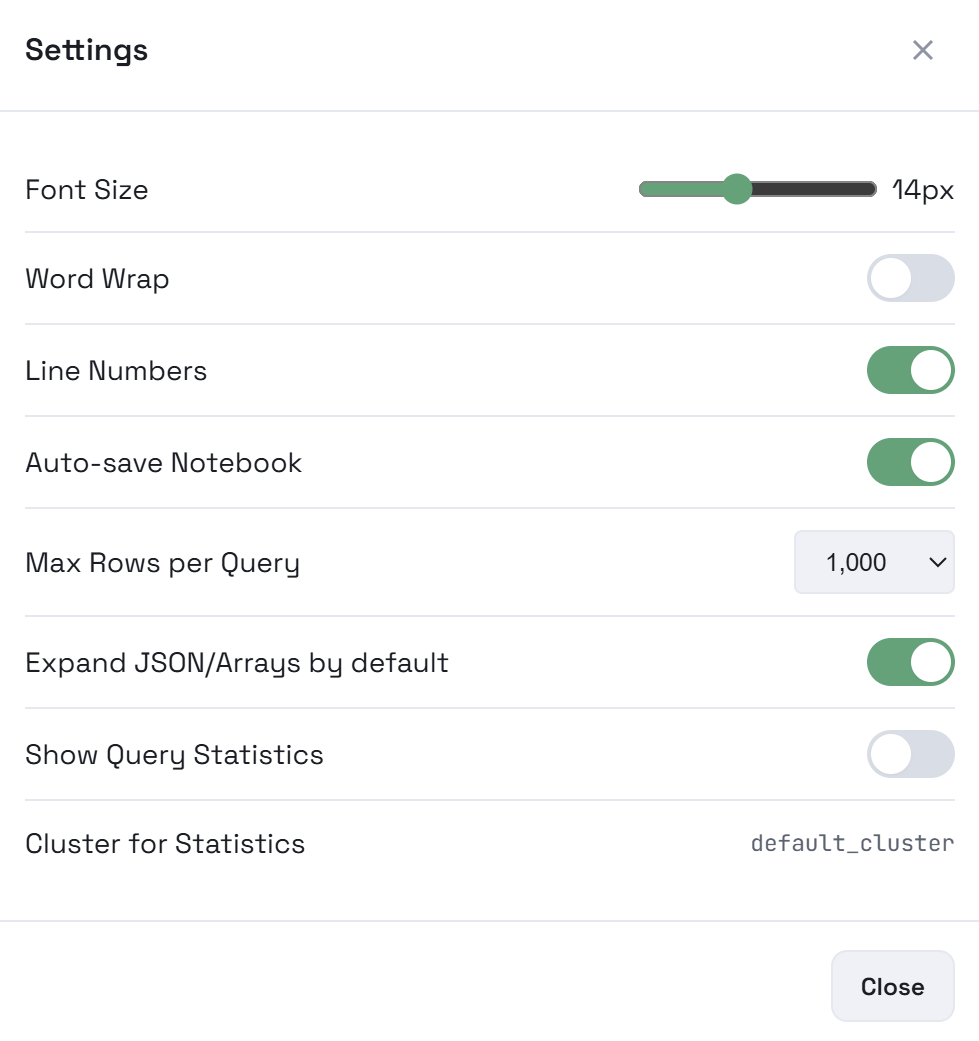
Query editor settings
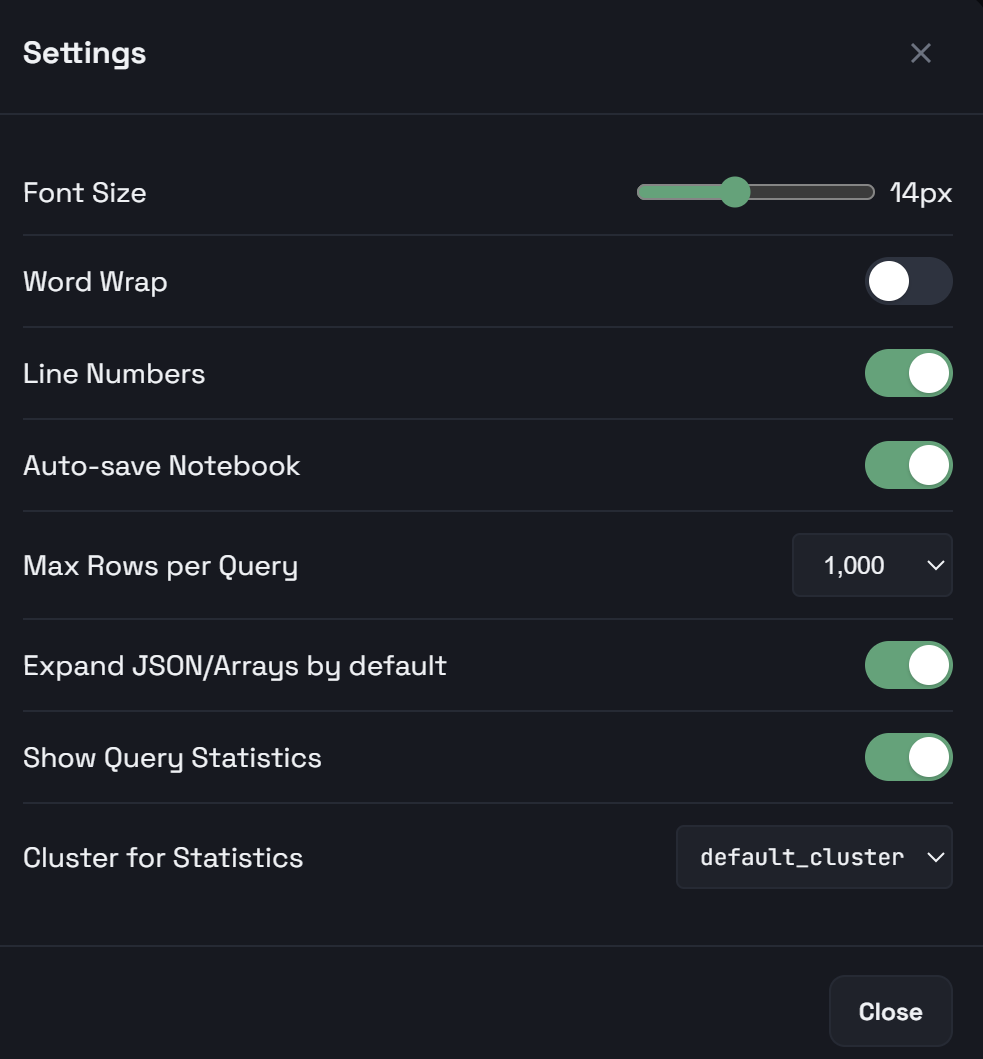
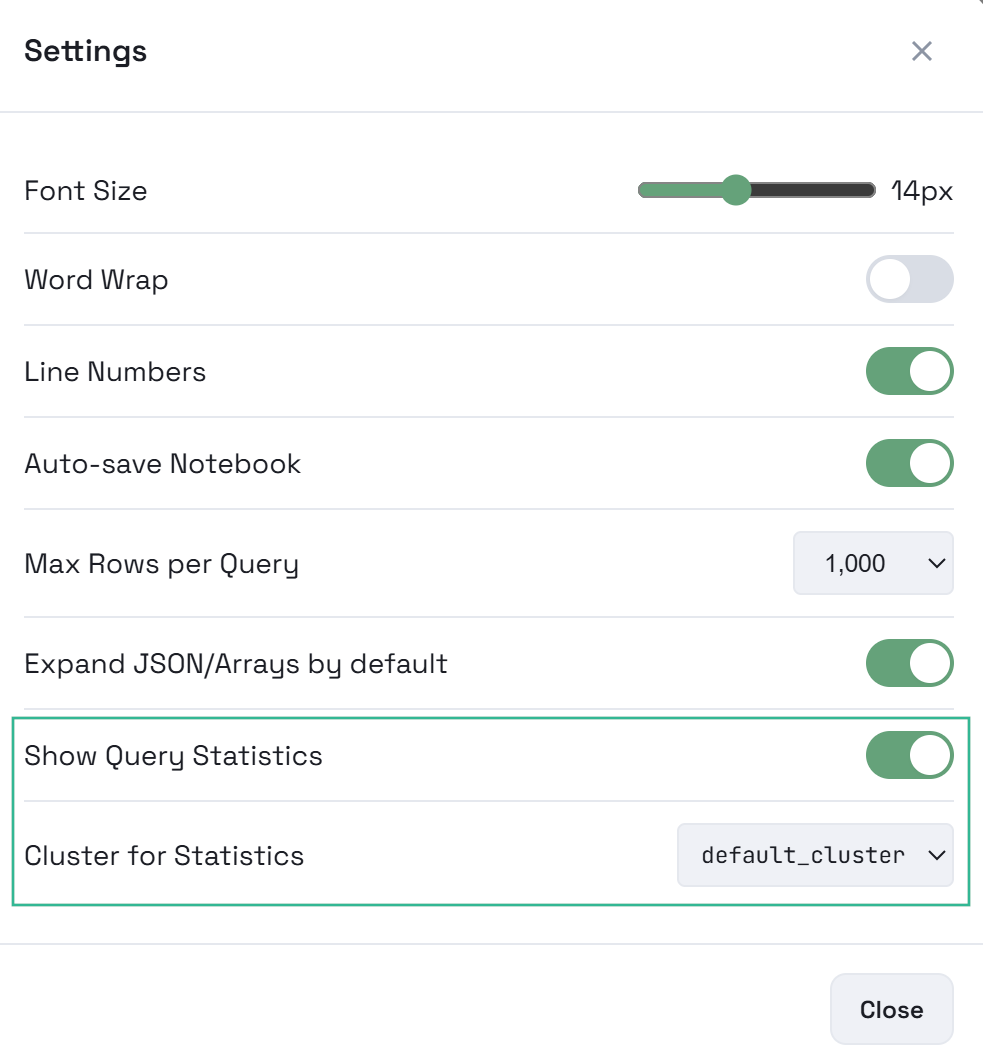
For the query text editor in an SQL cell, you can configure the following parameters (to open the window with settings, click the ![]()
![]() Settings icon in the upper right corner of the interface):
Settings icon in the upper right corner of the interface):
-
Font Size — font size (the setting does not affect text cells);
-
Word Wrap — enables/disables line wrapping (in text cells, line wrapping is always enabled, regardless of this setting);
-
Line Numbers — enables/disables line numbering (in text cells, row numbering can only be enabled for editing mode);
-
Auto-Close Brackets & Quotes — enables/disables automatic closing of brackets and quotation marks as you type.
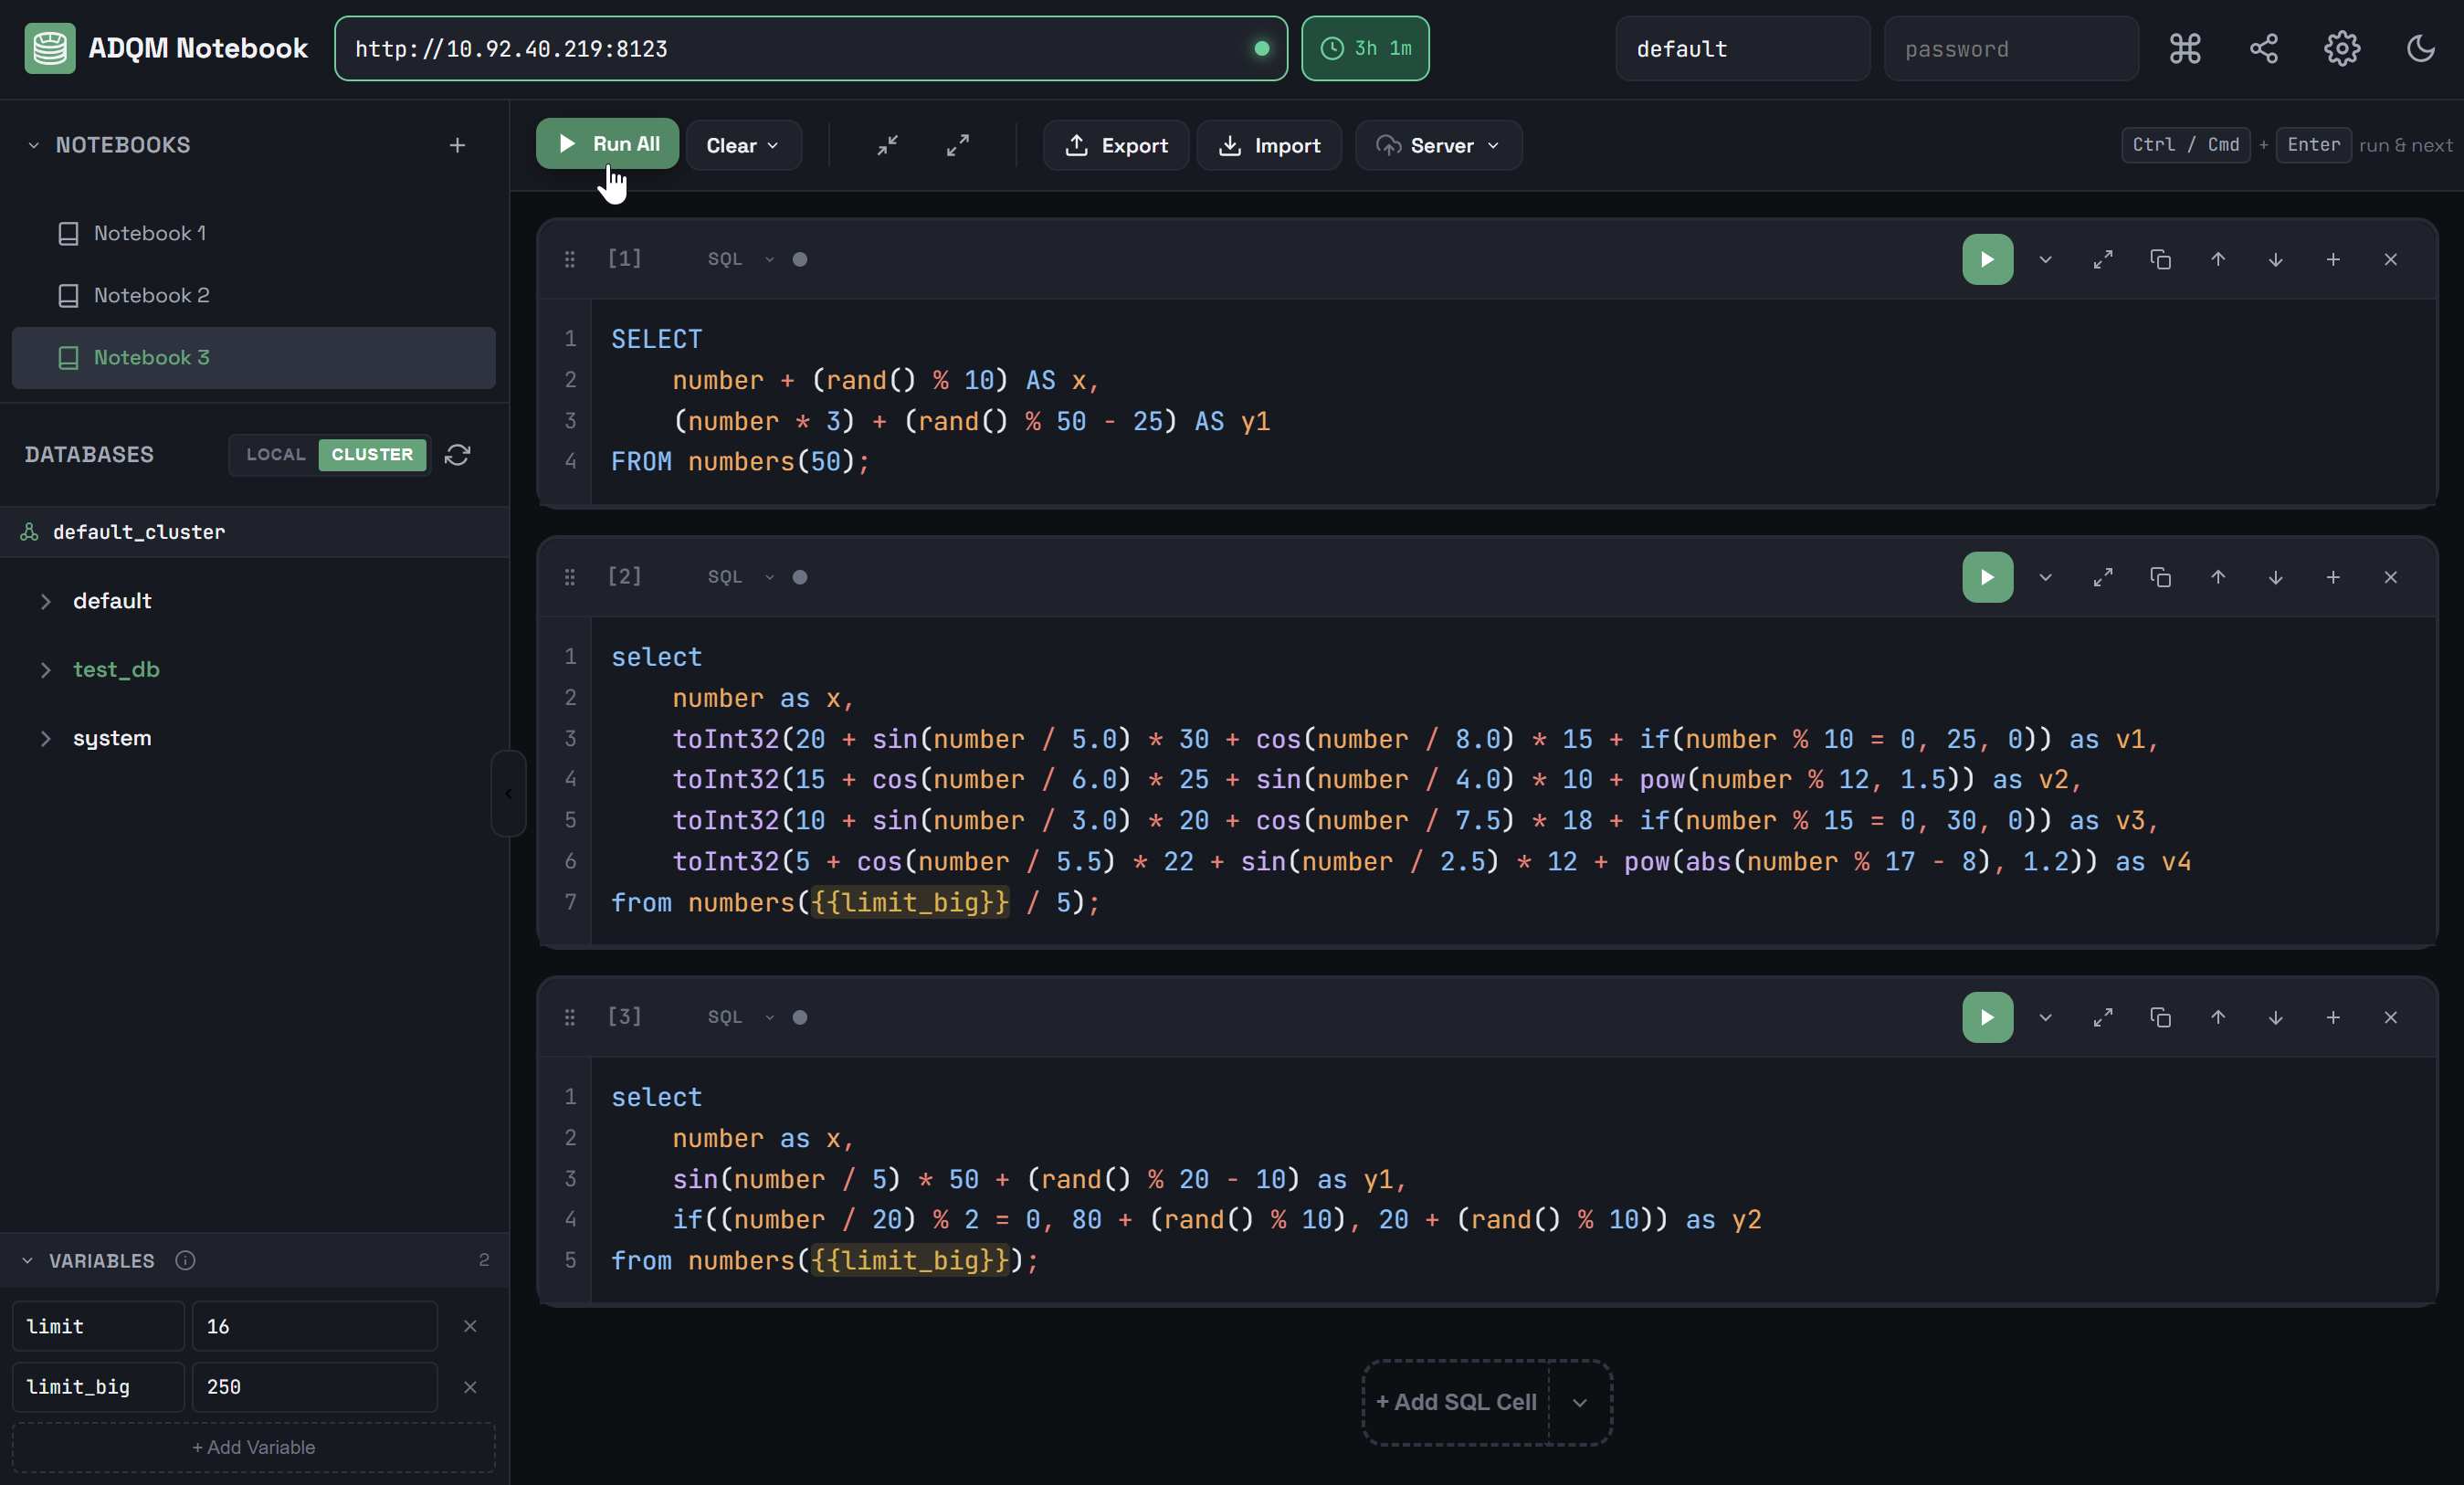
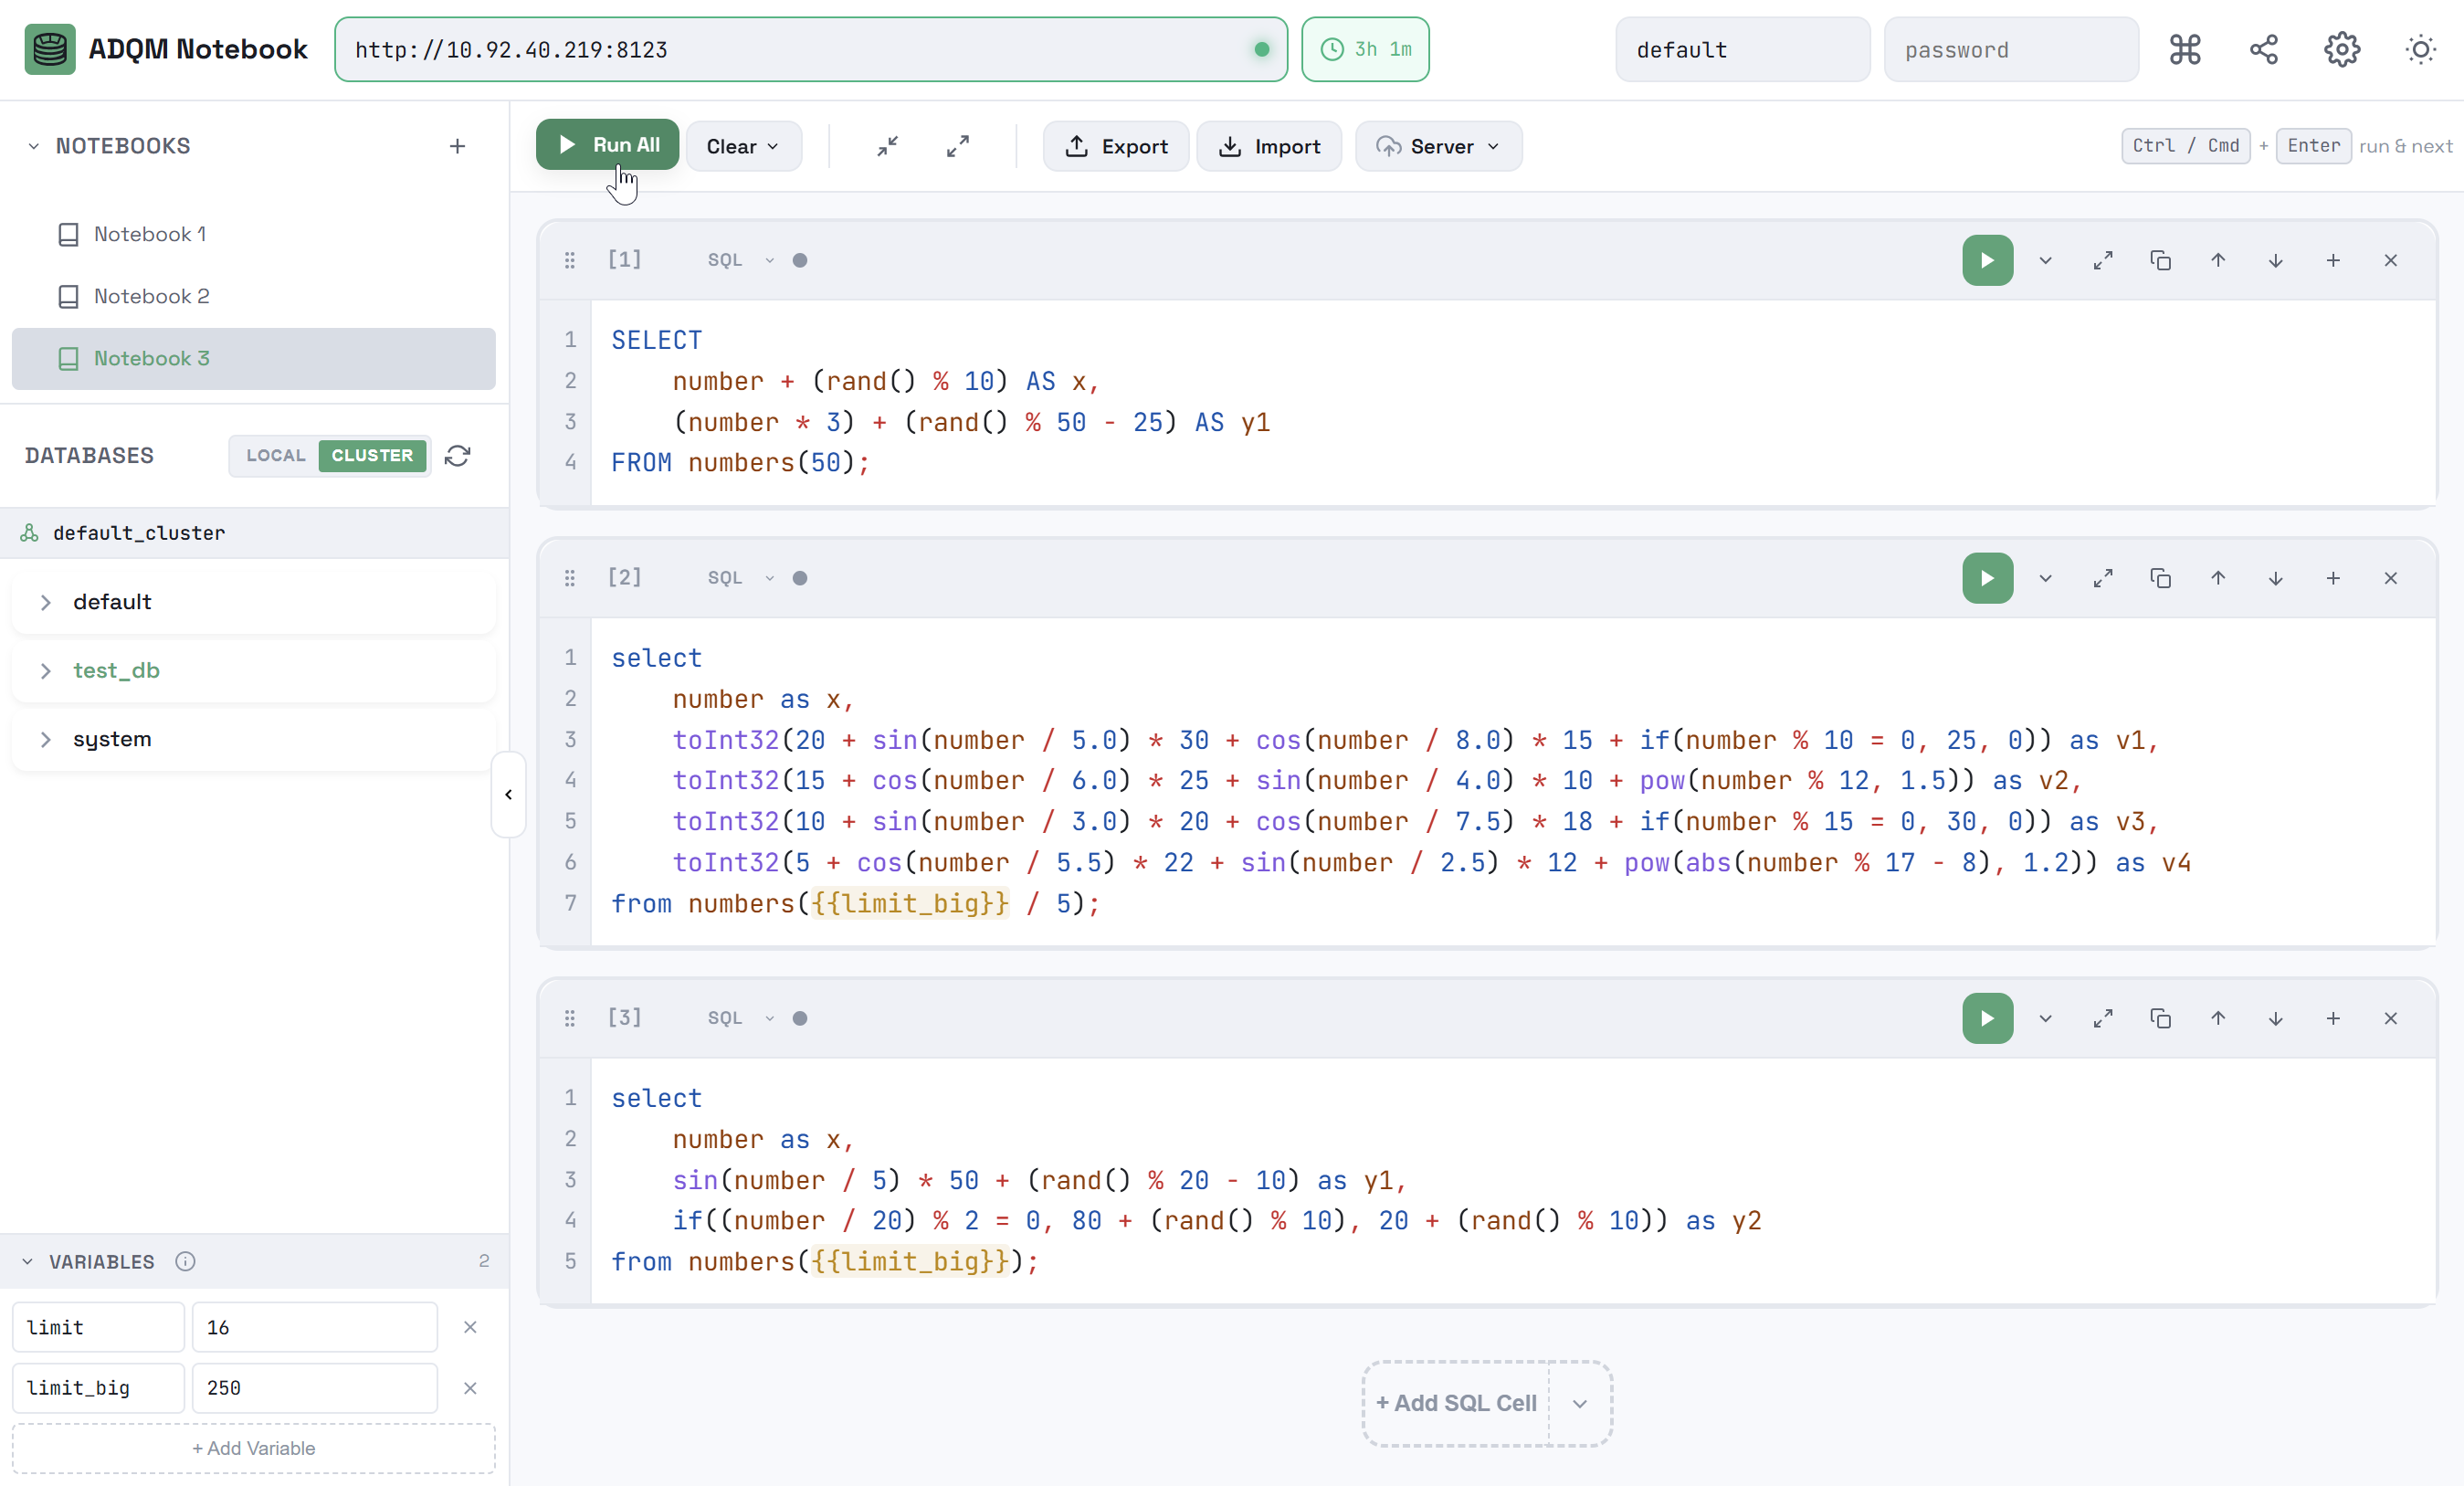
Variables in queries
In the VARIABLES panel, you can add variables as key/value pairs. In a query, you can reference a variable by a key using the {{variable_name}} format — this entry will be automatically replaced with the variable’s value before submitting the query to be executed. Variables use case-insensitive matching (for example, {{MyVar}}, {{myvar}}, {{MYVAR}} all match the same variable).
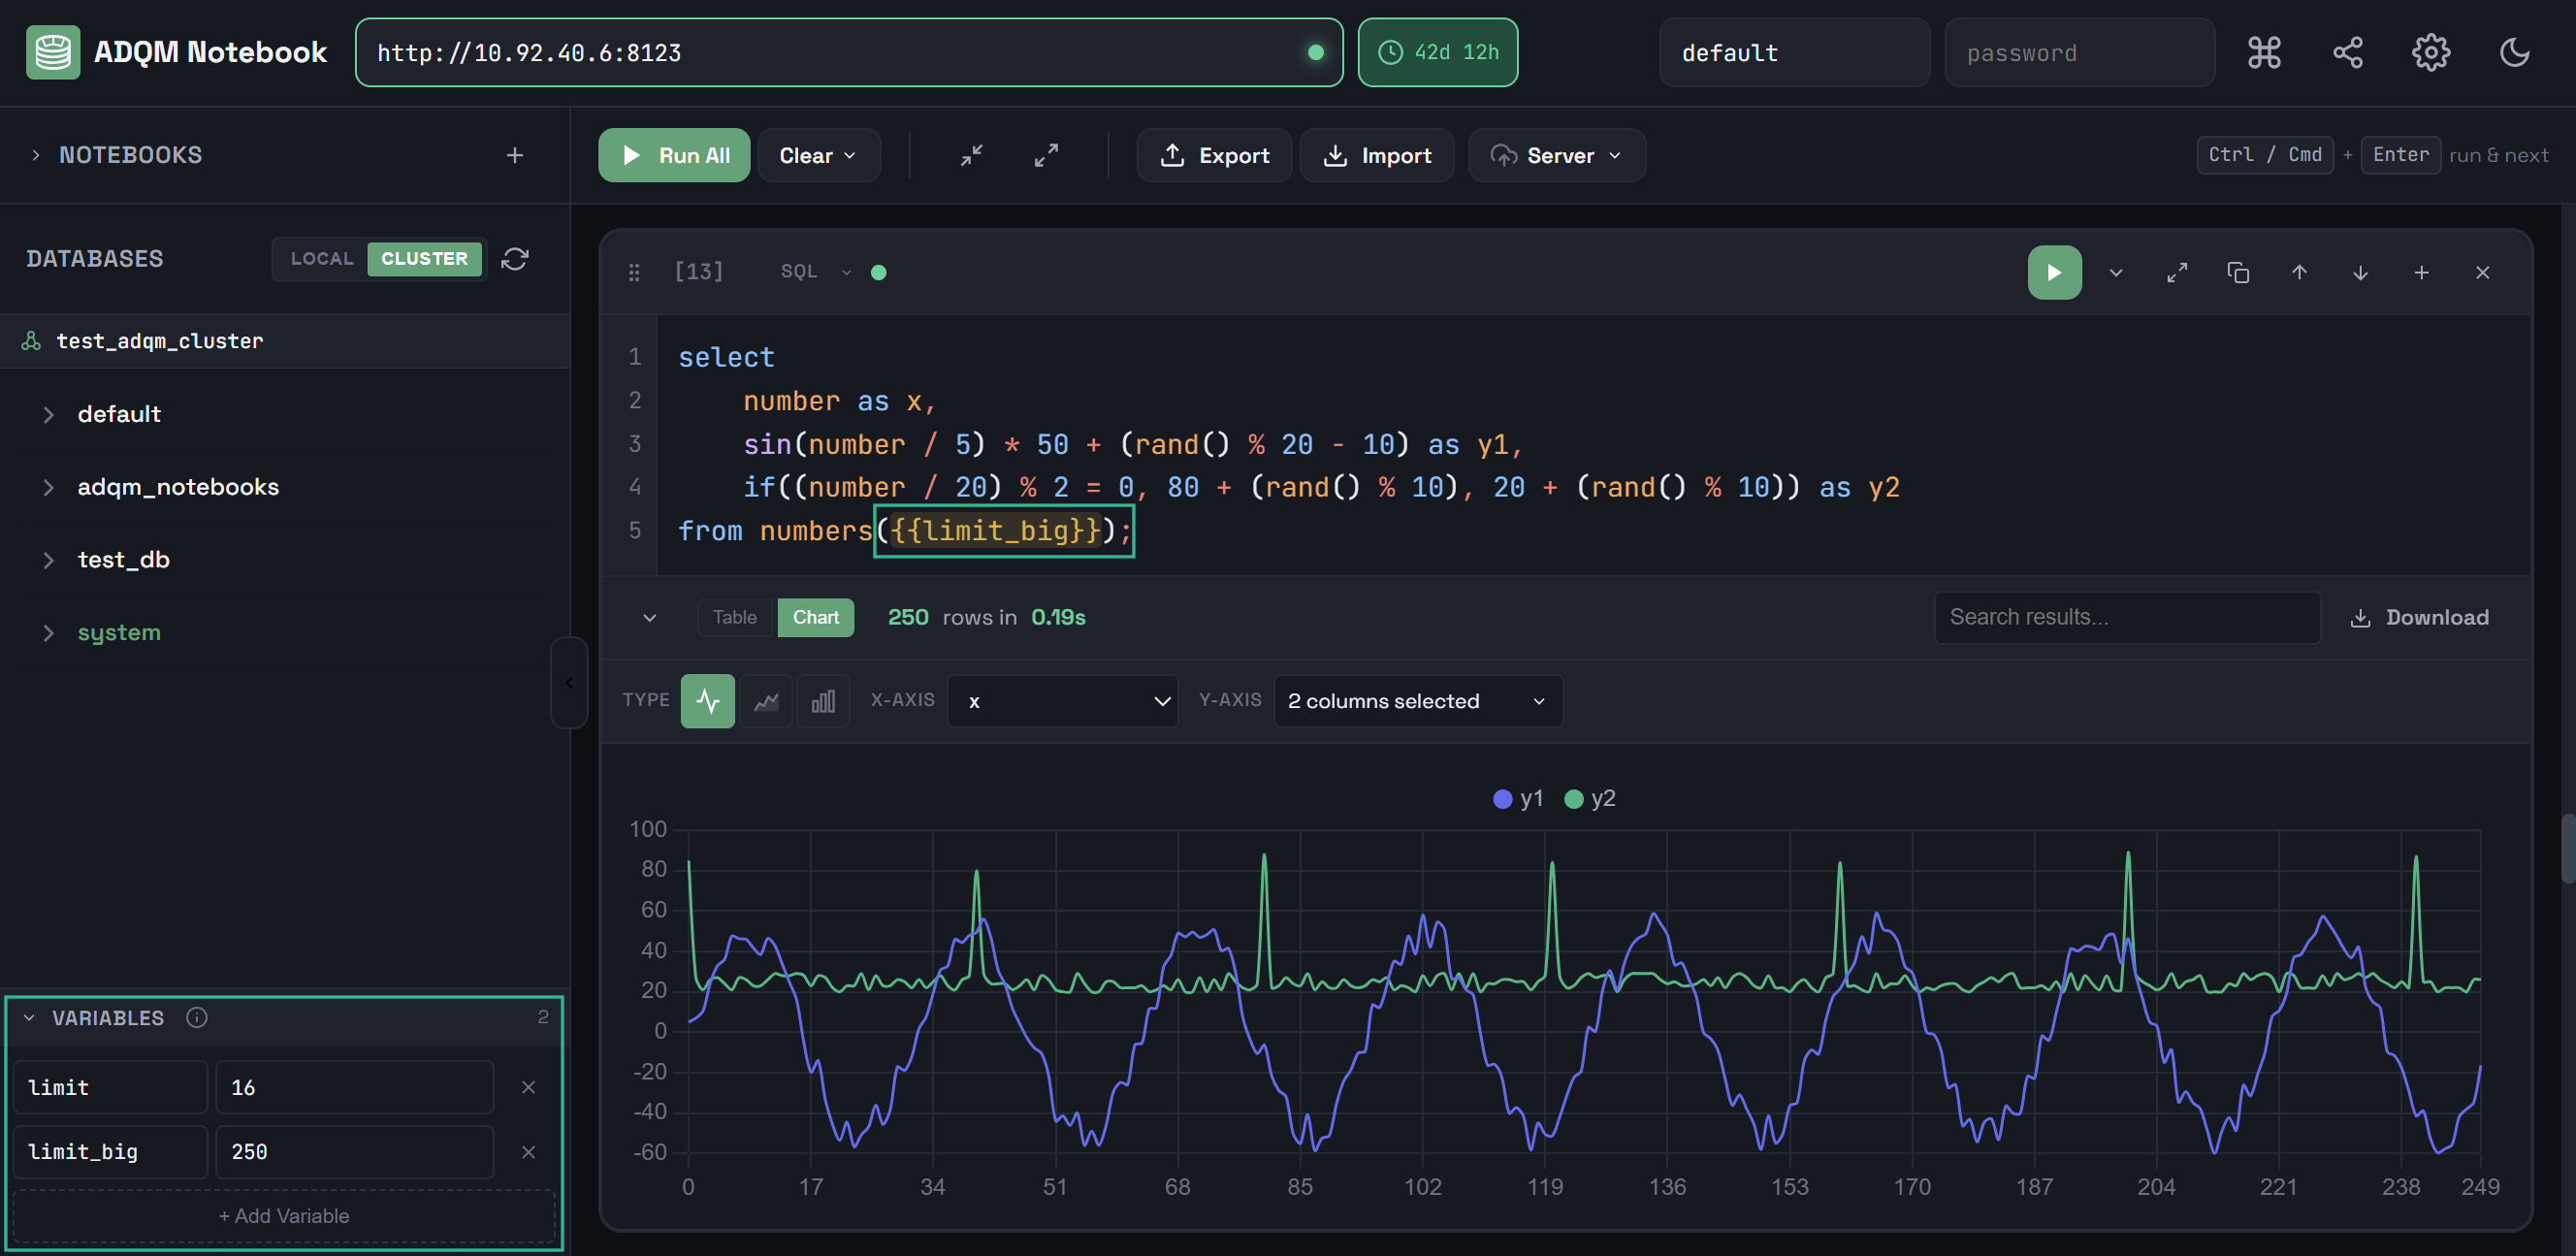
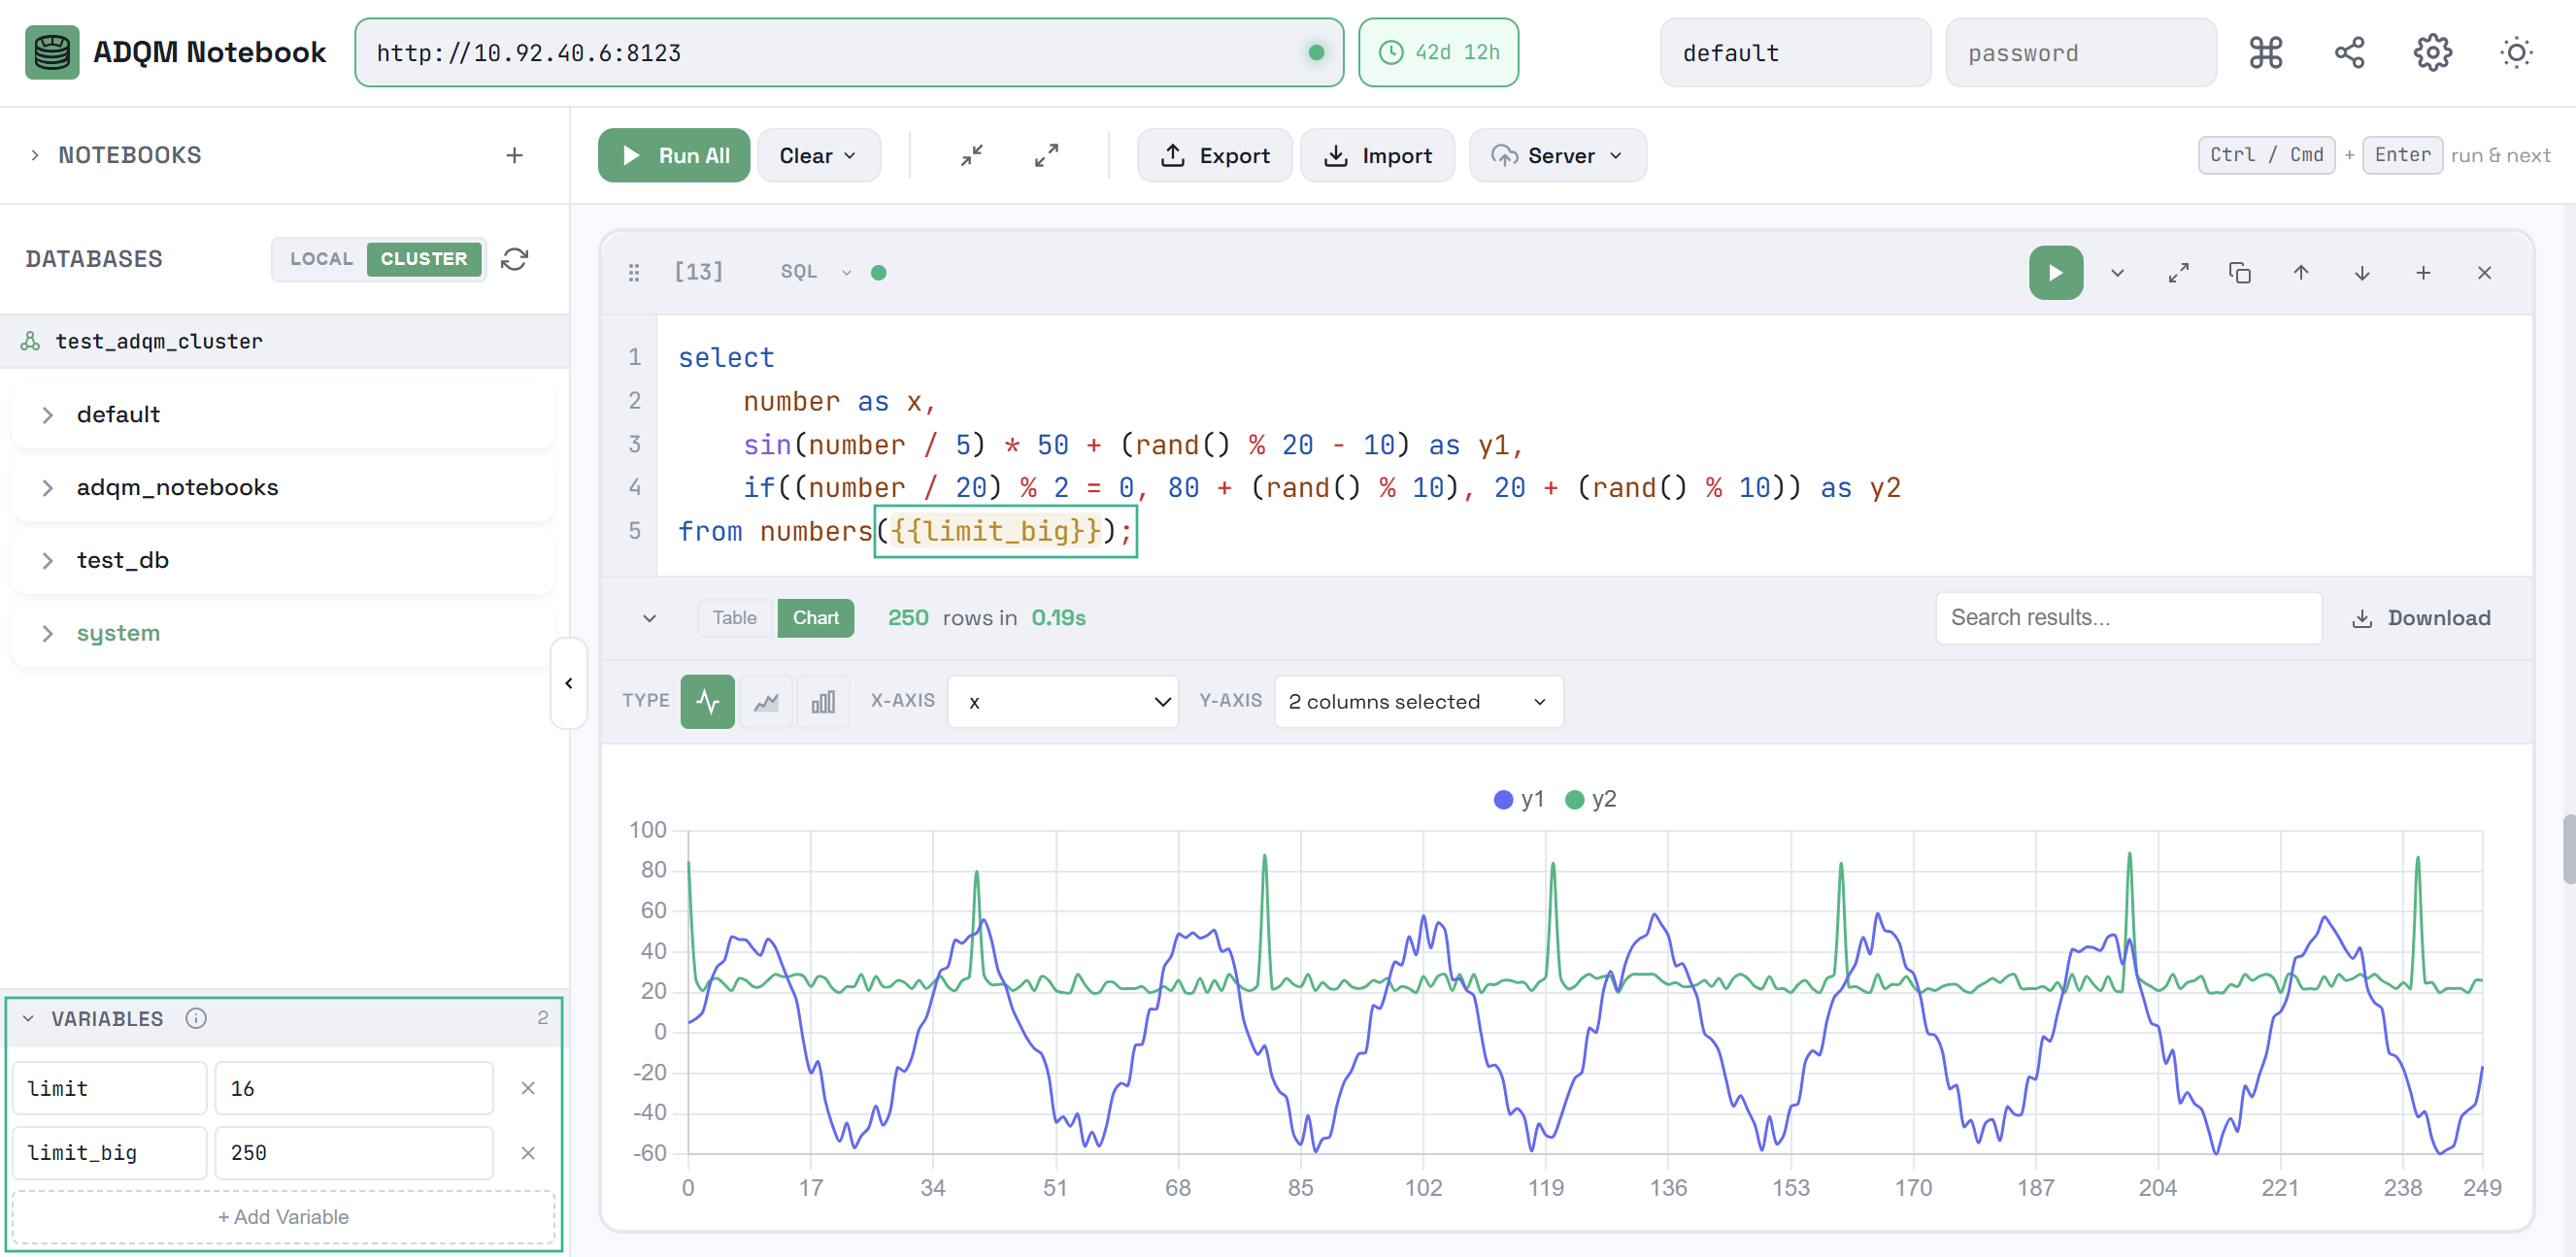
The VARIABLES panel header displays a count of added variables on the right. If you add a variable with a duplicate name, the corresponding fields are highlighted in red, the variable count is not incremented, and the value of the duplicate variable is ignored.
Control panel
The SQL cell control panel, located above the query text editor, contains the following elements:
-

 Drag to reorder — drag and drop to move a cell relative to others within a notebook.
 -
[n] — monotonically increasing cell creation identifier that does not change when the cell is moved or deleted.
-

 Query settings — display settings that allow specifying limits to prevent the execution of a potentially resource-intensive query. Available settings:
-
max_memory_usage — maximum amount of RAM for executing a query on a server;
-
max_execution_time — maximum query execution time;
-
max_threads — maximum number of threads that can be used simultaneously during query execution;
-
join_algorithm — algorithm to perform JOINs.
These settings (except for the join algorithm) can also be specified for all queries at the notebook level. However, limits set within an SQL cell have a higher priority.
-
-

 Beautify SQL — apply automatic formatting to the query text.
 -
Query execution status:

 — query has not been executed yet;
 — query is currently being executed;
 — query has been executed successfully;
 — query execution has been failed.
For a query that has been executed (successfully or with an error), the time the query was last run is also shown next to the status indicator.
-
 Run — start query execution.
 -

 Toggle query — collapse/expand the query code editor (if the editor is collapsed, the beginning of the query text is displayed within the control panel).
 -

 Fullscreen — expand an SQL cell to full screen (or collapse it).
 -

 Duplicate cell — copy a cell.
 -

 Move up — move a cell one position above the previous one.
 -

 Move down — move a cell one position below the next one.
 -

 Add cell below — create a new cell of the same type below.
 -

 Delete cell — delete a cell.
Query execution
To run a query, do one of the following:
-
Click
Run in the control panel of the corresponding SQL cell. While a query is running, the Run button visually changes to Stop — clicking it cancels the query execution (KILL QUERY is sent). -
Click an SQL cell to select it (a selected cell is highlighted in green) and press
CTRL+ENTER(orCMD+ENTER).
In the ADQM Notebook interface, multiple SQL cells can execute their queries simultaneously when running individually. The ![]() command executes queries in cells sequentially from top to bottom waiting for each query to complete before running the next one.
command executes queries in cells sequentially from top to bottom waiting for each query to complete before running the next one.
Using the Max Rows per Query parameter in ADQM Notebook’s settings, you can set the maximum number of rows in query results for a cell. When the limit is reached, a query is interrupted (KILL QUERY is sent), and the results are marked as truncated.
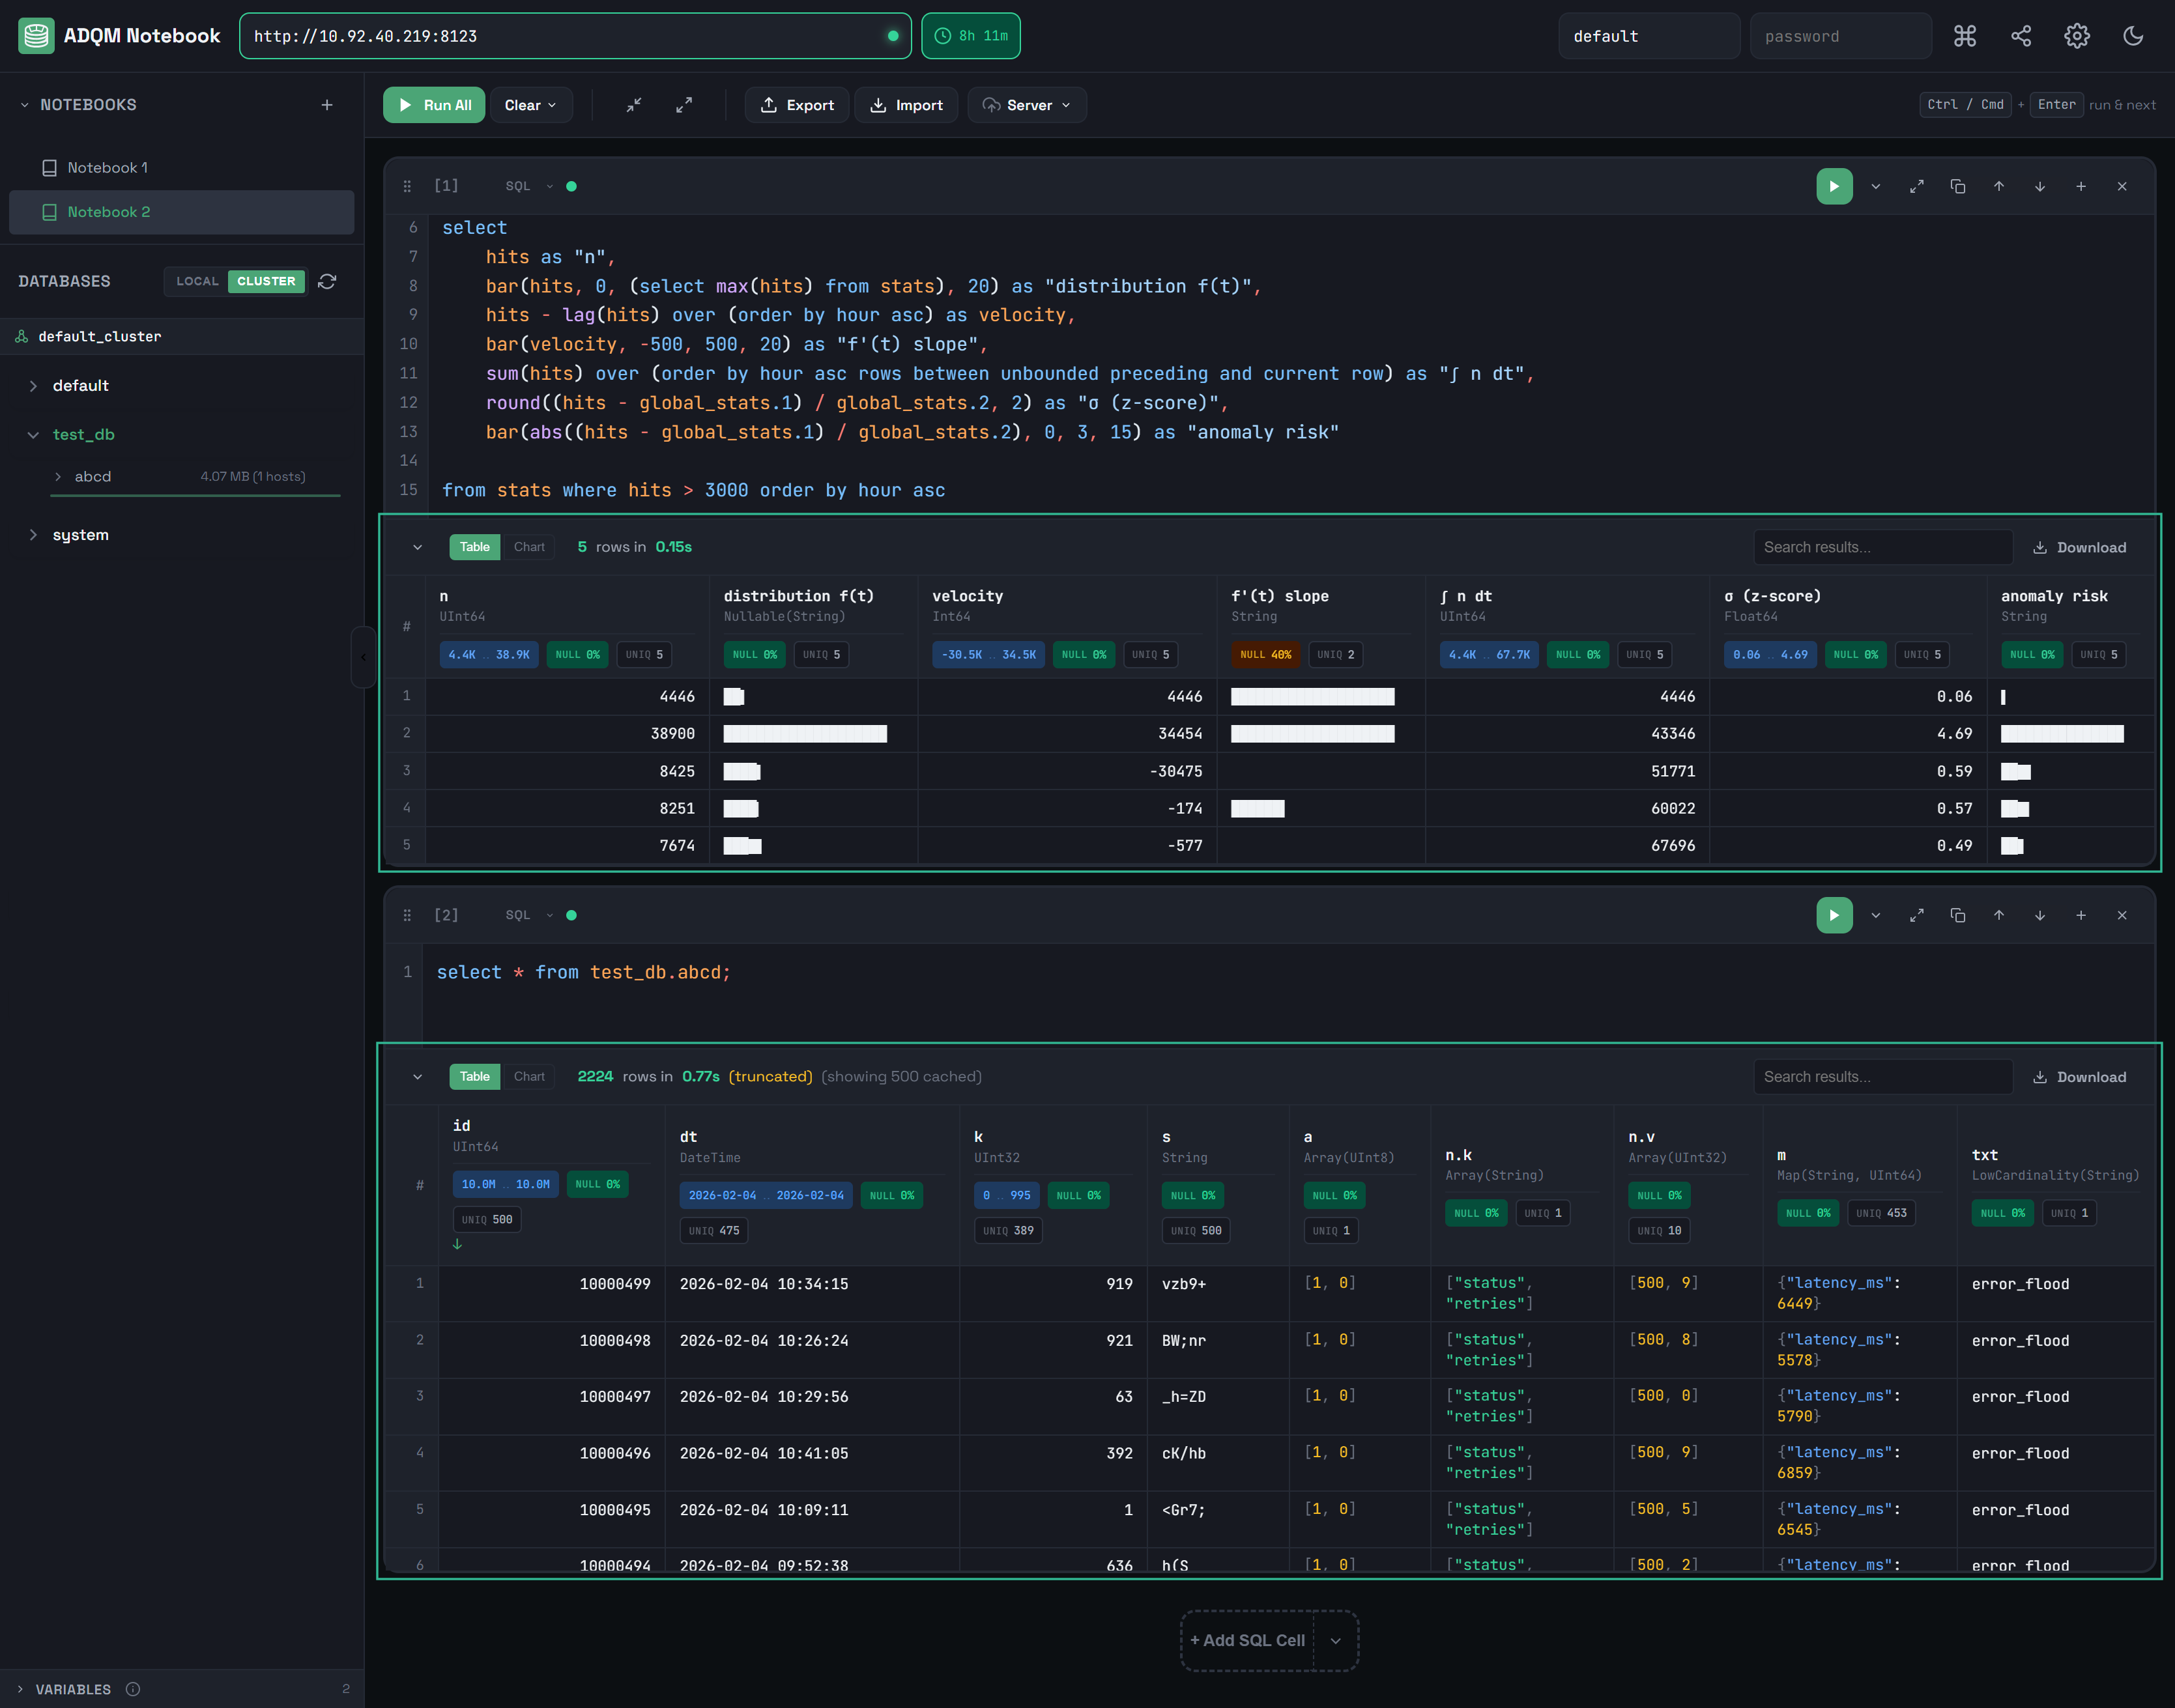
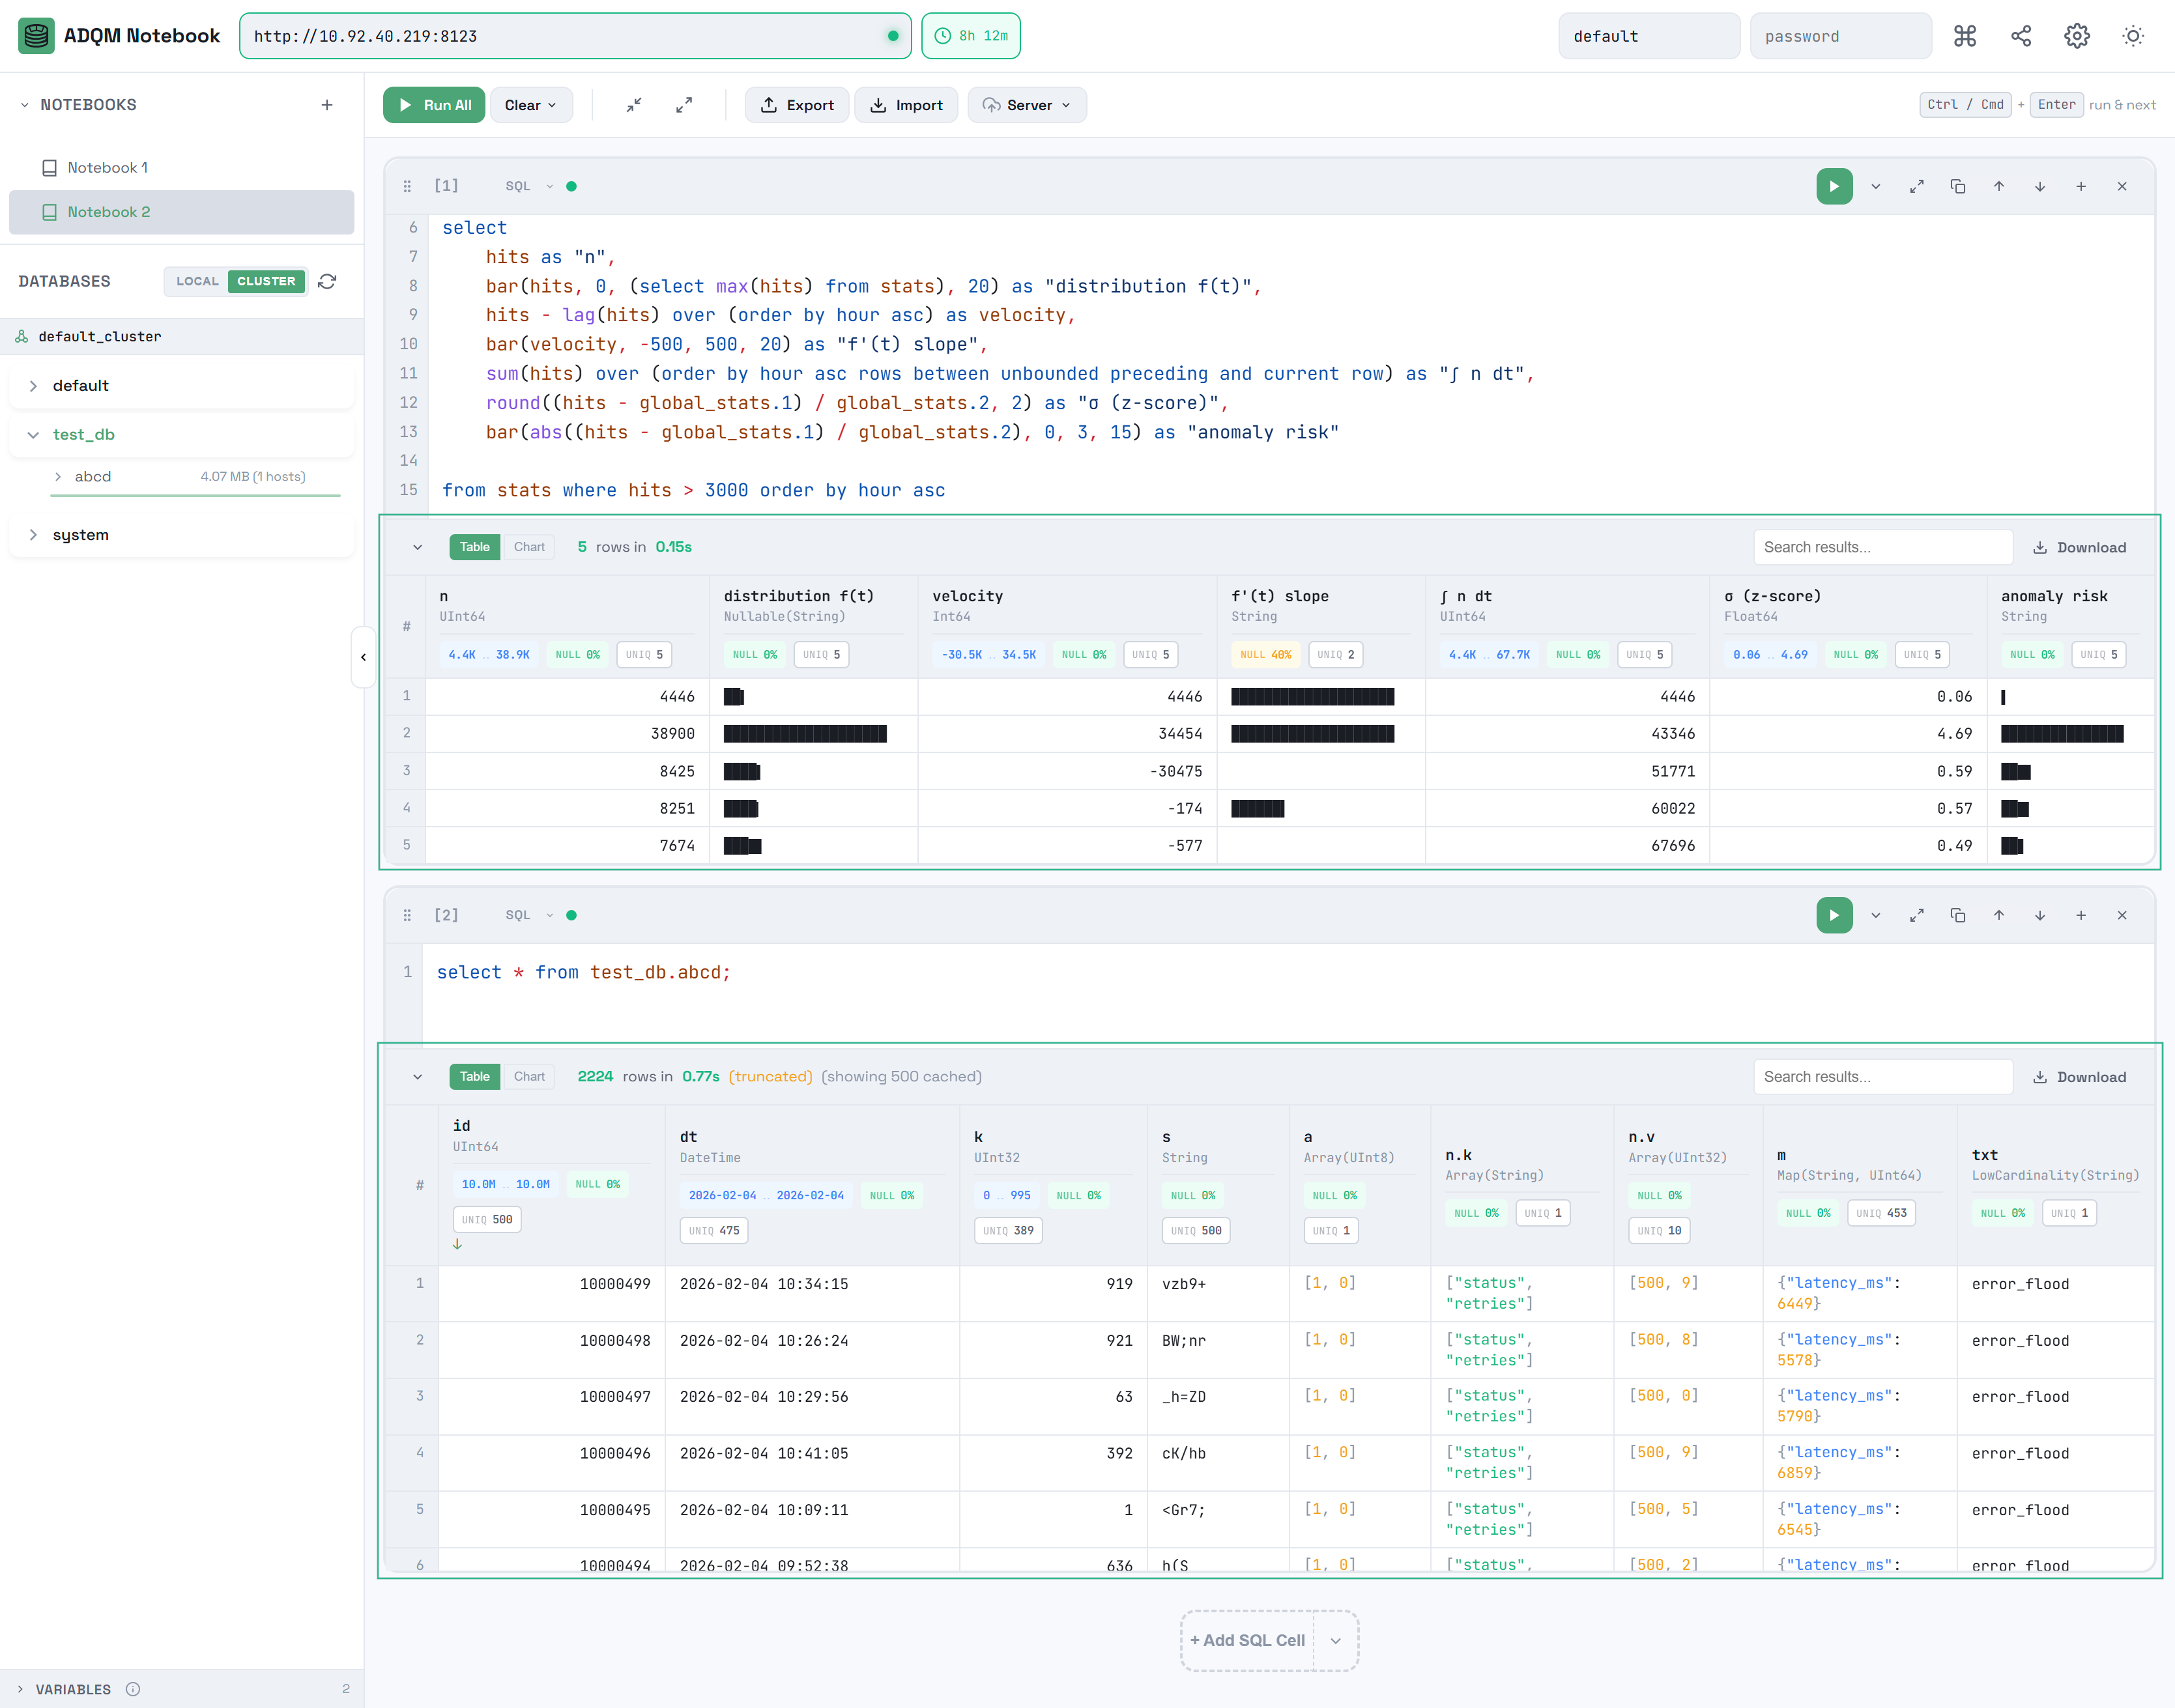
Query results panel
After executing a query, the results are displayed in the results panel, which contains the Table and Chart tabs, where you can view the resulting data as a grid or chart, respectively. The results panel also contains:
-
general information on the query results (number of received data rows and execution time);
-
Search results… field, which allows you to filter data in the result set in real time by any column — the panel will show only the values that match the specified filter;
-

 Download icon, which you can use to save the query results in one of the supported formats (CSV, TSV, JSON, JSONLines, Parquet).
CSV, TSV, JSON, and JSONLines are generated on the client side from cached results. Parquet re-runs the entire query on the ADQMDB server because it requires server-side format generation. This means:
-
A query may return different results if data changed.
-
Additional server load is possible.
-
The results panel can be collapsed/expanded with the icon ![]()
![]() in the upper left corner.
in the upper left corner.
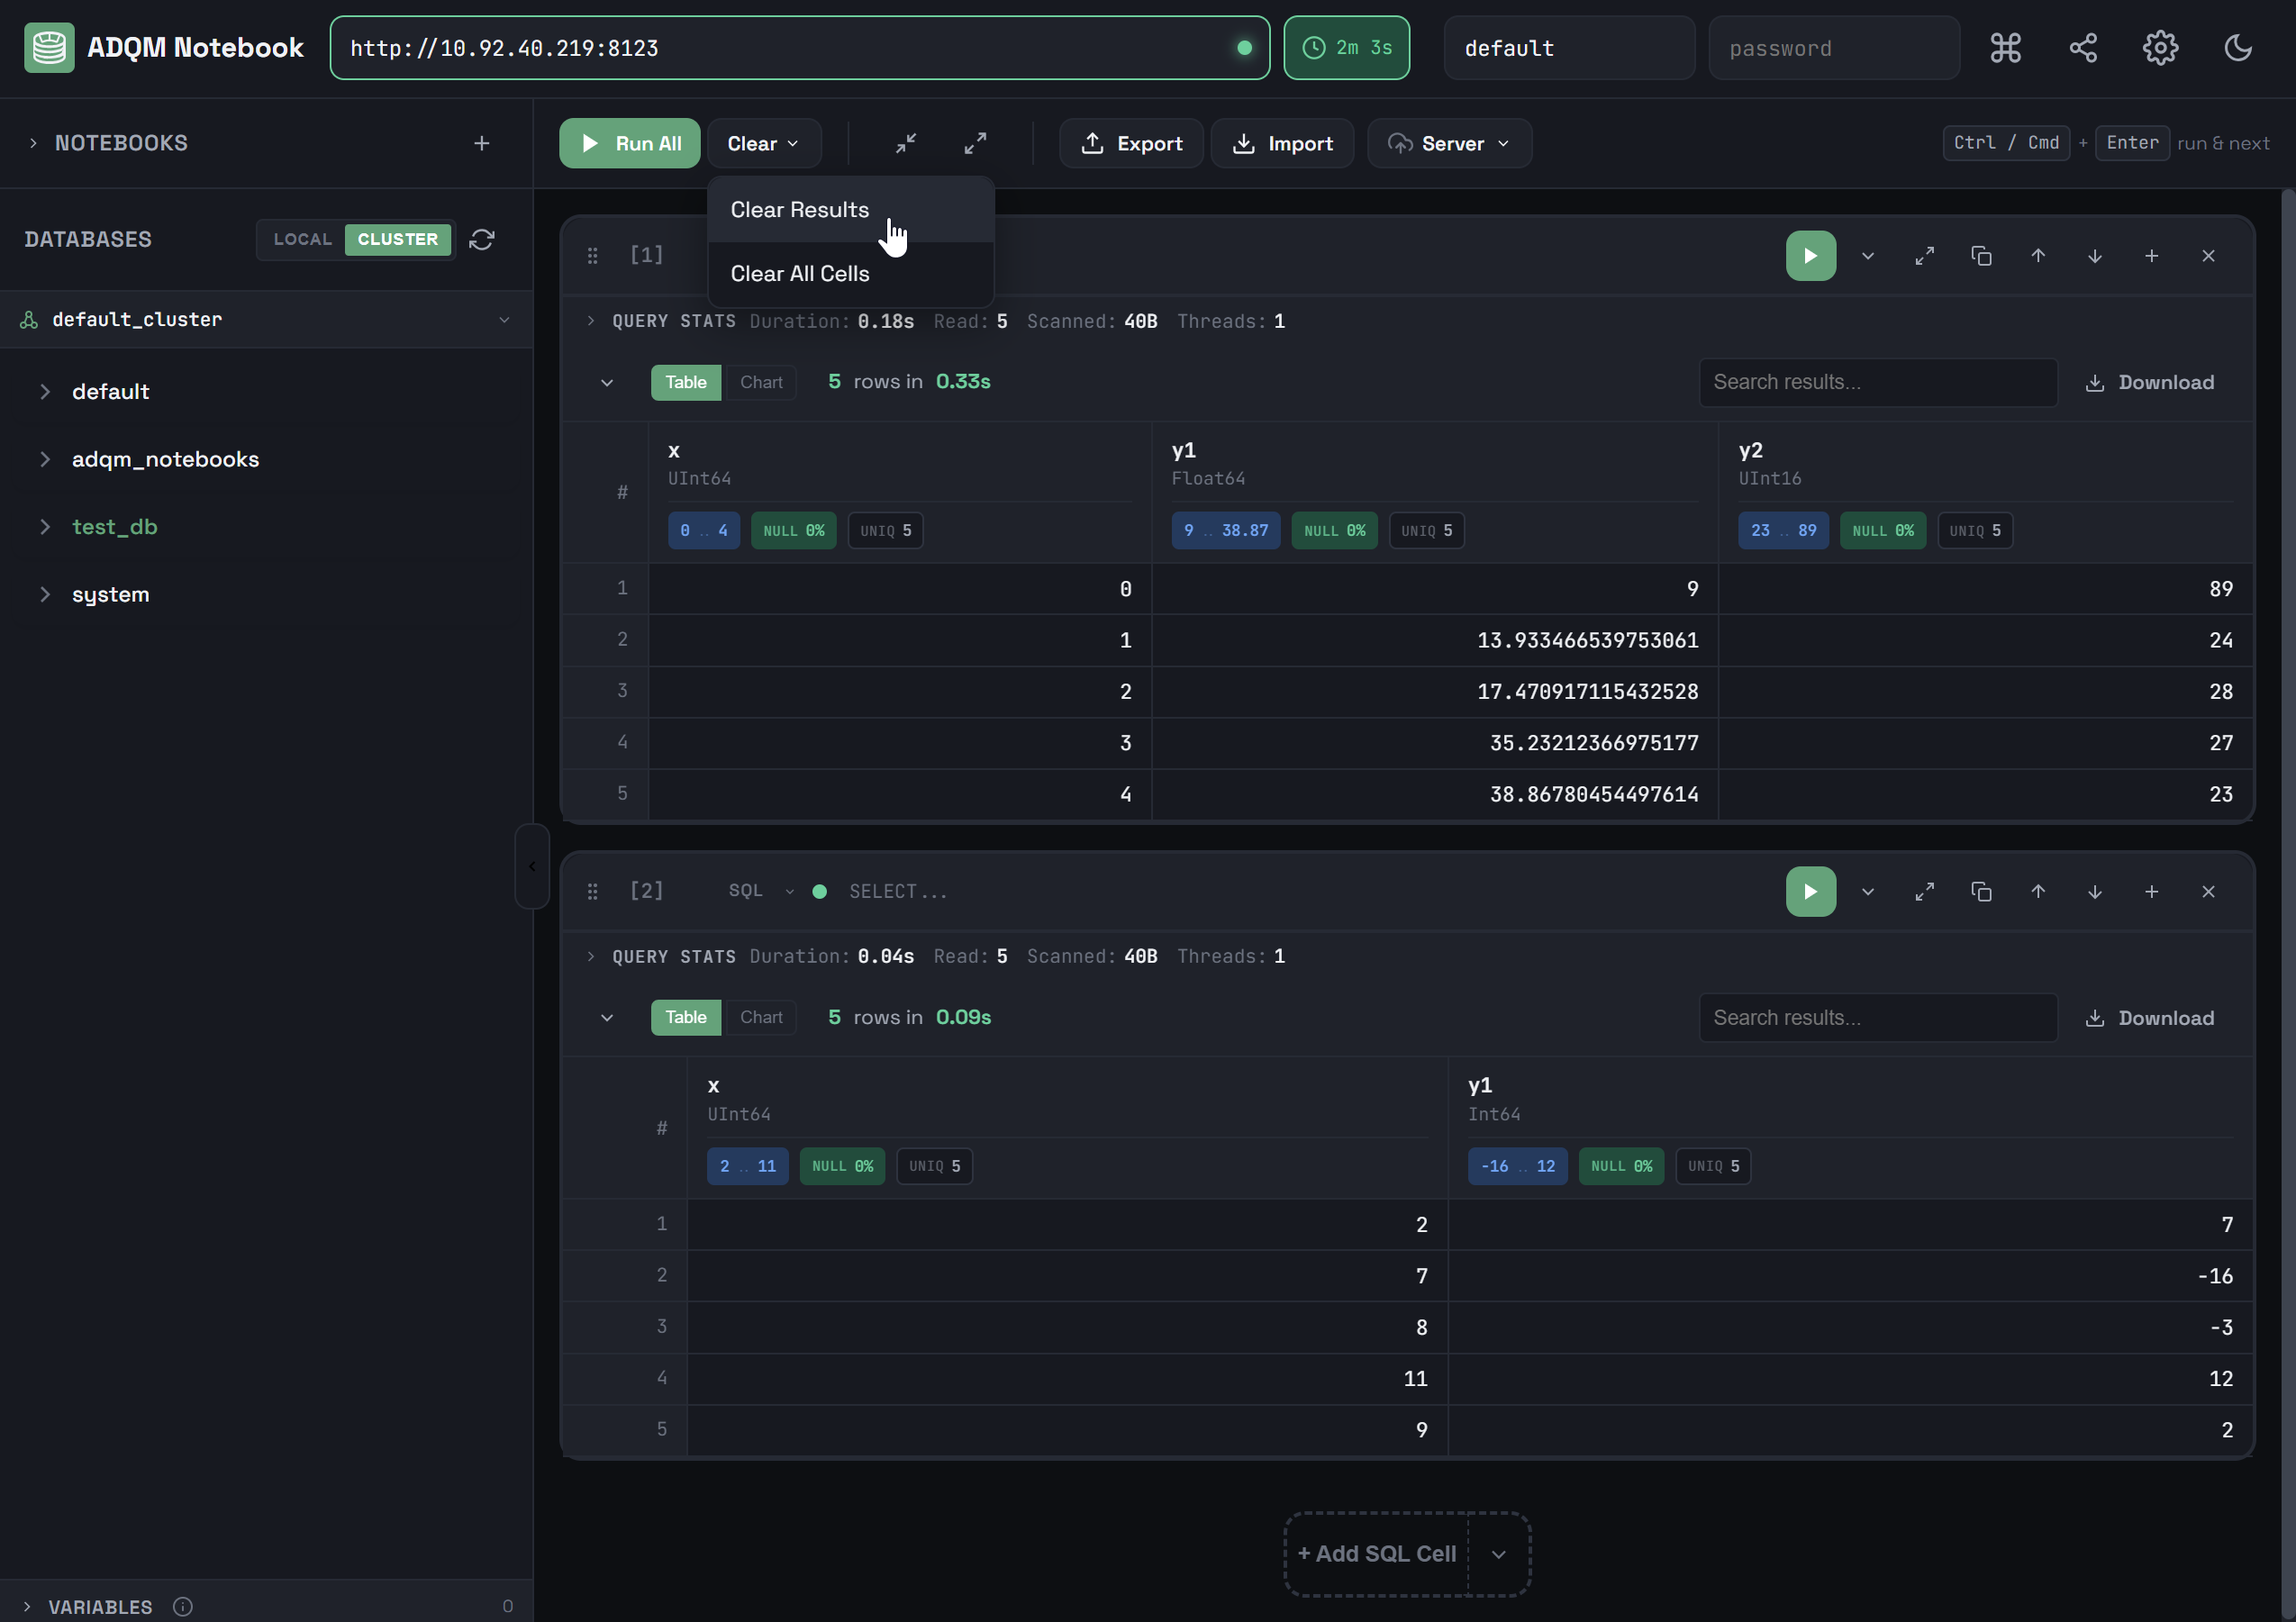
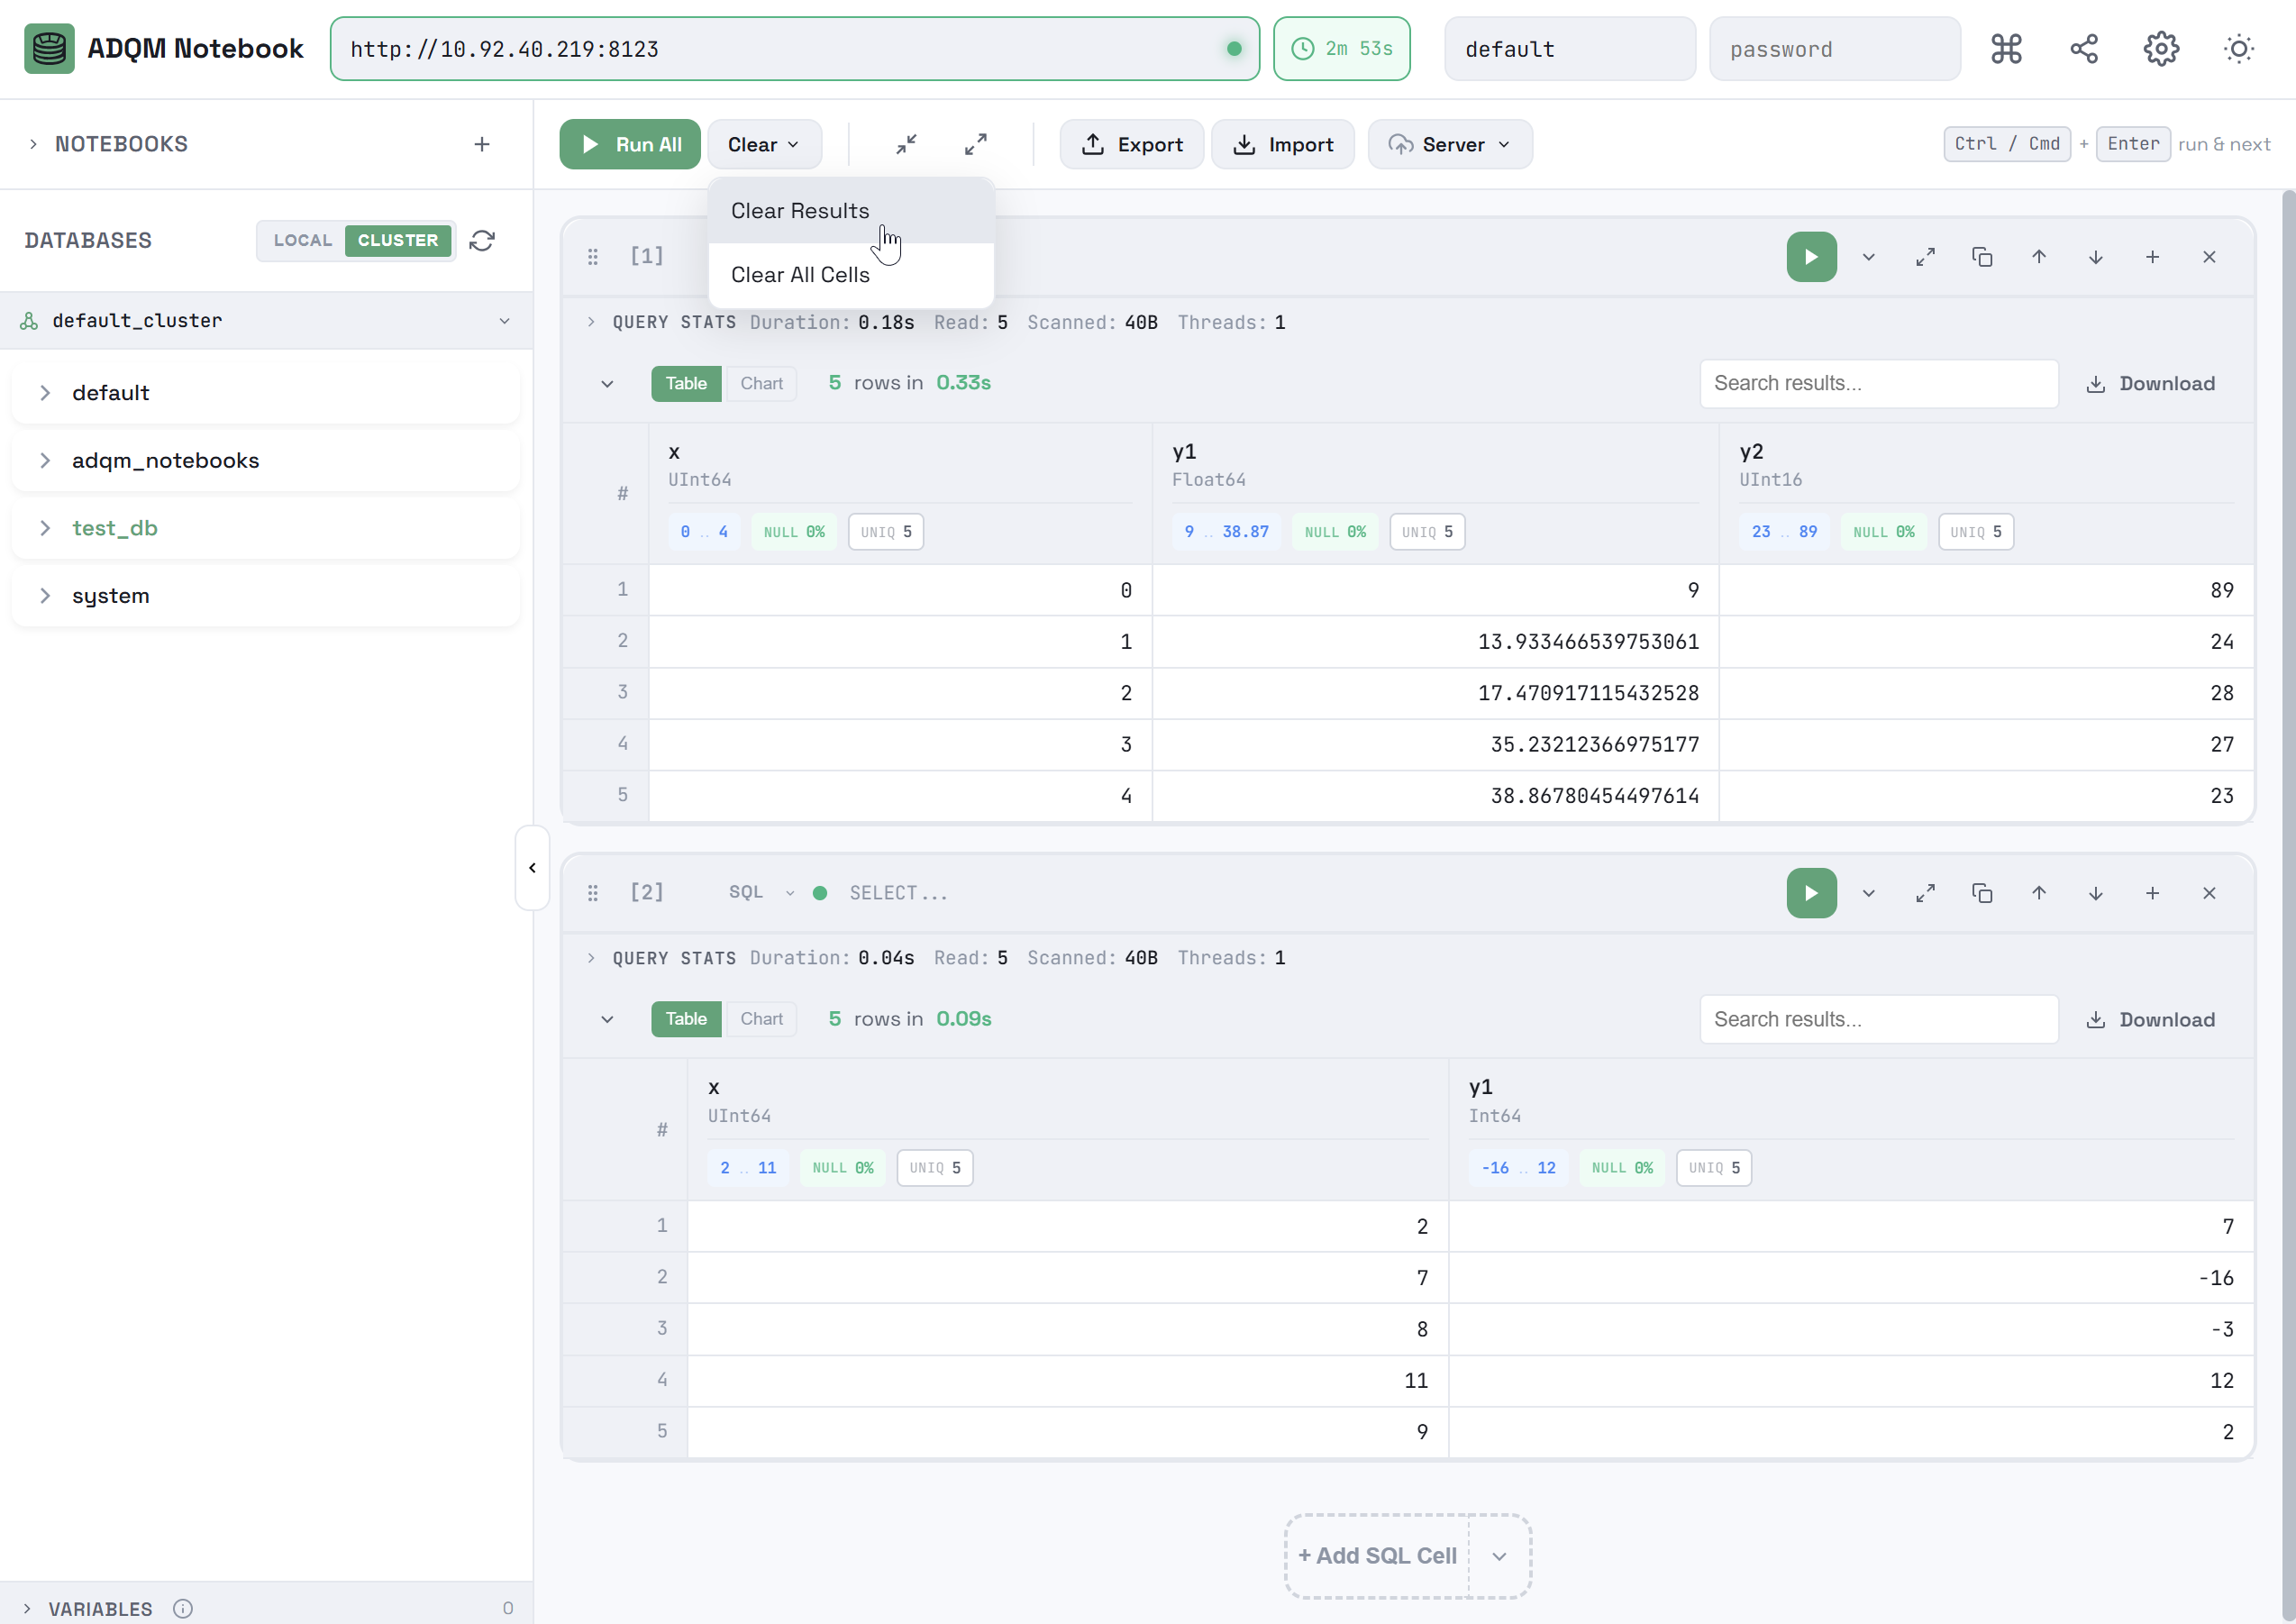
To clear the query results of all SQL cells in a notebook, open the Clear context menu in the notebook control panel and select Clear Results.
Results table
After executing a query, an SQL cell displays the resulting data set on the Table tab as an interactive data grid, which supports the following features for easy viewing of the received data:
-
Displaying column names and data types in headers.
-
Sorting data by clicking any column header.
-
Data search — filtering values in the result set by any column in real time using the Search results… field.
-
Smart formatting:
-
numeric columns are aligned to the right, text columns are aligned to the left;
-
URLs are automatically detected and converted into clickable links;
-
NULL values are visually different from others;
-
JSON data is formatted;
-
arrays and JSON objects can be collapsed/expanded (the default behavior is controlled by the Expand JSON/Arrays by default option in the interface settings — this option affects the display of the results of newly executed queries; already displayed results will not be collapsed/expanded when the option is switched);
-
summary information on columns as labels in headers: the proportion of NULL values in a column (if
0%— a green label, if more than0%— a red label), the number of unique values in a column, the range of values in numeric and DateTime columns.
-
|
NOTE
The maximum number of cells ( |
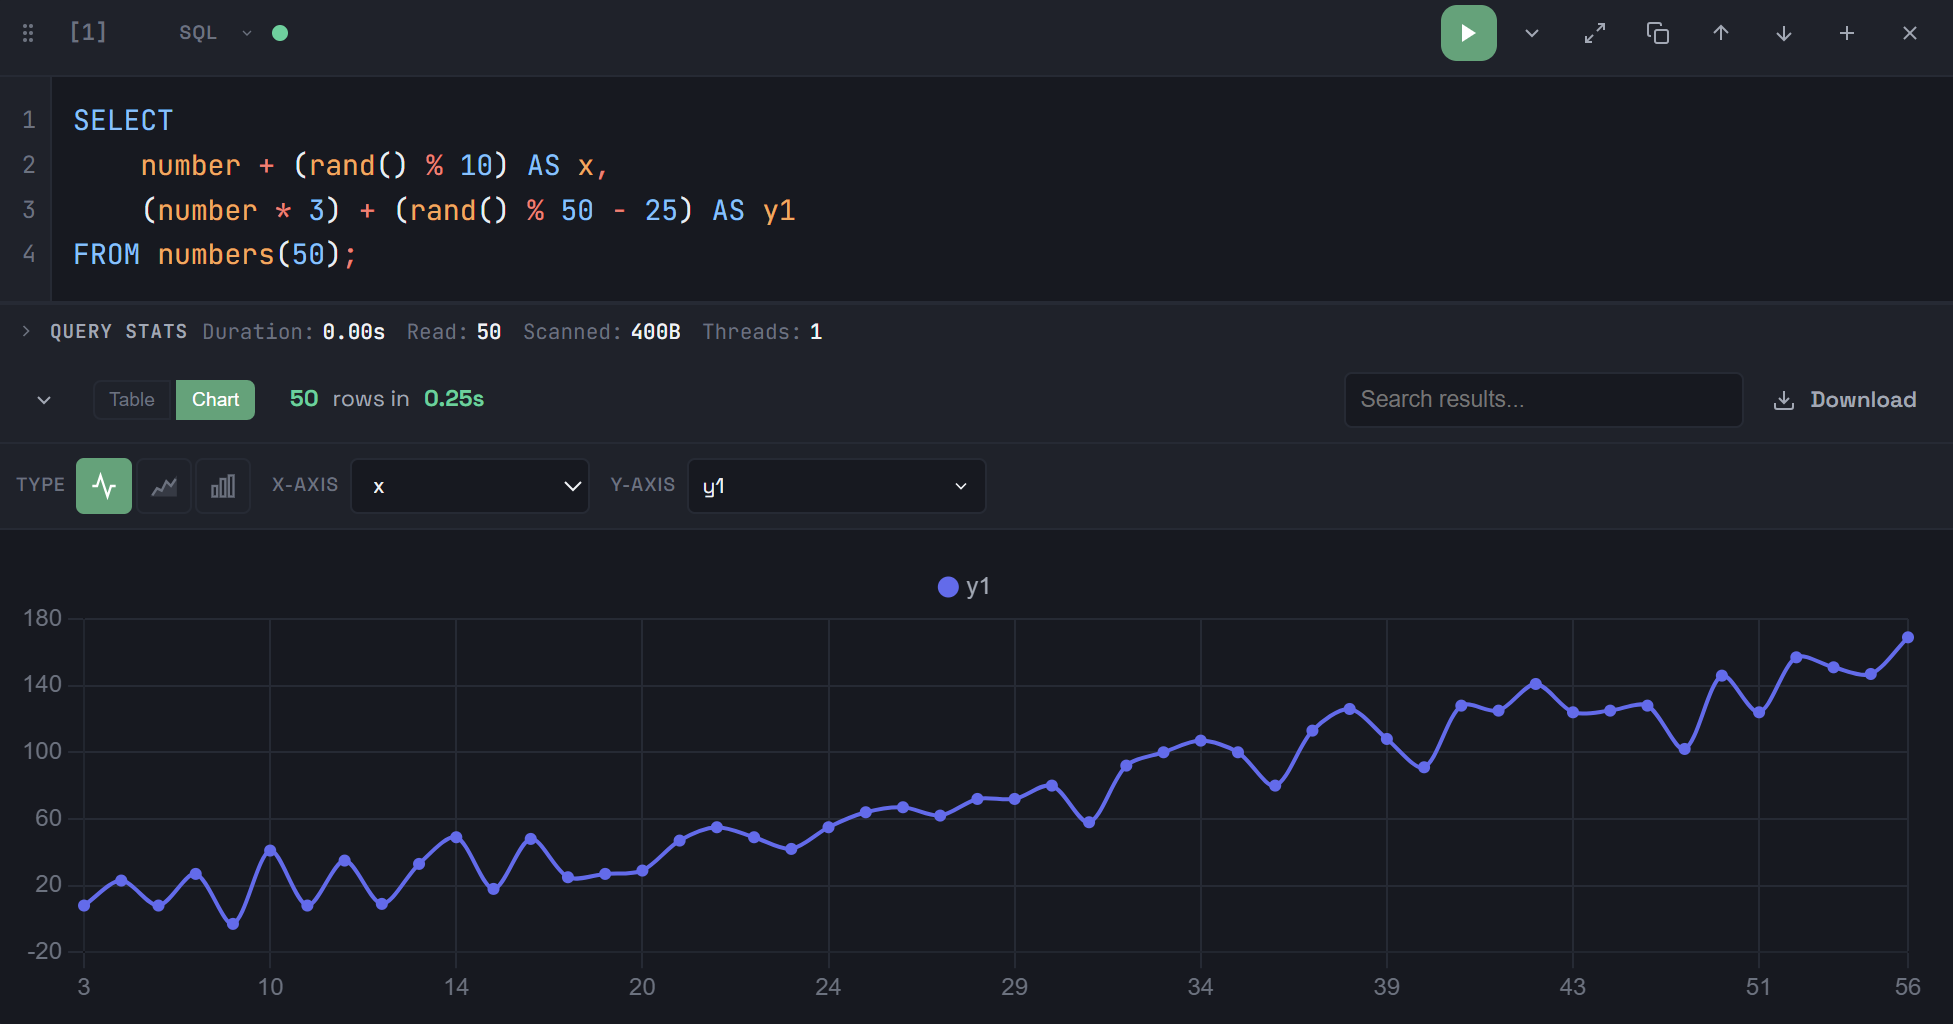
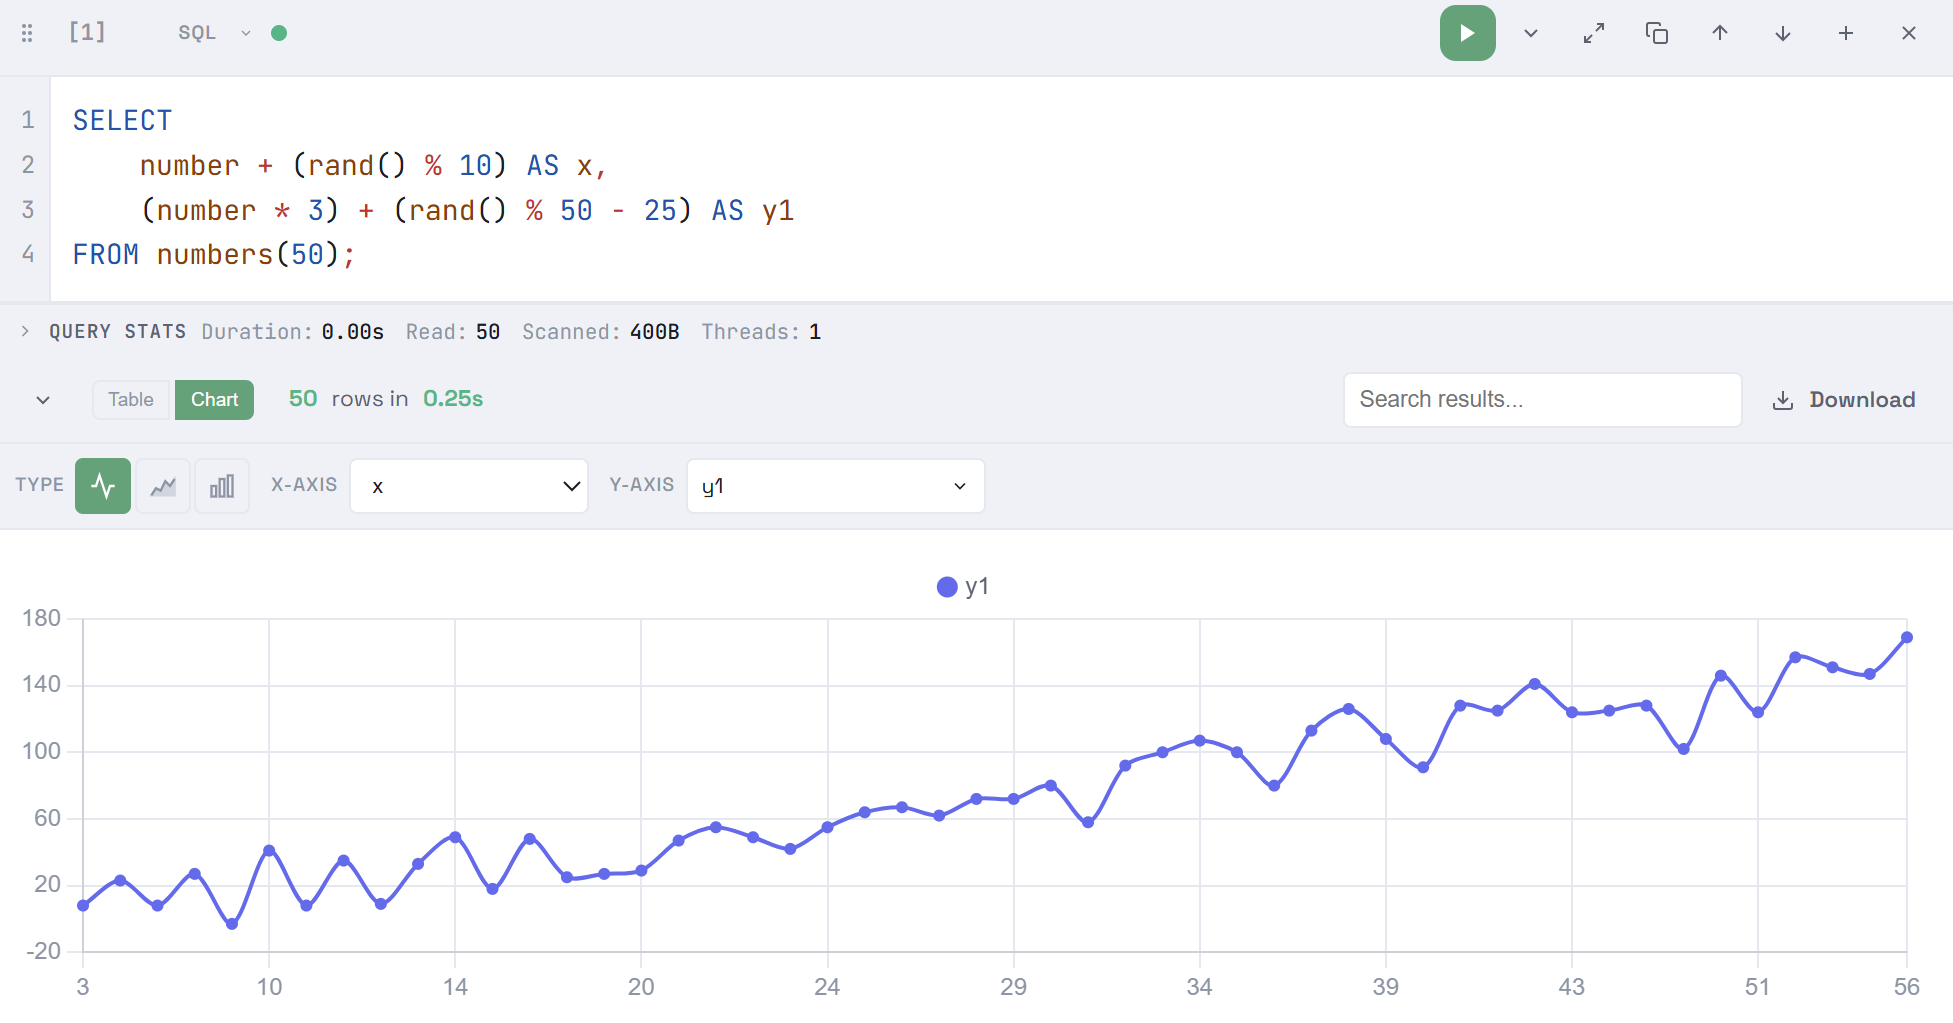
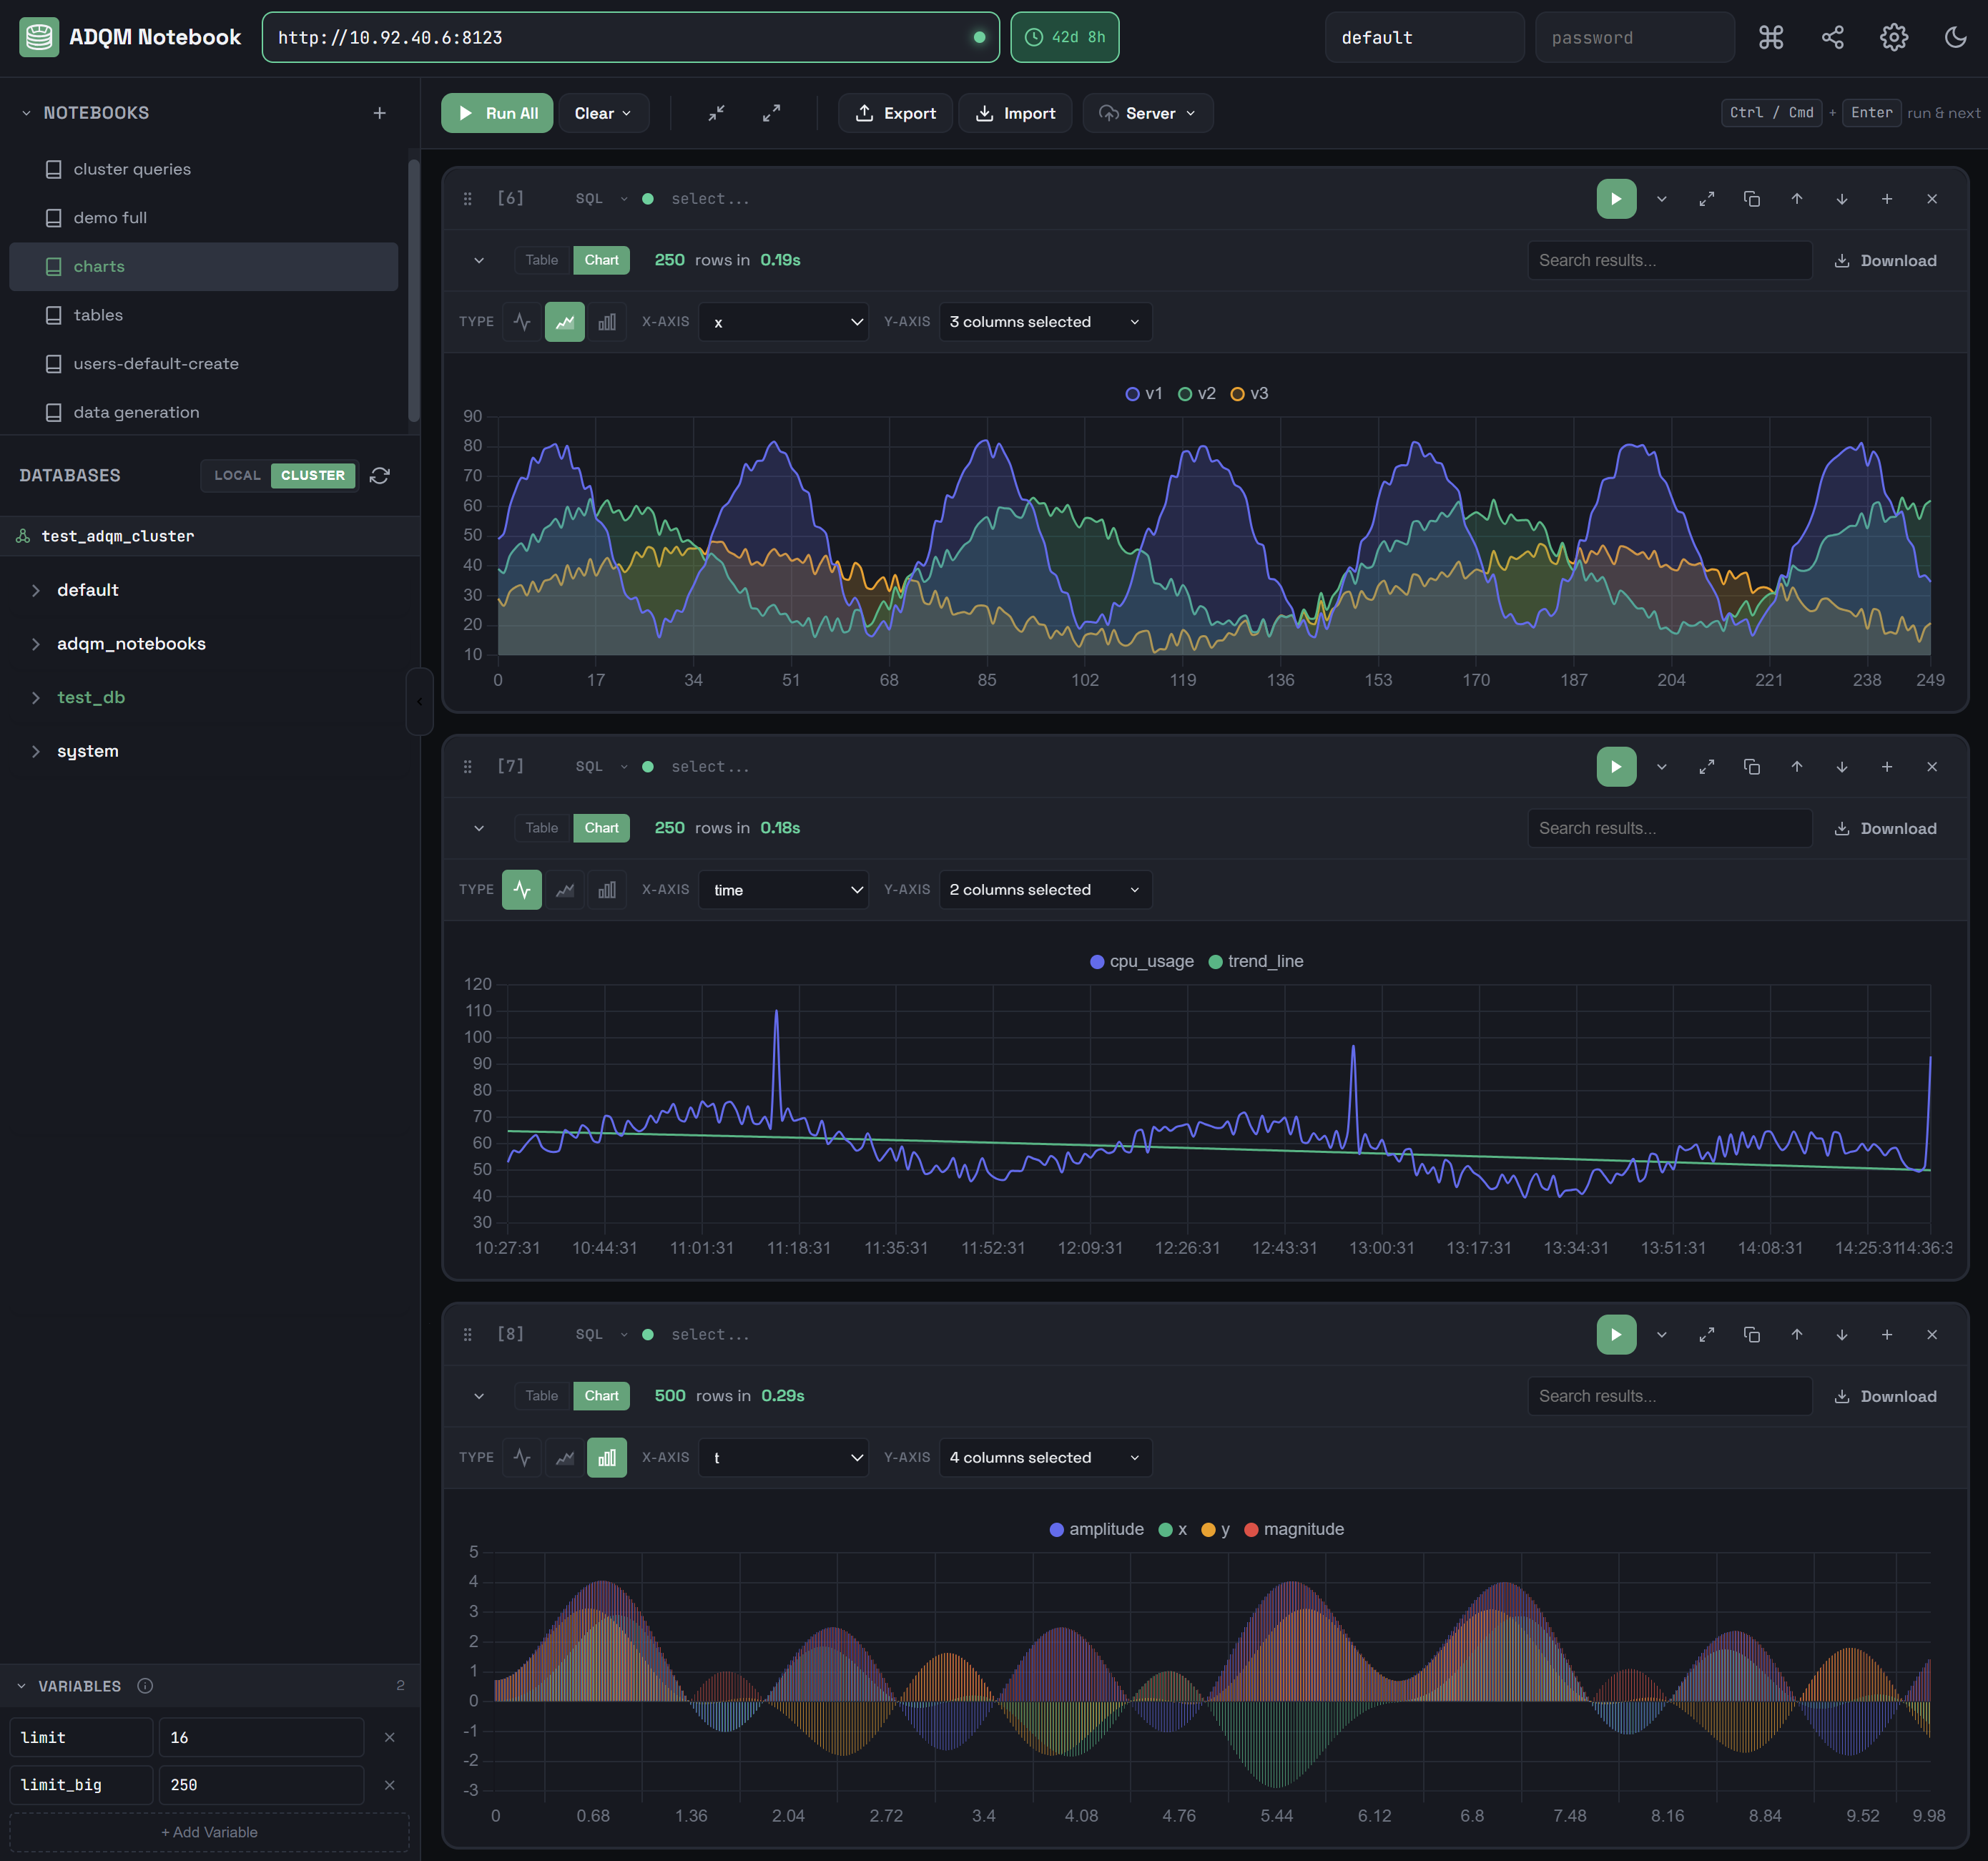
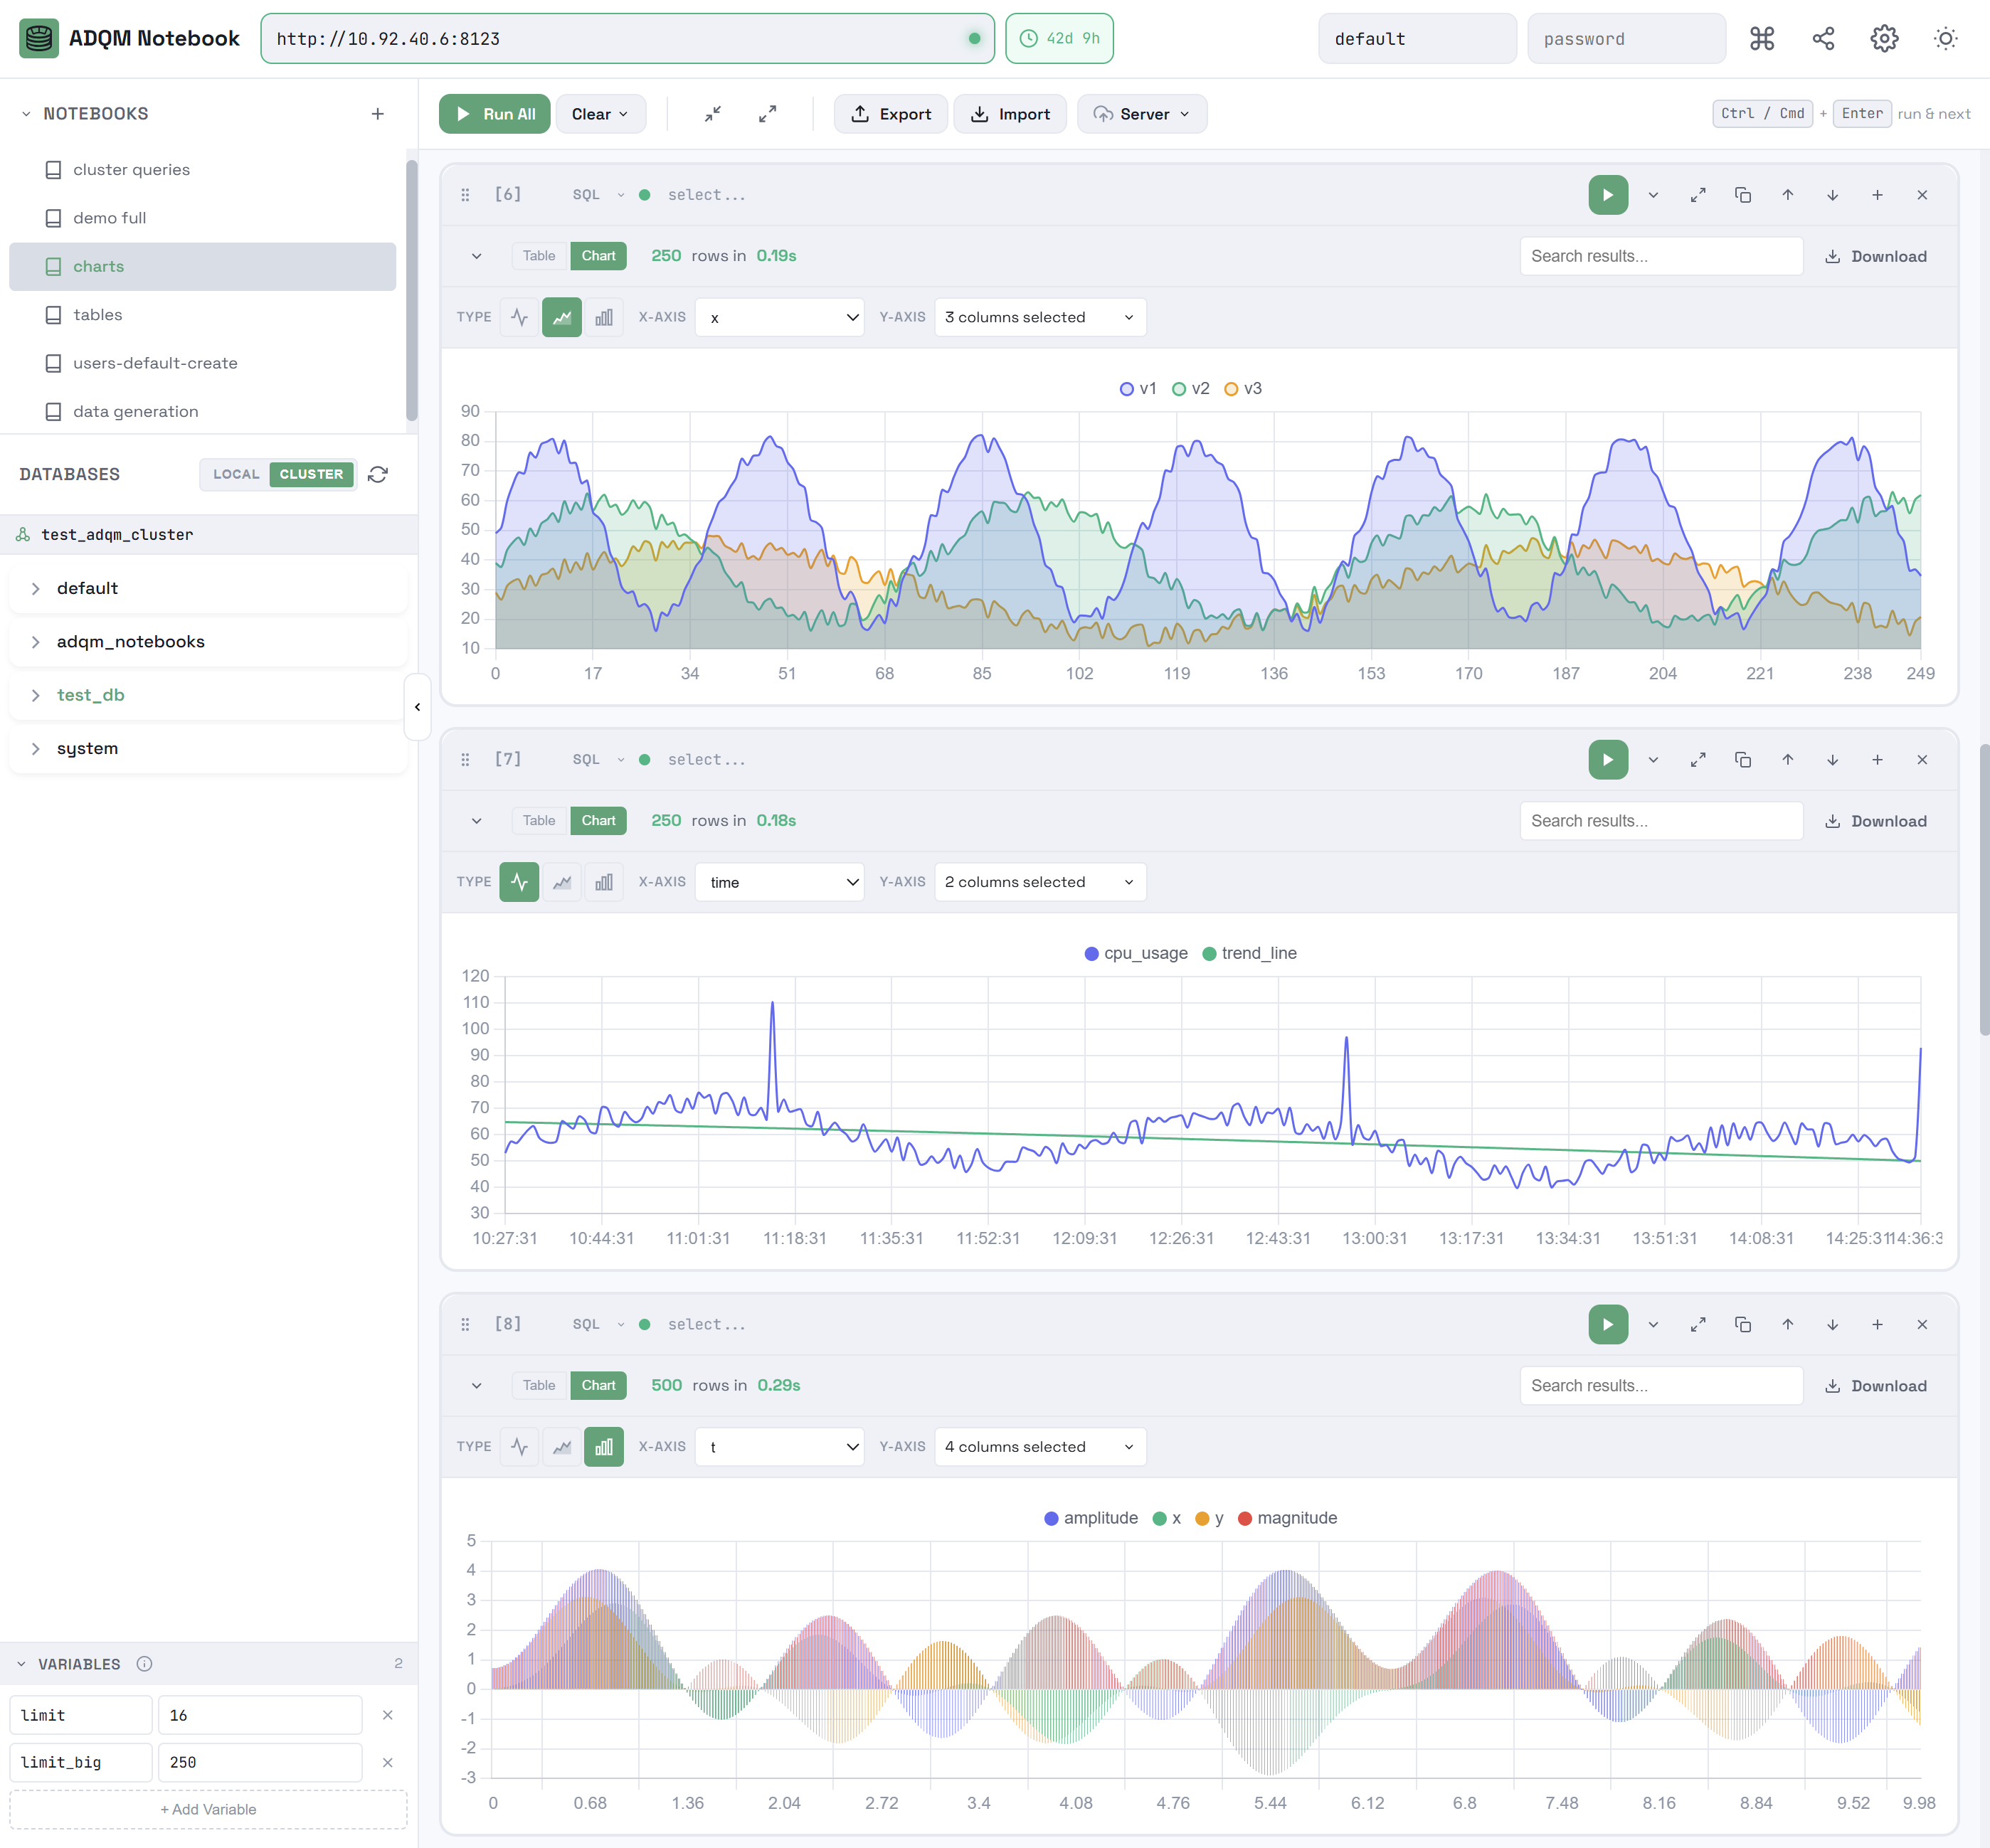
Query results chart
You can also view the numerical results of your queries as charts. To do this, open the Chart tab in the results panel and configure the following parameters to build a chart:
-
TYPE — chart type (

 Line,
Line, 
 Area, or
 Bar);
Bar); -
X-AXIS — a column whose values will be used for labels on the X axis;
-
Y-AXIS — one or more columns whose values will be used for labels on the Y axis.
On both axes, a chart is built between the minimum and maximum values from the query results.
A chart displays a maximum of 2000 points due to downsampling. If downsampling is applied, the note downsampled to N of M points is shown, while the results table still contains all rows.
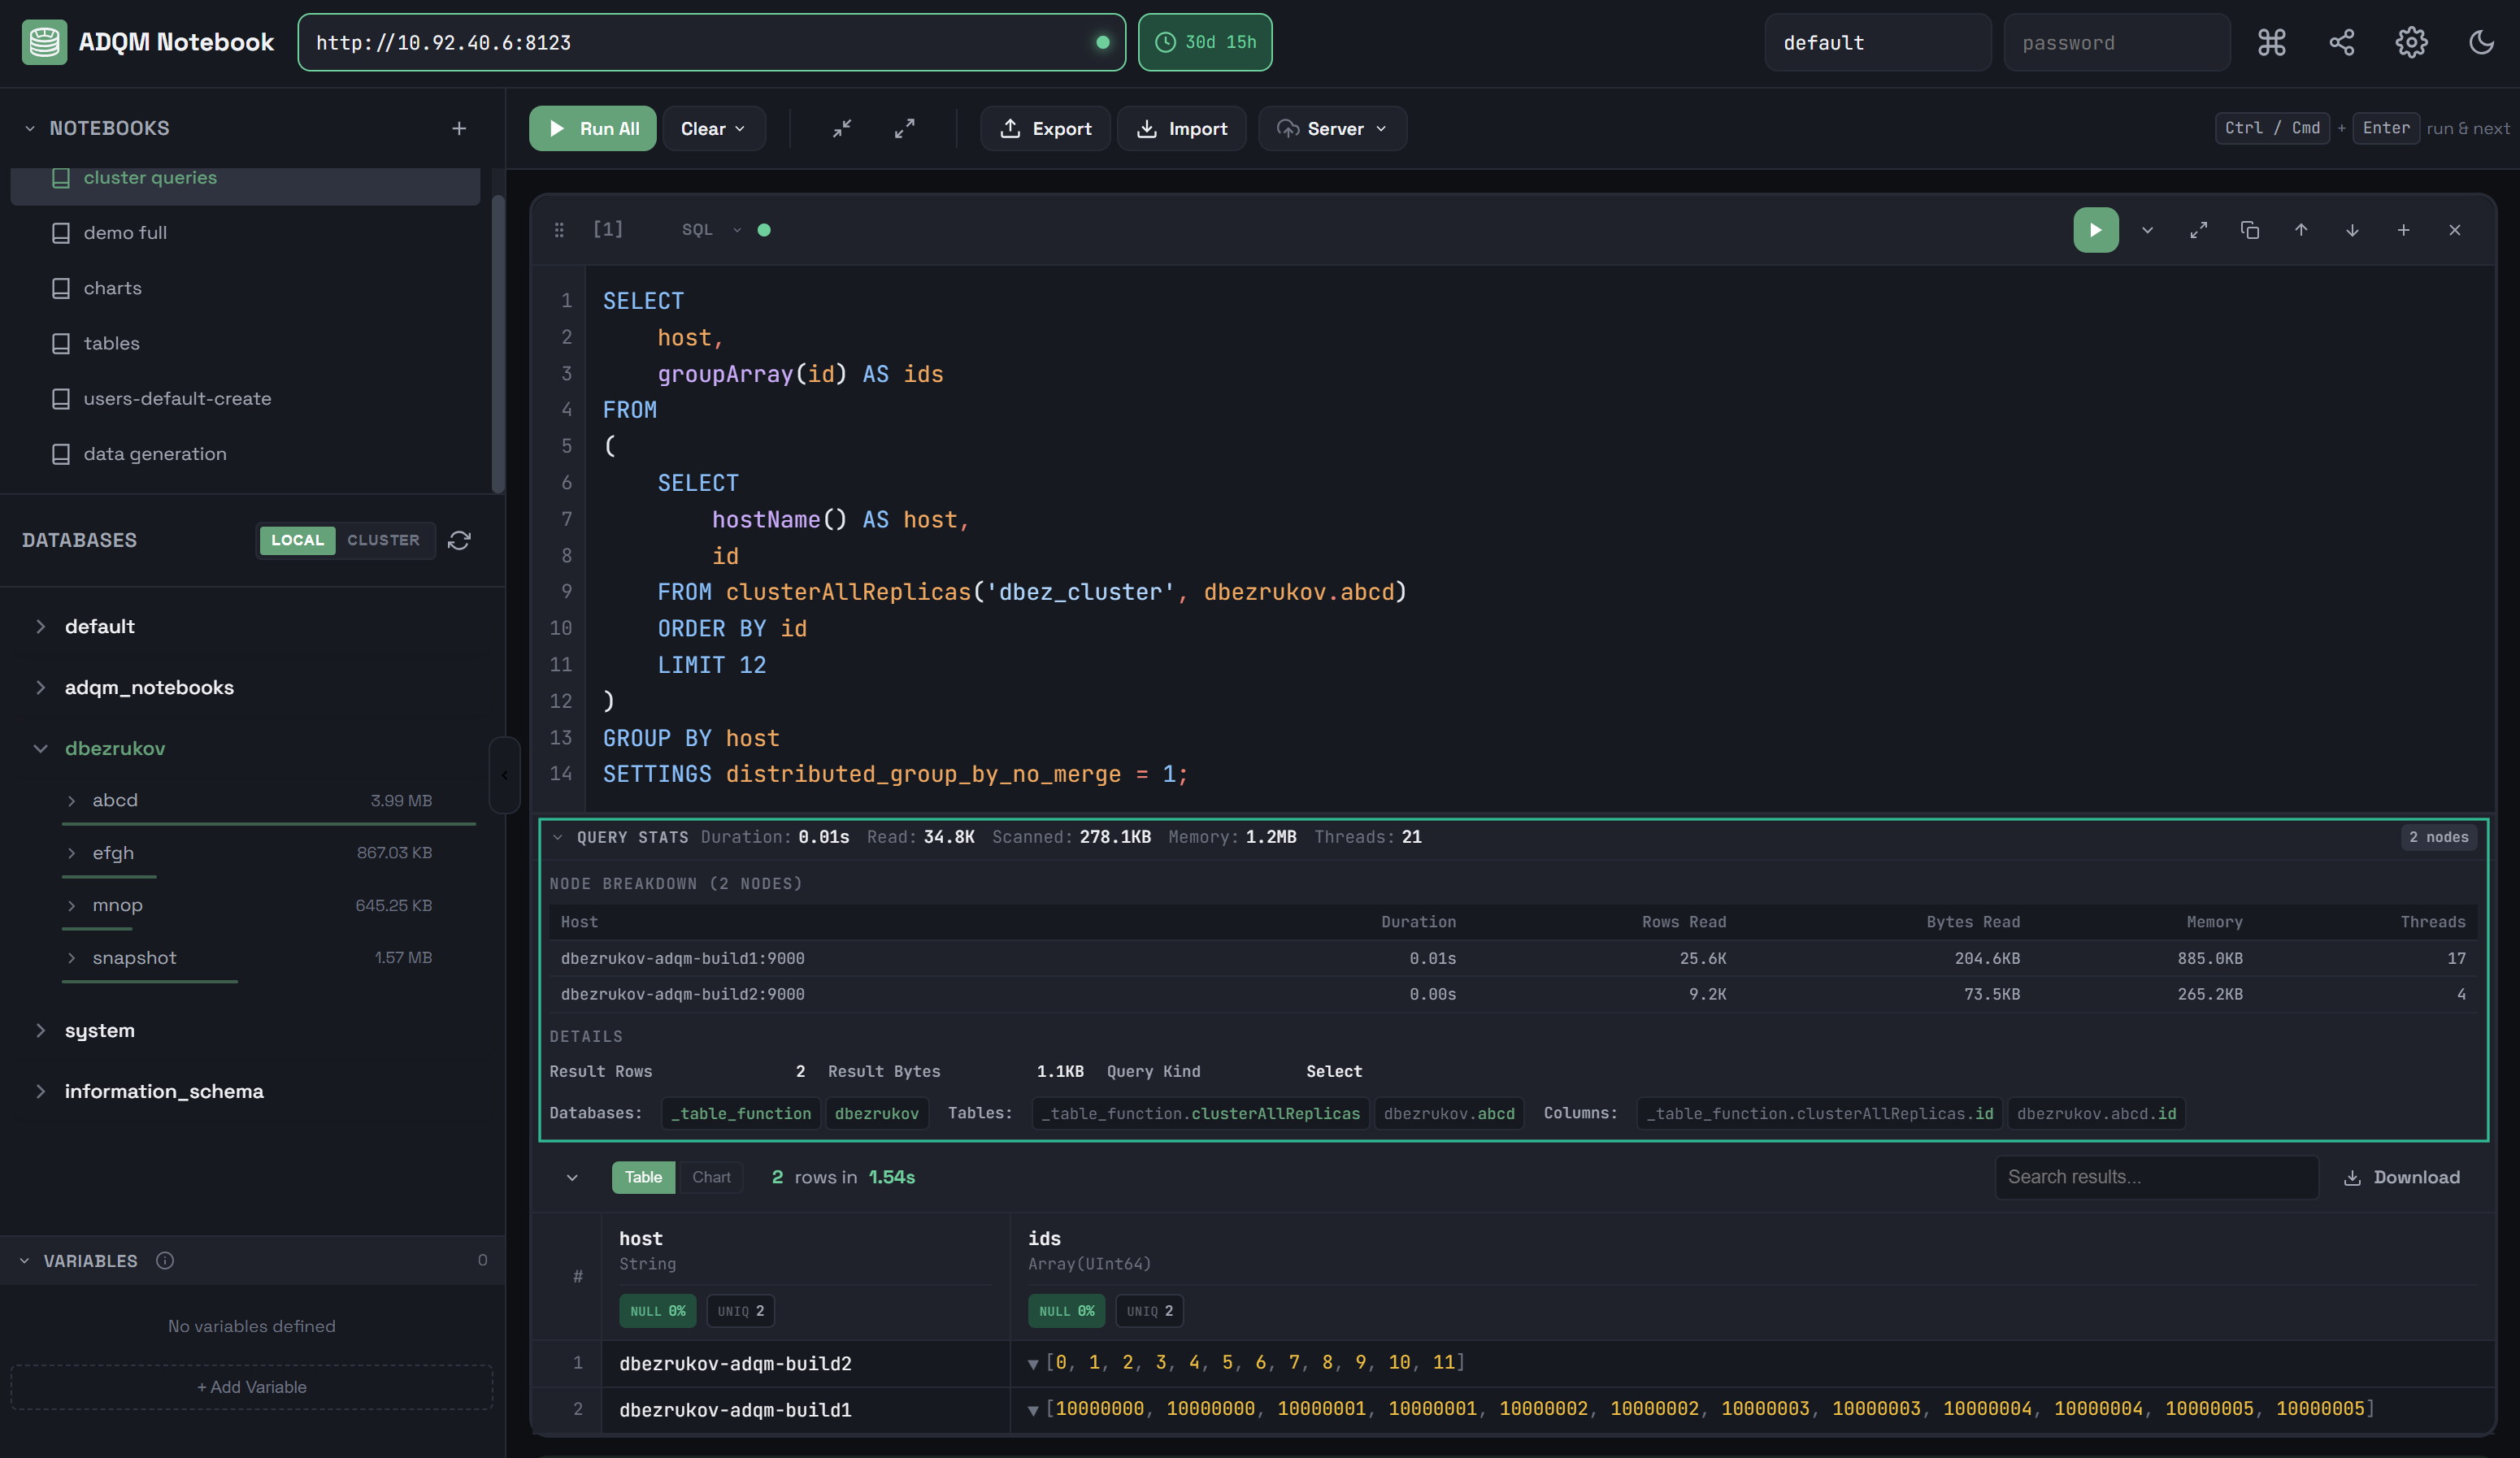
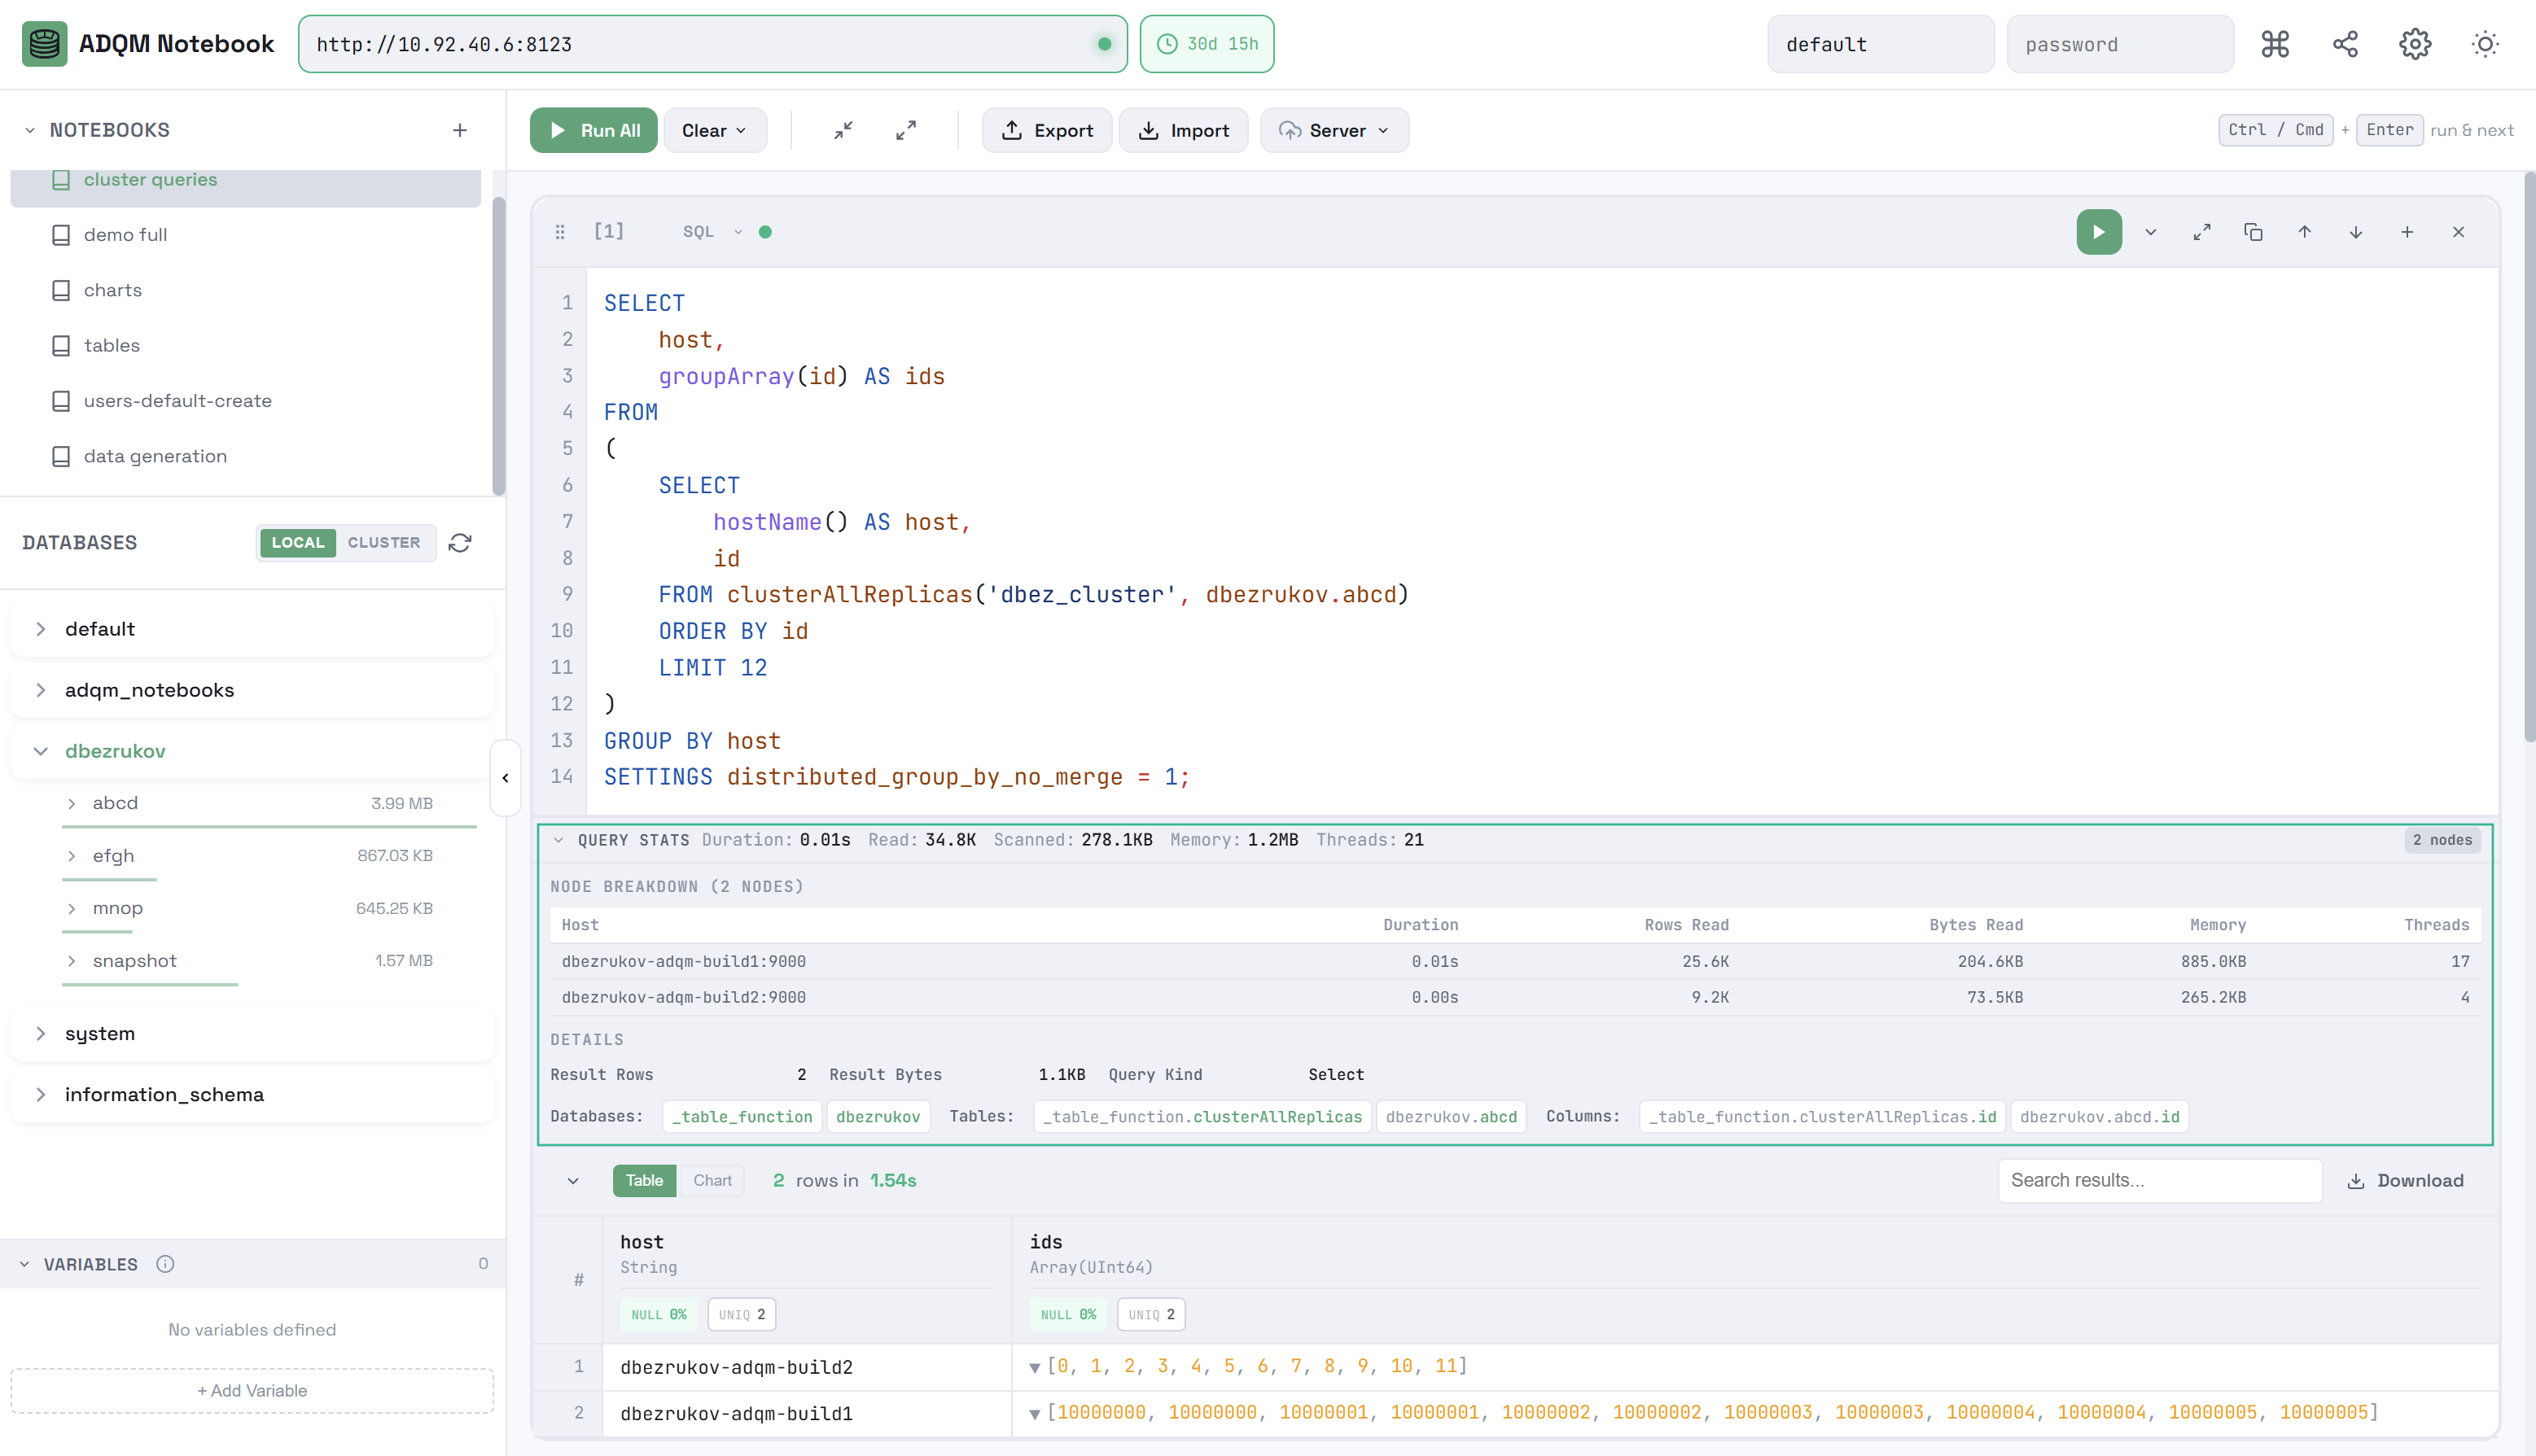
Query execution statistics
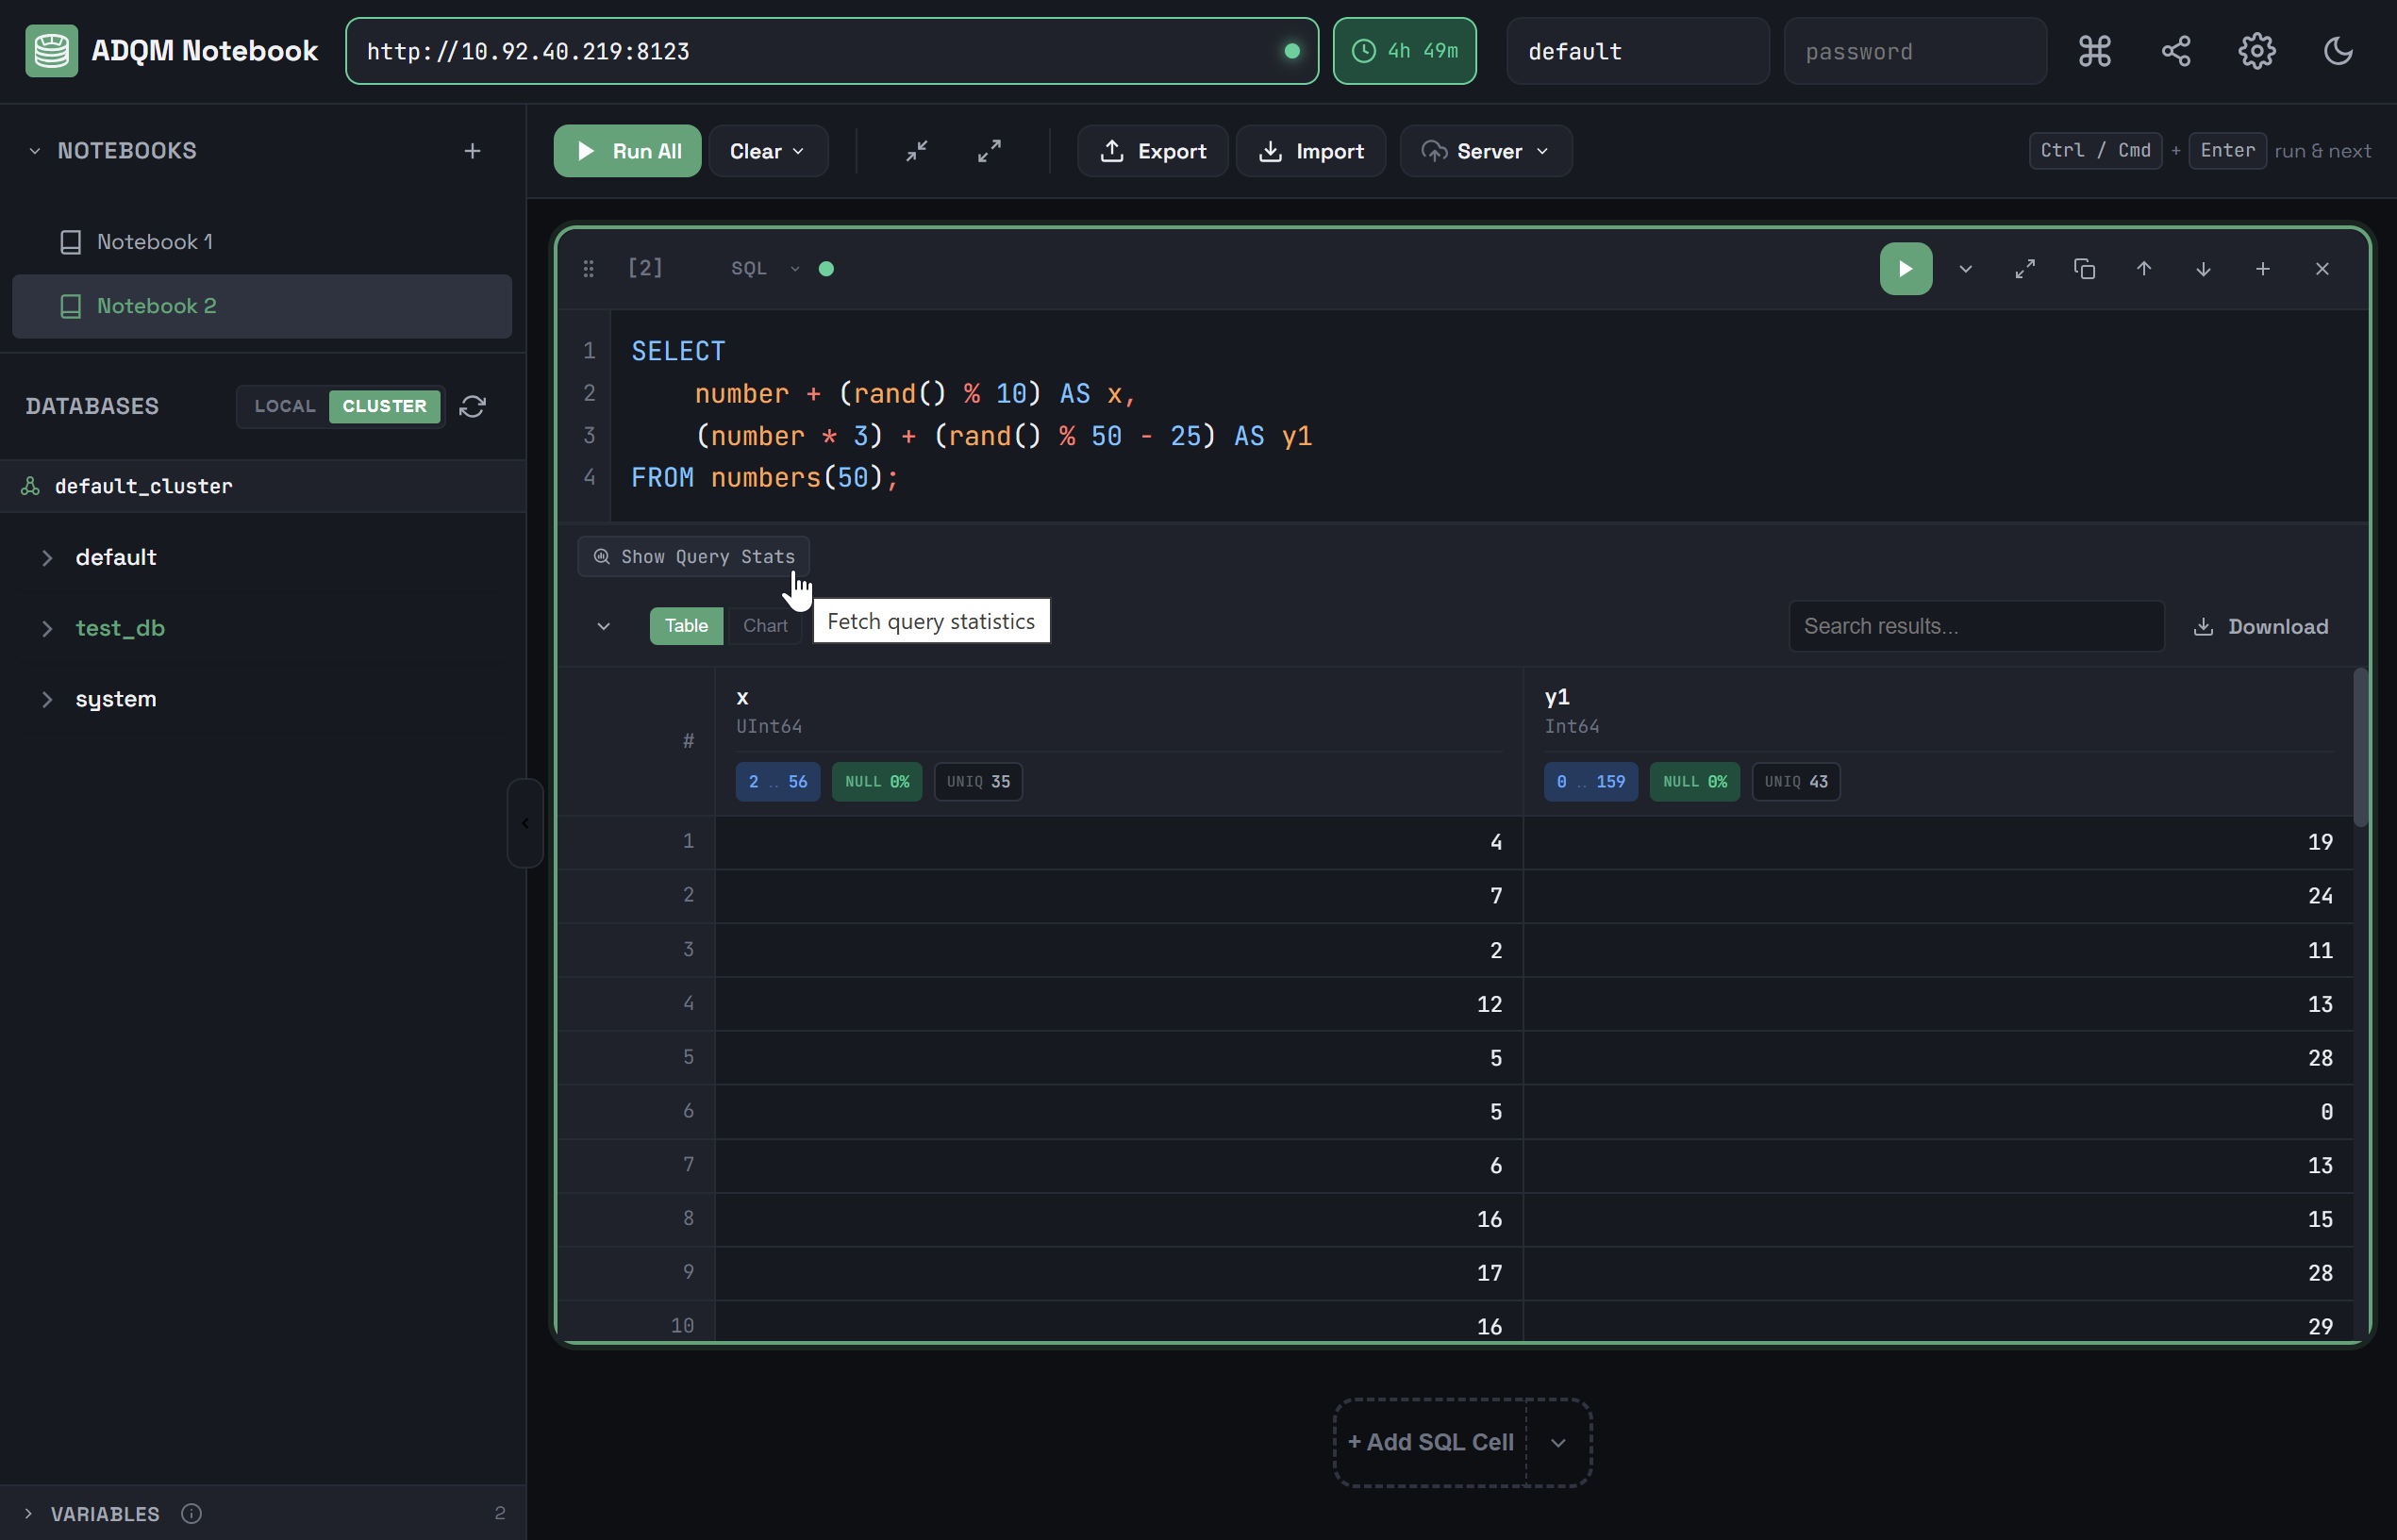
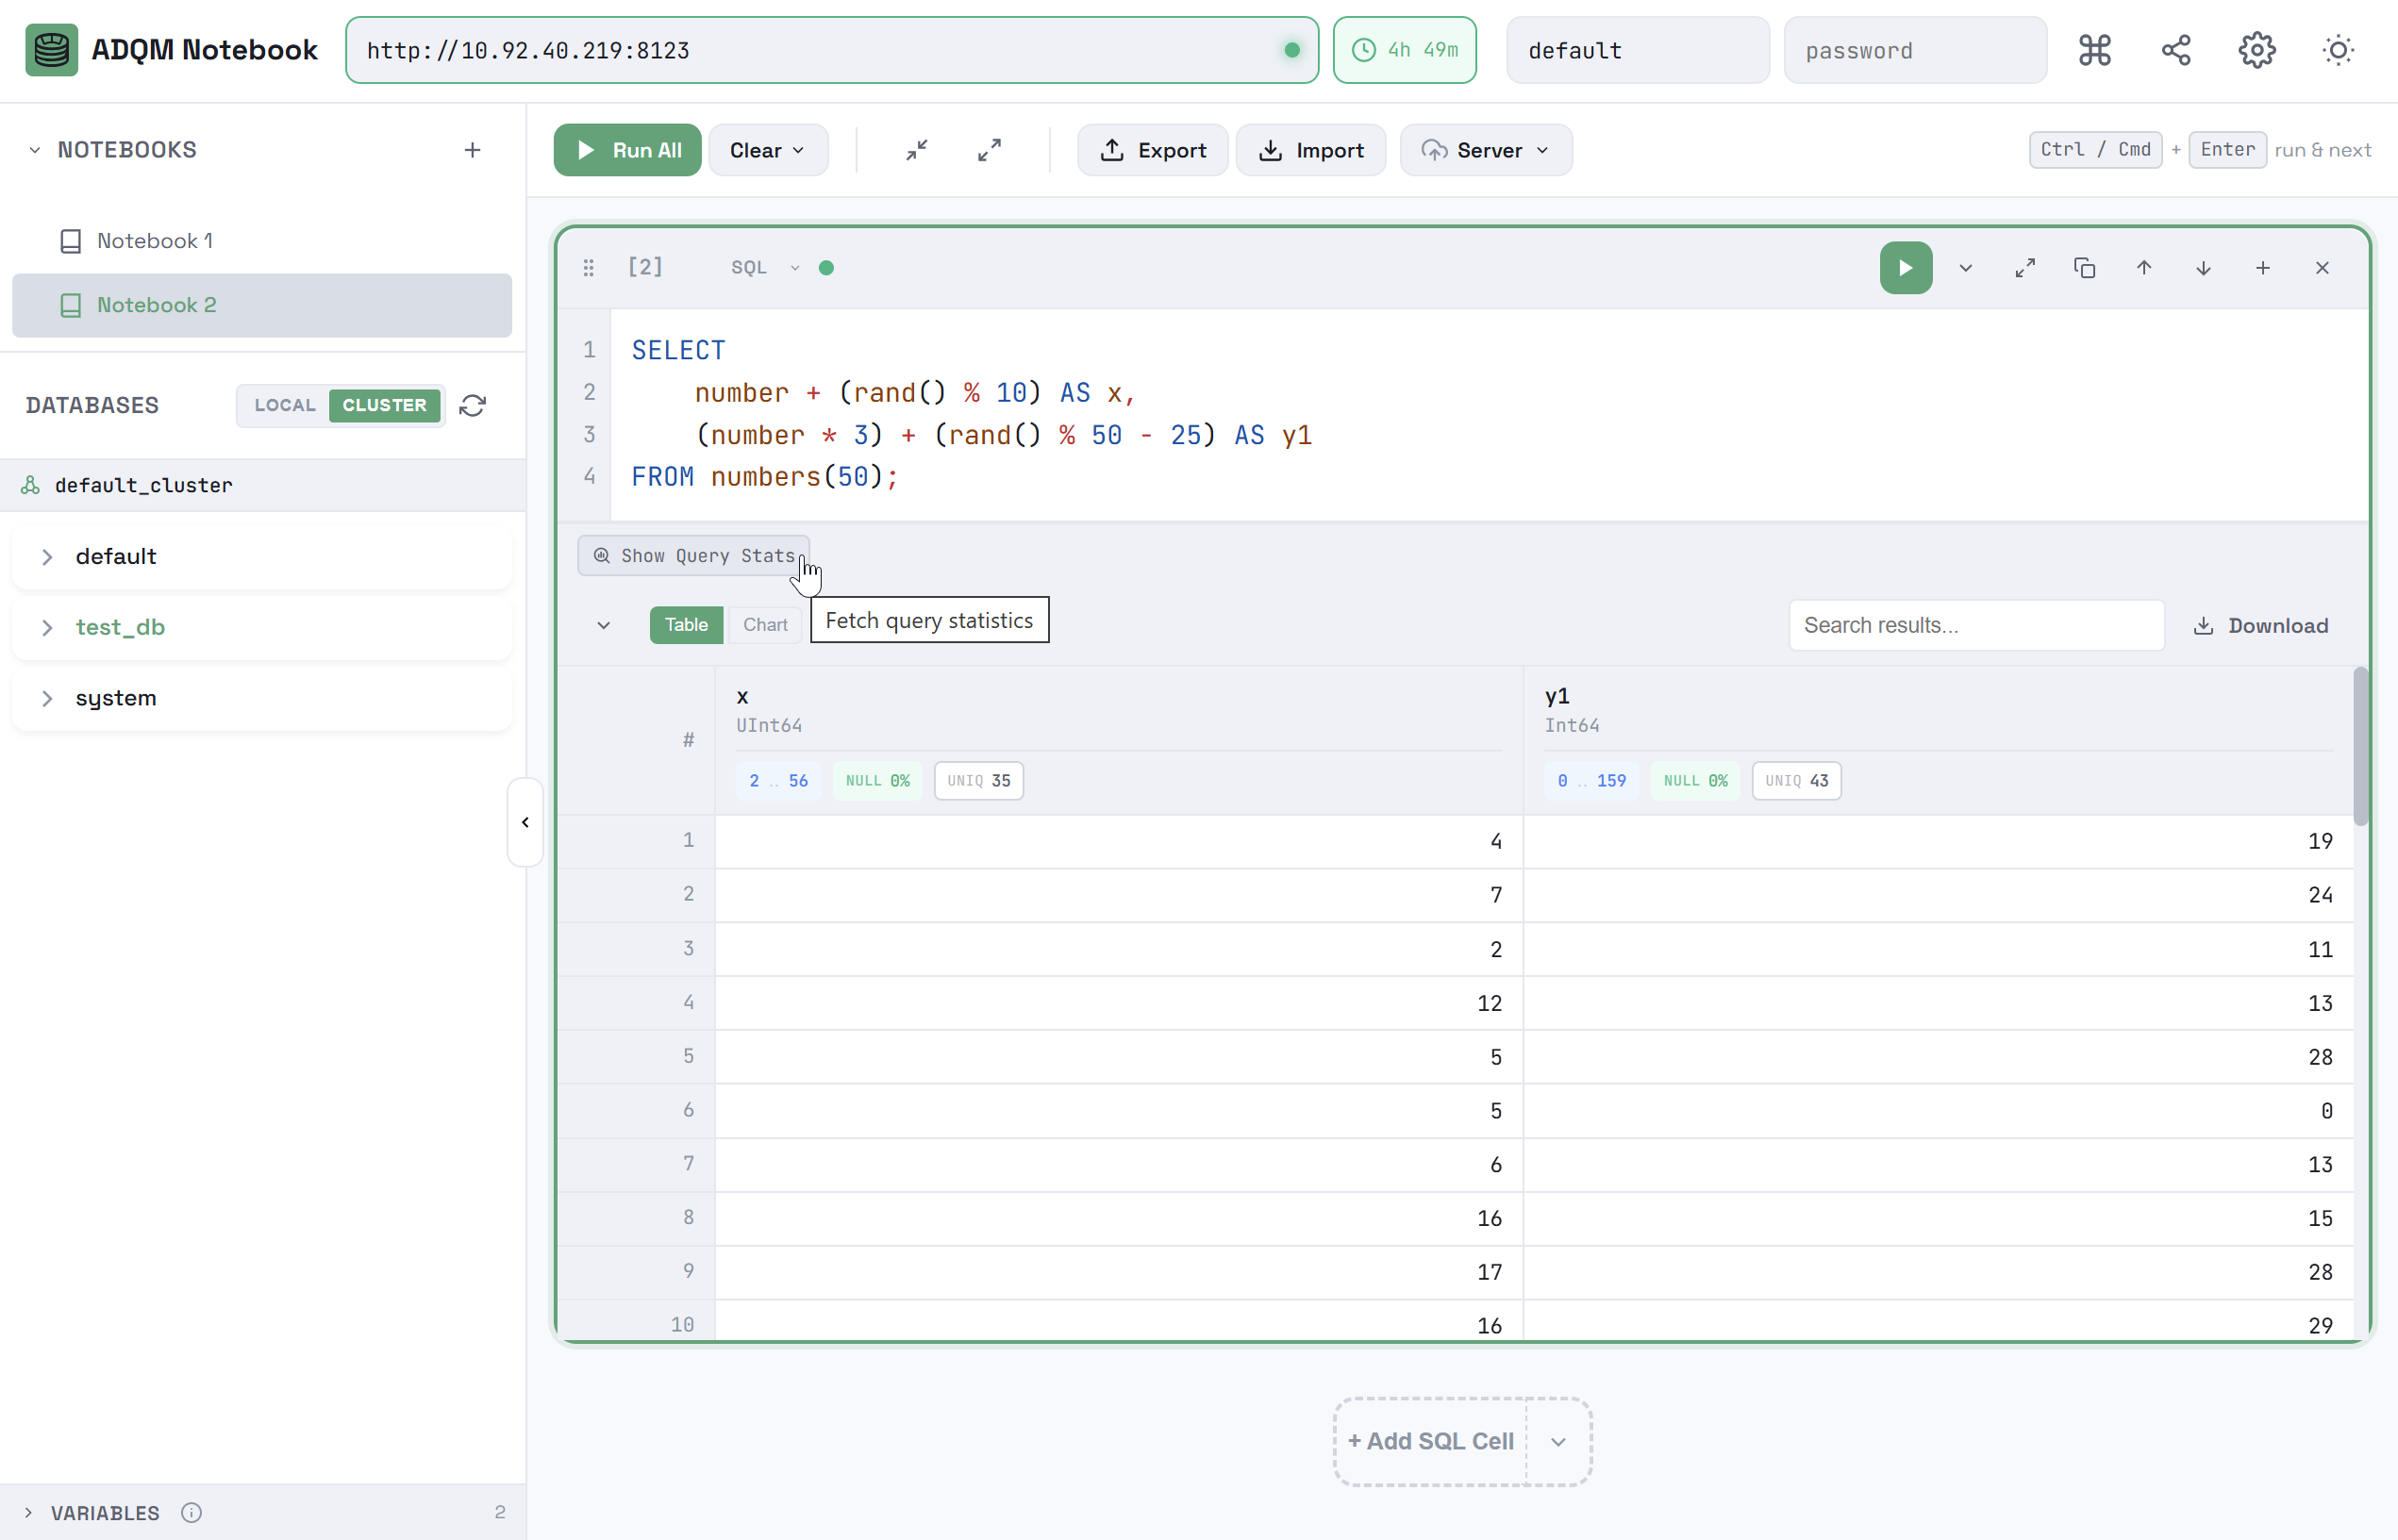
If query logging is enabled in ADQM (the query_log parameter is activated), an SQL cell displays the QUERY STATS panel with the following information about the query execution:
-
Duration — query execution time;
-
Read — total number of rows read from all tables and table functions involved in a query;
-
Scanned — total number of bytes read from all tables and table functions involved in a query;
-
Memory — memory used by a query;
-
Threads — peak number of threads used simultaneously during query execution;
-
Node Breakdown — information about query execution on each host (when a query is executed in an ADQM cluster);
-
Details — detailed information including: query kind (
SELECT,INSERT, etc.), number of rows written (for write queries), bytes written, number of rows in query results, size of query results in bytes, and names of databases/tables/columns accessed by the query.
Statistics are displayed automatically after executing a query if the Show Query Statistics option is enabled in the ADQM Notebook interface settings. If this option is disabled (by default), click Show Query Stats in the panel to view statistics.
To select a cluster for receiving query statistics, use the Cluster for Statistics setting. If no clusters are defined in the ADQM configuration, this setting is fixed at Single node.