ADQM Notebook
ADQM Notebook is a tool for working with ADQM databases that extends the capabilities of the built-in ClickHouse web interface.
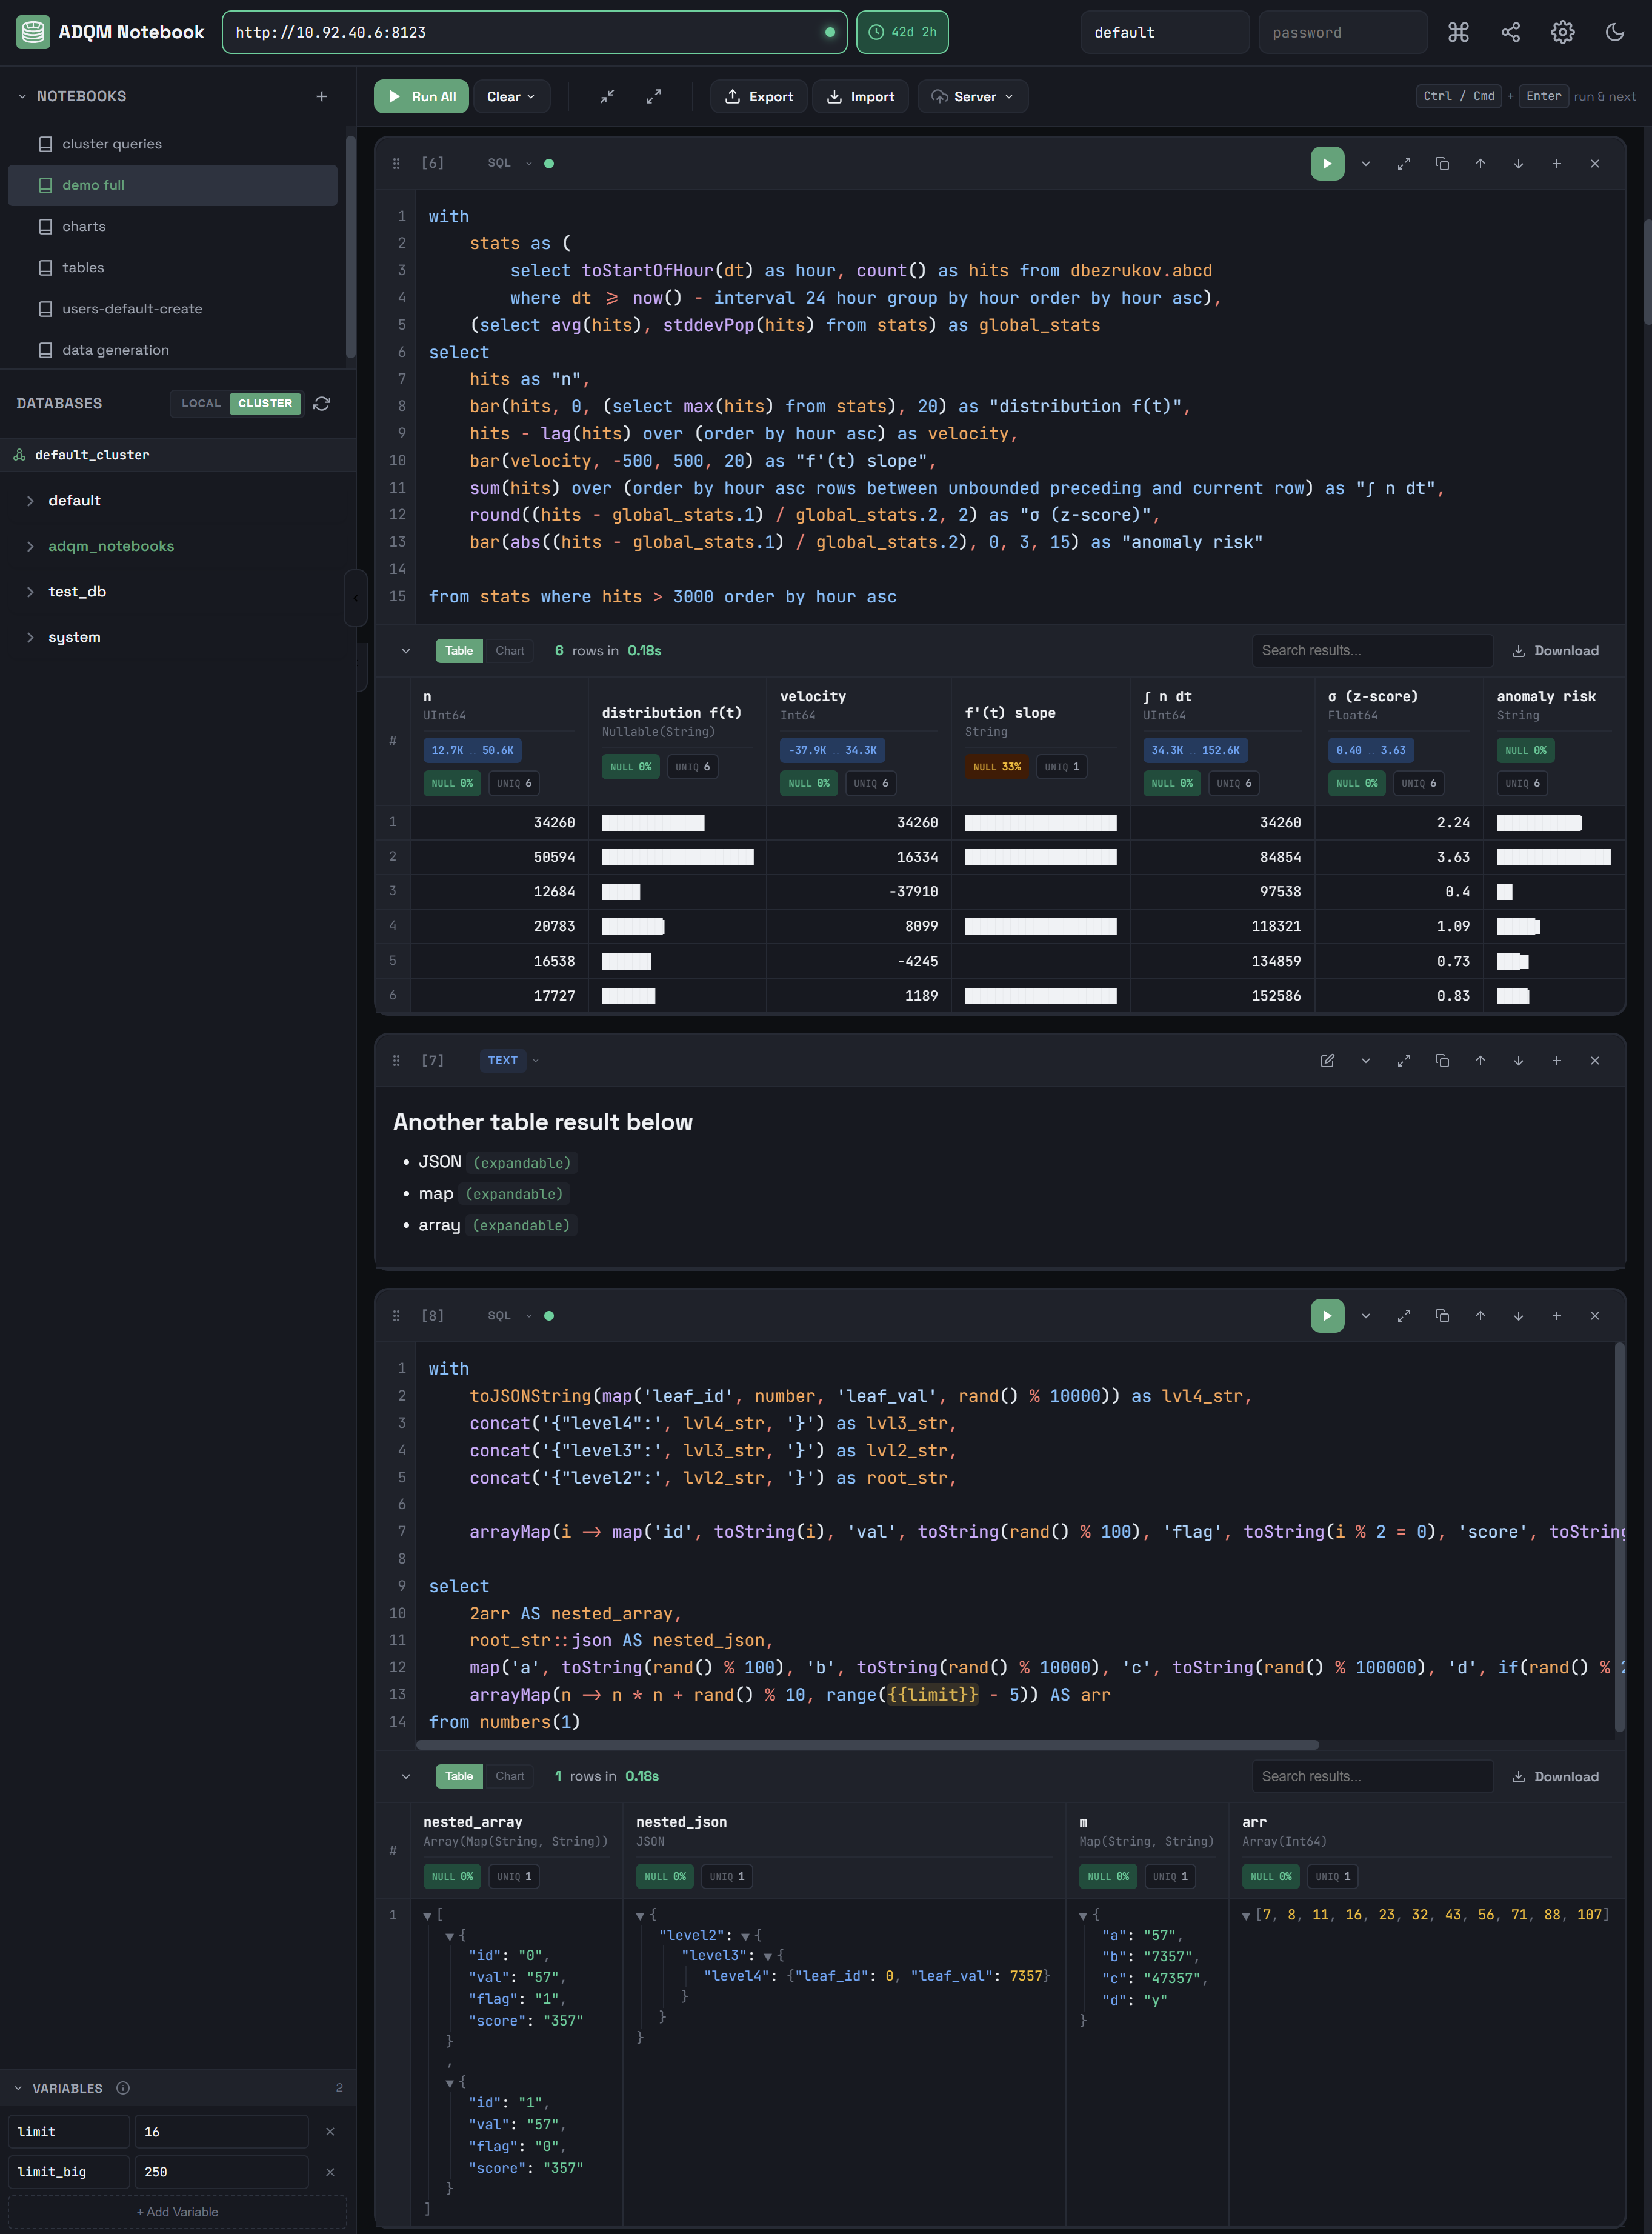
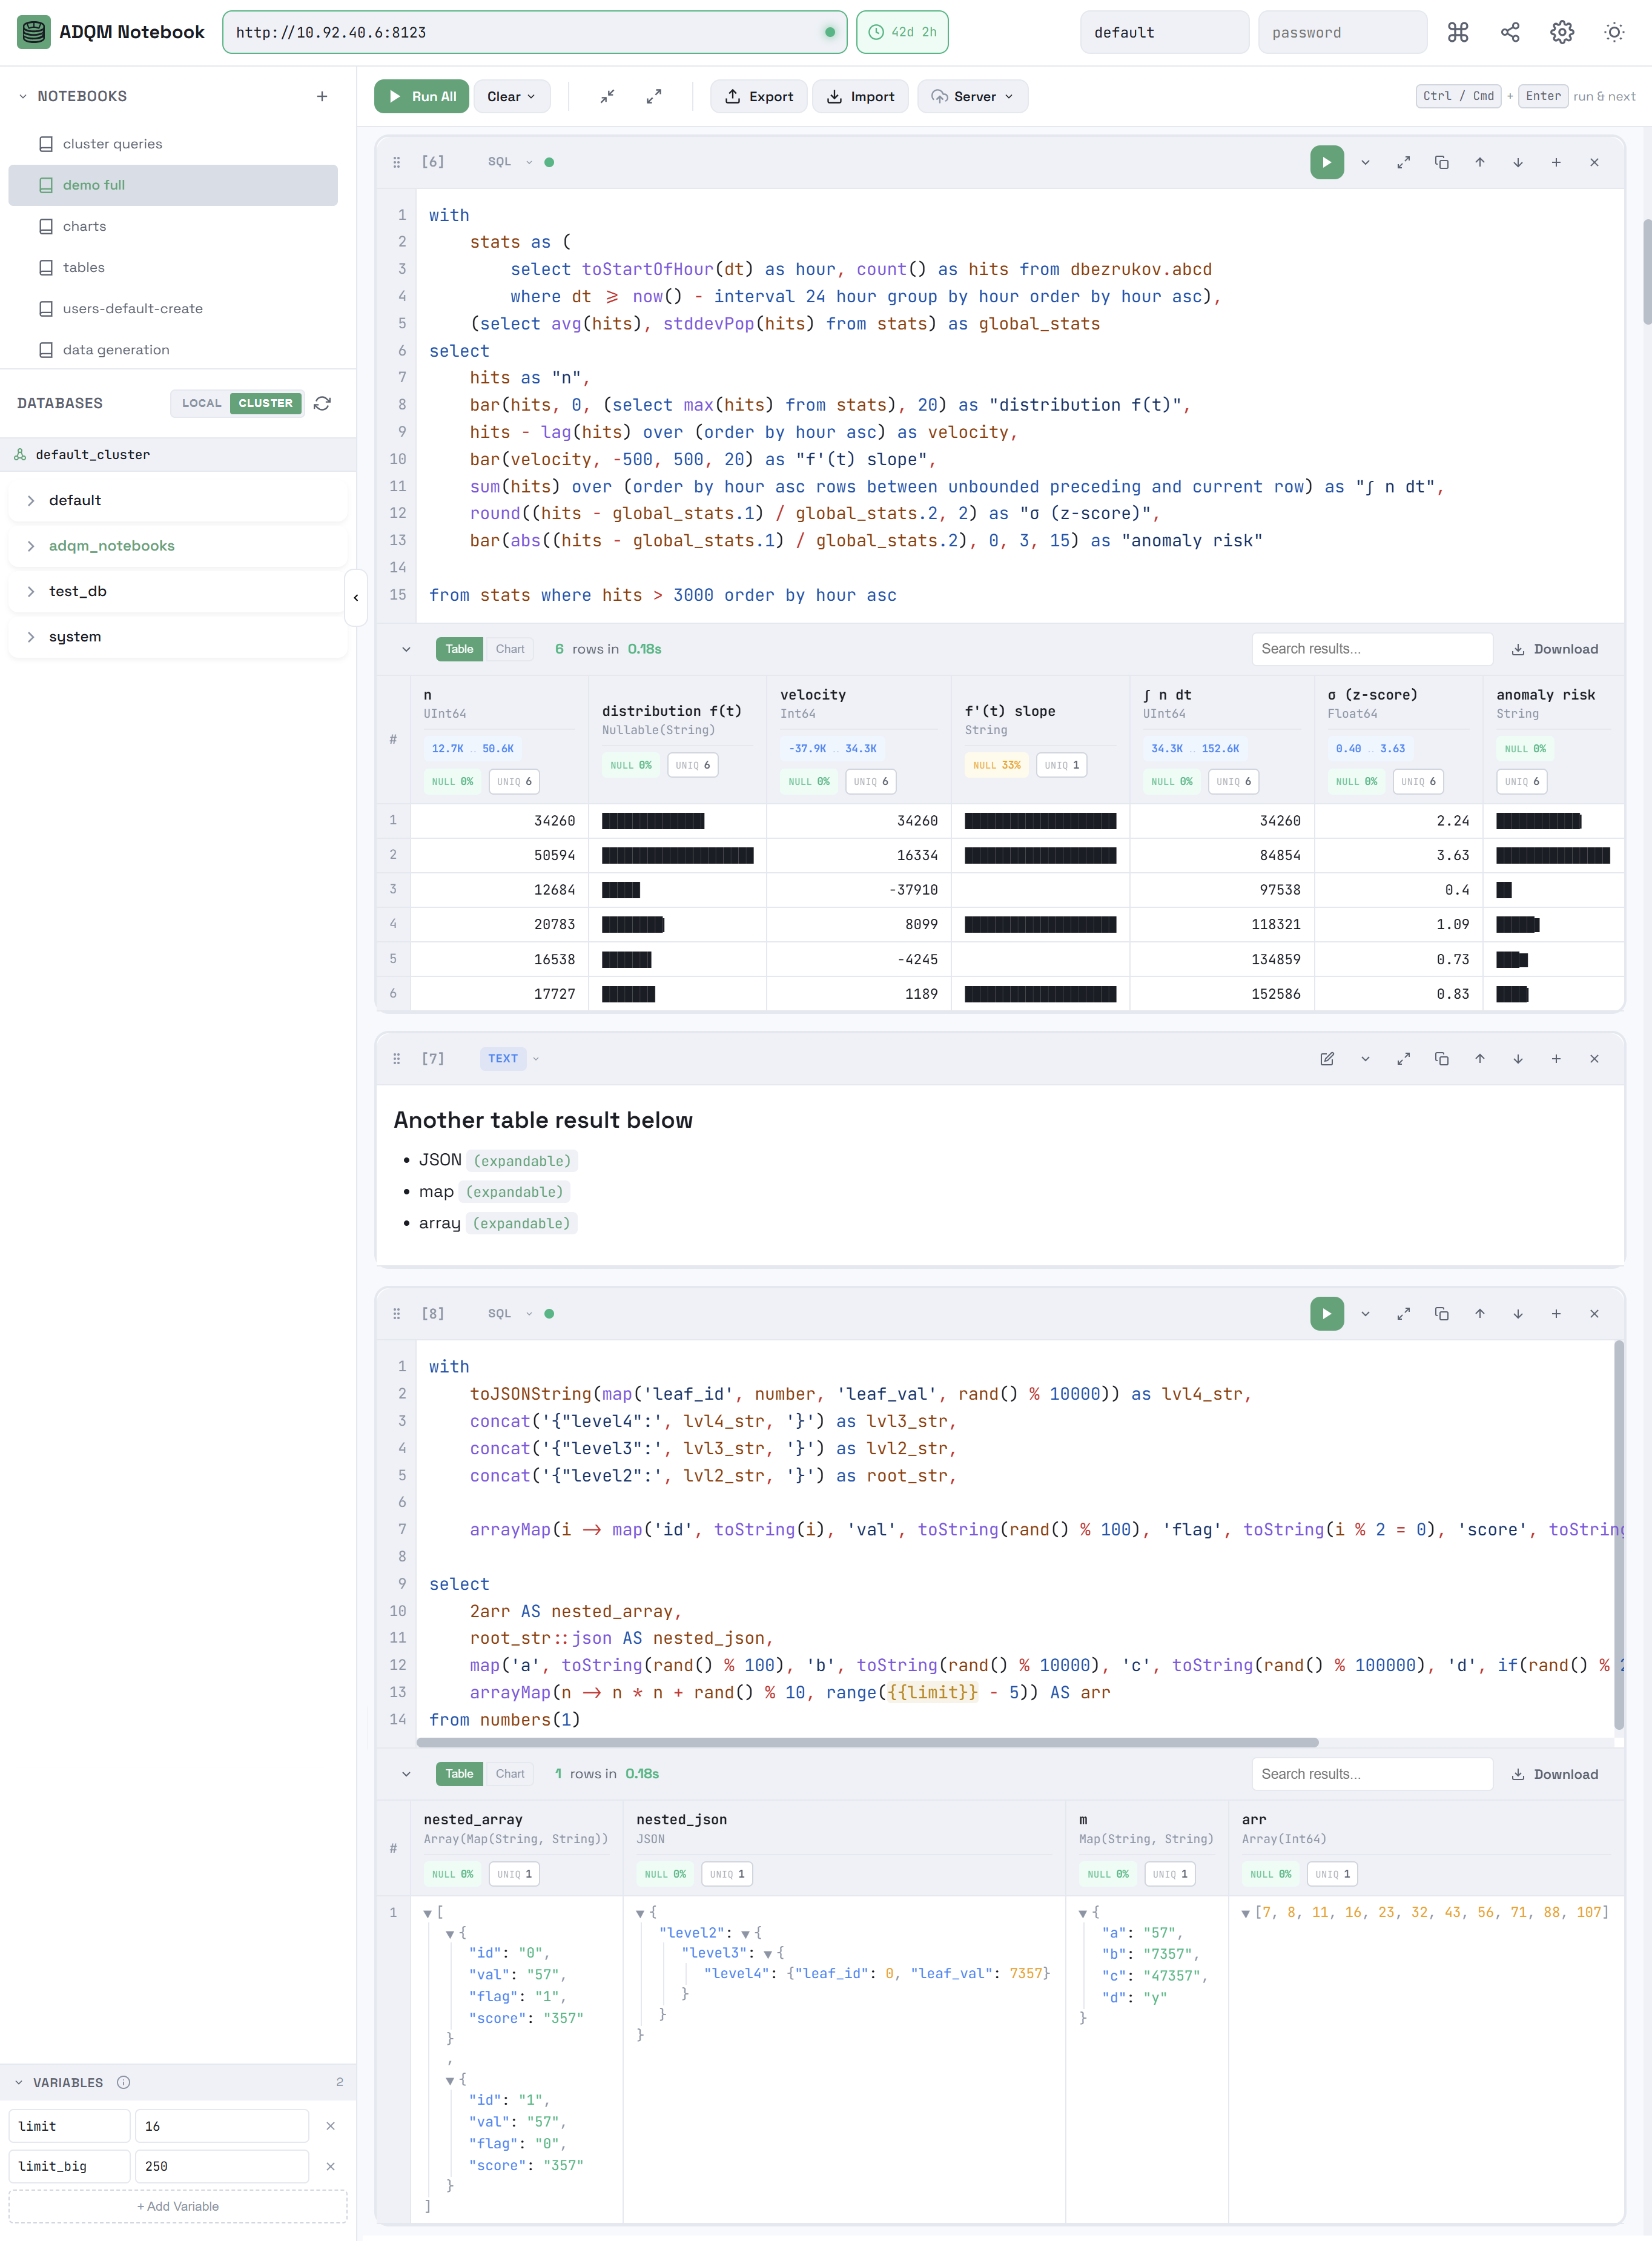
To open the ADQM Notebook interface, enter http://<adqm_host_IP>:8123/notebook in your browser, where <adqm_host_IP> is an IP address of an ADQM host. In the user and password input fields located at the top right of the interface, enter a username and password for connecting to the ClickHouse server (a user should be defined in the users section of the server’s users.xml configuration file). By default, the default username and empty password are used.
|
NOTE
The ADQM Notebook interface is only available in the Enterprise edition of ADQM (starting with the ADQM version 25.8.16.34.1.b1). |
Interface overview
Main objects that can be operated in the ADQM Notebook interface are notebooks and cells.
A notebook is a set of cells that can be of two types:
-
SQL cells for executing SQL queries with a wide range of features to edit SQL code, view query results as interactive data grids or graphs, and save results in various formats.
-
Text cells for notes and comments with markdown markup support for text formatting.
The ADQM Notebook interface provides the ability to create multiple notebooks and an option to automatically save them. Notebook snapshots can be exported to JSON files or saved in a separate database on the ClickHouse server, and then imported for sharing or backup.
On the left side of the interface, there are panels:
In the upper right corner of the interface, there are icons that provide access to the following functionality:
-
Keyboard shortcuts — to view keyboard shortcuts that allow performing various cell management commands in the interface;
-
Share notebook — to get a link to a notebook that you can share with other users;
-
Settings — to access interface settings;
-
/
Toggle theme — to switch between the dark and light interface themes.
Notebooks
Notebooks panel
The NOTEBOOKS panel is designed to manage notebooks in the ADQM Notebook interface.
To create a notebook, click the
New Notebook icon in the NOTEBOOKS panel header — a new notebook with one SQL cell will be created.
To change a notebook name, hover the mouse cursor over a notebook row, click the
Rename icon, and enter a new name in the edit field.
To move notebooks within the list, you can drag and drop them.
To delete a notebook, hover the mouse cursor over a notebook row on the NOTEBOOKS panel and click the
Delete icon.
Notebook workspace
The main workspace of a notebook includes:
-
Area for working with cells where you can create/edit/delete cells of the SQL and Text types.
-
Control panel with the following elements:
-
— to run queries in all SQL cells within a notebook.
-
Clear
— to expand the list of commands for clearing cells (Clear Results — deletes query results from all SQL cells; Clear All Cells — deletes all cells from a notebook, leaving one empty SQL cell).
-
Collapse all queries — to collapse all queries in a notebook.
-
Expand all queries — to expand all queries in a notebook.
-
Export — to export a notebook to a JSON file.
-
Import — to import a notebook from a JSON file.
-
Server
— to expand the list of commands for storing notebooks on the ClickHouse server.
-
Export/import notebooks in JSON format
To export the current notebook to a JSON file, click
Export on the notebook control panel.
A JSON file with the same name as a notebook will be created in the Downloads directory. This file will contain complete information on the state of the notebook:
-
cells, including queries with their execution statuses, results, and query statistics (if available at the time of export);
-
variables;
-
settings, including sorting state (column, direction), chart configurations (type, axes);
-
connection URL (but it will not be applied on import to share it to another host for convenience).
A password is not included.
To import a previously exported notebook, click
Import on the notebook control panel and select a JSON file.
An imported notebook will be added to the list within the NOTEBOOKS panel with a name in the <notebook_name> (dd-mm-yyyy hh:mm:ss) format, where <notebook_name> is a name of the JSON file corresponding to the notebook name, and dd-mm-yyyy hh:mm:ss is the date and time of import.
Store notebooks on the ClickHouse server
Notebooks created in the ADQM Notebook interface can be saved to a separate database on the ClickHouse server and loaded from there later. Additionally, auto synchronization with the server will be performed on connection — on successful connection, notebooks will be automatically loaded from the server storage, if available. When connecting with a different username, all local notebooks (not saved on the server) are cleared.
Save a notebook to the server
To save a notebook to the server, open the
Server list on the notebook control panel and select the
Save to Server command.
If a storage for notebooks has not been previously prepared, the first time you try to save a notebook to the server, you will be prompted to confirm the creation of the notebooks table in the adqm_notebooks database on the current ADQM host. In the future, notebooks will be saved to this table upon request.
To save all local notebooks to the server, run
Upload All Local….
Load a notebook from the server
To load a notebook from the ClickHouse server into the ADQM Notebook interface, click
Load from Server… and select the desired notebook in the window that opens.
If you select a notebook with the name of an existing notebook in the interface and the existing notebook differs from the one you are loading, a window opens where you can specify which version should be in the interface: local, server, or both (in this case, the notebook loaded from the server will be with the from server label).
Share notebook
To share a link to a notebook with other users, click
Share notebook on the ADQM Notebook control panel — the link to the current notebook will be copied to the clipboard.
A link embeds entire notebook state (cells, variables, chart configs) compressed in URL hash. Query results are not included in a shared link. ADQMDB server connection URL is included but credentials are not. Recipients need access to the same ADQMDB server to execute queries.
Databases panel
The DATABASES panel interactively displays information about ADQM databases and tables. If no logical cluster is defined in the ADQM configuration, the panel displays databases located on the current ADQM host.
If the configuration contains a definition of one or more clusters, the panel contains two tabs:
-
LOCAL — displays databases on the current ADQM host (including
information_schemaandsystem); -
CLUSTER — displays a hierarchical tree of the cluster’s databases and tables (the
information_schemadatabase is hidden). If the configuration defines a single cluster, it will be displayed on the tab by default. If multiple ADQM clusters are configured, the cluster to display on the DATABASES panel can be selected from the drop-down list.
Clicking the
Refresh icon updates information on databases and tables.
To expand a database and view the tables it contains, click a database row. The row of each table displays the table size, and a color indicator allows you to visually compare the table size with the largest table in the database. On the CLUSTER tab, it also displays the number of cluster hosts where the table data is located.
When you hover over a row that corresponds to a data table:
-
You can view additional information about the table in a tooltip: table engine, total number of rows, total size, and data distribution across hosts (on the CLUSTER tab).
General information about a table on the CLUSTER tab
General information about a table on the CLUSTER tab -
Using the
Insert SELECT query icon, you can automatically insert a query for selecting 100 rows from the table into the selected SQL cell (or into a new one if no cell is selected):
-
on the LOCAL tab:
SELECT * FROM "<database_name>"."<table_name>" LIMIT 100; -
on the CLUSTER tab:
SELECT * FROM clusterAllReplicas('<cluster_name>', '<table_name>', '<table_name>') LIMIT 100.
Insert a query to read data from a table
-
To expand a table and view its columns, click a table row. For each column, its name and data type is displayed. When you hover over a row corresponding to a table column, the
Insert column name icon appears. Clicking this icon inserts the column name into the query editor of the selected SQL cell (or into a new cell if no one is selected).
To expand the structure of all tables within a database, in the database row, click the
Expand all tables icon, which becomes visible when you hover the mouse cursor over the database on the DATABASES panel (if all tables are already expanded, the
Collapse all tables icon in the database row allows collapsing them).
SQL cells
A new SQL cell contains the SQL query editor and control panel. After the query is executed, query execution statistics (QUERY STATS) and query results panel (or the Error panel, if an error occurred during the query execution) are added to the cell.
When created, a new notebook contains one SQL cell.
Query text
The SQL query editor provides the following functionality:
-
SQL syntax highlighting.
-
Line numbering (can be enabled/disabled in the settings, see below). Clicking a line number selects the entire line.
-
Automatic increasing/decreasing the editor based on the size of the SQL code. The editor can also be resized manually by dragging its bottom border. Double-clicking the resize handle at the bottom of the editor returns it to the size determined automatically depending on the size of the query text.
For the query text editor in an SQL cell, you can configure the following parameters (to open the window with settings, click the
Settings icon in the upper right corner of the interface):
-
Font Size — font size (the setting does not affect text cells);
-
Word Wrap — enables/disables line wrapping (in text cells, line wrapping is always enabled, regardless of this setting);
-
Line Numbers — enables/disables line numbering (in text cells, row numbering can only be enabled for editing mode);
-
Max Rows per Query — maximum number of rows in a query. Possible values:
100,500,1000,5000,10000. Default:1000.
Variables in queries
On the VARIABLES panel, you can add variables as key/value pairs. In a query, you can reference a variable by a key using the {{variable_name}} format — this entry will be automatically replaced with the variable’s value before submitting the query to be executed. Variables use case-insensitive matching (for example, {{MyVar}}, {{myvar}}, {{MYVAR}} all match the same variable).
The VARIABLES panel header displays a count of added variables on the right. If you add a variable with a duplicate name, the corresponding fields are highlighted in red, the variable count is not incremented, and the value of the duplicate variable is ignored.
Control panel
The SQL cell control panel, located above the query text editor, contains the following elements:
-
Drag to reorder — drag and drop to move a cell relative to others within a notebook.
-
[n] — sequence number of a cell in a notebook.
-
Query execution status:
— query has not been executed yet;
— query is currently being executed;
— query has been executed successfully;
— query execution has been failed.
For a query that has been executed (successfully or with an error), the execution time is also shown next to the status indicator.
-
Run — start query execution.
-
Toggle query — collapse/expand the query code editor (if the editor is collapsed, the beginning of the query text is displayed within the control panel).
-
Fullscreen — expand an SQL cell to full screen (or collapse it).
-
Copy query — copy query text.
-
Move up — move a cell one position above the previous one.
-
Move down — move a cell one position below the next one.
-
Add cell below — create a new cell of the same type below.
-
Delete cell — delete a cell.
Query execution
To run a query, do one of the following:
-
Click
Run on the control panel of the corresponding SQL cell. While a query is running, the Run button visually changes to Stop — clicking it cancels the HTTP query execution.
-
Click an SQL cell to select it (a selected cell is highlighted in green) and press
CTRL+ENTER(orCMD+ENTER).
In the ADQM Notebook interface, multiple SQL cells can execute their queries simultaneously when running individually. The command executes queries in cells sequentially from top to bottom waiting for each query to complete before running the next one.
Query results panel
After executing a query, the results are displayed on the results panel, which contains the Table and Chart tabs, where you can view the resulting data as a grid or chart, respectively. The results panel also contains:
-
general information on the query results (number of received data rows and execution time);
-
Search results… field, which allows you to filter data in the result set in real time by any column — the panel will show only the values that match the specified filter;
-
Download icon, which you can use to save the query results in one of the supported formats (CSV, TSV, JSON, JSONLines, Parquet).
CSV, TSV, JSON, and JSONLines are generated on the client side from cached results. Parquet re-runs the entire query on the ADQMDB server because it requires server-side format generation. This means:
-
A query may return different results if data changed.
-
Additional server load is possible.
-
The results panel can be collapsed/expanded with the icon
in the upper left corner.
To clear the query results of all SQL cells in a notebook, open the Clear context menu in the notebook control panel and select Clear Results.
Error panel
If an error occurs during query execution, a corresponding message is displayed on the Error panel (instead of the results panel).
Results table
After executing a query, an SQL cell displays the resulting data set on the Table tab as an interactive data grid, which supports the following features for easy viewing the received data:
-
Displaying column names and data types in headers.
-
Sorting data by clicking any column header.
-
Data search — filtering values in the result set by any column in real time using the Search results… field.
-
Smart formatting:
-
numeric columns are aligned to the right, text columns are aligned to the left;
-
URLs are automatically detected and converted into clickable links;
-
NULL values are visually different from others;
-
JSON data is formatted;
-
arrays and JSON objects can be collapsed/expanded (the default behavior is controlled by the Expand JSON/Arrays by default option in the interface settings — this option affects the display of the results of newly executed queries; already displayed results will not be collapsed/expanded when the option is switched);
-
summary information on columns as labels in headers: the proportion of NULL values in a column (if
0%— a green label, if more than0%— a red label), the number of unique values in a column, the range of values in numeric and DateTime columns.
-
|
NOTE
The maximum number of cells ( |
Query results chart
You can also view the numerical results of your queries as charts. To do this, open the Chart tab on the results panel and configure the following parameters to build a chart:
-
TYPE — chart type (
Line,
Area, or
Bar);
-
X-AXIS — a column whose values will be used for labels on the X axis;
-
Y-AXIS — one or more columns whose values will be used for labels on the Y axis.
On both axes, a chart is built between the minimum and maximum values from the query results.
Query execution statistics
If query logging is enabled in ADQM (the query_log parameter is activated), an SQL cell displays the QUERY STATS panel with the following information about the query execution:
-
Duration — query execution time;
-
Read — total number of rows read from all tables and table functions involved in a query;
-
Scanned — total number of bytes read from all tables and table functions involved in a query;
-
Memory — memory used by a query;
-
Threads — peak number of threads used simultaneously during query execution;
-
Node Breakdown — information about query execution on each host (when a query is executed in an ADQM cluster);
-
Details — detailed information including: query kind (
SELECT,INSERT, etc.), number of rows written (for write queries), bytes written, number of rows in query results, size of query results in bytes, and names of databases/tables/columns accessed by the query.
Statistics are displayed automatically after executing a query if the Show Query Statistics option is enabled in the ADQM Notebook interface settings. If this option is disabled (by default), click Show Query Stats on the panel to view statistics.
To select a cluster for receiving query statistics, use the Cluster for Statistics setting. If no clusters are defined in the ADQM configuration, this setting is fixed at Single node.
Text cells
You can use text cells for various notes and comments in your notebooks.
Use markdown markup to format text. Supported markdown syntax:
-
# H1,## H2,### H3— headers; -
**text**or__text__— bold text; -
*text*or_text_— italic text; -
***text***or___text___— bold and italic text; -
`code`— inline code; -
```multiline code```— multiline code blocks; -
- itemor1. item— lists; -
> quote— blockquotes; -
[text](url)— links; -
---— horizontal rule.
Text cells contain the same control elements as SQL cells, except for those related to query execution (the button to run a query, query execution status and time indicators).
Manage cells
Create a cell
You can add a new cell in one of the following ways:
-
Click Add SQL Cell in a notebook workspace — a new SQL cell will be created. You can also select a cell type from the context menu.
Add a new cell to a notebook
Add a new cell to a notebook -
Click the
Add cell below icon on the control panel of an existing cell — a new cell of the same type will be added below this cell.
Create a new cell from an existing one
Copy a cell contents
To copy a query from an SQL cell or text with applied markdown from a text cell, use the icon
on the cell control panel.
Change a cell type
Each cell has a drop-down that allows converting between it types in-place:
-
SQL → Text: query code moves to text content;
-
Text → SQL: text content moves to query code, syntax highlighting is initialized.
Move a cell
You can move a cell in the following ways:
-
Use the
Move up and
Move down icons on the cell control panel.
Icons for moving a cell up/down
Icons for moving a cell up/down -
Click the
Drag to reorder icon and move a cell to a new location using the drag-and-drop mechanism.
Drag and drop a cell
Delete a cell
To delete a text or SQL cell, click the
Delete cell icon on the cell control panel.
Selecting Clear All Cells from the Clear context menu on notebook control panel deletes all cells within the notebook, leaving only one empty SQL cell.
Keyboard shortcuts
The ADQM Notebook interface also provides a set of keyboard shortcuts for managing cells in a notebook. To view them, click the
Keyboard shortcuts icon in the upper right corner of the interface.
Settings
To open the ADQM Notebook interface settings, click the
Settings icon in the upper right corner of the interface.
The settings include:
-
parameters allowing you to configure cell editors;
-
Auto-save Notebook — specifies whether notebooks should be automatically saved to localStorage on changes;
-
Expand JSON/Arrays by default — specifies whether JSON objects and arrays should be collapsed in query results by default;
-
parameters that control how to display query execution statistics.