Monitoring service
The Monitoring service (available starting with ADQM 23.8.2.7) deploys the Prometheus server inside ADQM to collect and store ADQM cluster monitoring metrics, and also supports the ability to use the Grafana web application for visualization and analysis of information. This article describes steps required to add this service to an ADQM cluster.
Overview
When adding the Monitoring service to ADQM, you can install the node exporter on all or selected hosts of your cluster. It is a monitoring agent that reads host system metrics that Prometheus collects. Prometheus can also collect metrics from ADQM services (ClickHouse, ZooKeeper, ClickHouse Keeper, Chproxy). These metrics will be available in the Prometheus format on the ports and endpoints specified in the Metrics section of the service configurations. You can also use the Prometheus and Grafana web interfaces to view and analyze data that the monitoring service collects.
|
NOTE
|
Step 1. Add the service
-
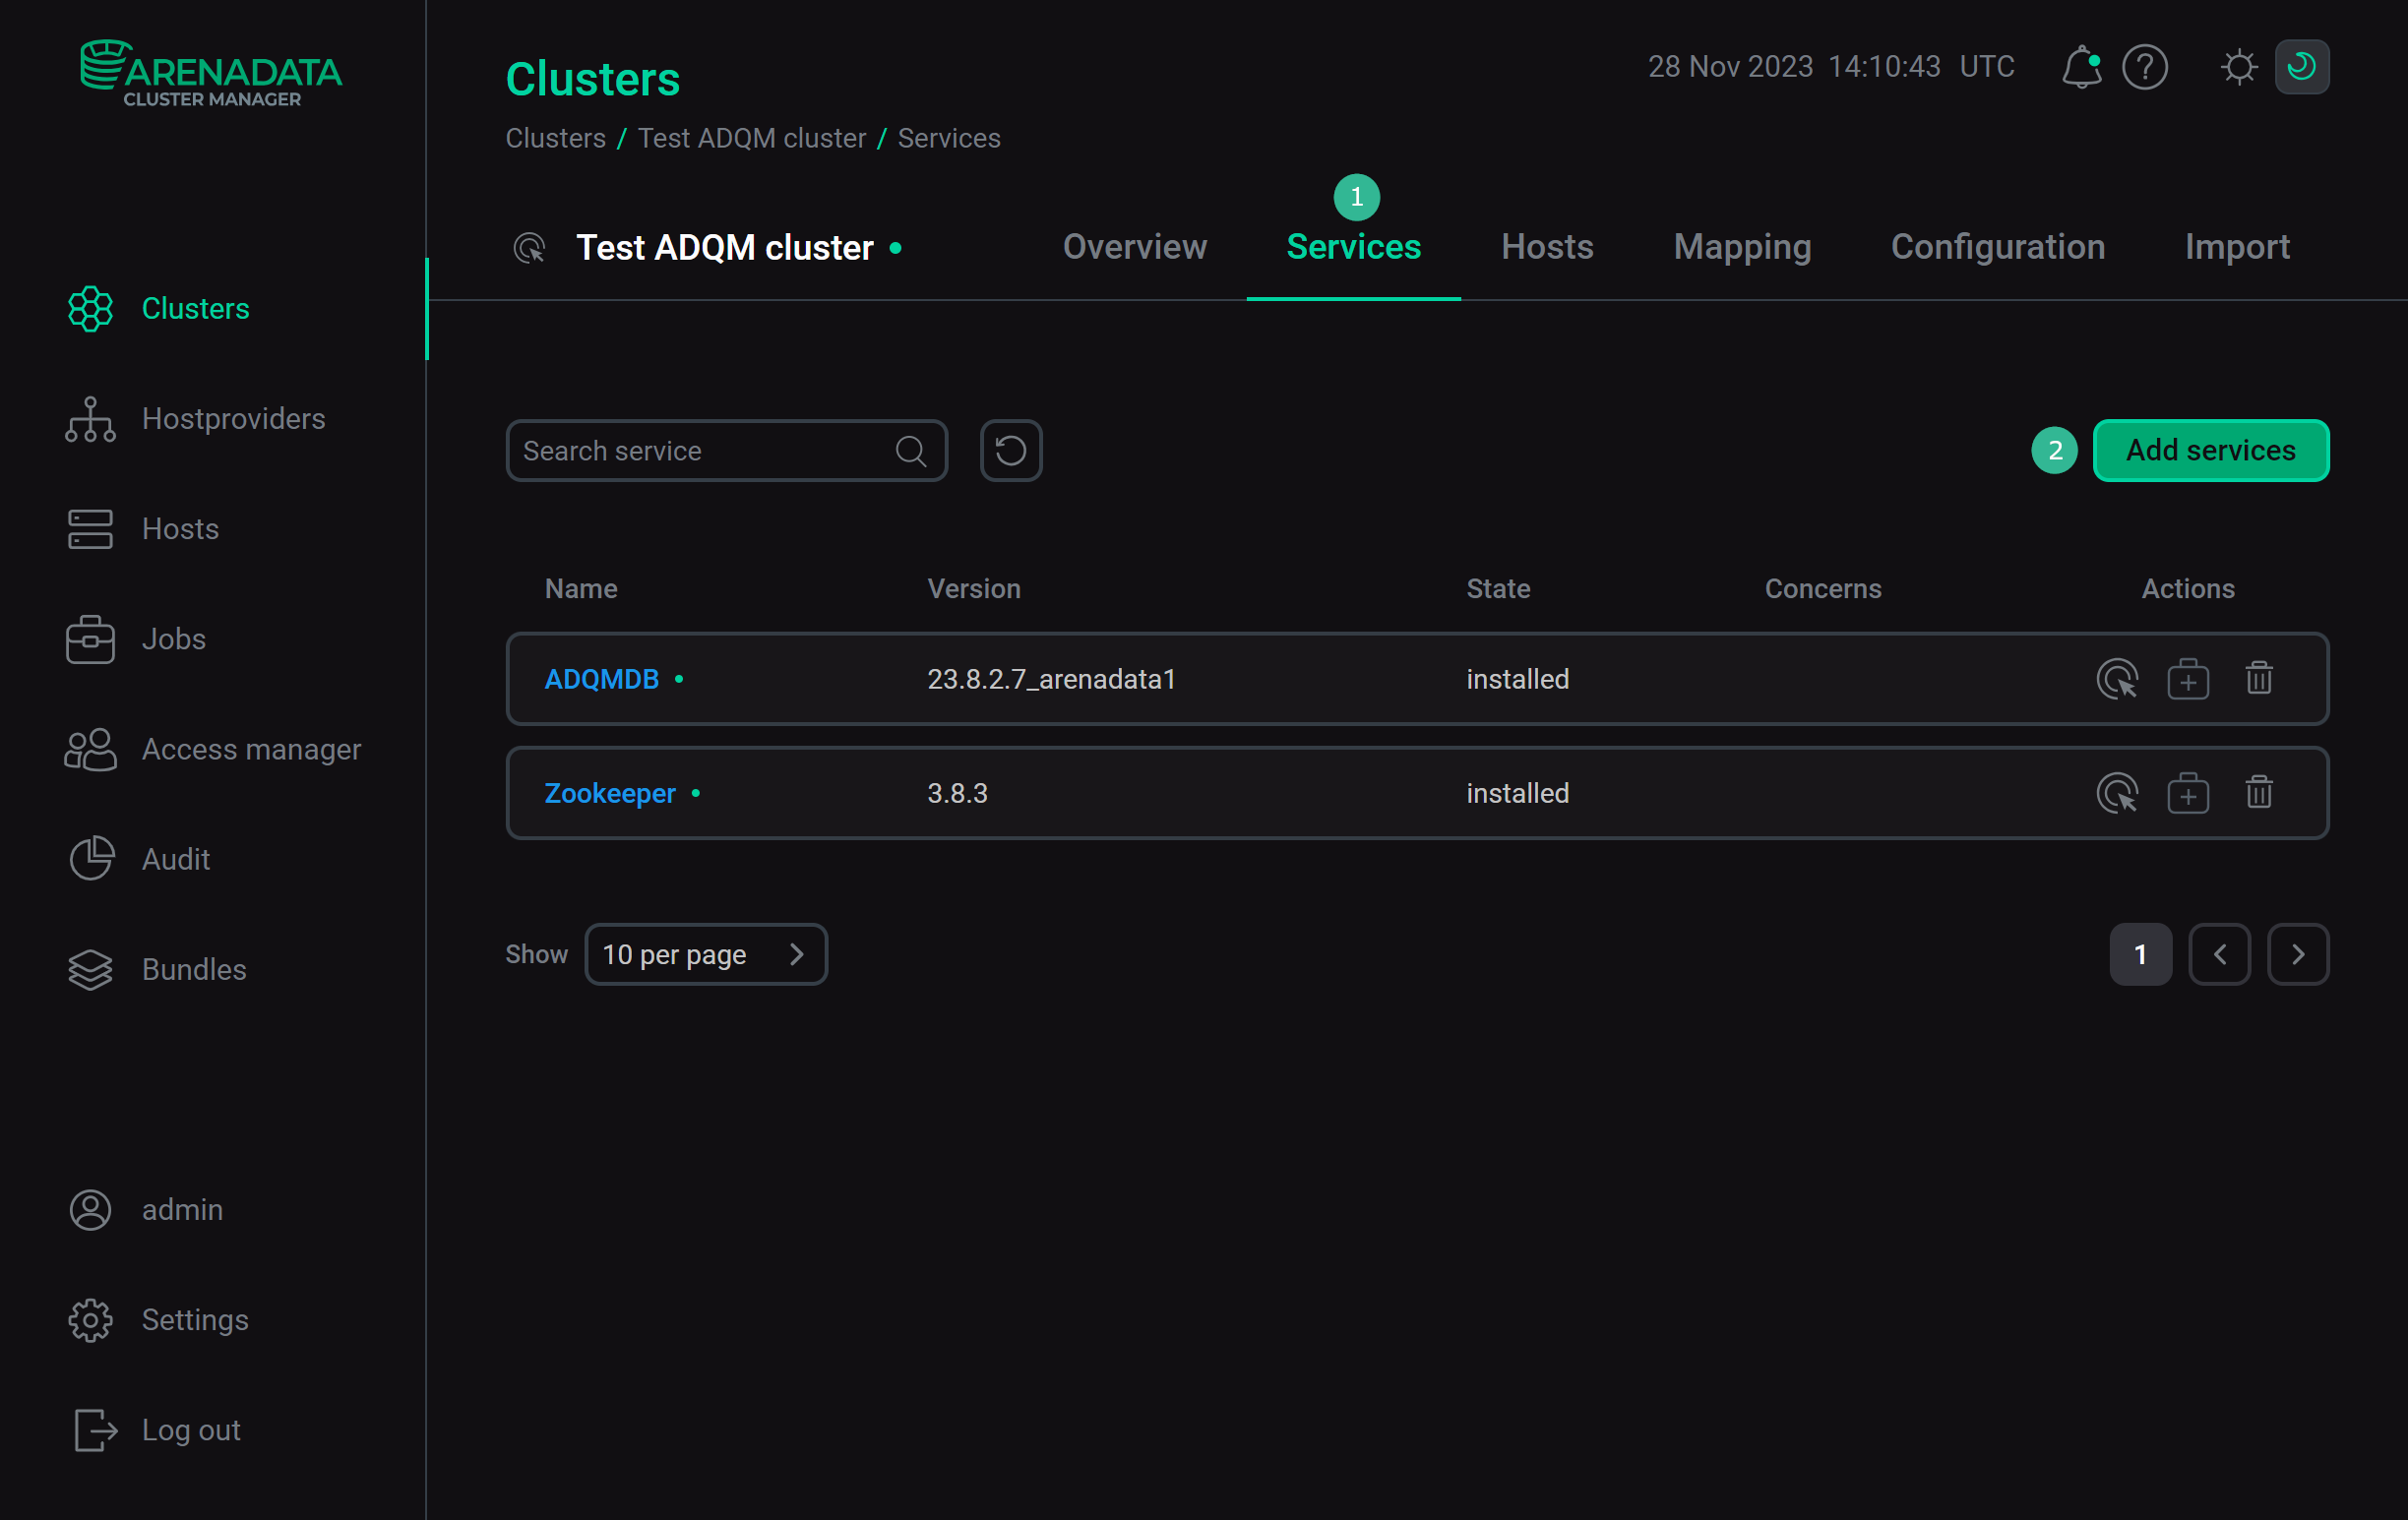
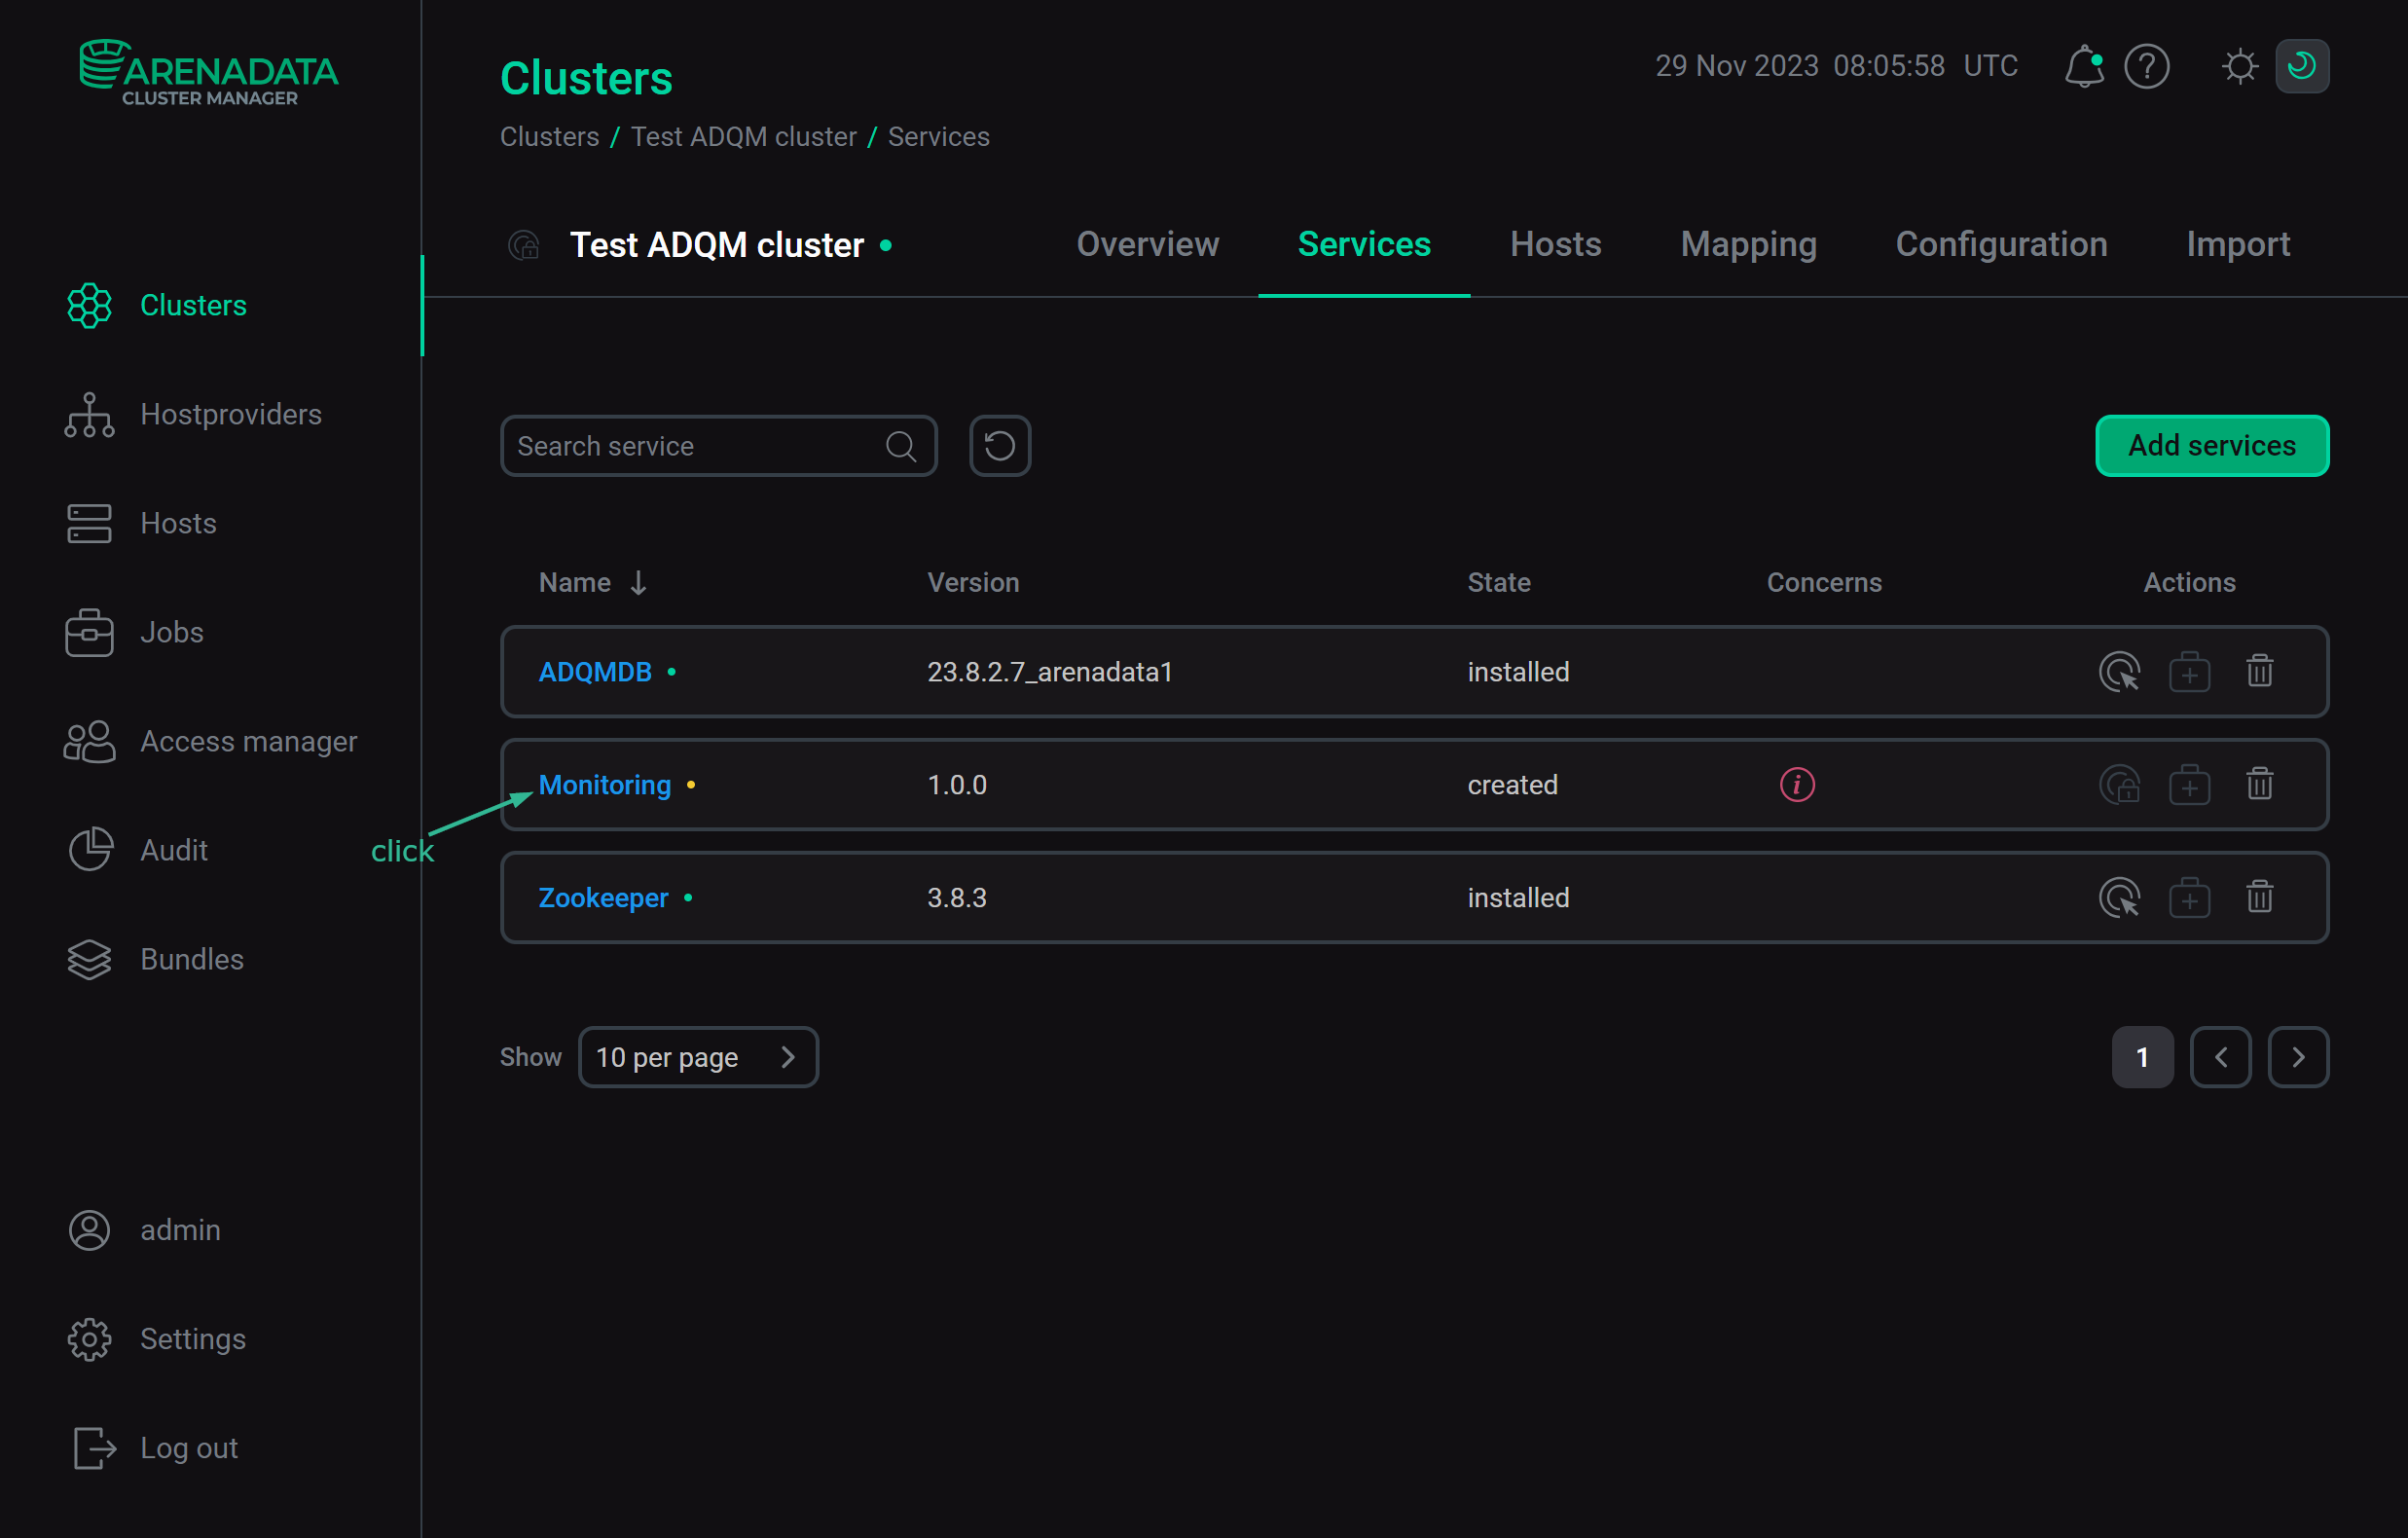
In the ADCM interface, open the Clusters page and click your ADQM cluster name. On the cluster page that opens, switch to the Services tab and click Add services.
 Switch to adding services
 -
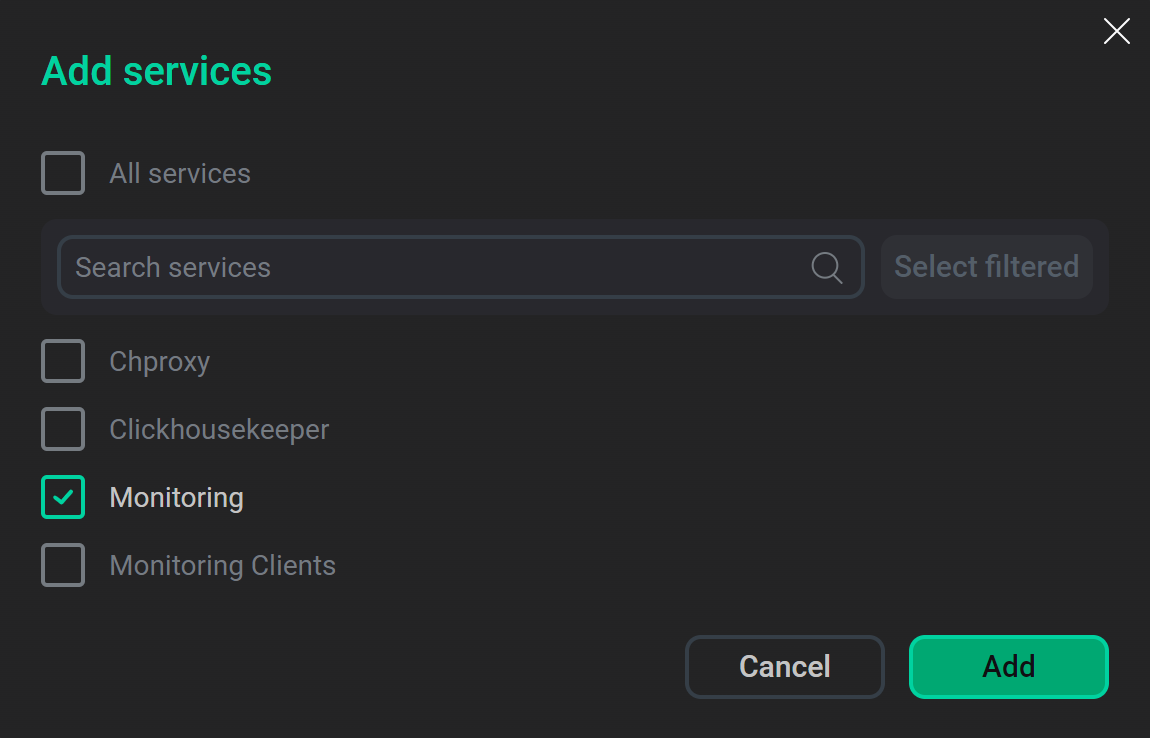
In the opened dialog, select the Monitoring service and click Add.
 Select the service
As a result, the added service is displayed on the Services tab.
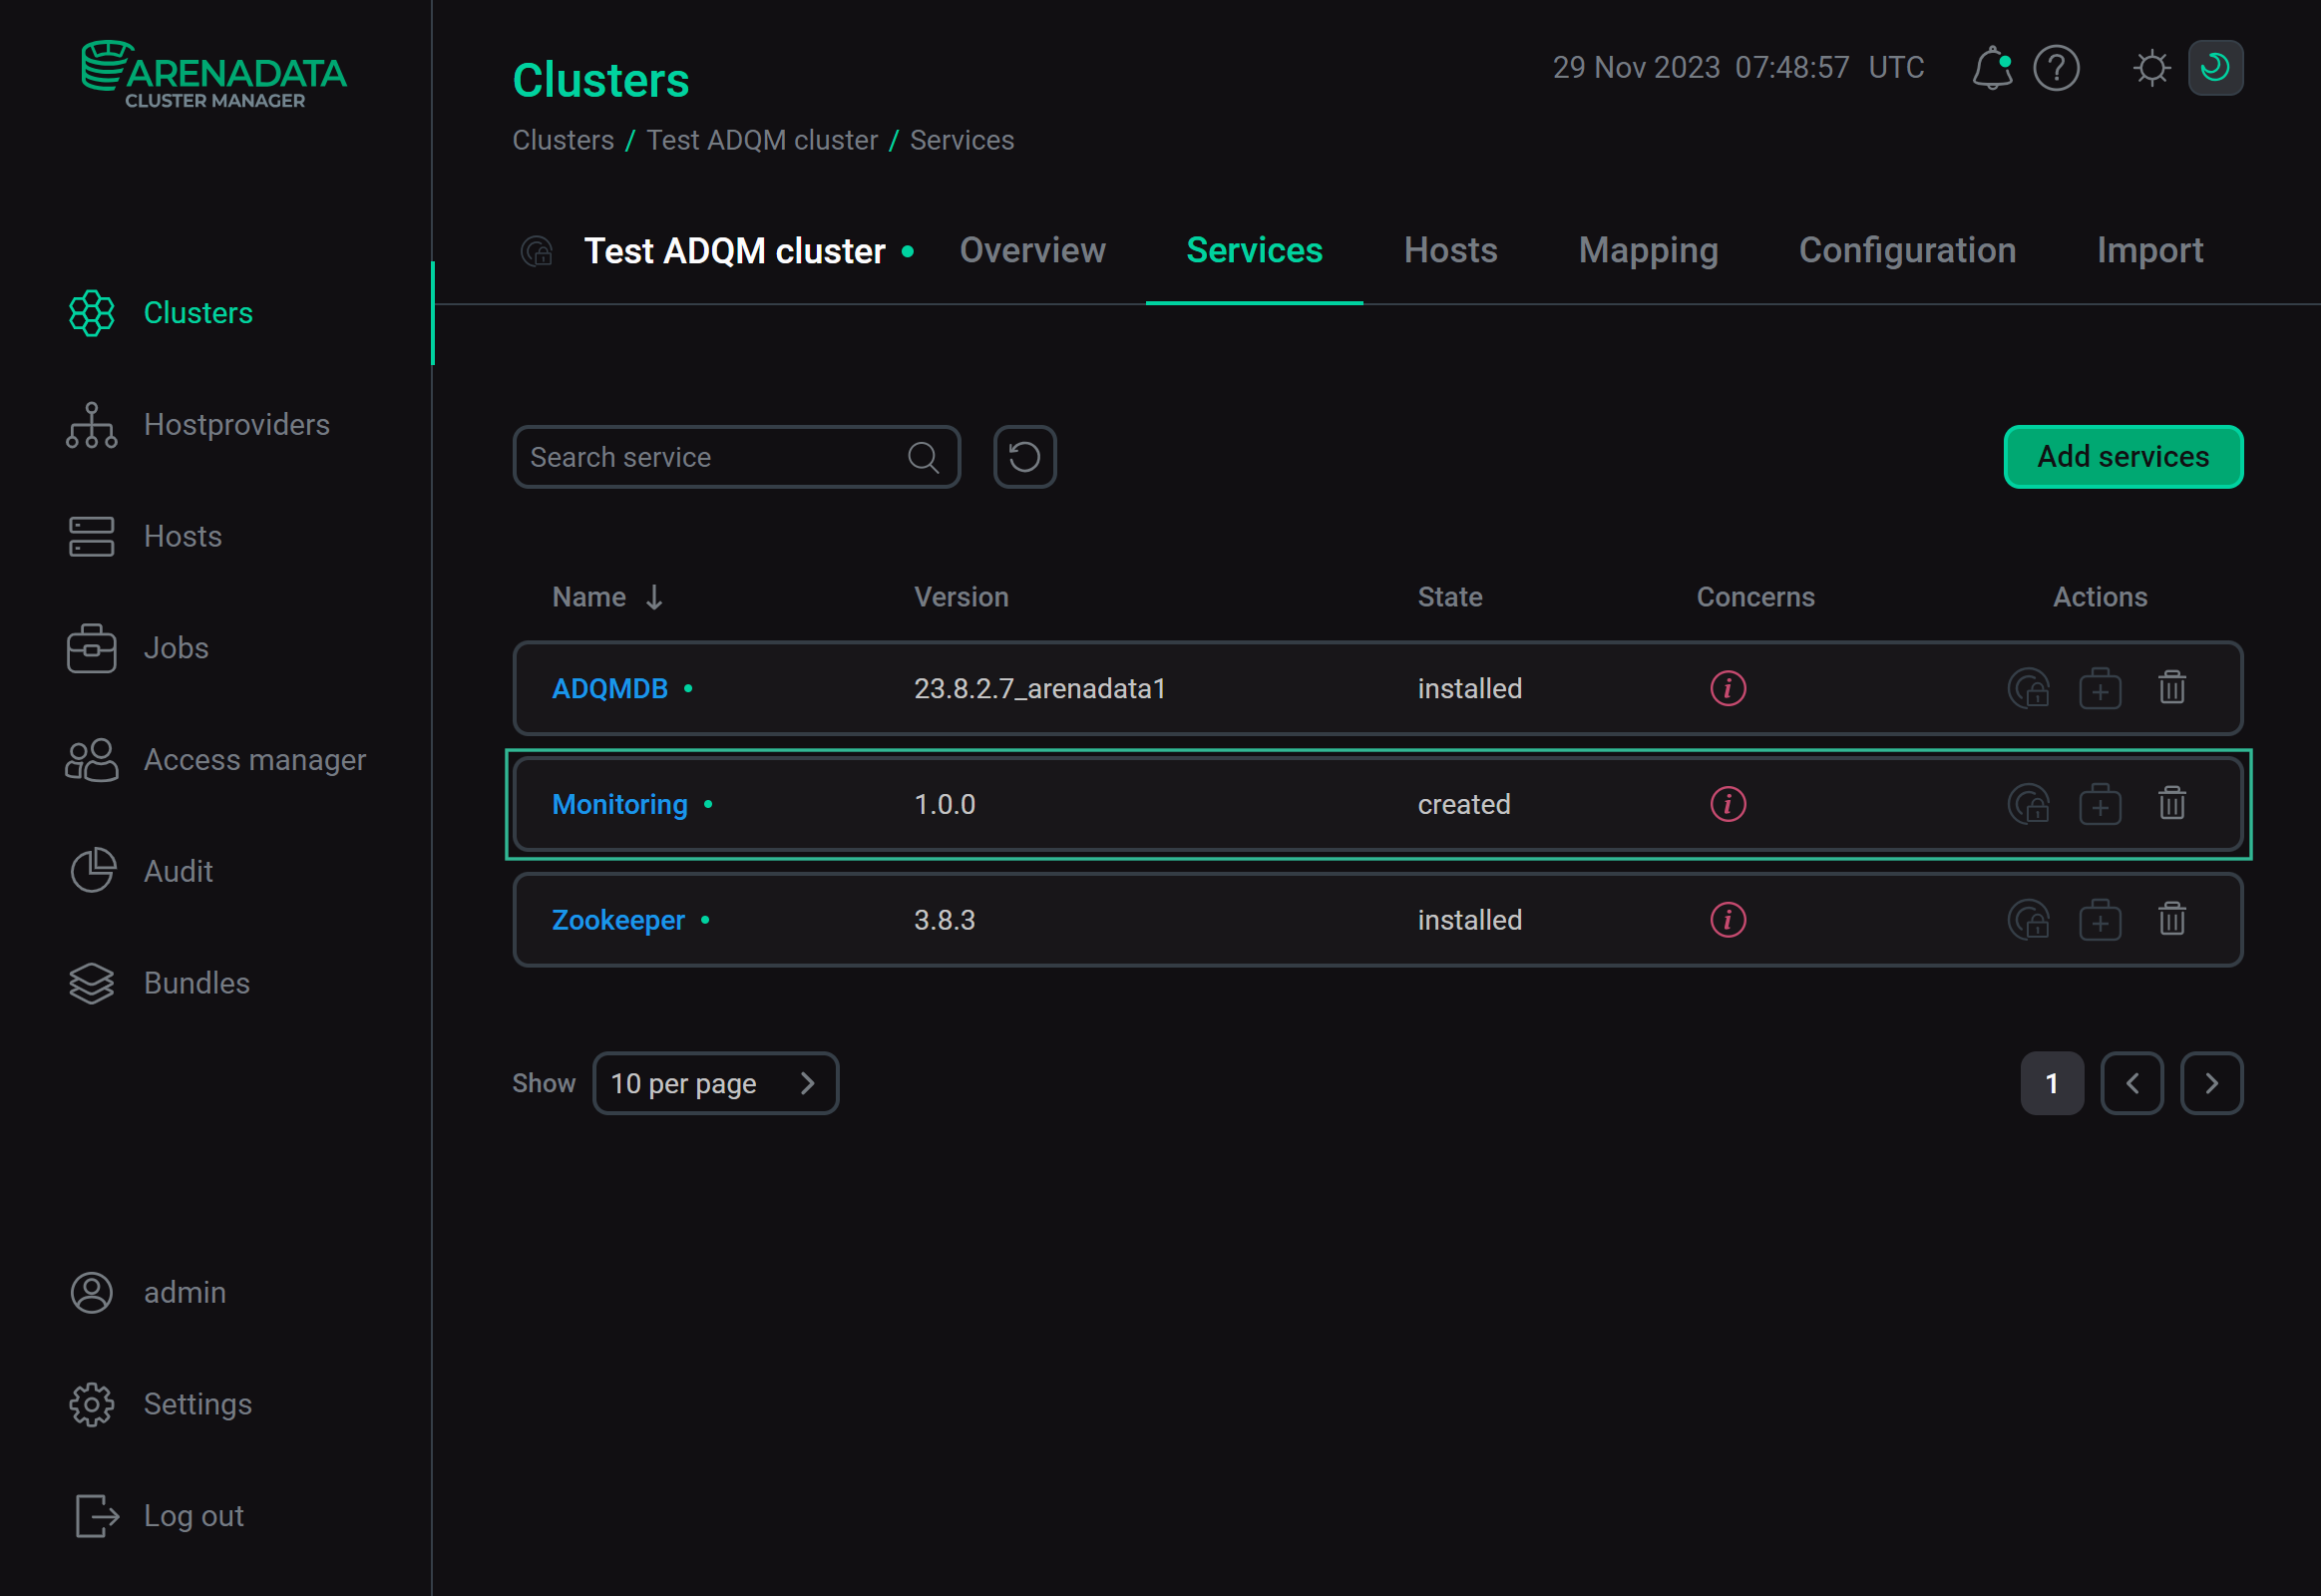 The result of successful adding the service to the cluster
Step 2. Add components
-
On the cluster page, open the Mapping tab to proceed to mapping service components to cluster hosts.
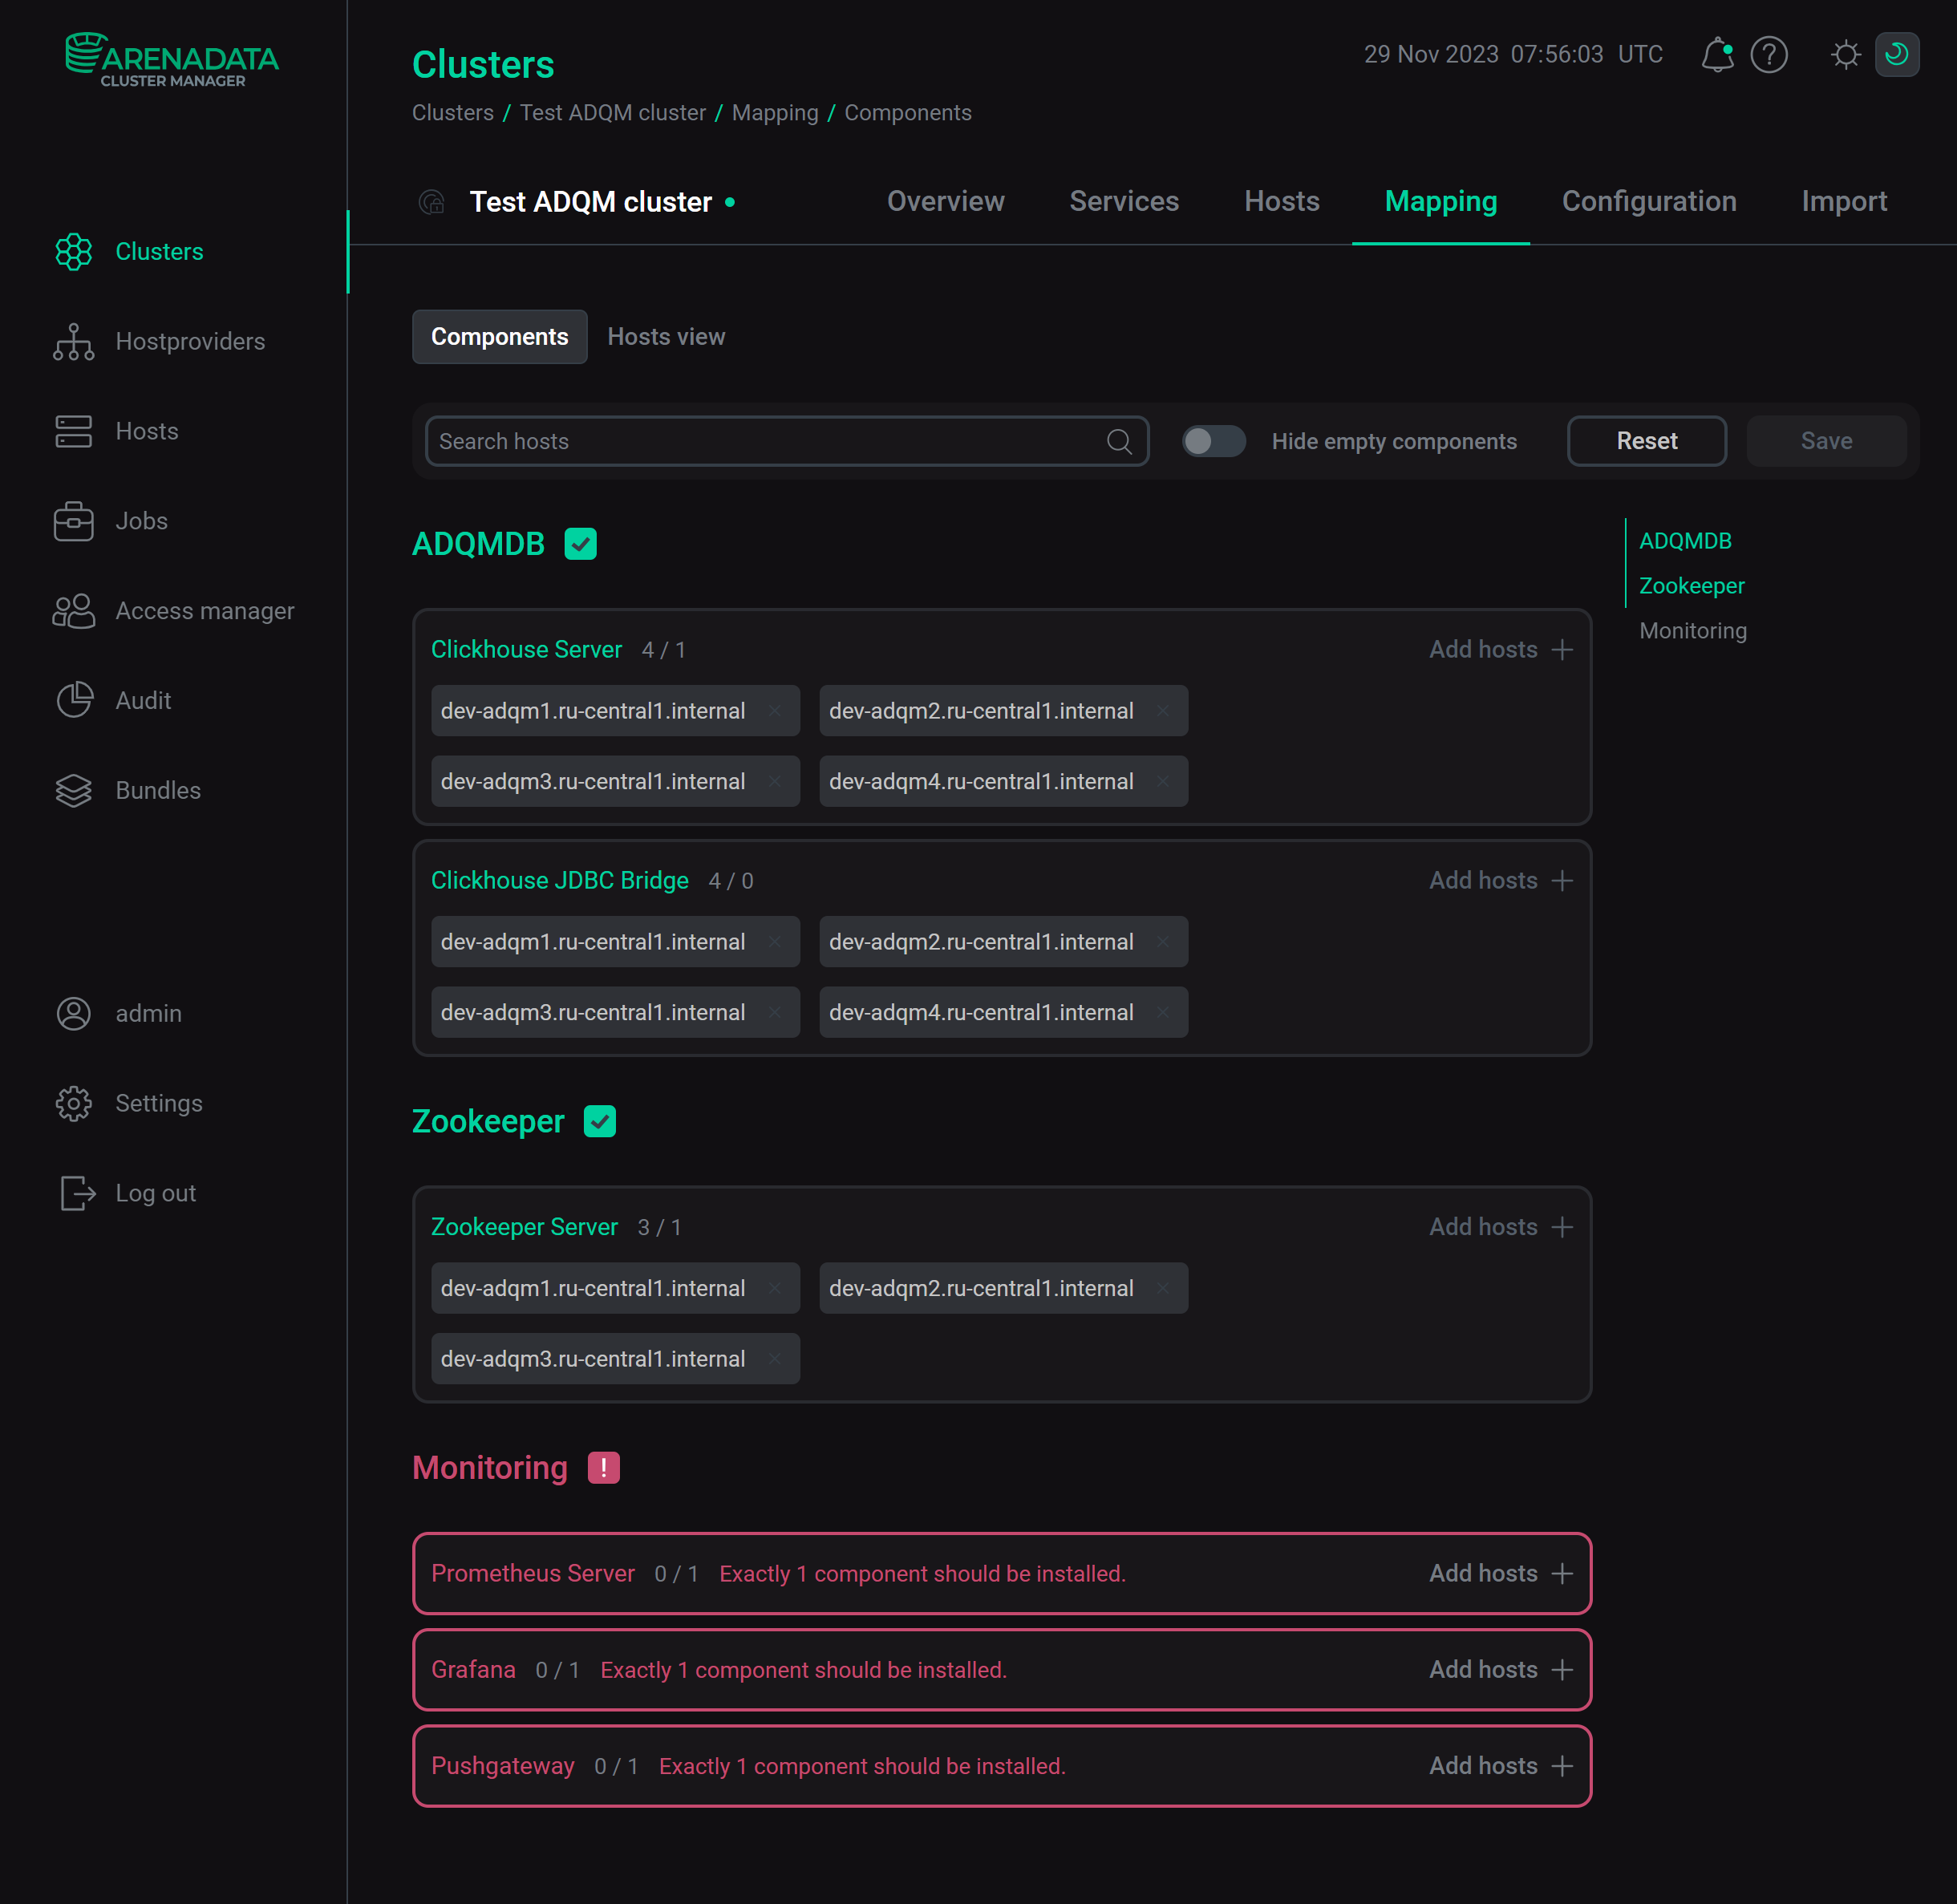 Switch to mapping service components
Monitoring service components Component Description Prometheus Server
Stores and allows requesting all metrics for an ADQM cluster
Grafana
Visualizes ADQM metrics as graphs and charts organized into dashboards
Pushgateway
Receives static metrics and sends them to Prometheus. In ADQM, it is used to pass a cluster structure to Prometheus
Node Exporter
Collects system metrics and sends them to Prometheus
-
Assign hosts to components of the Monitoring service — click Add hosts and select the desired hosts in the pop-up window.
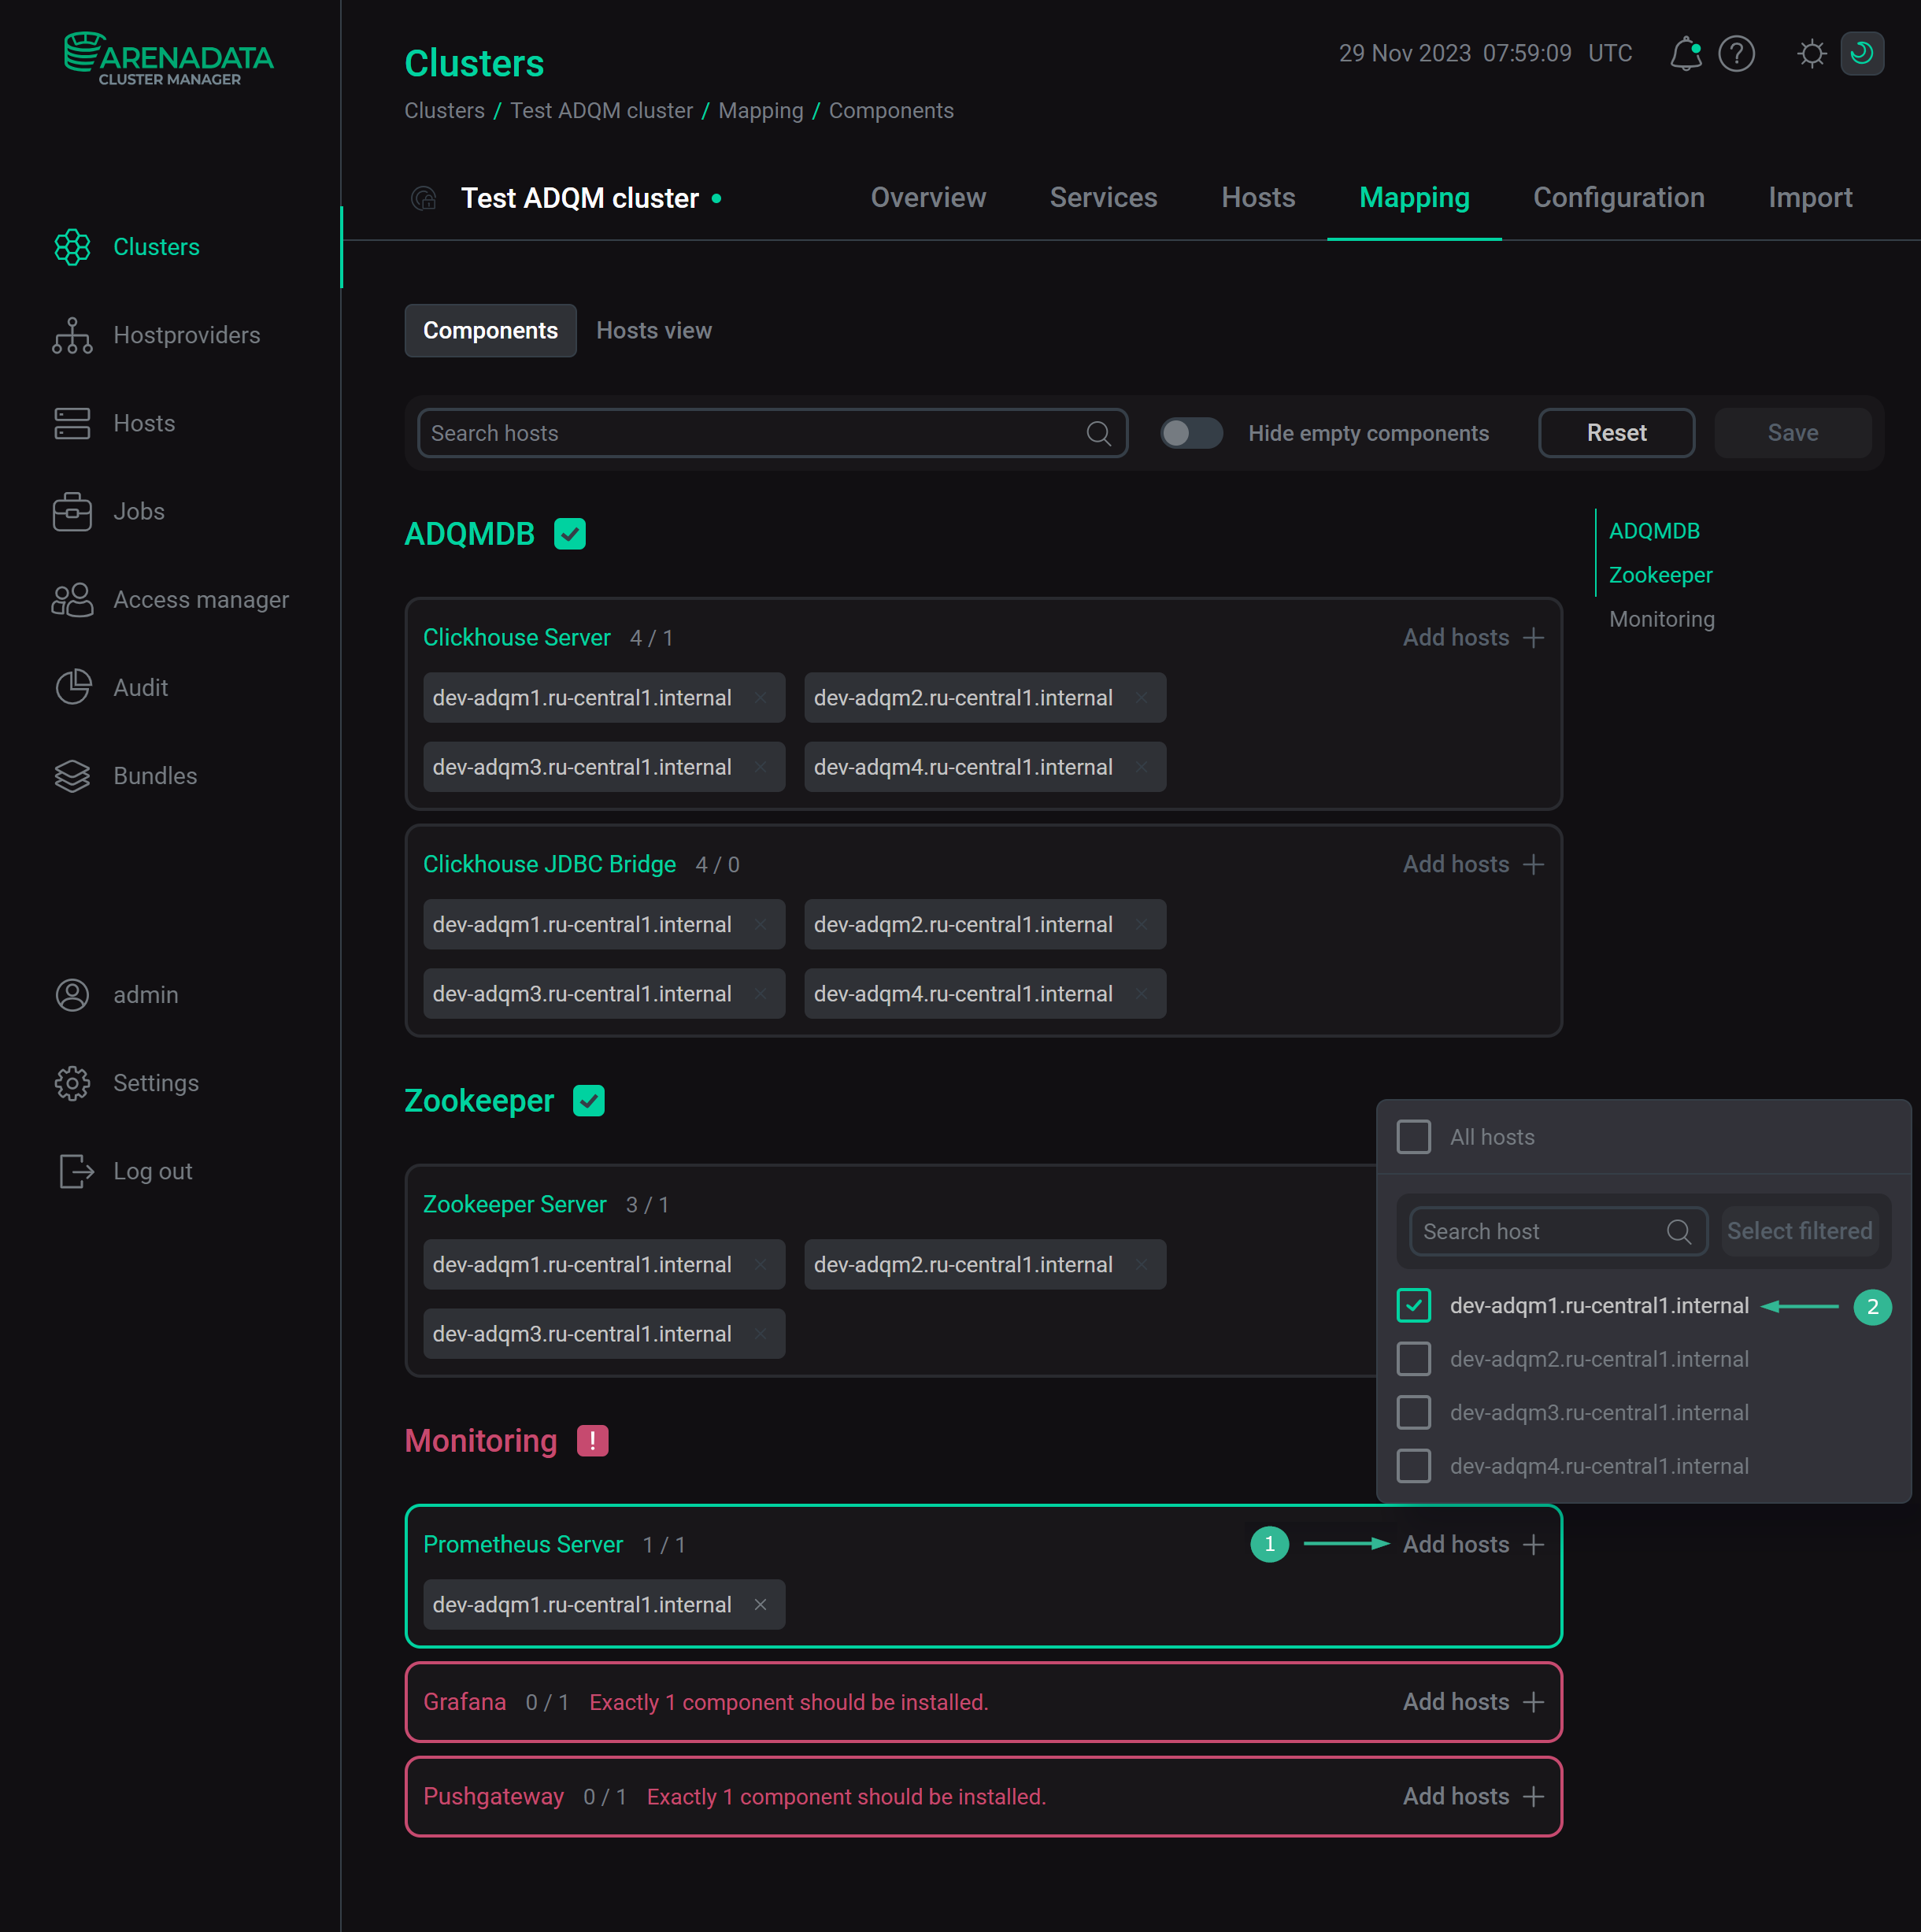 Select a host for a componentCAUTIONIt is not recommended to install the Prometheus Server and Pushgateway components on hosts with ADQM — use separate hosts for them. Otherwise, if an ADQM host fails and/or the load on it is critically high, information about the corresponding problems will not be saved.
 -
After the distribution of components is completed, click Save.
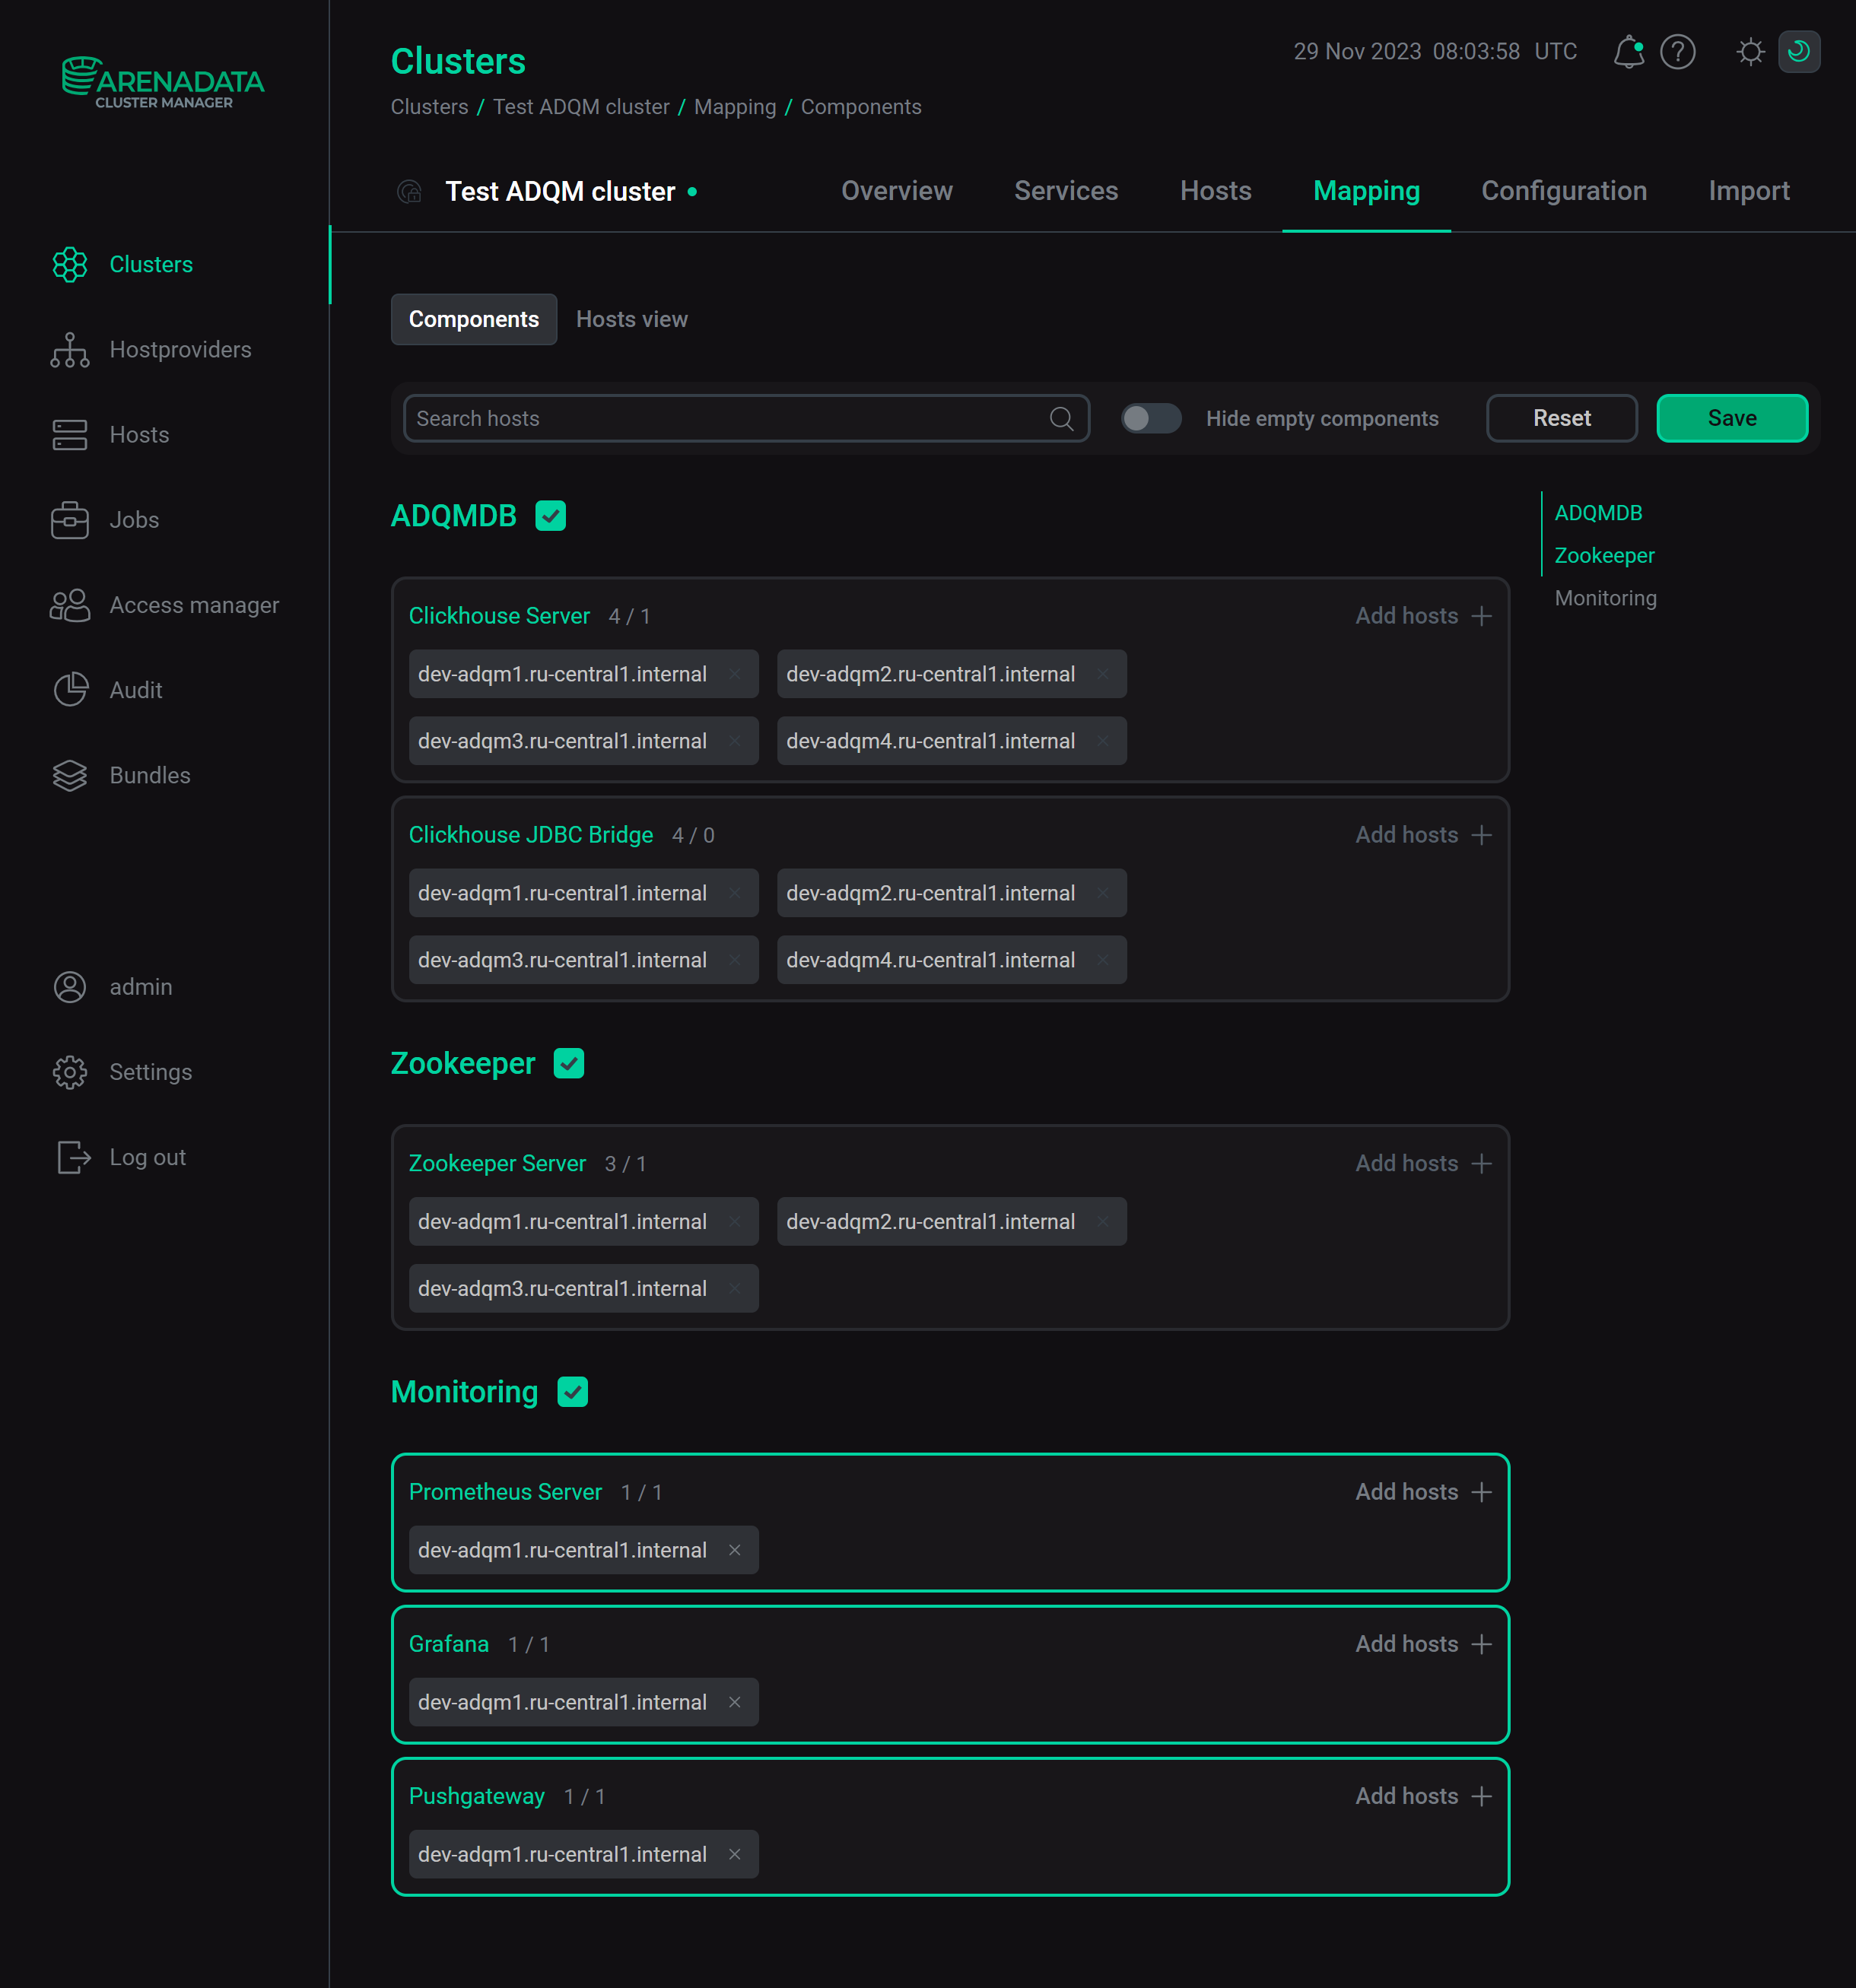 Save mapping of components
Step 3. Configure the service
-
Open the Services tab on the cluster page and click the Monitoring service name in the Name column.
 Switch to the service configuration
 -
On the page that opens, fill in the service’s configuration parameters — see the Monitoring section in the Configuration parameters article for parameter descriptions. Fields highlighted in red are required.
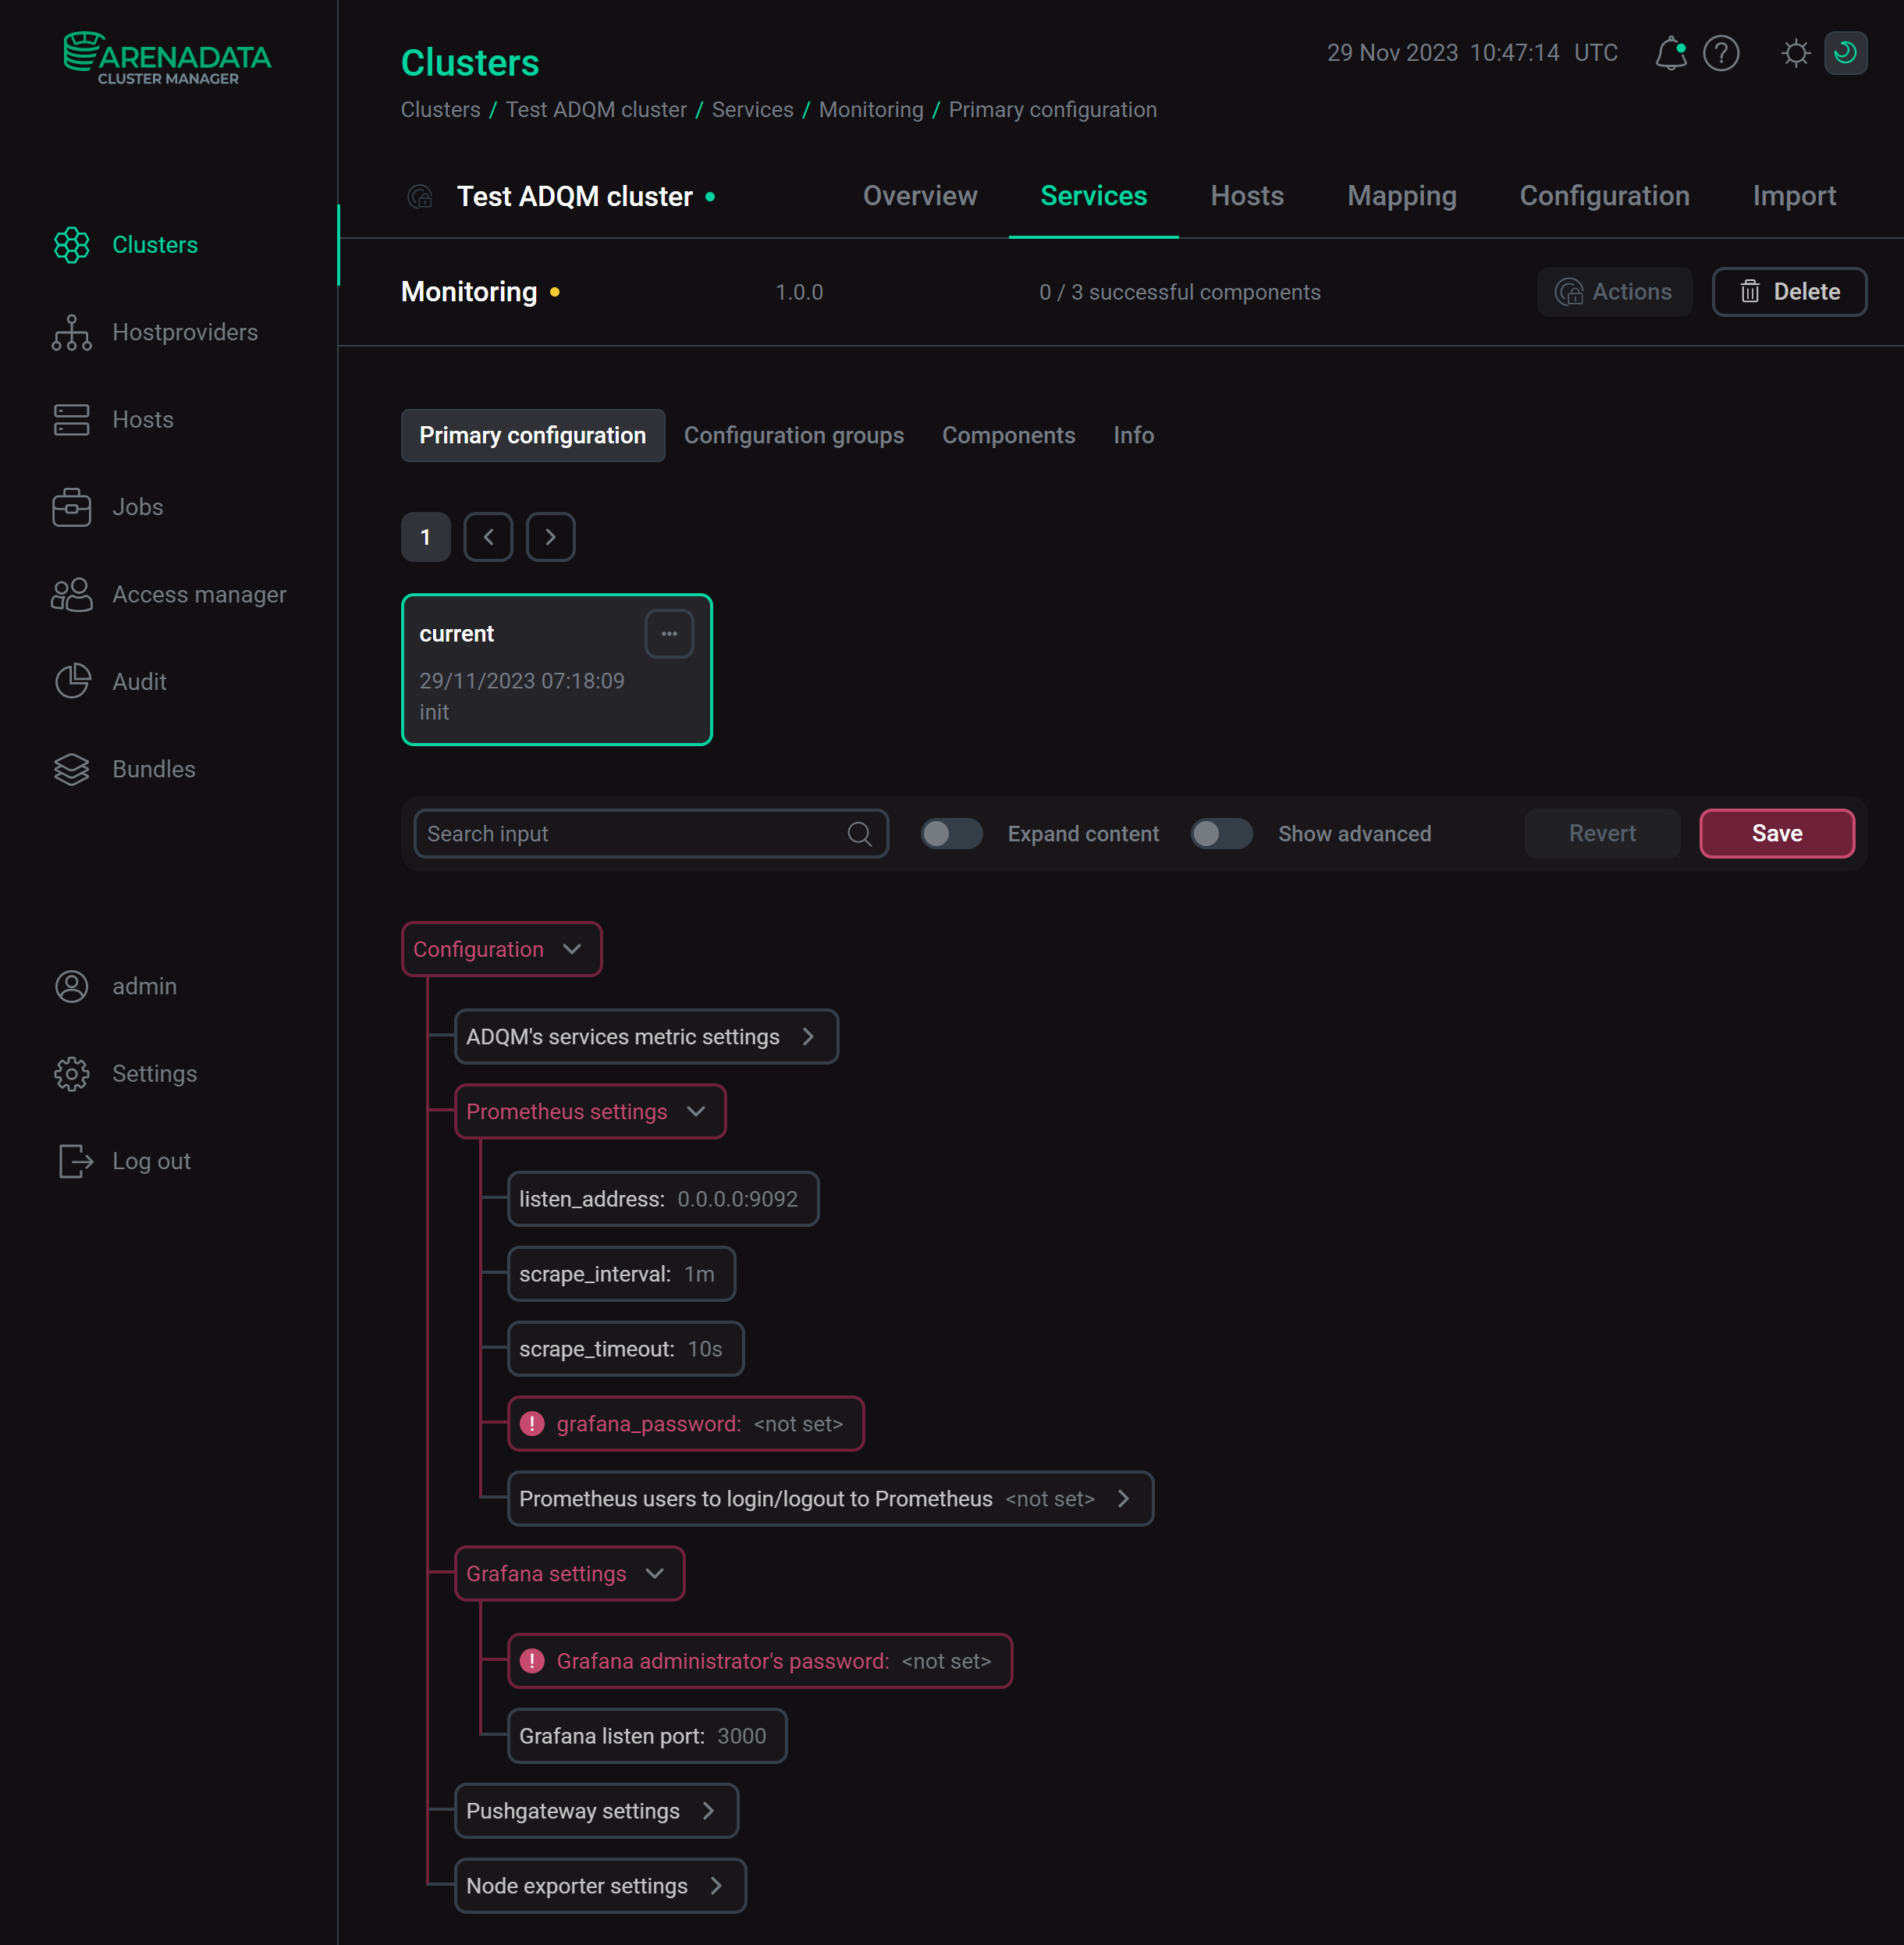 Configure the Monitoring service
After specifying all necessary parameters, click Save.
|
NOTE
To configure settings for access to metrics of the ADQMDB, Zookeeper, Clickhousekeeper services, use parameters in the Metrics activatable section of each service configuration. If you do not specify these parameters manually, the Monitoring service will automatically enable the Metrics section for ADQM services during installation and will use the default values. |
Step 4. Install the service
-
On the Services tab, click the icon

 for the Monitoring service in the Actions column and run the Install action.
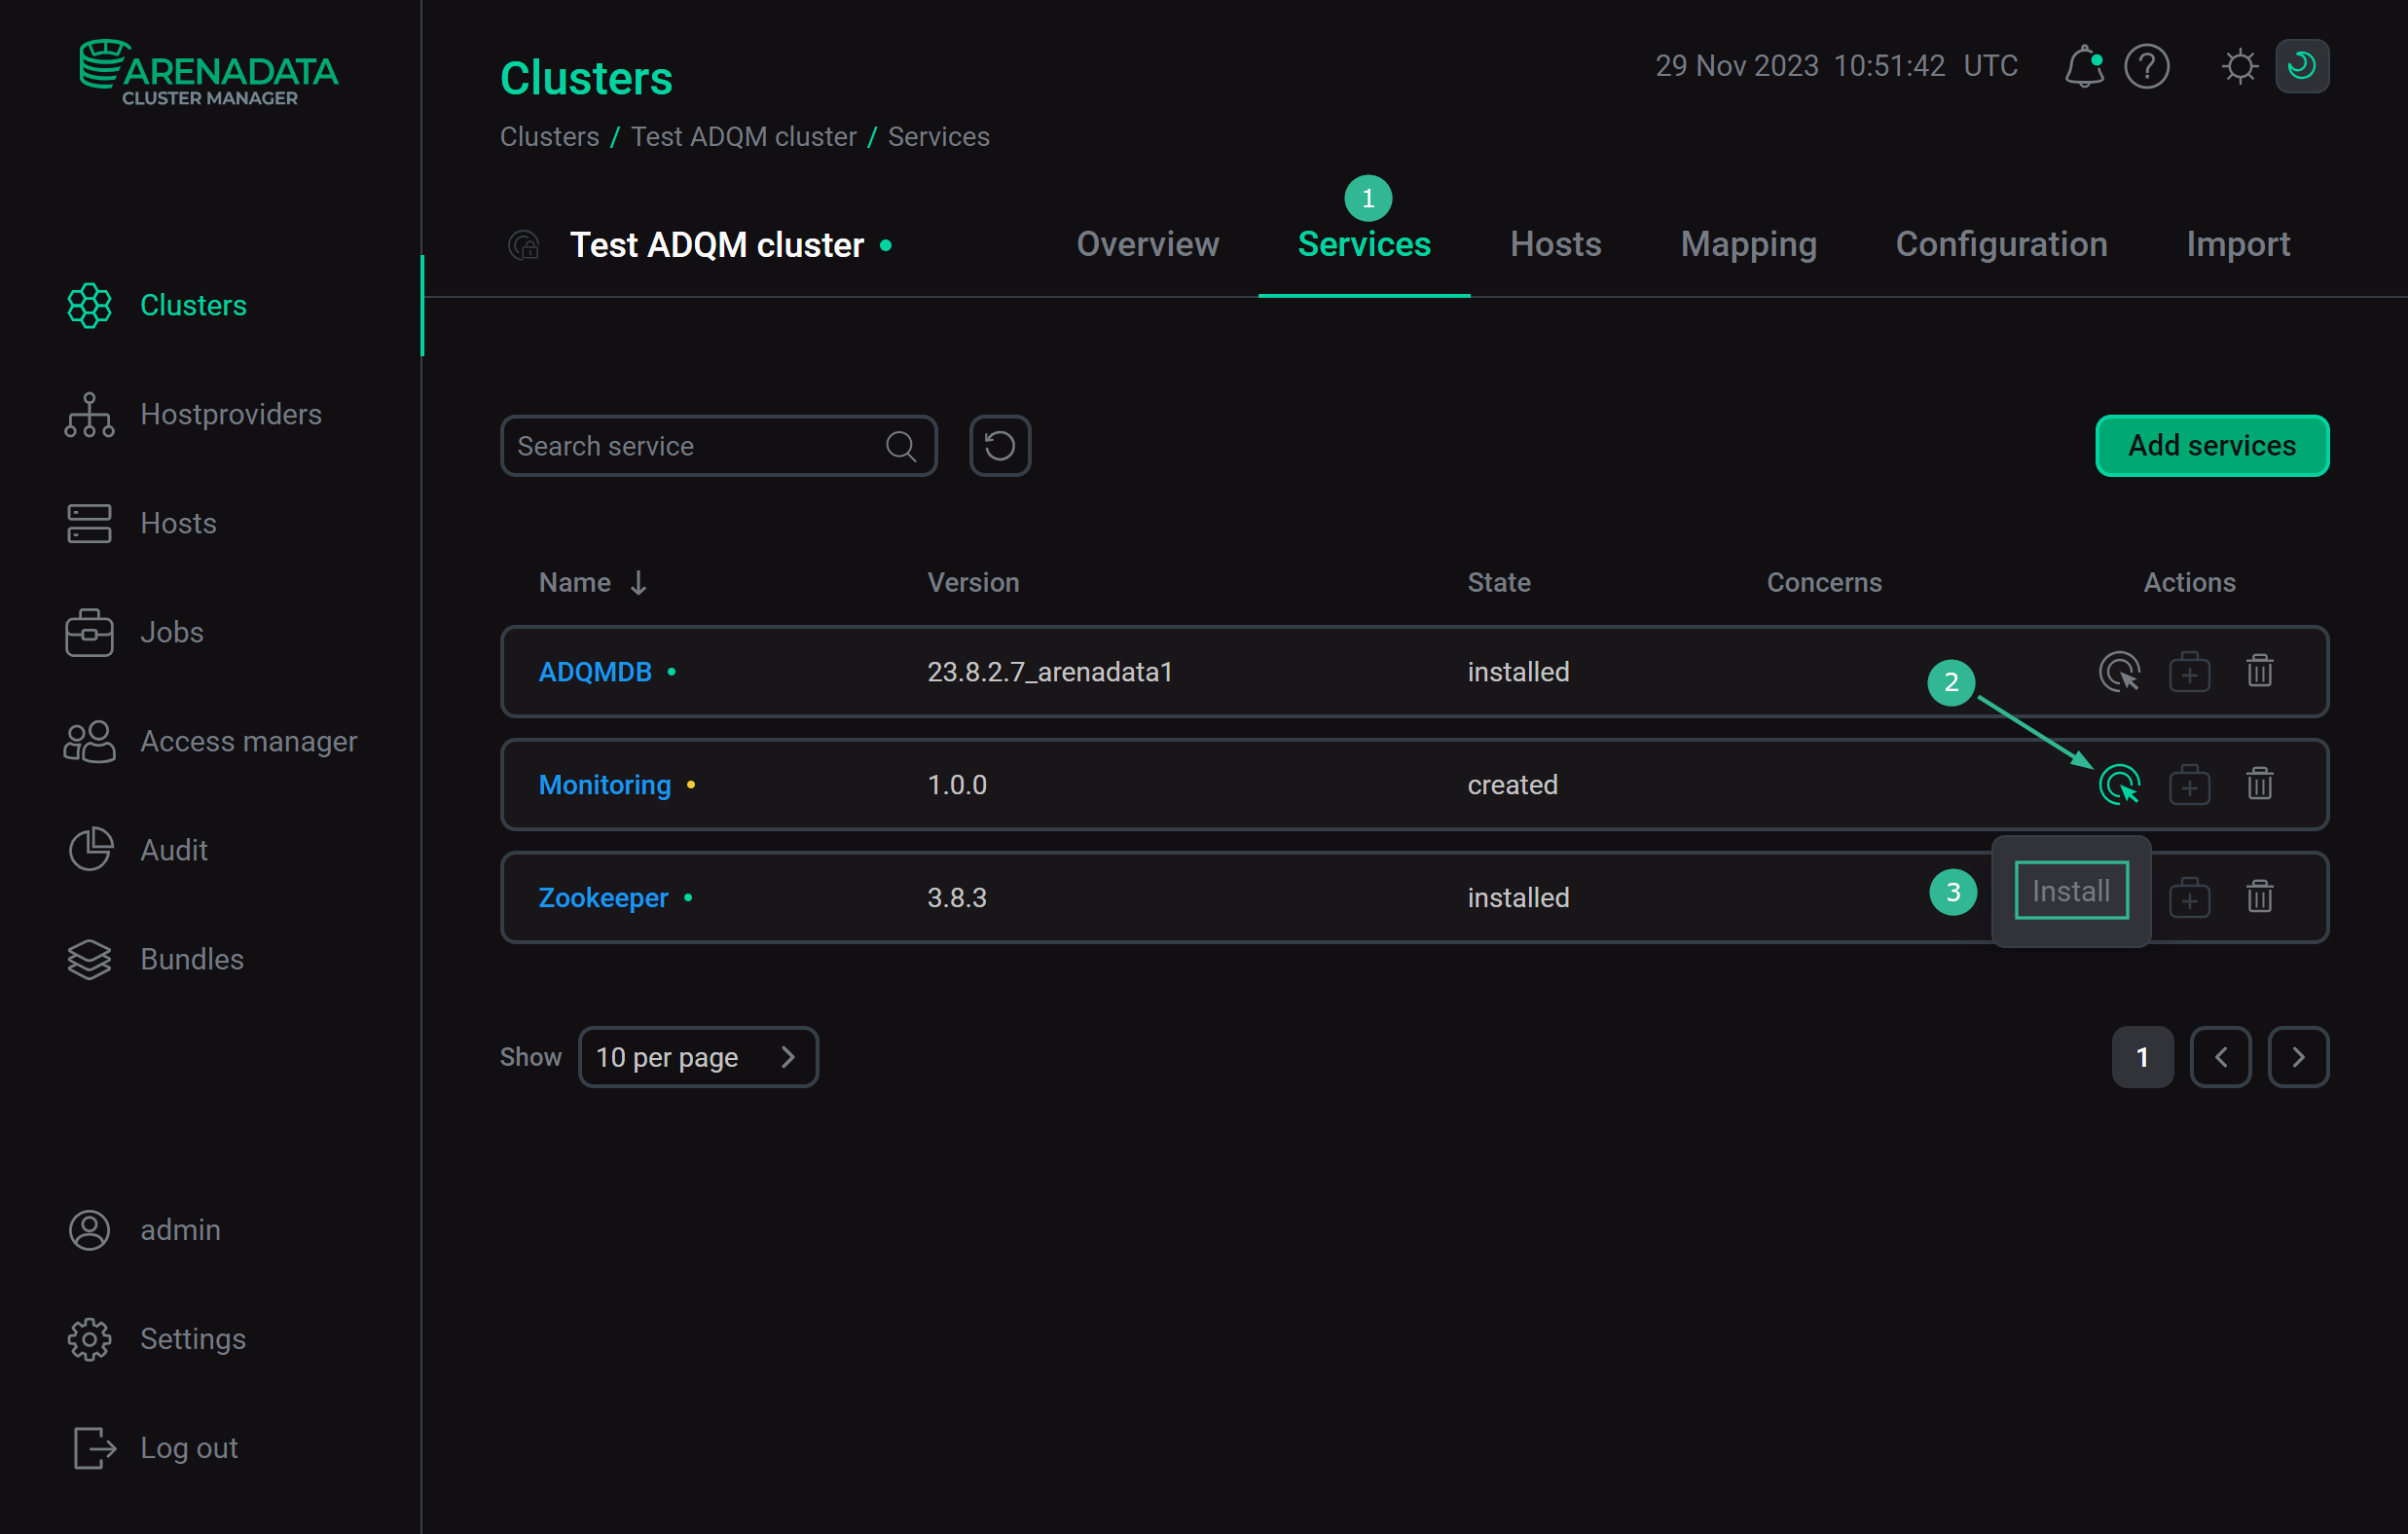 Switch to the service installation
 -
Confirm the action in the opened window.
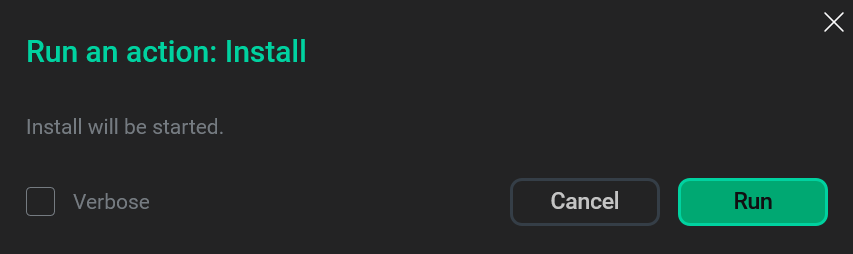 Confirm the action
 -
Wait until the installation is completed. Then check that the service state has changed from
createdtoinstalled.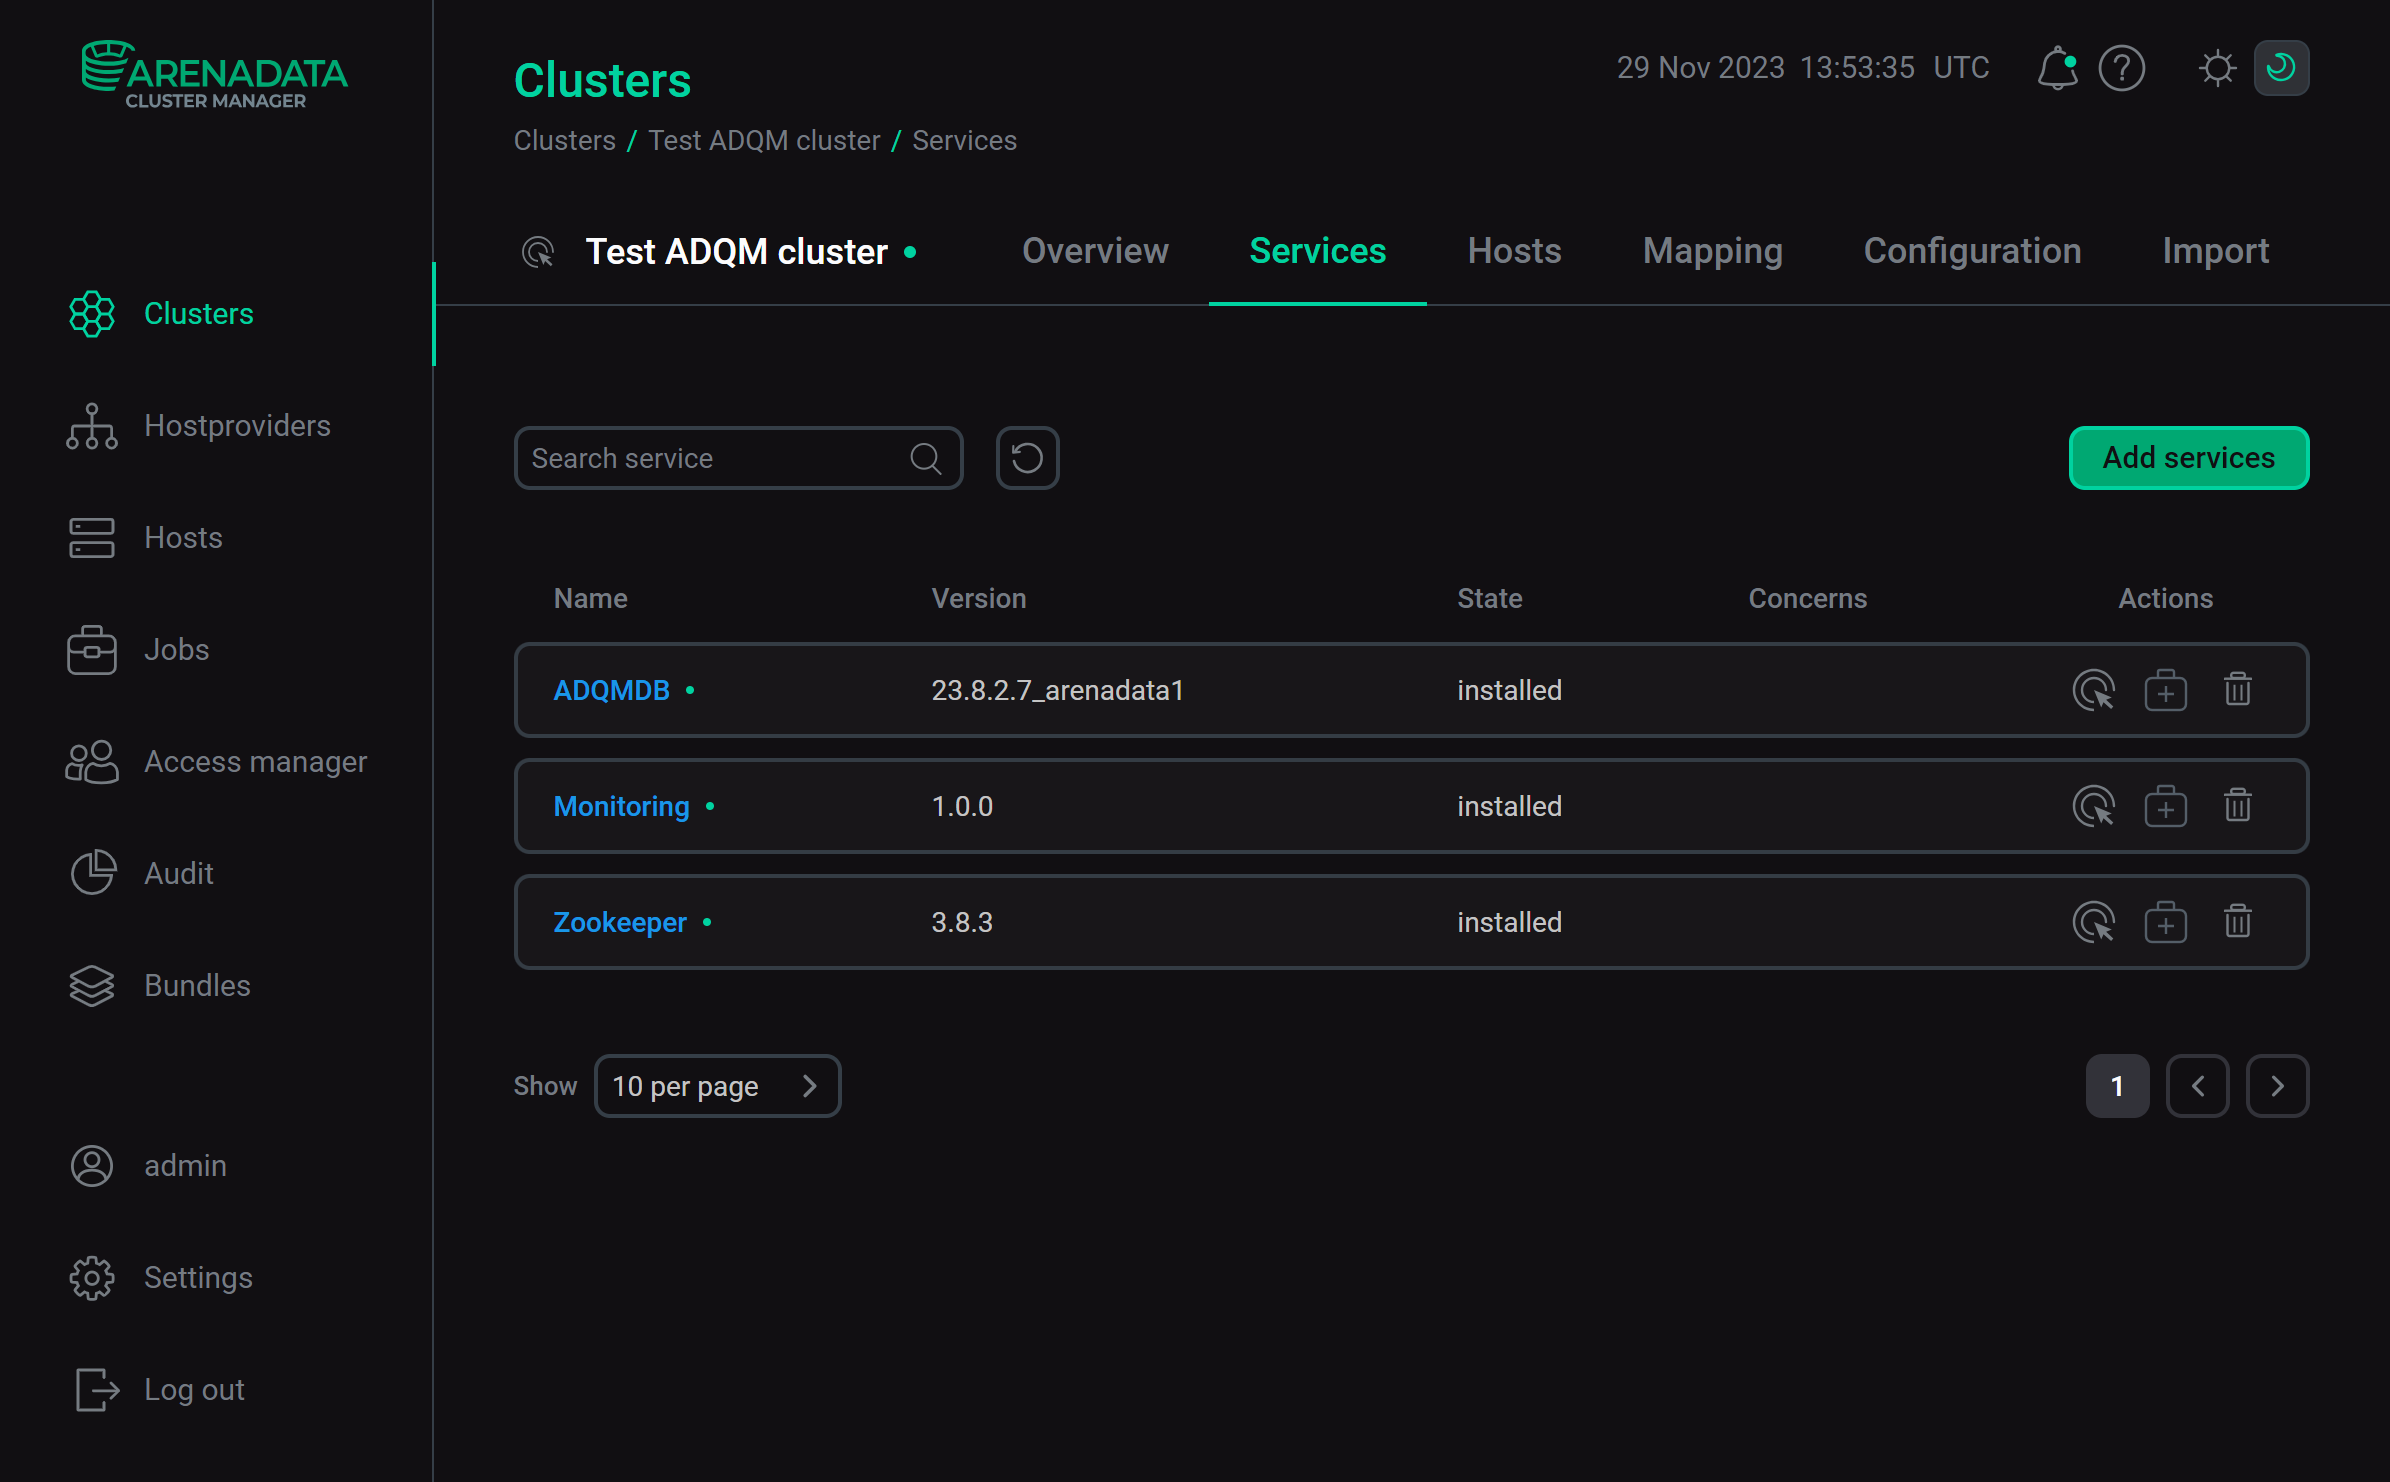 Installation is complete
To view the service installation process and analyze errors if they occur, select Jobs in the left navigation menu and click the Install job name in the Jobs list.
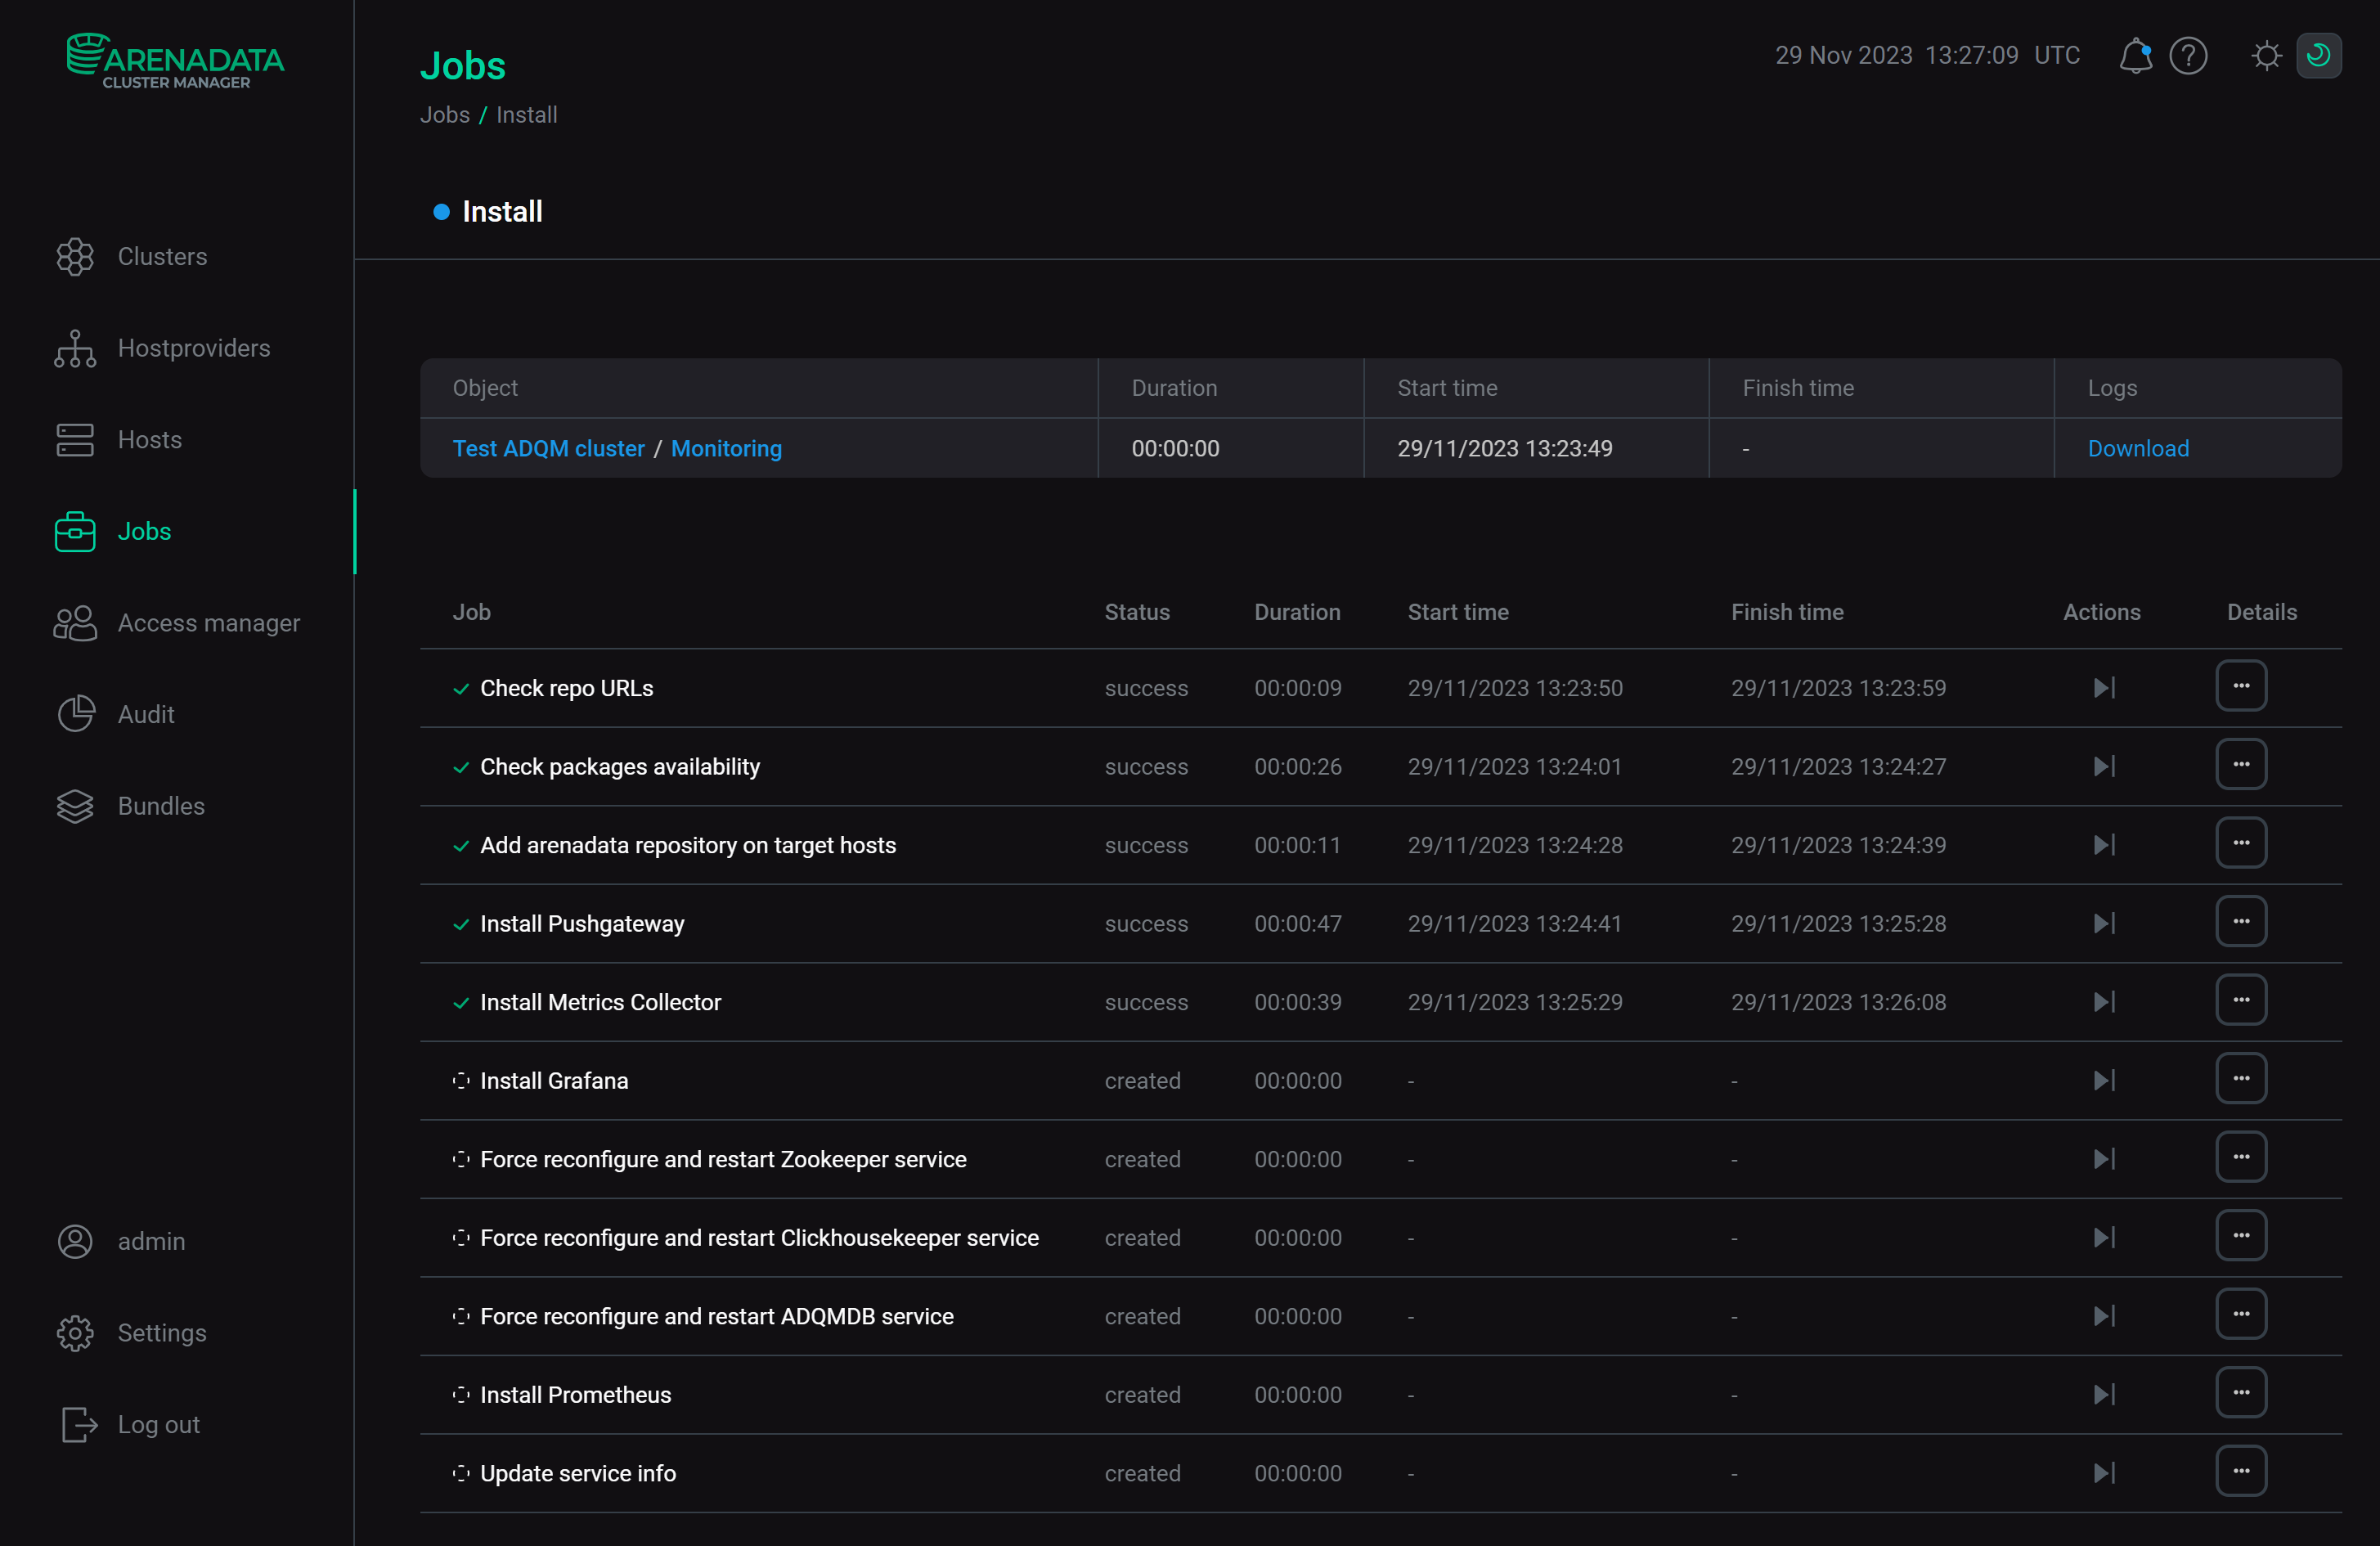 Install service job page
Step 5. View results
The Monitoring service starts automatically after installation. To ensure that monitoring works correctly, check that both system and ADQM service metrics are collected from the cluster hosts — see ADQM monitoring metrics. To do this, view metrics in the Prometheus format in the browser or use the Prometheus or Grafana web interface.
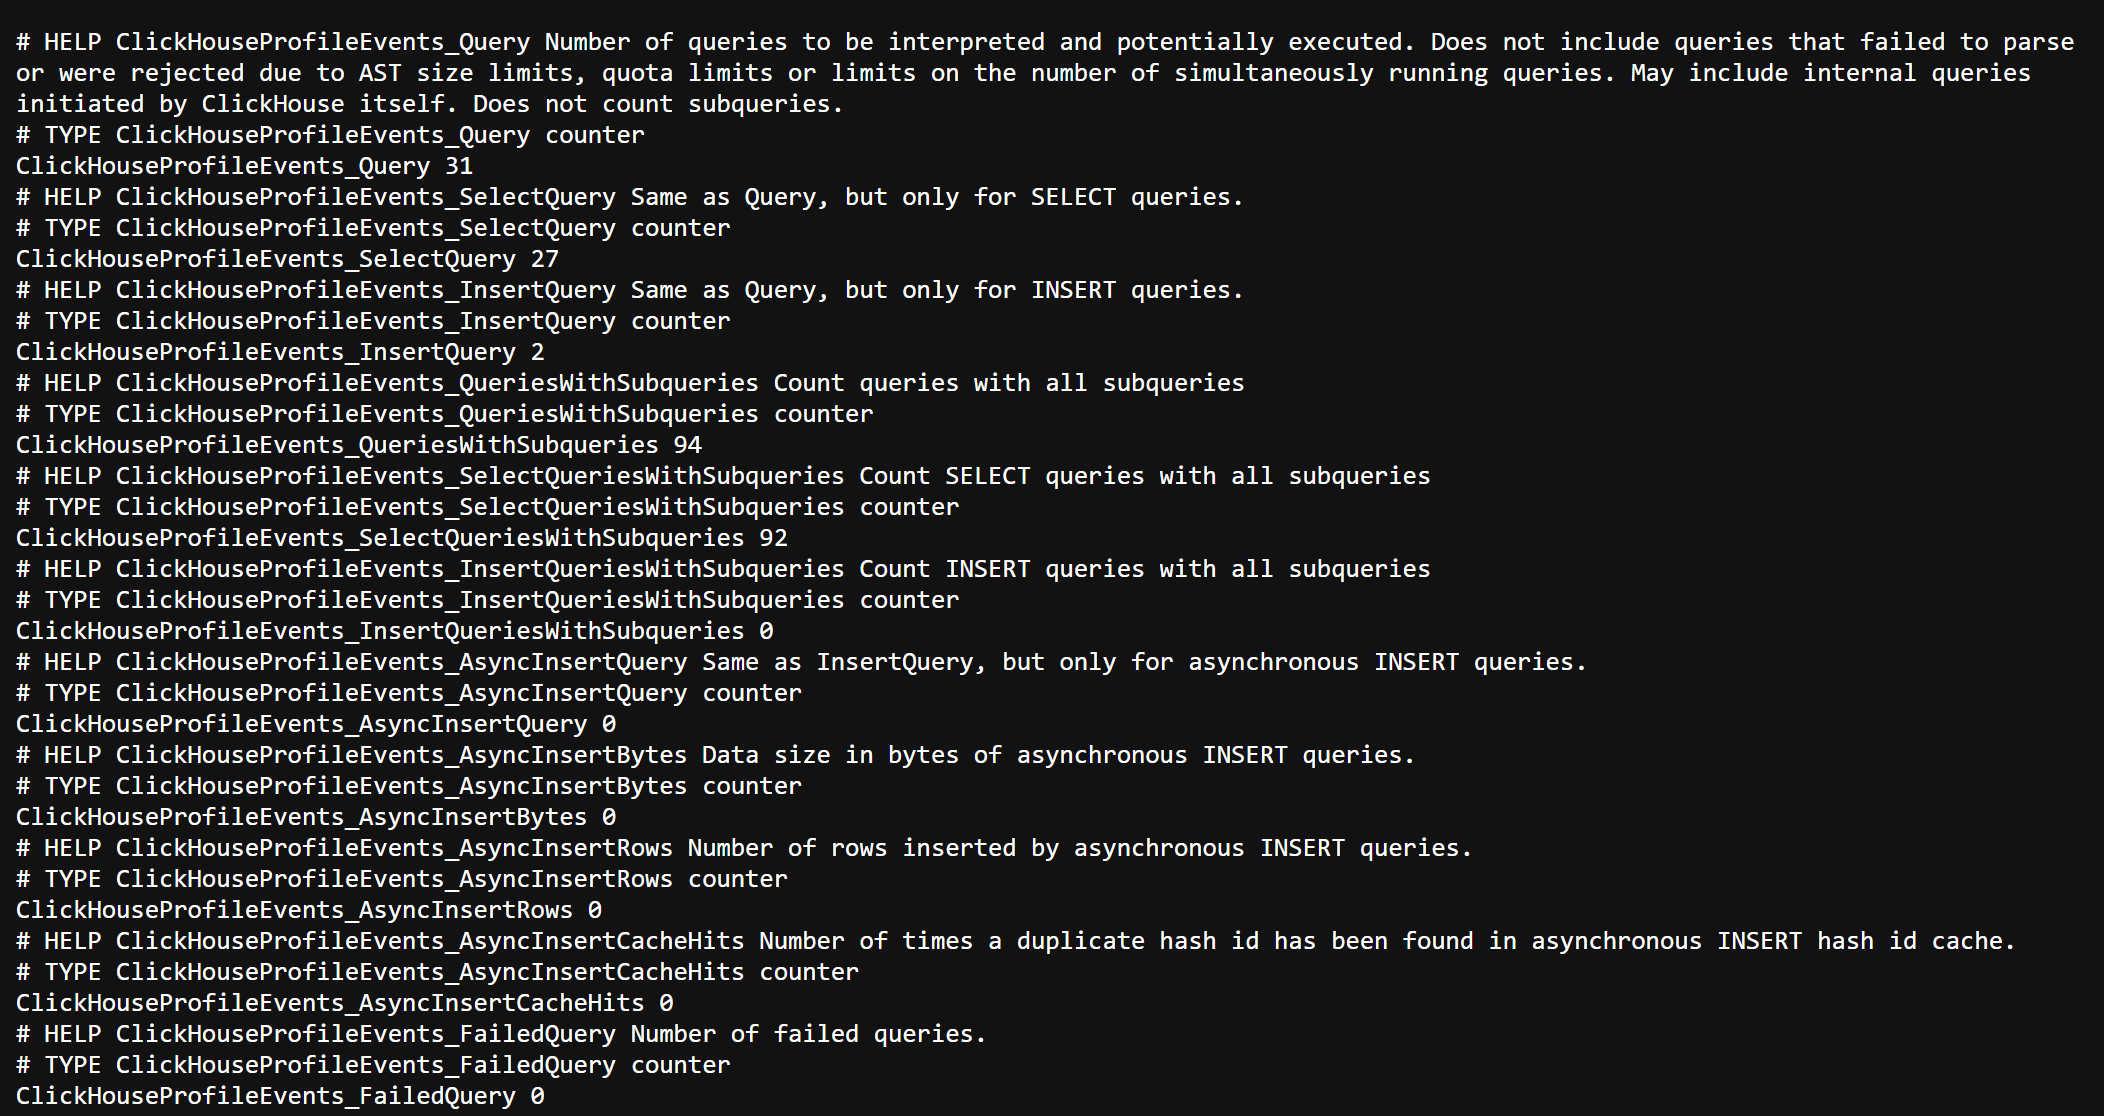
Metrics in the Prometheus format
-
In the address bar of your browser, enter an address of an ADQM host with the specified port and endpoint to listen for service or system metrics. Port numbers and endpoints are defined by the parameters located in:
-
the Metrics section on the configuration pages of the ADQMDB, Zookeeper, and Clickhousekeeper services — settings for access to monitoring metrics of these services;
-
the Node Exporter settings section on the configuration page of the Monitoring service — settings for access to system metrics of the ADQM cluster hosts.
For example, http://10.92.40.25:9363/metrics is an address to view metrics of the ClickHouse server on a host with IP
10.92.40.25. -
-
The page that opens will display monitoring metrics from the specified host of the ADQM cluster in the Prometheus format.
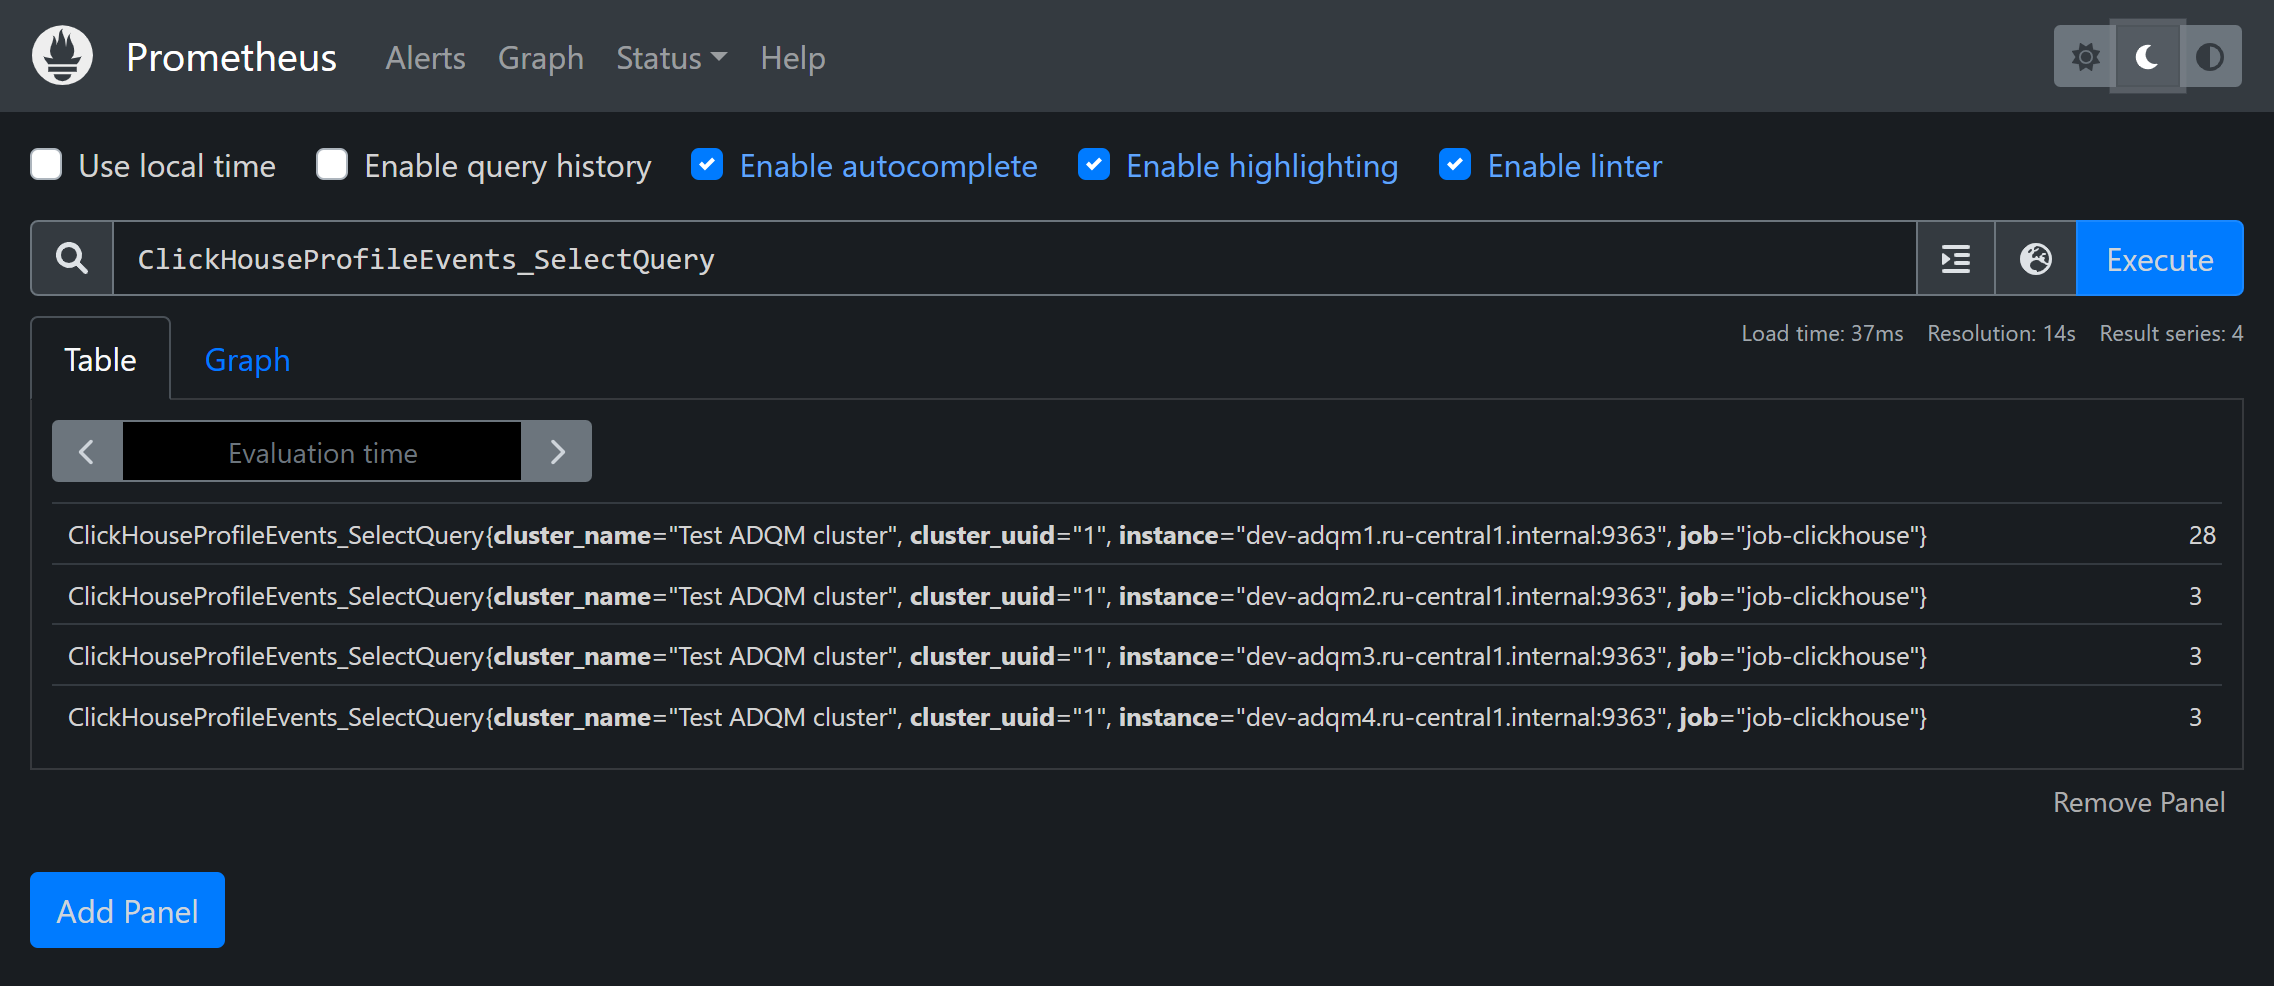
Prometheus web interface
-
In the address bar of your browser, enter an IP address of a host where the Prometheus Server component is installed. Specify also a port number from the web.listen-address parameter in the Service parameters group within the Prometheus settings section of the Monitoring service configuration (the default port is
11200). For example: http://10.92.40.107:11200. To log into the Prometheus interface, use a username and password that are also specified in the Prometheus settings section — the Prometheus users to login/logout to Prometheus setting. -
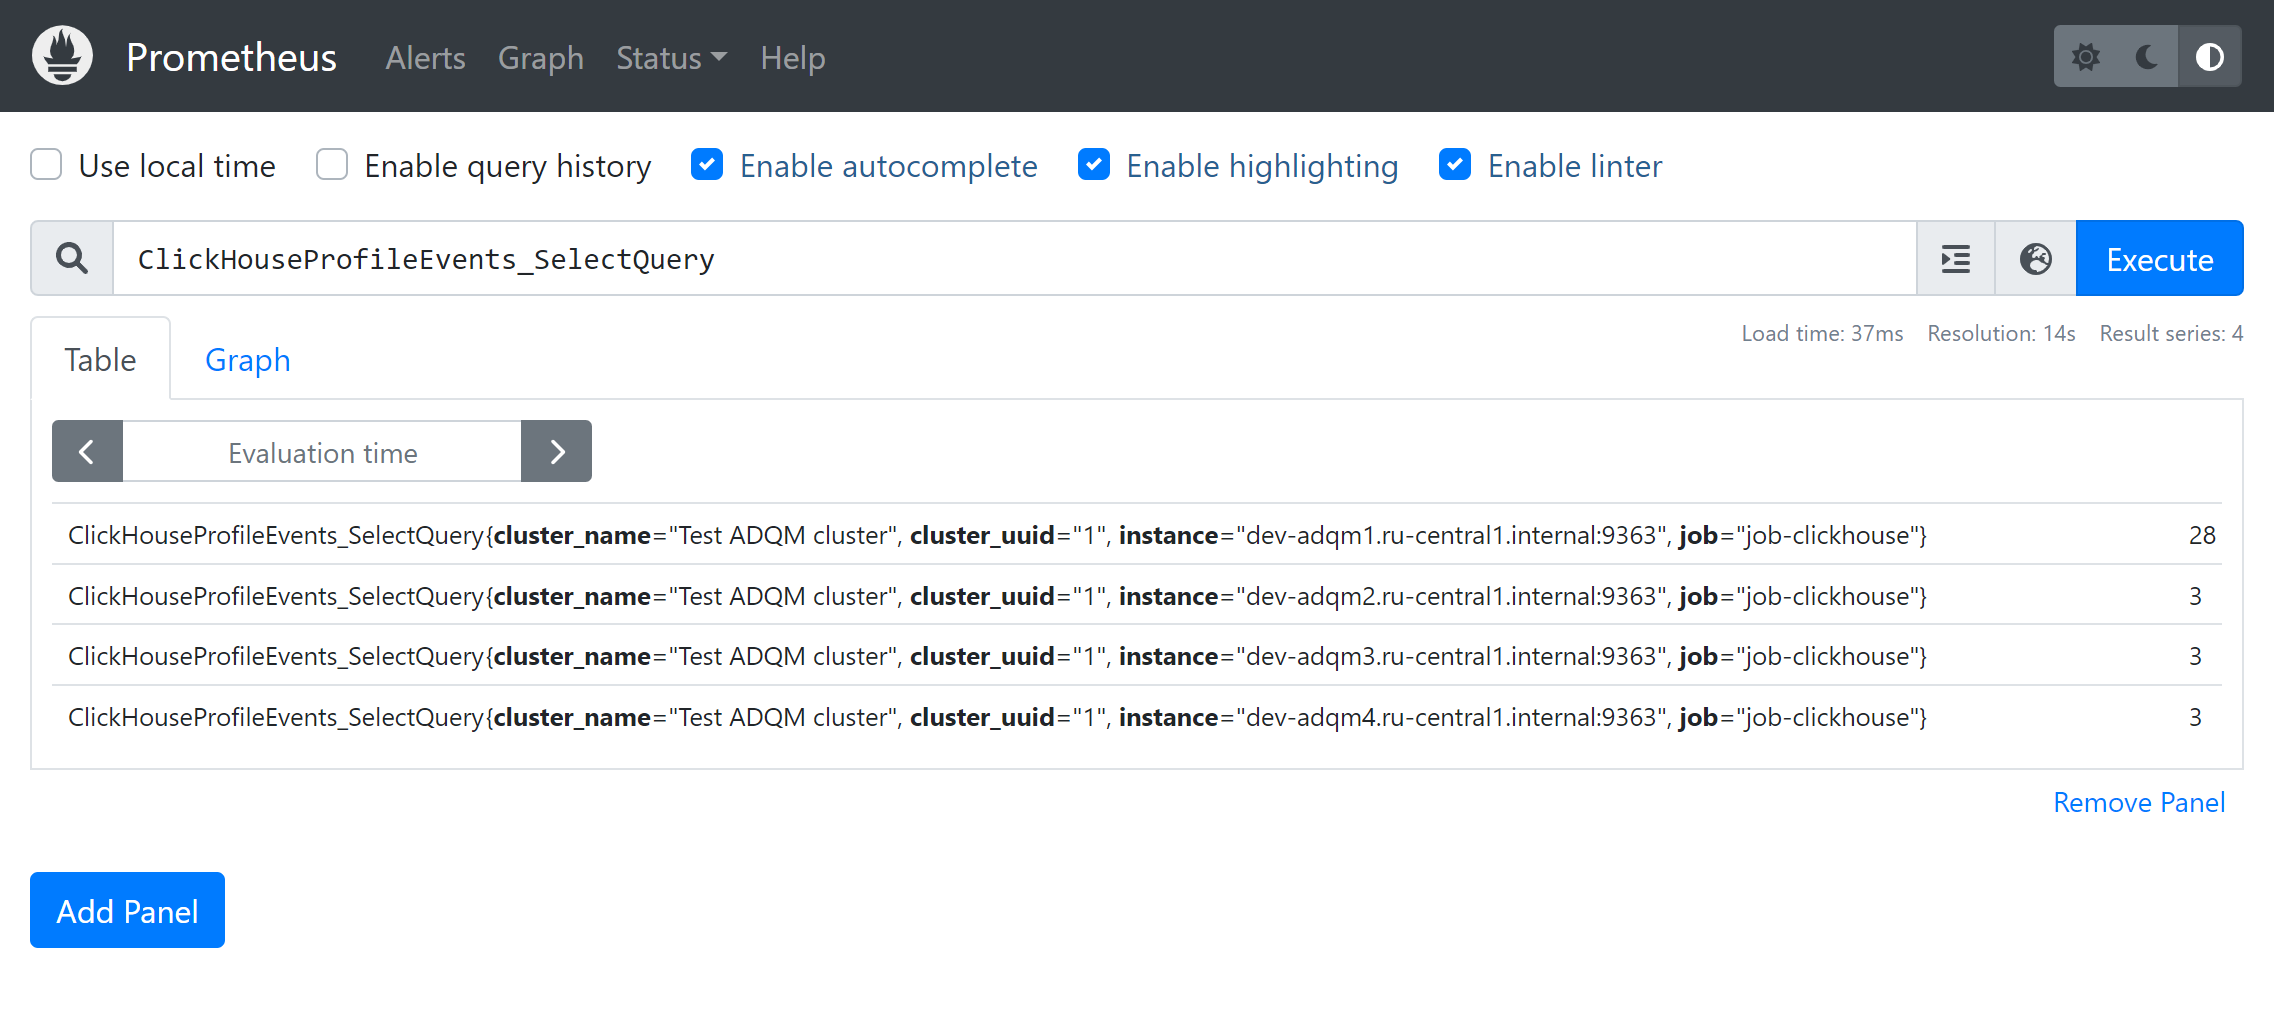
In the Expression field, you can enter a metric and click Execute — values of this metric on all hosts of the ADQM cluster will be shown in the interface.
Grafana web interface
-
In the address bar of your browser, enter an address of a host on which Grafana is deployed and add a port number — a value of the Grafana listen port parameter located in the Grafana settings section of the Monitoring service configuration (the default value is
11210). For example, http://10.92.40.107:11210. To log in, useadminas a username, and the Grafana administrator’s password parameter value (also found in the Grafana settings section of service configuration parameters) as a password. -
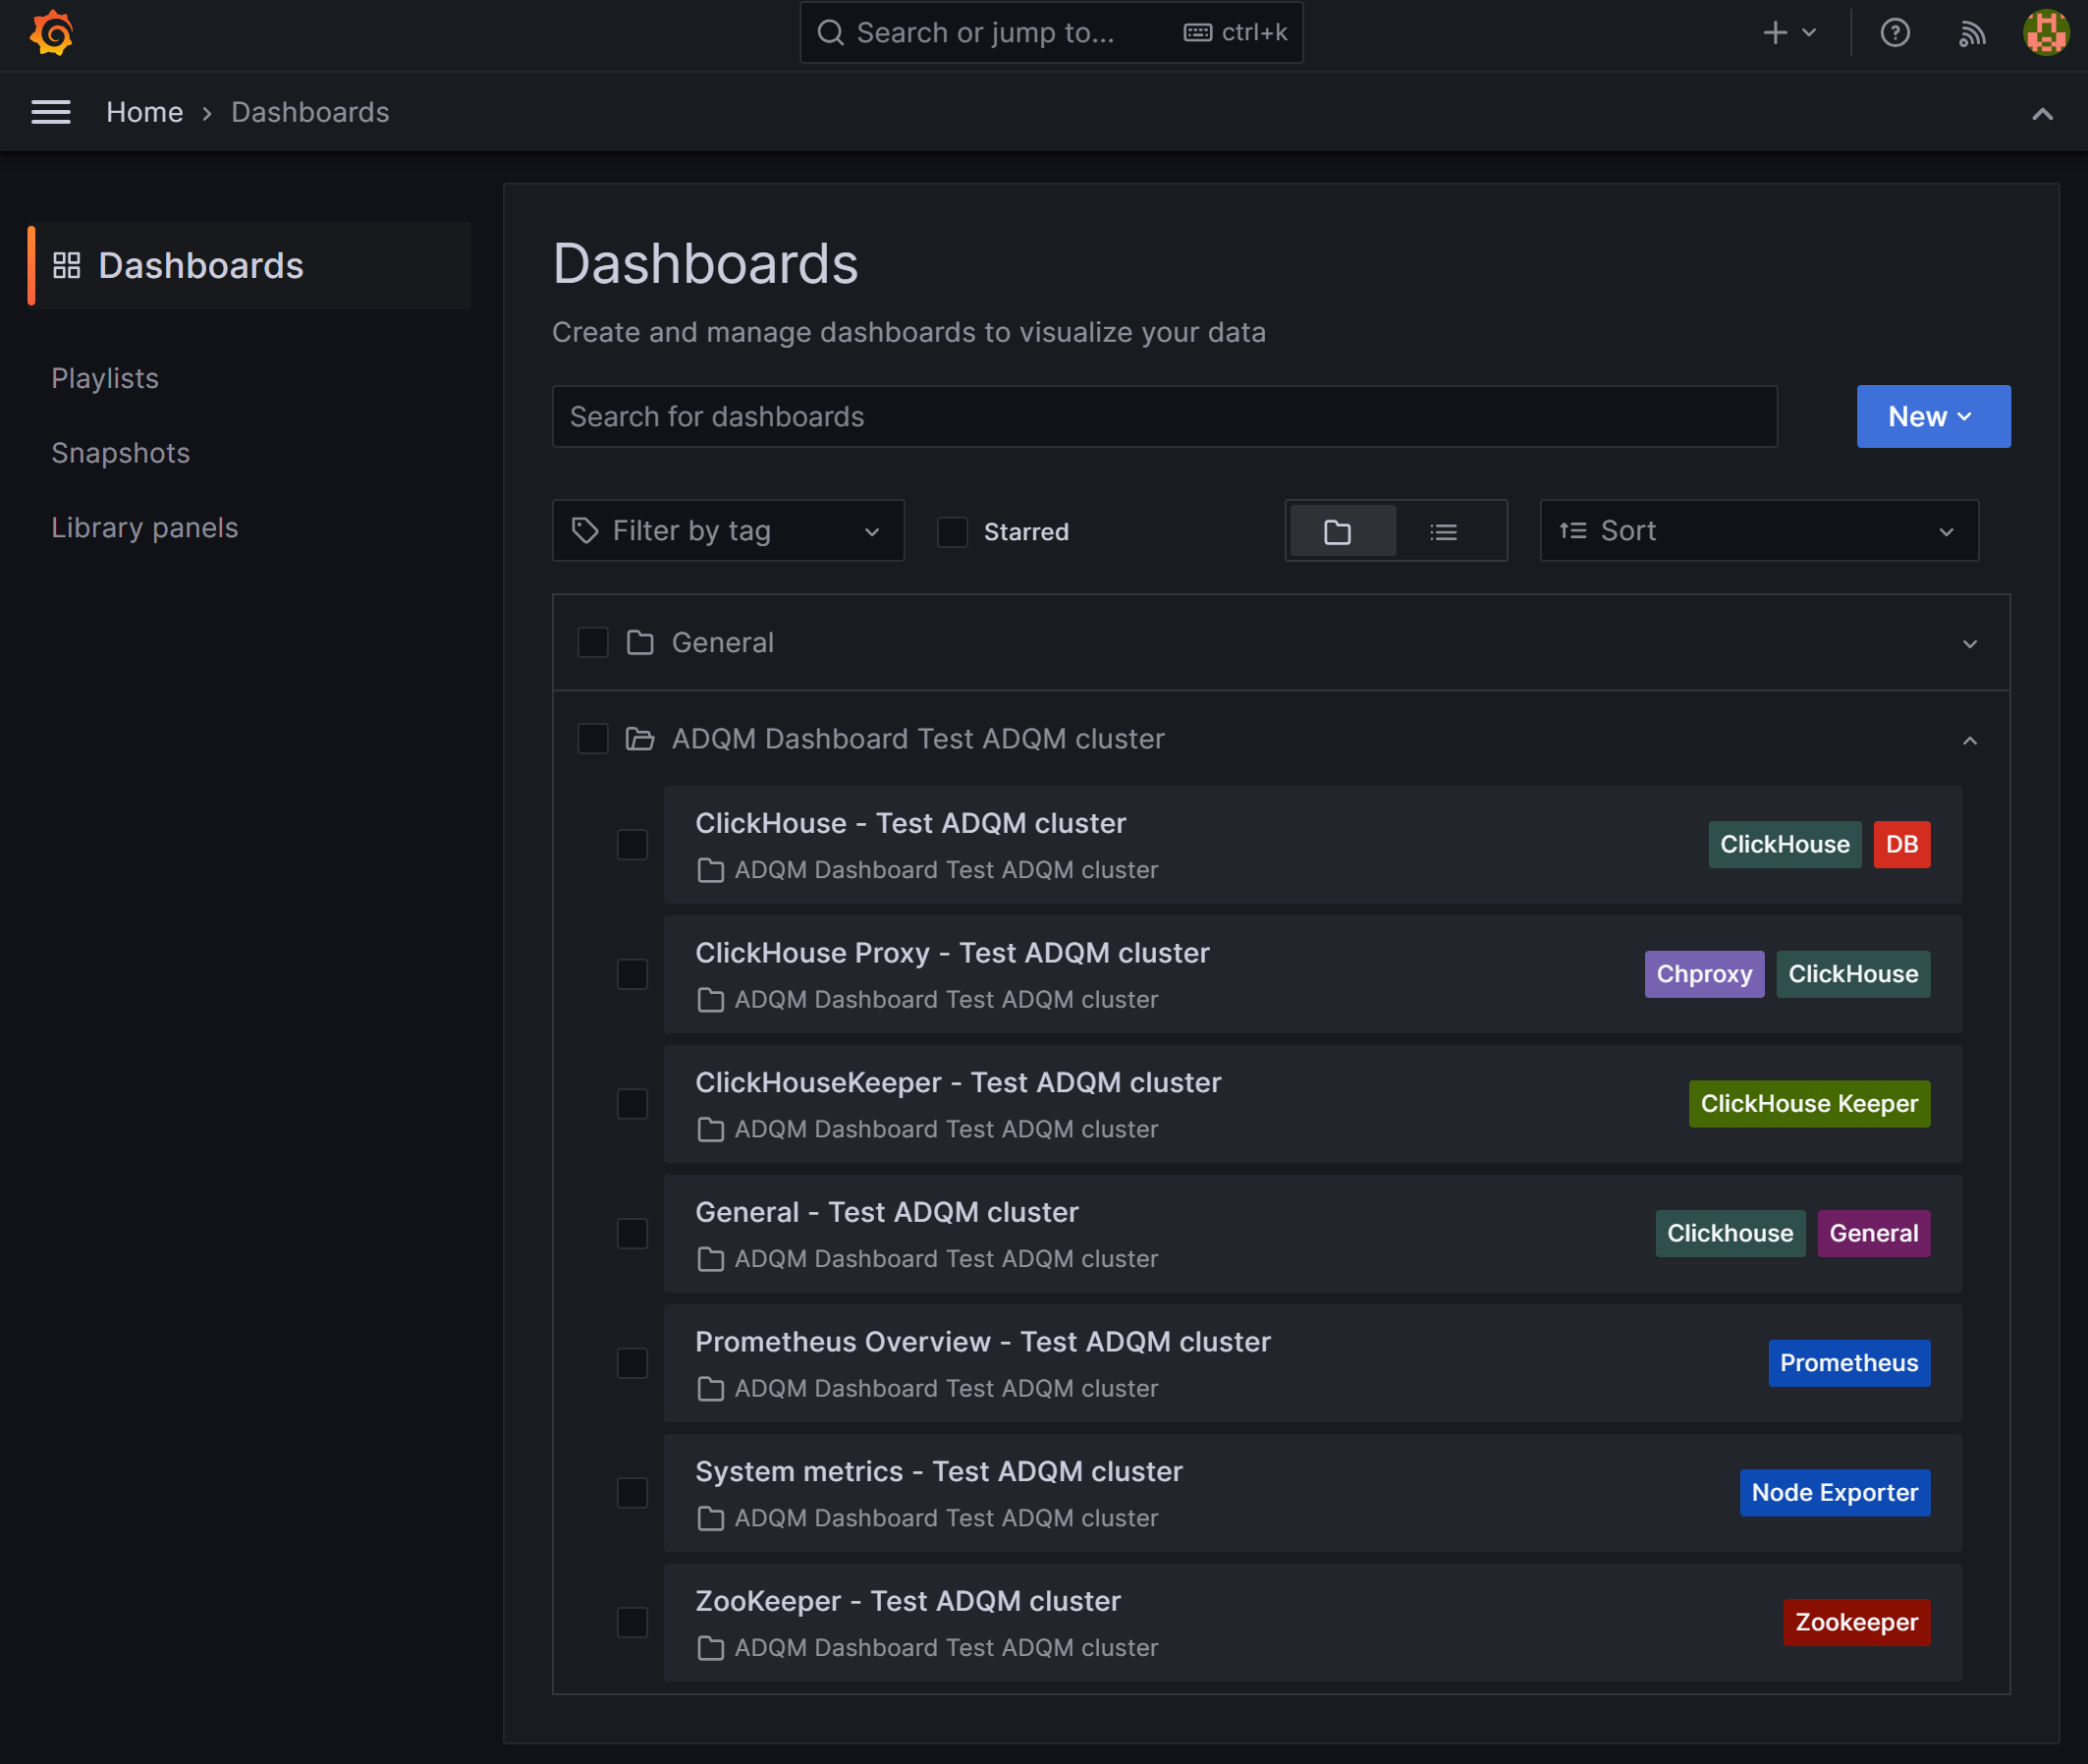
In the window that opens, navigate to Home → Dashboards and expand the ADQM Dashboard <ADQM_cluster_name> section. In this section, you can select one of available dashboards to view service or system metrics coming from your ADQM cluster.