

Collect core dumps
ADQM supports automatic generation of core dump files when ClickHouse processes terminate unexpectedly. A core dump can be useful for an administrator or developer to inspect the system state at the time of a crash and troubleshoot the cause of the issue.
Enable core dump collection
To configure ADQM to automatically create core dumps when processes terminate due to critical errors, follow the steps below.
Run the ADQMDB service action
-
Launch the Manage auto core dump action for the ADQMDB service.
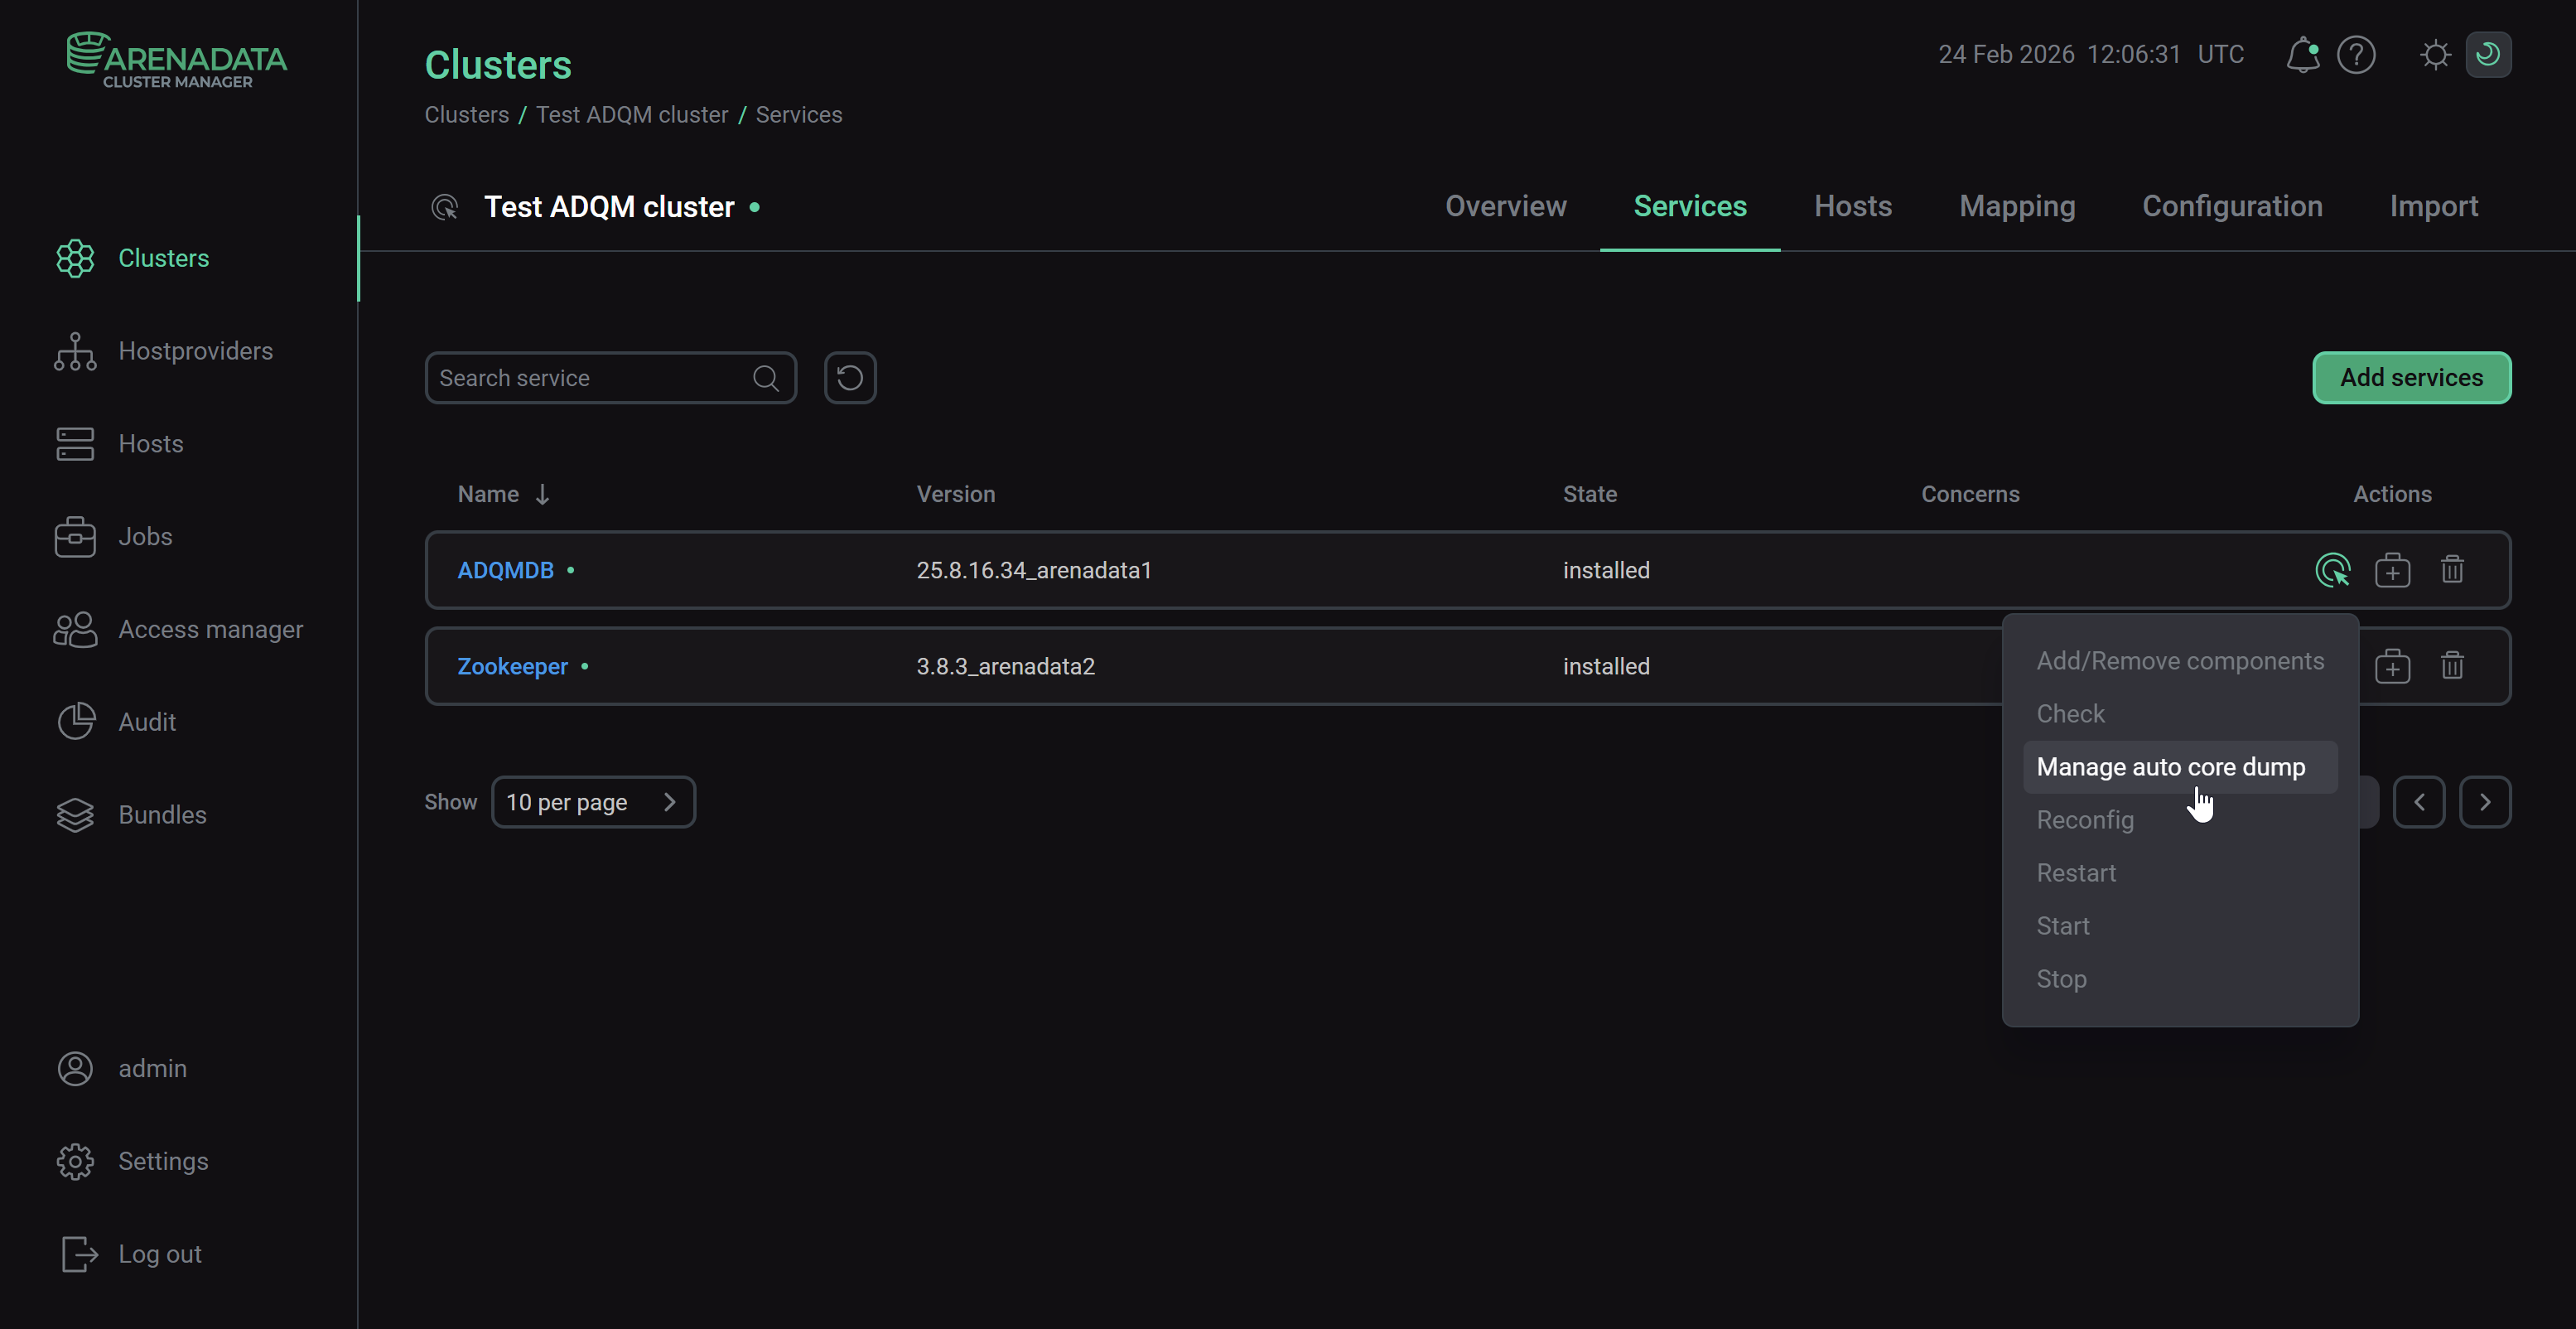 Run the "Manage auto core dump" action
 -
In the action configuration window, enable the Enable auto core dump option and change values of dump storage settings, if necessary.
 The "Manage auto core dump" action configuration
 -
Click Next and confirm the action on the Confirmation tab by clicking Run.
Once the Manage auto core dump action is successfully executed, the systemd-coredump package will be installed on ADQM hosts.
For example, to check that the service to collect core dumps is successfully installed and started, run the following command on an ADQM host with the Ubuntu operating system:
$ systemctl status systemd-coredump.socketThe service should have the active (listening) status:
systemd-coredump.socket - Process Core Dump Socket
    Loaded: loaded (/lib/systemd/system/systemd-coredump.socket; static)
    Active: active (listening) since Mon 2025-12-01 07:16:43 UTC; 45min ago
      Docs: man:systemd-coredump(8)
    Listen: /run/systemd/coredump (SequentialPacket)
   Accepted: 0; Connected: 0;
     CGroup: /system.slice/systemd-coredump.socket
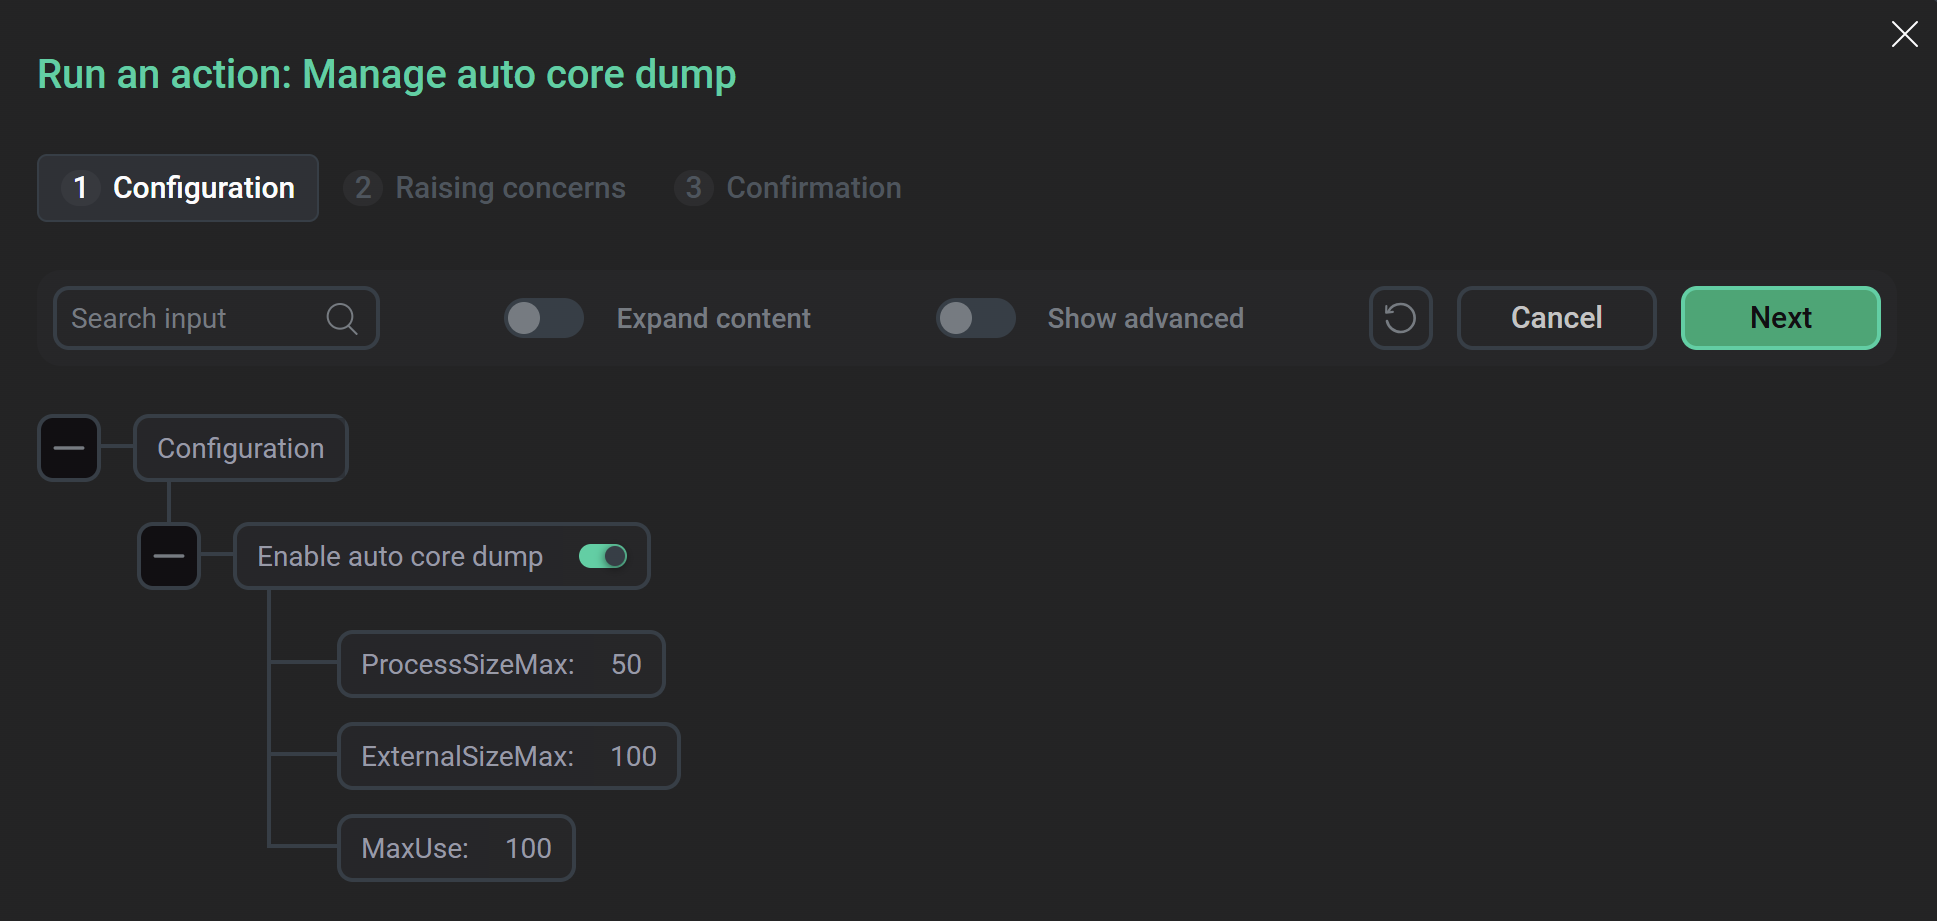
You can also verify that core dump collection is enabled using the Auto Core Dump Service parameter in the Other section on the configuration page of the ADQMDB service — it should be set to true.
Configure the systemd-coredump service
You can view the configuration parameters of the installed systemd-coredump service in the /etc/systemd/coredump.conf file. The Manage auto core dump action sets the following service parameters (the list below shows the default values):
-
Storage=external— core dumps will be stored in /var/lib/systemd/coredump/; -
MaxUse=100G— maximum amount of total disk space that can be used to store core dumps (when the limit is reached, old dumps will be removed); -
ProcessSizeMax=50G— maximum size of the crashing process’s memory image to be dumped; -
ExternalSizeMax=100G— maximum size of a core dump file when stored asexternal.
|
IMPORTANT
In ADQM versions prior to 25.8.16.34, created core dump files have the |
Disable core dump collection
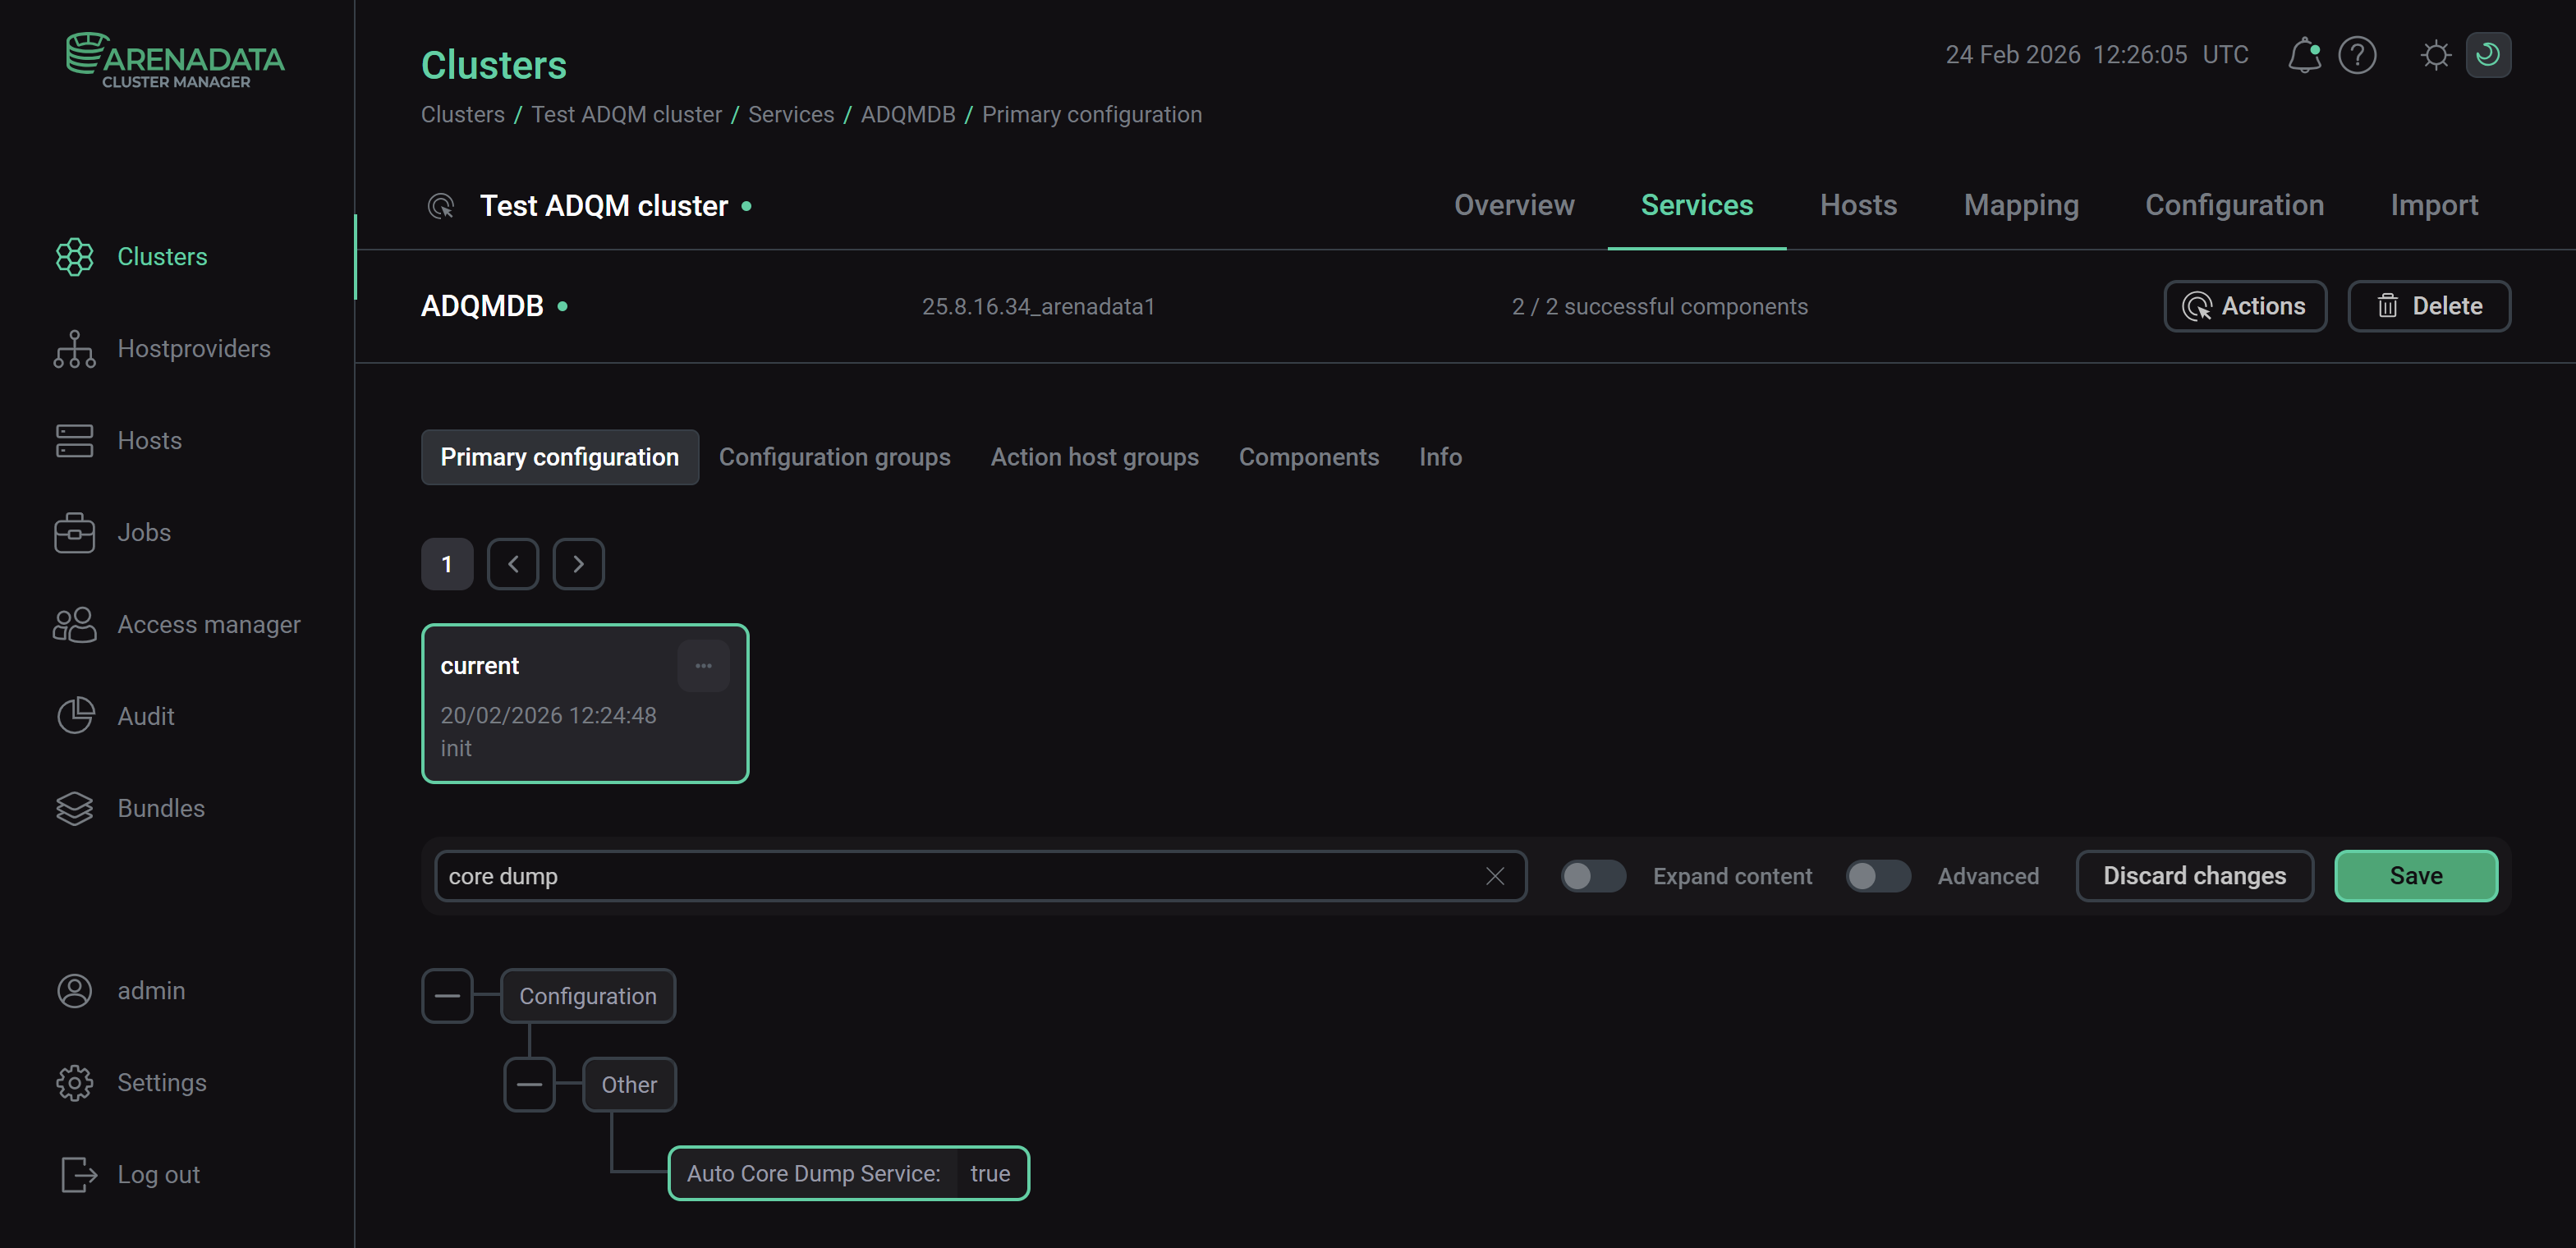
To disable core dump collection, run the Manage auto core dump action with the Enable auto core dump option turned off.
Example
The example below shows how to enable collecting core dumps on ADQM hosts running the Ubuntu operating system and load a core dump into the gdb debugger to analyze the stack trace.
-
Execute the Manage auto core dump action for the ADQMDB service with the Enable auto core dump option enabled.
-
Install the
adqm-clickhouse-common-dbgsympackage:$ sudo apt install adqm-clickhouse-common-dbgsym -
Install the
gdbdebugger:$ sudo apt install gdb -
Check that the /var/lib/systemd/coredump/ directory does not contain any core dump files:
$ sudo coredumpctl listNo coredumps found.
-
Determine PID of the ClickHouse process:
$ pgrep -l clickhouseExample of a process PID:
6812 clickhouse-serv
-
Send the
SIGTRAPsignal to the ClickHouse process using theKILLcommand:$ sudo KILL -s SIGTRAP 6812 -
Check that a dump file has been created:
$ sudo coredumpctl listTIME PID UID GID SIG COREFILE EXE SIZE Mon 2025-12-01 09:31:36 UTC 6812 997 997 SIGTRAP present /usr/bin/clickhouse 13.3M
-
Load the core dump into the
gdbdebugger:$ sudo coredumpctl gdb 6812Use the
bt(backtrace) command to view the call stack.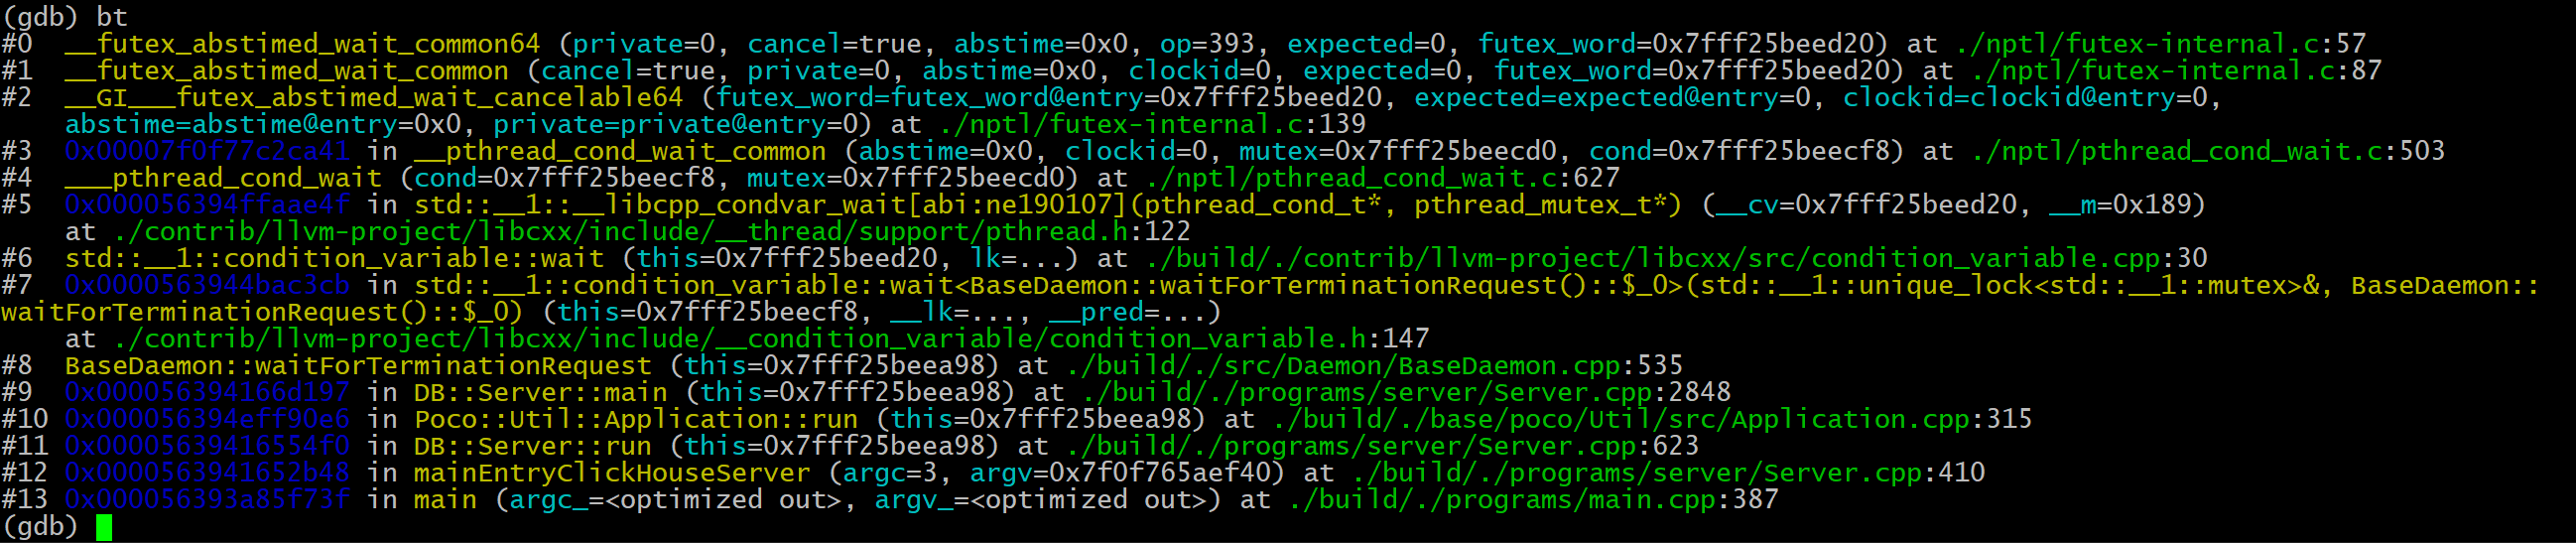 Example of a stack backtrace displayed in the gdb debugger