Add grafana
|
NOTE
The Add grafana action is available for the Metrics storage service.
|
The Add grafana action allows you to add the Grafana component to the cluster hosts. See Monitoring for more information on this component.
To run the action, go to the Clusters page, click an ADPG cluster, and switch to the Services tab. Click ![]()
![]() in the Actions column and select the action from the drop-down list that appears.
in the Actions column and select the action from the drop-down list that appears.
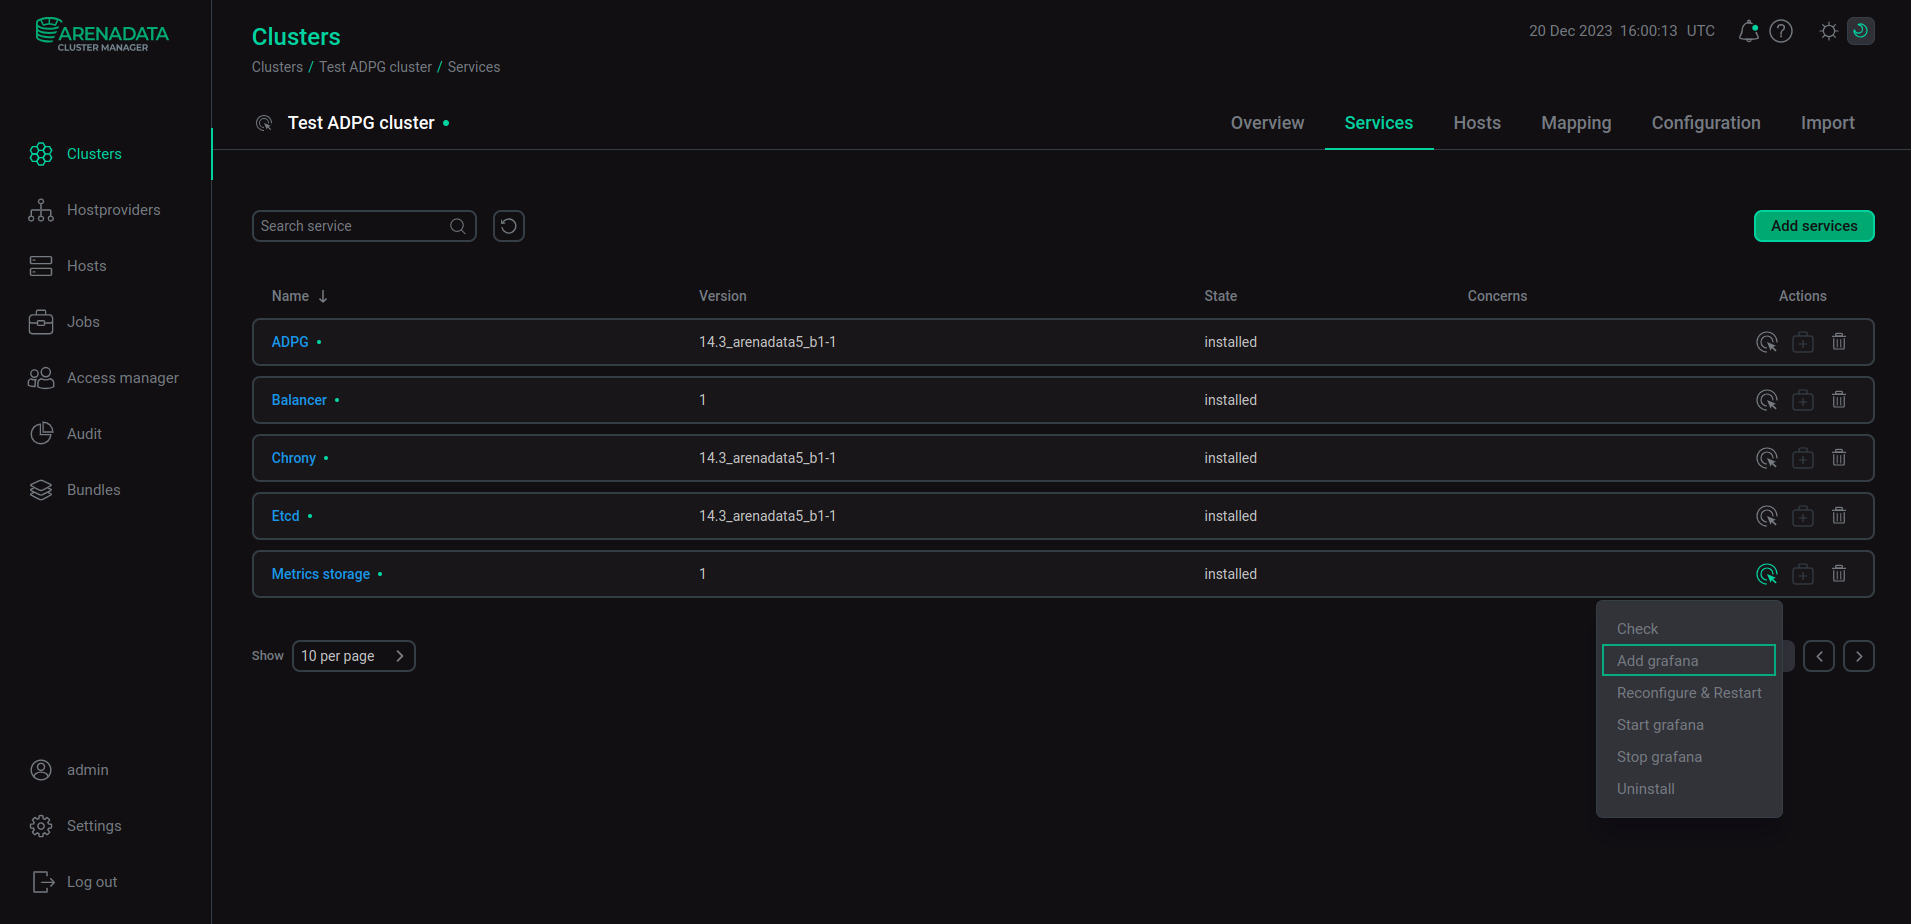
When you choose Add grafana, ADCM displays a dialog window to specify settings for the action.
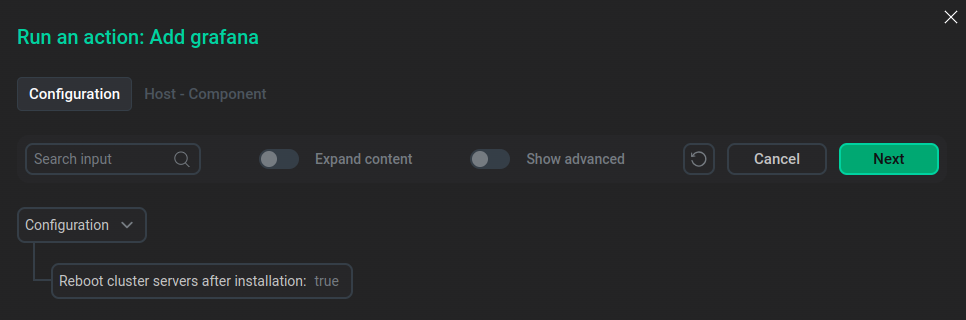
In the Run an action dialog window, you can choose whether ADCM reboots cluster servers after installation.
Click Next to open the tab where you can add cluster hosts to the Grafana component. The Host — Component tab is opened.
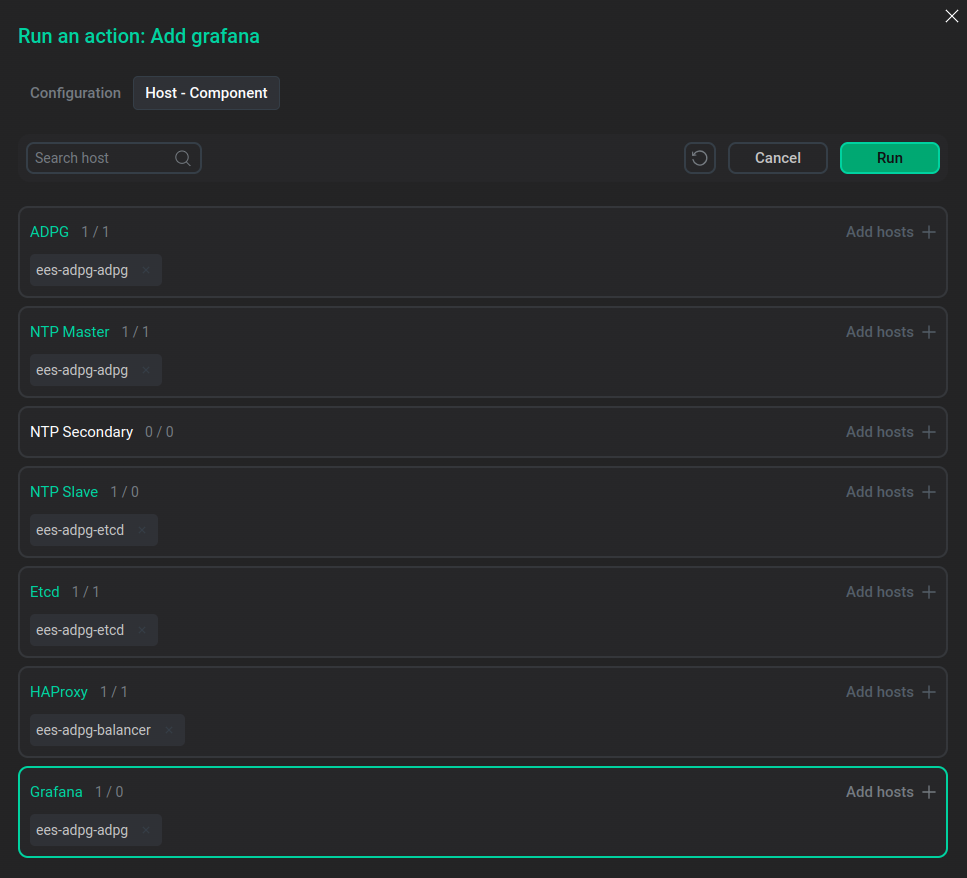
Click Add hosts and select a host for the Grafana component from the list that appears. The list displays hosts added to the cluster. To add a new host to the cluster, go to the Hosts page.
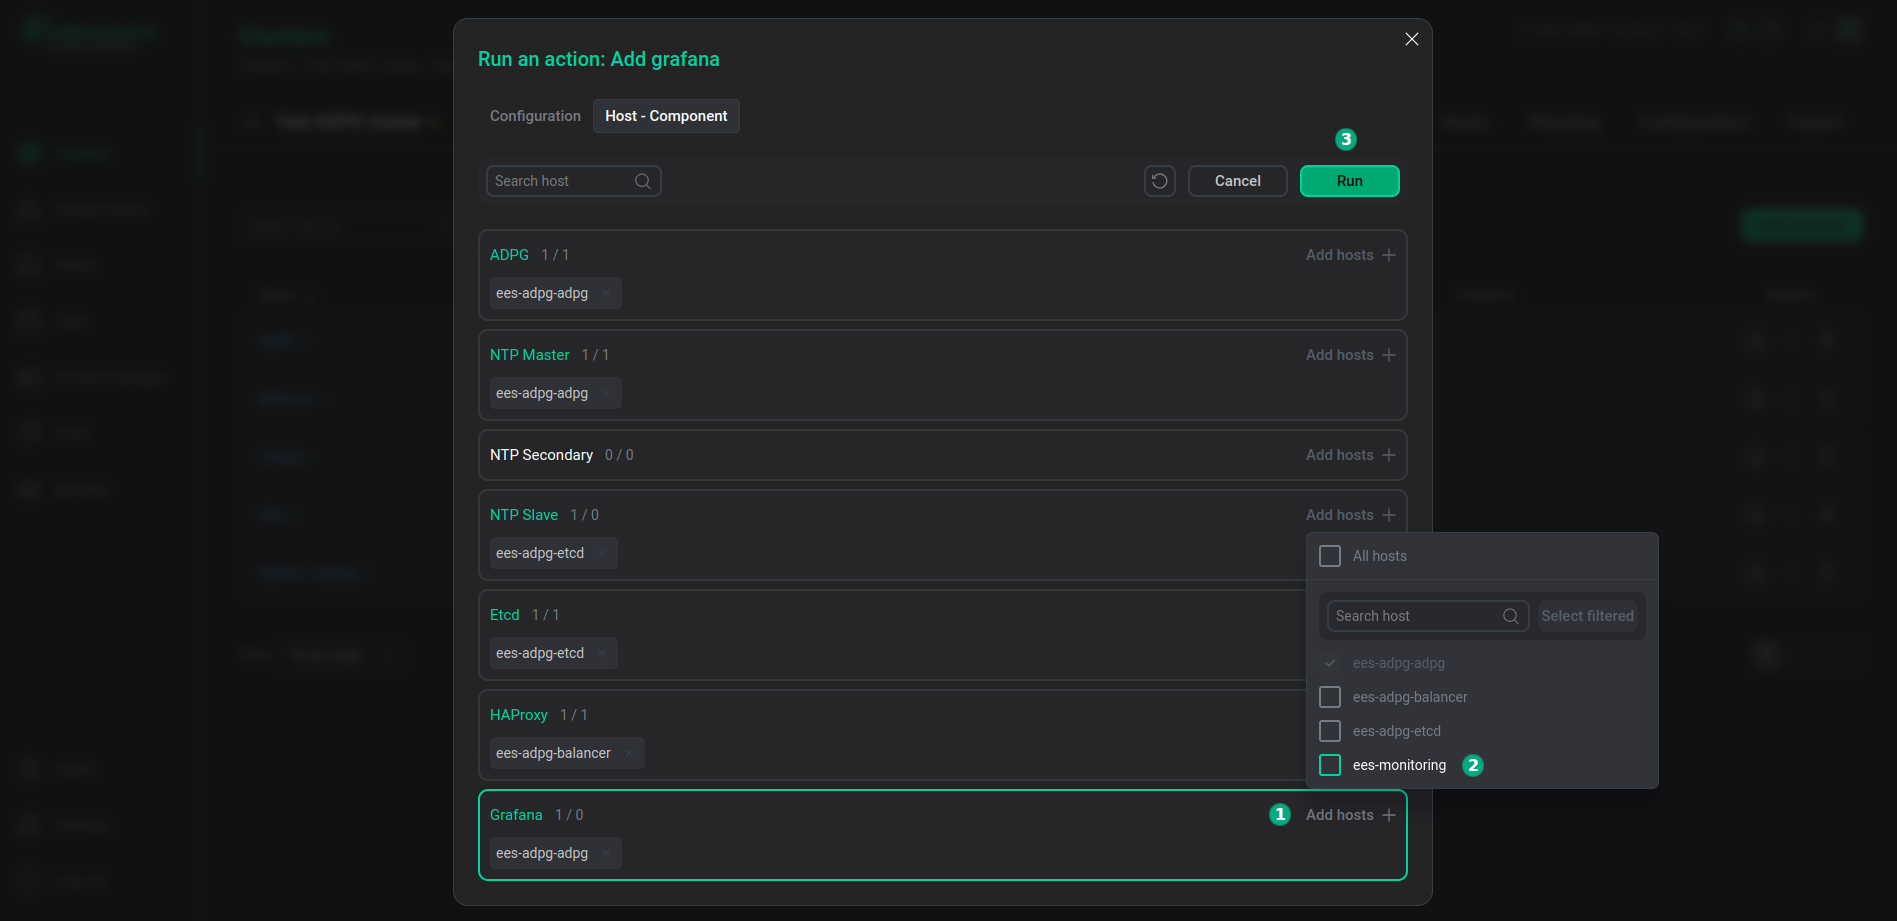
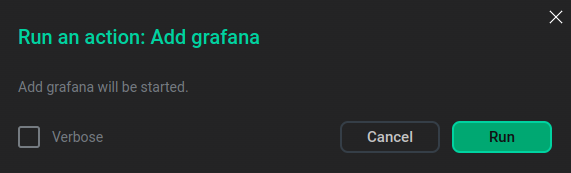
After the host is added, click Run.
In the next dialog window, click Run to confirm the action. You can also enable the Verbose checkbox to see additional execution details on the Jobs page.