

Configure services
-
Select a cluster on the Clusters page. To do this, click a cluster name in the Name column.
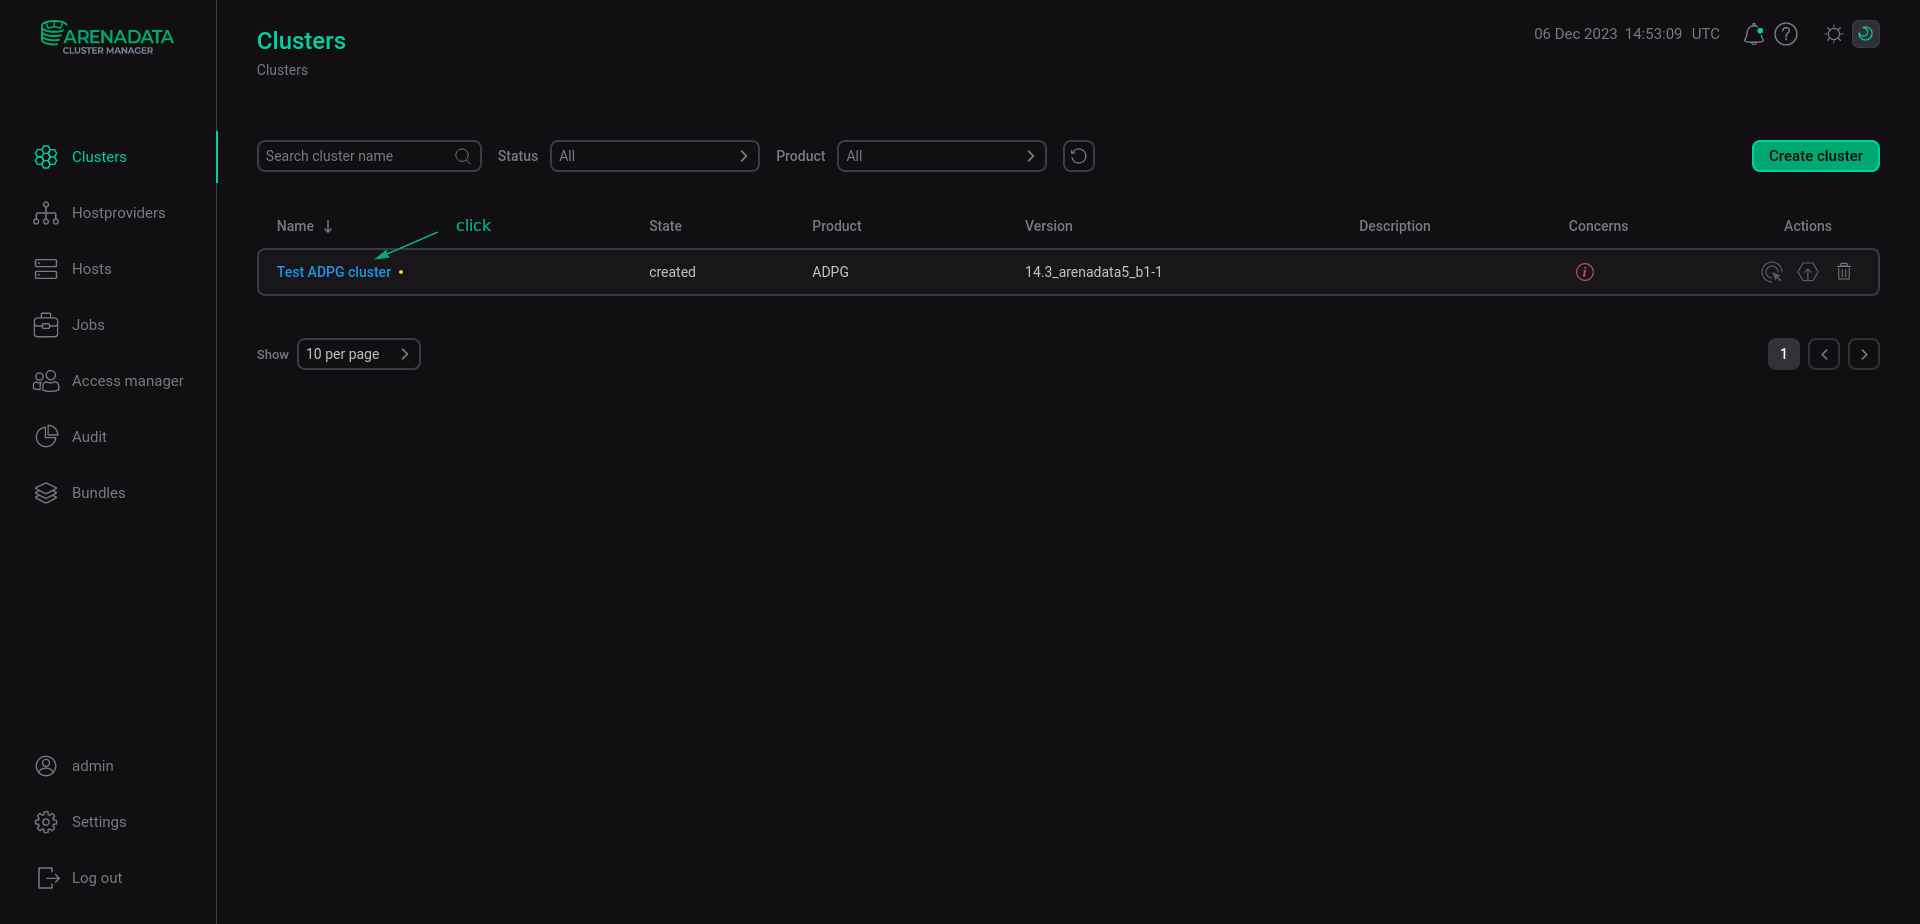 Select a cluster
 -
Open the Services tab on the cluster page, find the row that contains the desired service, and click its name in the Name column.
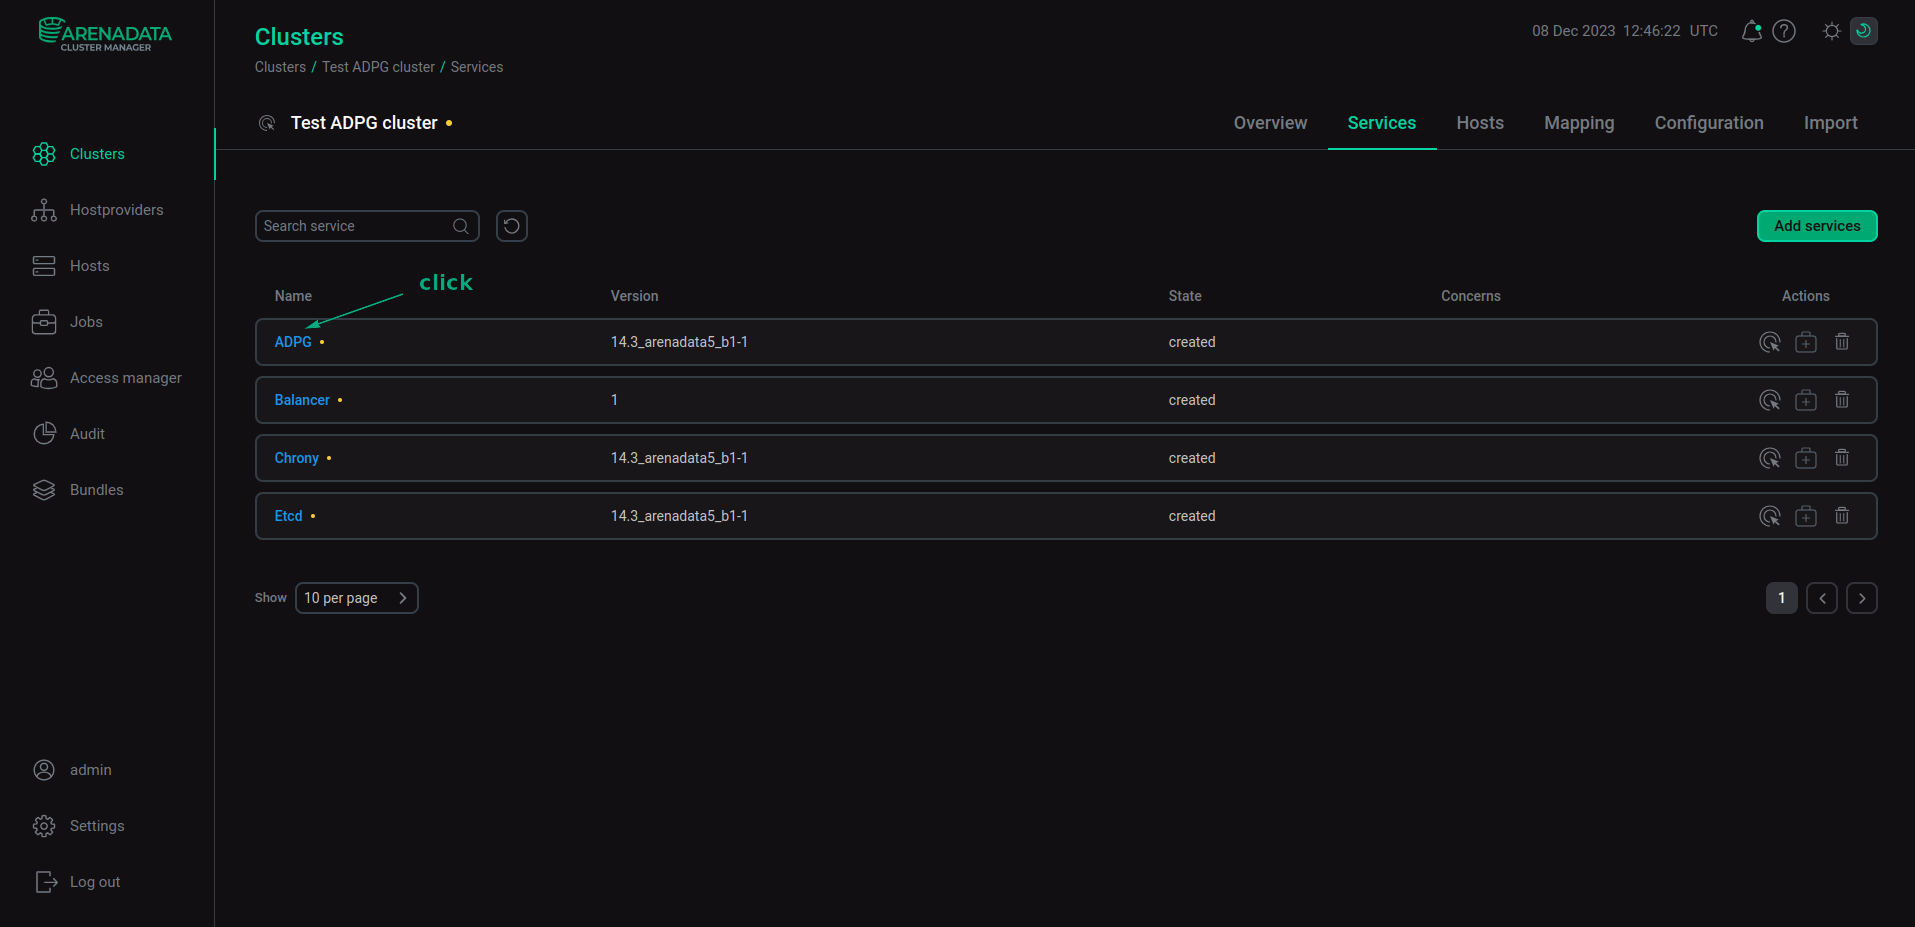 Switch to configuring a service
 -
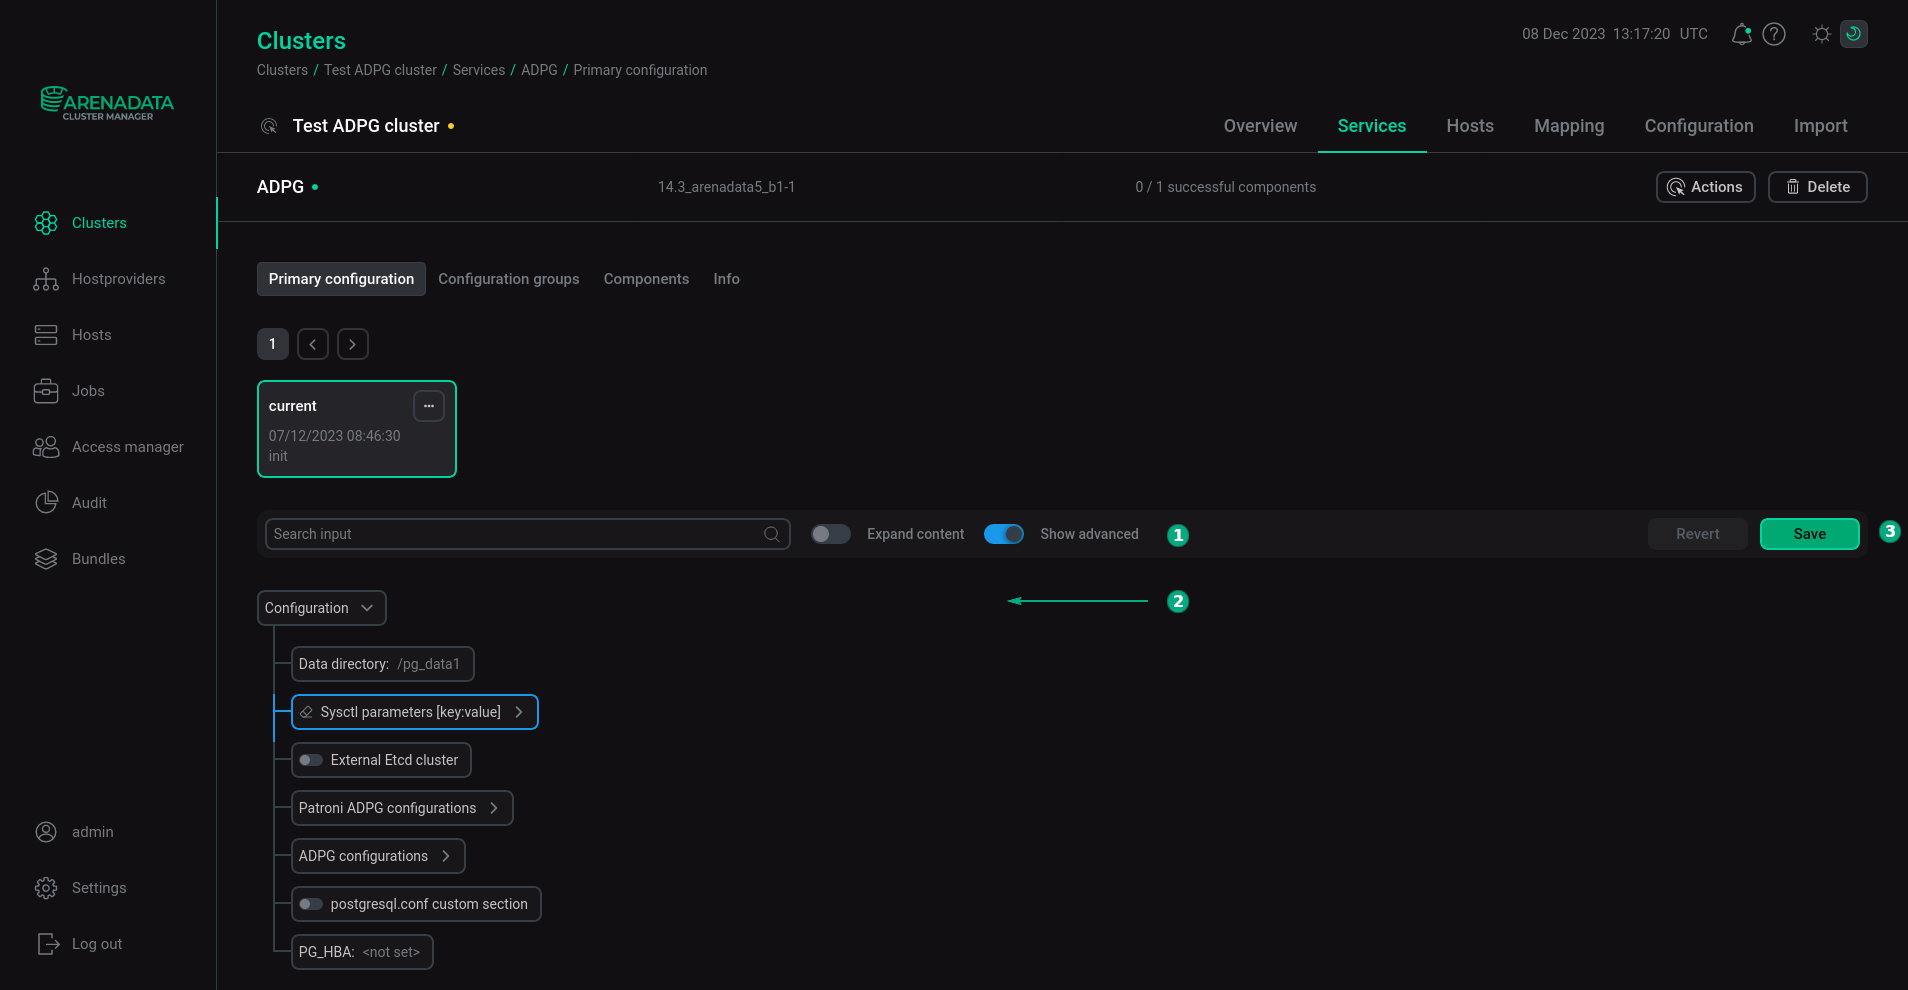
In the window that opens:
-
Open the Primary Configuration tab.
-
Switch on the Show advanced toggle.
-
Fill in configuration parameters of the selected service. The fields highlighted in red are mandatory.
-
Click Save.
 Configure a service
Pay attention to the following parameters:
-
The Chrony service — the NTP servers parameter. Though this parameter is optional, we recommend to set it to the nearest NTP server, e.g. the one that your company uses.
-
The Monitoring service — the Prometheus settings → Password for Grafana connection parameter — a password of a Grafana user (
admprom_grafana) that is used to connect to Prometheus. The password should contain a combination of numbers, symbols, lowercase and uppercase letters and have a minimum length of 8. -
The Monitoring service — the Grafana settings → Grafana administrator’s password parameter — a password of the Grafana
adminuser. The password should contain a combination of numbers, symbols, lowercase and uppercase letters and have a minimum length of 8.
-
|
NOTE
For more information about service configuration parameters, see Configuration parameters in the References. |