

Logging
This topic describes how to configure ADPG log settings and view log files.
Configure log settings
Use ADCM to define log settings.
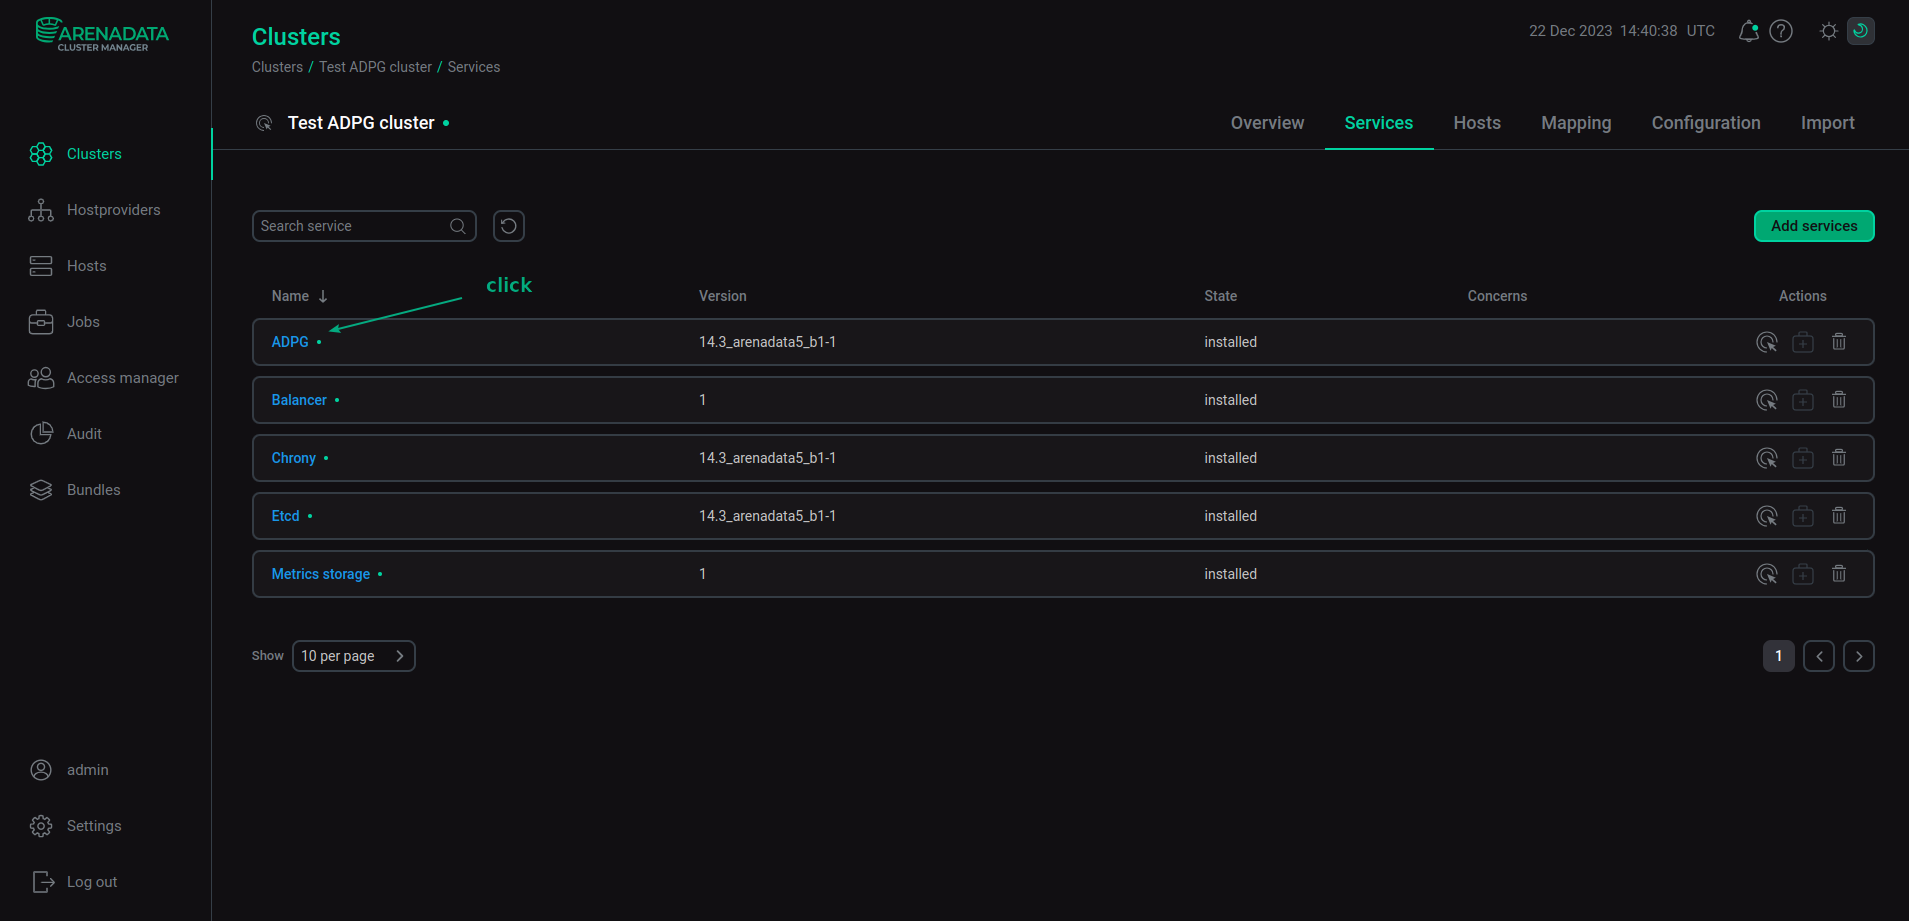
Open the Clusters page and click the ADP cluster. Open the Services tab and click the ADPG service.
The Primary configuration tab of the ADPG service is opened. Expand the ADPG configurations node and click postgresql.conf.
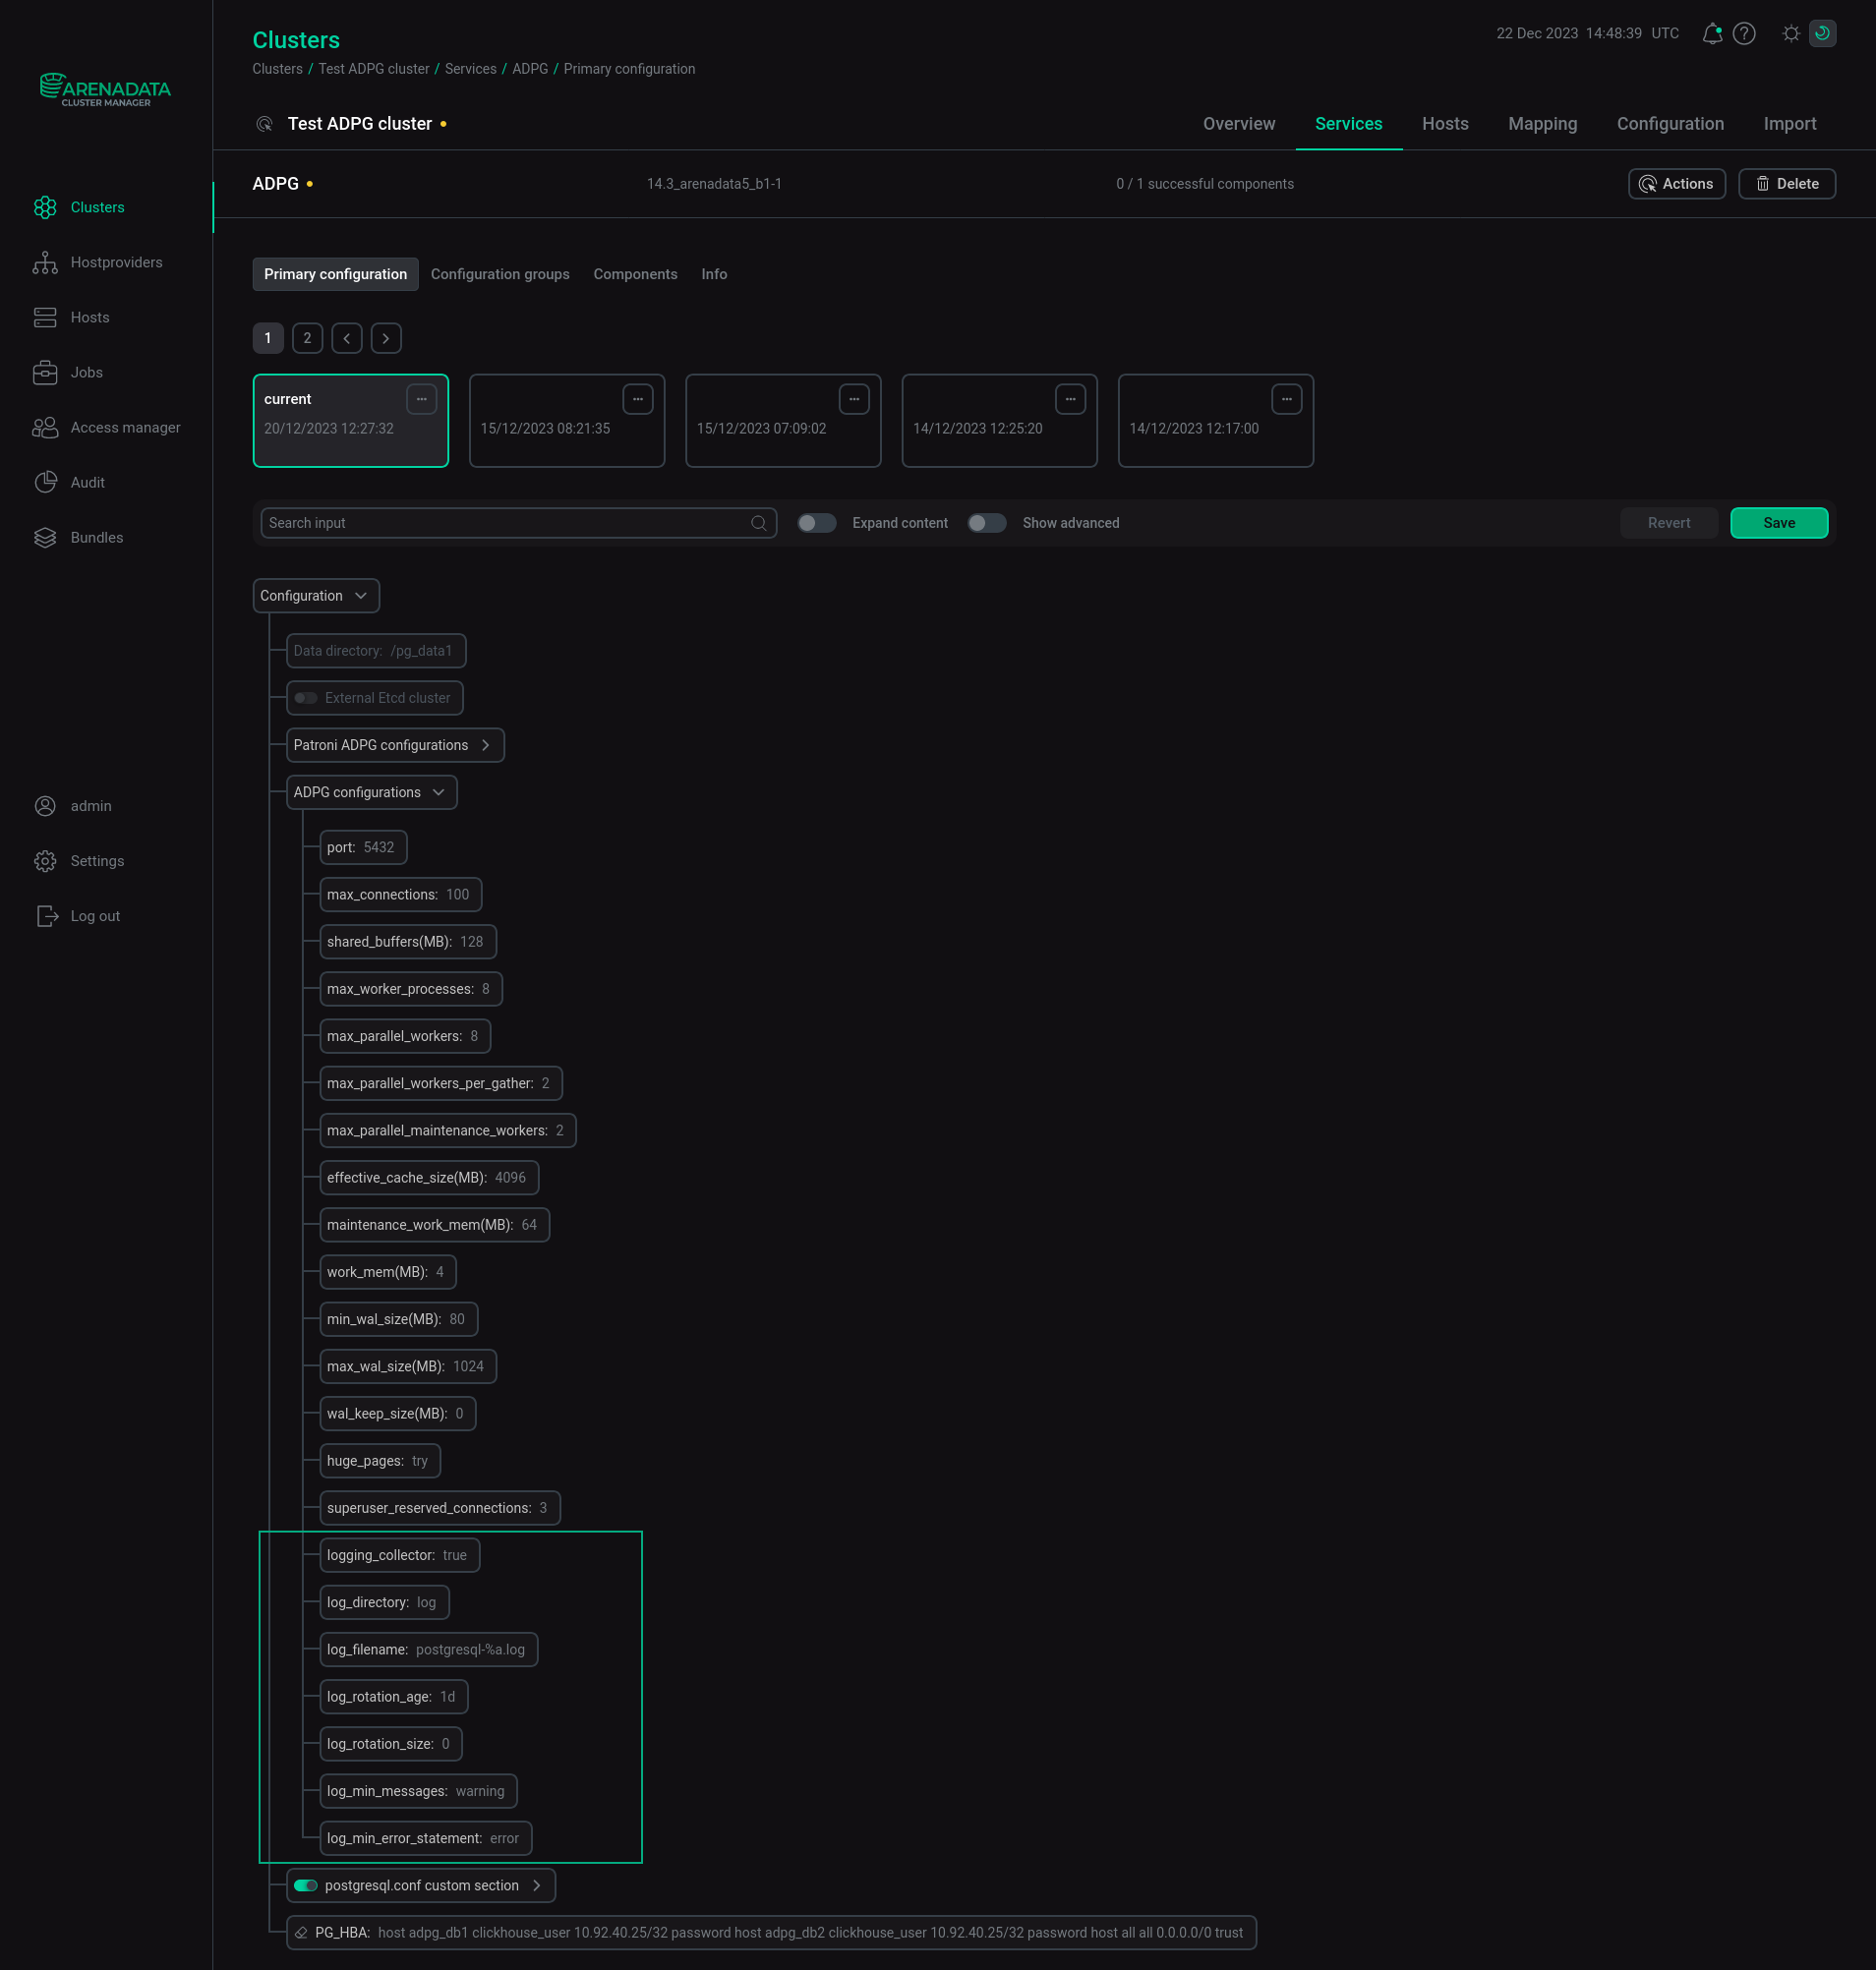
The text field with configuration parameters is displayed. In this field, you can specify the required logging parameters.
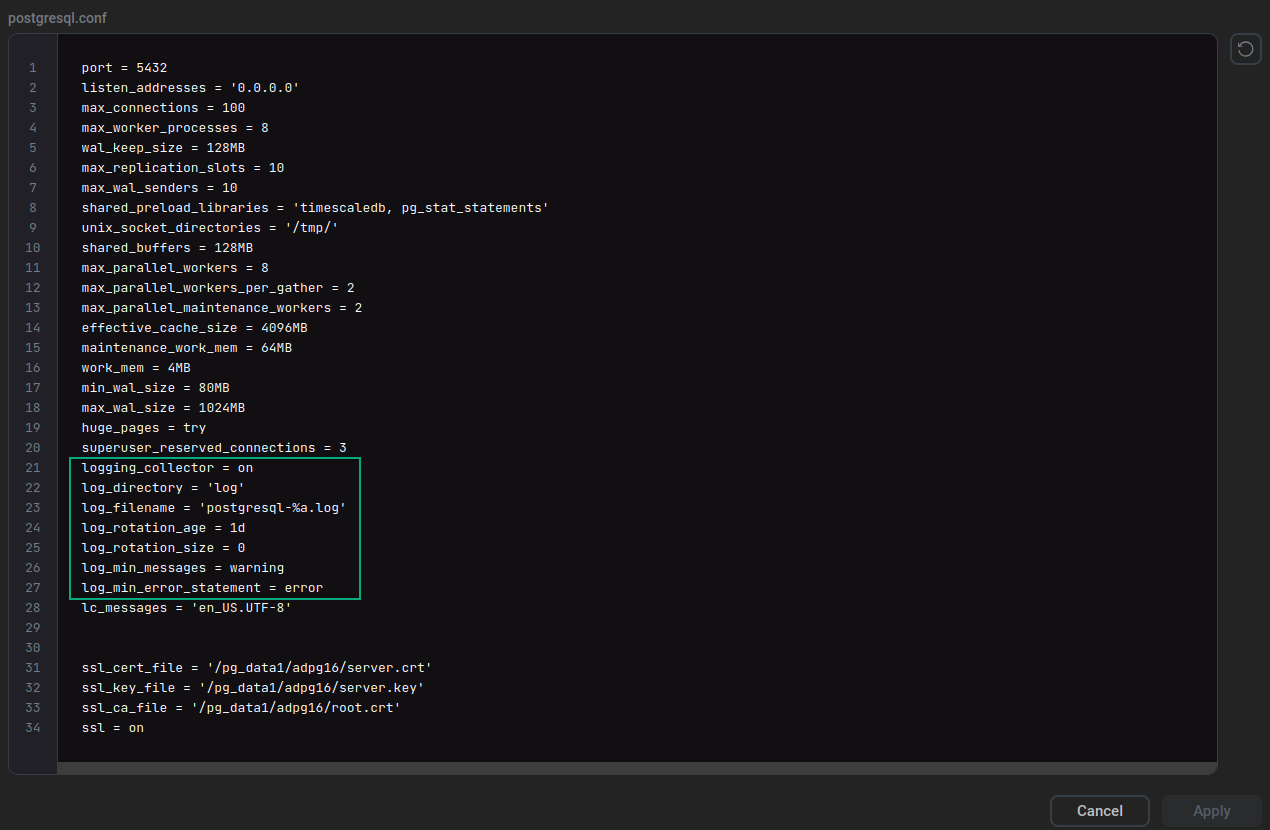
The most frequently used log settings are listed in the table.
| Parameter name | Description | Default value |
|---|---|---|
logging_collector |
Enables the logging collector. The logging collector is a background process that captures log messages sent to stderr and redirects them into log files |
The logging collector is enabled ( |
log_directory |
Determines the directory that contains log files. It can be specified as an absolute path, or relative to the cluster data directory |
log |
log_filename |
Specifies the log file name pattern. The value can include strftime %-escapes to define time-varying file names. If you specify a file name pattern without escapes, use a log rotation utility to save disk space |
postgresql-%a.log |
log_rotation_age |
Determines the maximum period of time to use a log file, after which a new log file is created. If this value is specified without units, it is taken as minutes. Set |
1d |
log_rotation_size |
Determines the maximum size of a log file. After a log file reaches the specified size, a new log file is created. If the value is set without units, it is taken as kilobytes. Set |
0 |
log_min_messages |
Specifies the minimum severity level of messages that are written to a log file. Valid values are |
warning |
log_min_error_statement |
Specifies which SQL statements that cause errors are logged. Valid values are |
error |
Log message severity levels are listed below.
| Value | Description |
|---|---|
Debug1..Debug5 |
Detailed information for developers. |
Info |
Information implicitly requested by a user, for example, output from |
Notice |
Information that can be helpful to users, for example, a notification about truncation of long identifiers |
Warning |
A warning about a possible problem, for example, |
Error |
An error that aborts the current command |
Log |
Information for administrators, for example, checkpoint activity |
Fatal |
The current session is aborted due to an error |
Panic |
All database sessions are aborted |
If you modify log settings, run the Reconfigure & Restart action of the ADPG service to apply changes.
The settings listed above are standard PostgreSQL server configuration parameters. For additional information about these settings, see the following topic: Error Reporting and Logging.
|
CAUTION
When the ADPG service executes the Reconfigure & Restart action, postgresql.conf is rewritten with settings specified in Services → ADPG → Configuration. If you make changes directly to postgresql.conf, these changes will be lost.
|
View log files
You can find logs on the host where ADPG is installed.
-
Connect to the host (for example, via SSH), run the ls command, and pass a path to the log file directory as a parameter:
$ sudo ls -la /pg_data1/adpg16/logLog files in the specified directory are listed:
total 10708
drwx------  2 postgres postgres     136 May 26 00:00 .
drwx------ 20 postgres postgres    4096 May 26 08:54 ..
-rw-------  1 postgres postgres    1009 May 20 13:31 postgresql-Fri.log
-rw-------  1 postgres postgres     596 May 23 06:30 postgresql-Mon.log
-rw-------  1 postgres postgres 3803084 May 26 10:04 postgresql-Thu.log
-rw-------  1 postgres postgres     988 May 24 07:37 postgresql-Tue.log
-rw-------  1 postgres postgres 3343041 May 25 23:59 postgresql-Wed.log
-
You can use the tail command to view a log file content:
$ sudo tail /pg_data1/adpg16/log/postgresql-Mon.logResult:
2022-05-23 06:30:40.804 GMT [951] LOG:  starting PostgreSQL 14.2 on x86_64-pc-linux-gnu, compiled by gcc (GCC) 4.8.5 20150623 (Red Hat 4.8.5-44), 64-bit
2022-05-23 06:30:40.804 GMT [951] LOG:  listening on IPv6 address "::1", port 5432
2022-05-23 06:30:40.804 GMT [951] LOG:  listening on IPv4 address "127.0.0.1", port 5432
2022-05-23 06:30:40.813 GMT [951] LOG:  listening on Unix socket "/tmp/.s.PGSQL.5432"
2022-05-23 06:30:40.845 GMT [1079] LOG:  database system was shut down at 2022-05-20 13:31:40 GMT
2022-05-23 06:30:40.972 GMT [951] LOG:  database system is ready to accept connections