ADP monitoring metrics
This article describes available ADP monitoring dashboards. For information on monitoring and its installation, refer to the Install monitoring and Monitoring articles.
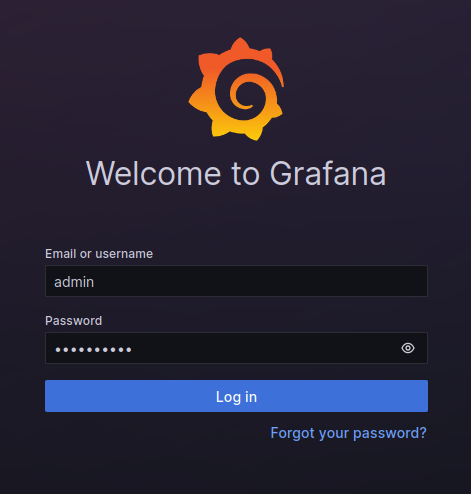
ADP uses Grafana to visualize metrics. To view metric dashboards, enter the address of the host where the Grafana component is deployed and add the port number — the Grafana listen port parameter value (the default value is 11210). For example, http://10.92.6.91:11210. For login, use admin as a username and the Grafana administrator’s password parameter value as a password. You can find the Grafana parameters on the Configuration tab of the Monitoring service.
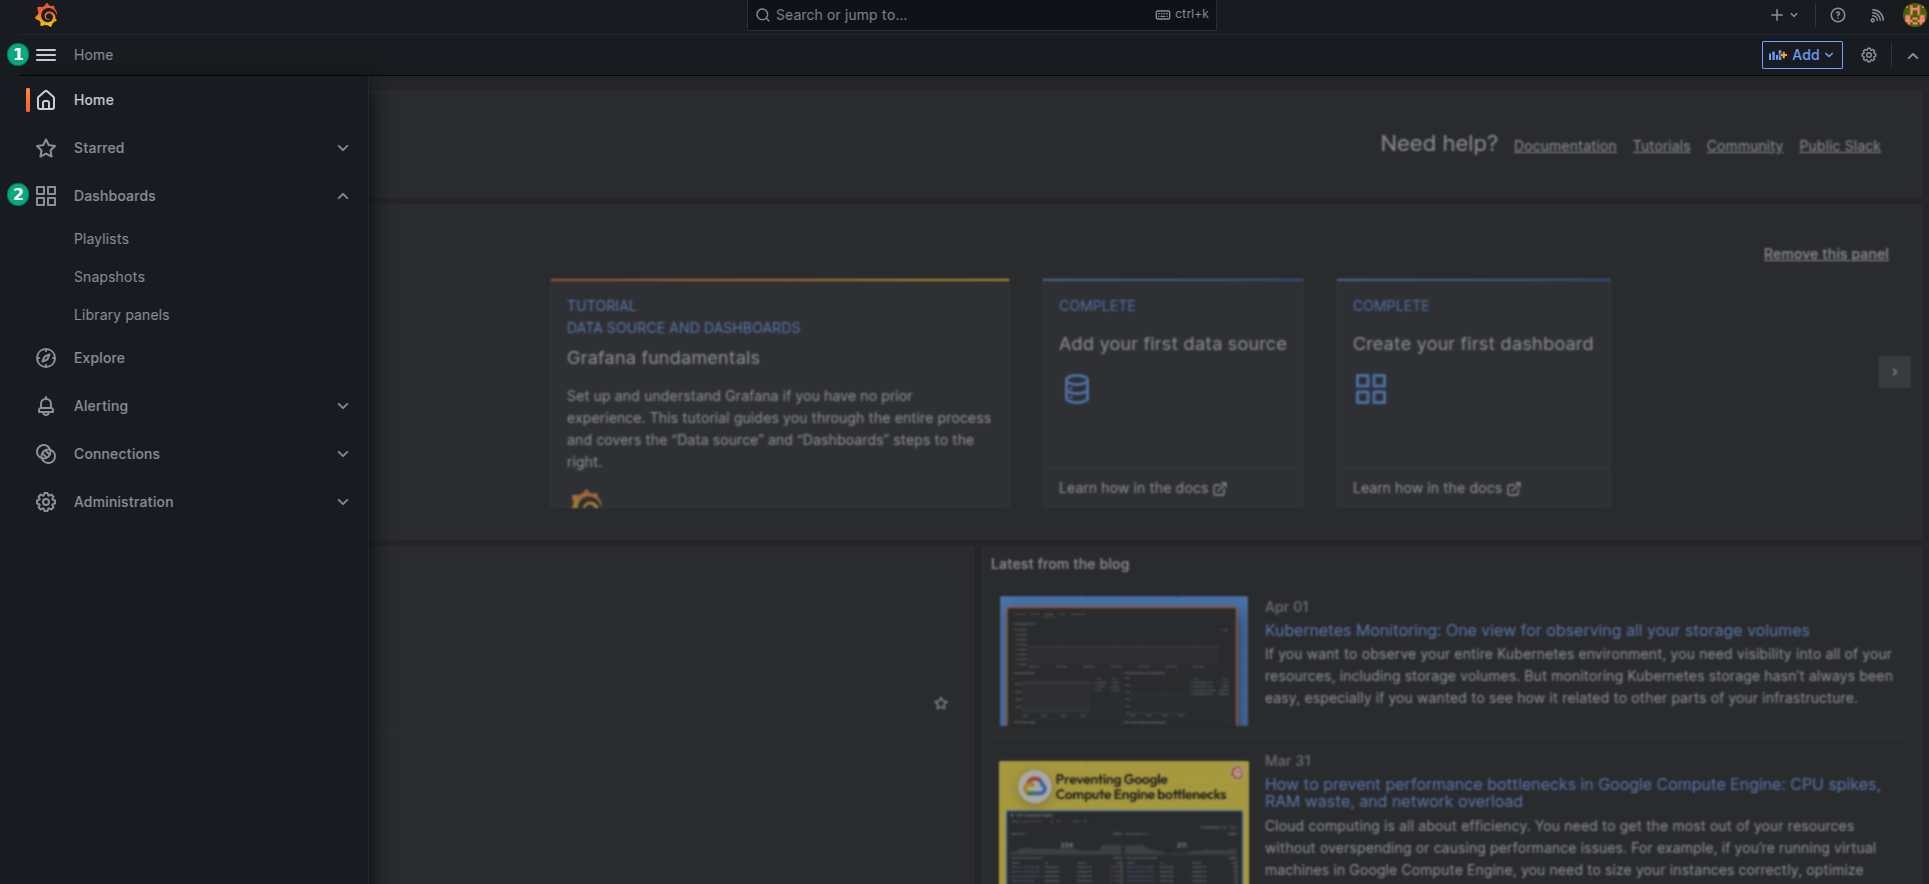
Expand the Grafana menu and click the Dashboards item.
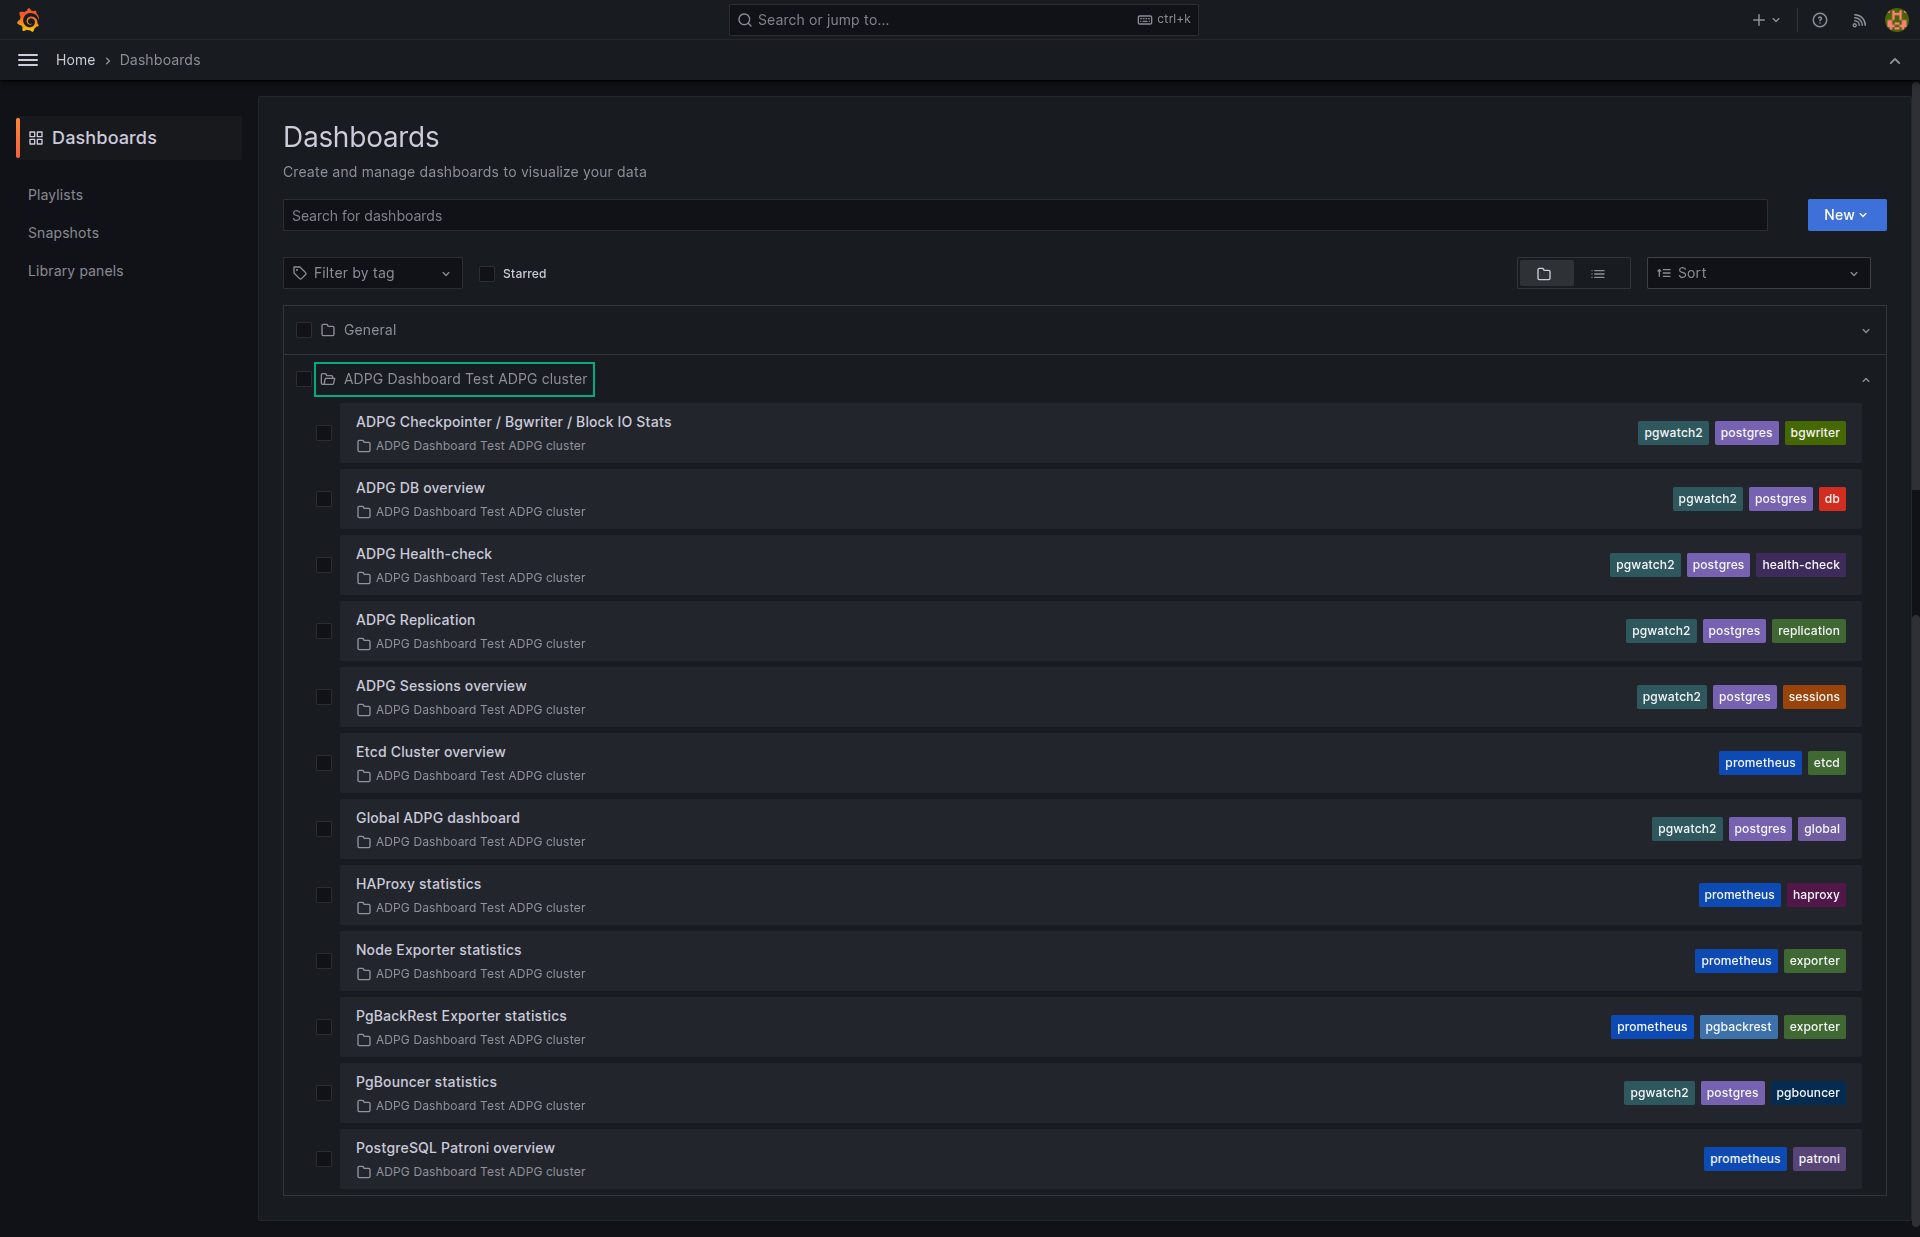
The page with the dashboard list will be displayed. Expand the ADPG Dashboard… item for your cluster to display available dashboards.
|
NOTE
You need to create the |
You can find the following dashboards in Grafana:
-
ADPG Checkpointer / Bgwriter / Block IO Stats — displays statistics of checkpoints and bgwriter.
-
ADPG DB overview — visual graphs for ADP node characteristics.
-
ADPG Health-check — shows information on a selected cluster node.
-
ADPG Replication — displays replication parameters.
-
ADPG Sessions overview — contains visual graphs for session analysis.
-
Etcd Cluster overview — displays etcd cluster metrics.
-
Global ADPG dashboard — includes the general information on the system state and is supposed to be the first warning dashboard to detect problems.
-
HAProxy statistics — HAProxy statistics.
-
Node Exporter statistics — system metrics for each node in the cluster with the Node Exporter component.
-
PgBouncer statistics — displays PgBouncer statistics.
-
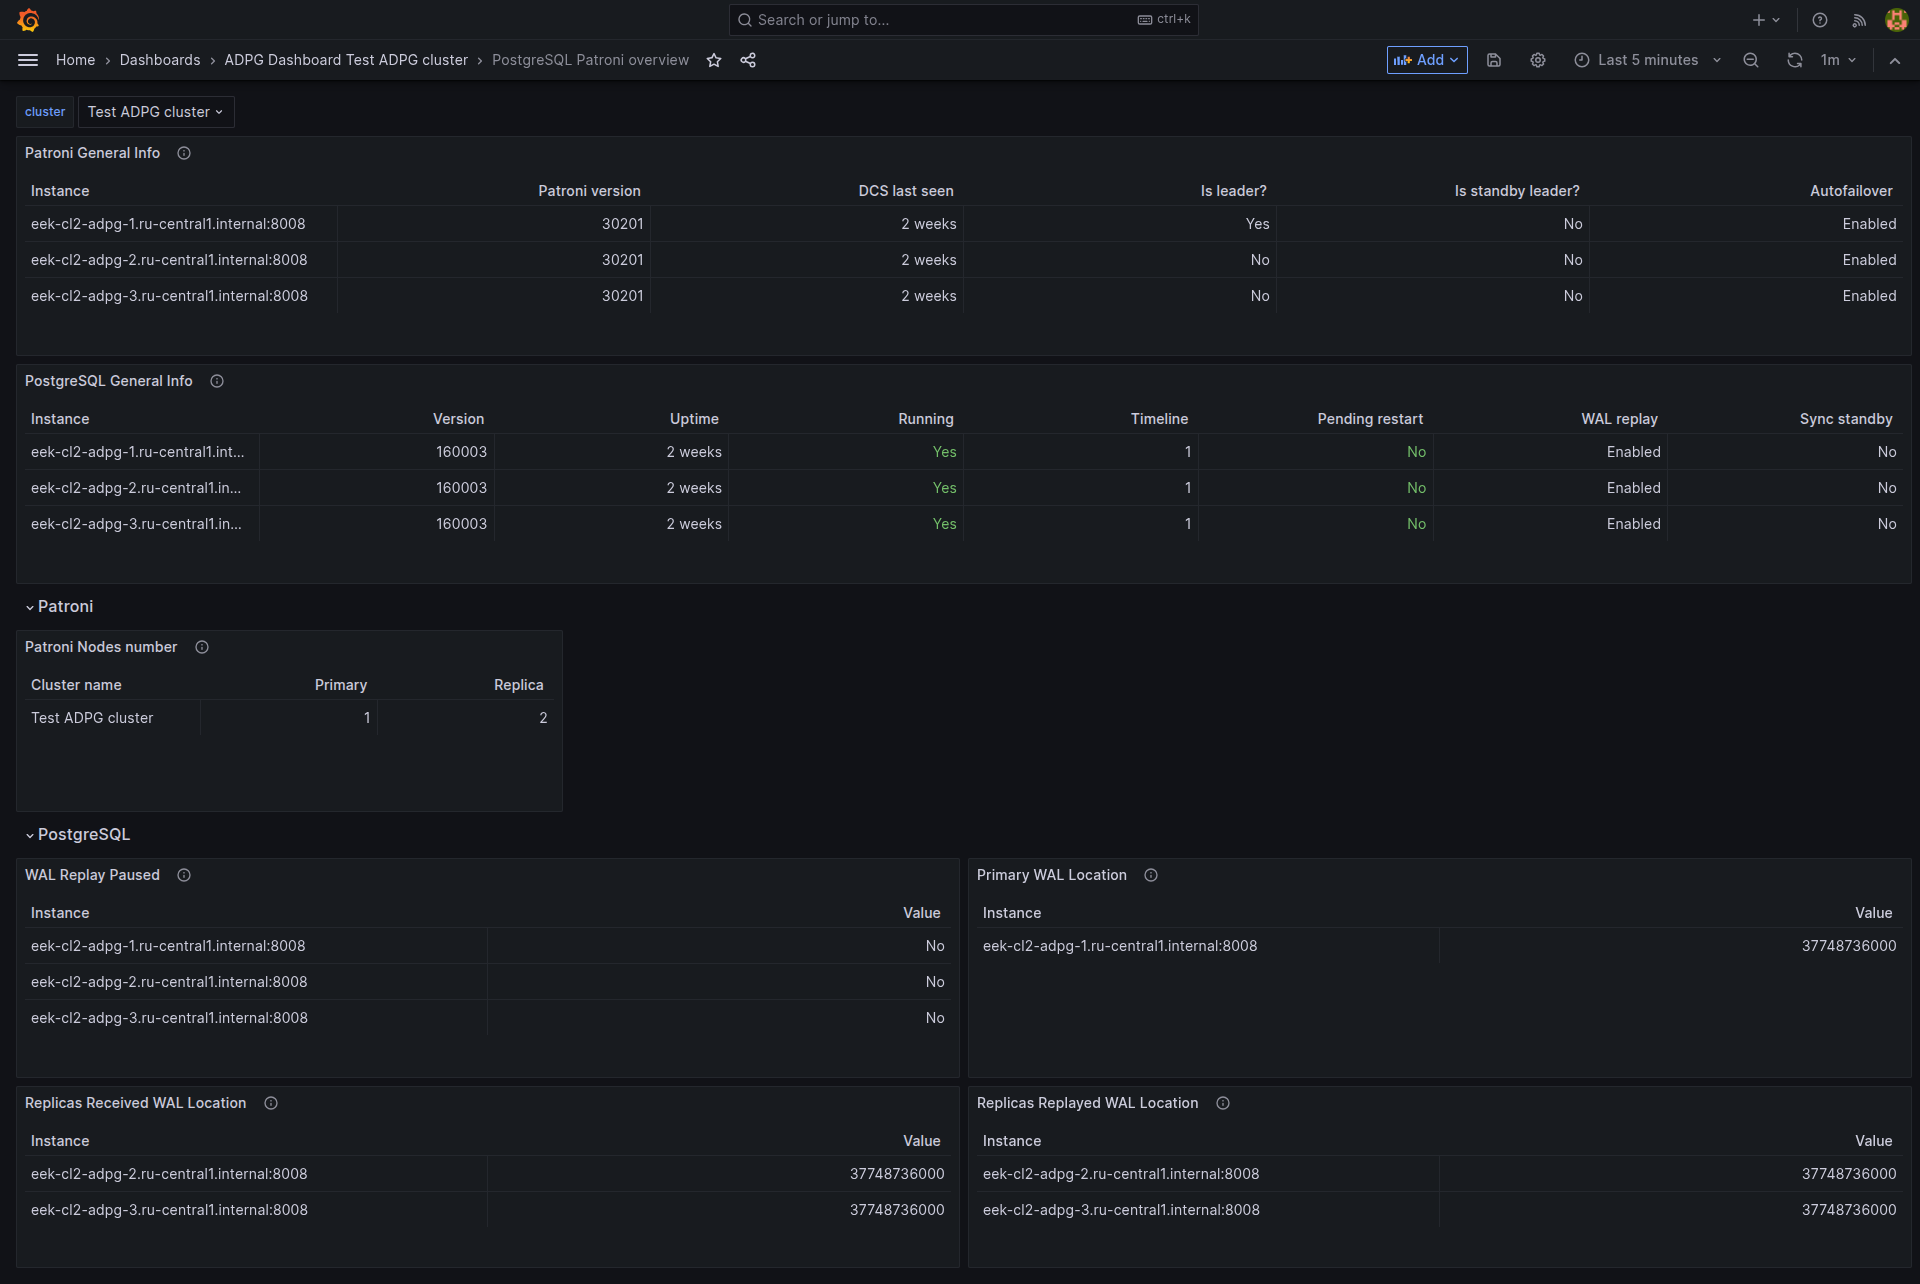
PostgreSQL Patroni overview — Patroni cluster data.
ADPG Checkpointer / Bgwriter / Block IO Stats
This dashboard contains statistics of checkpoints and bgwriter.
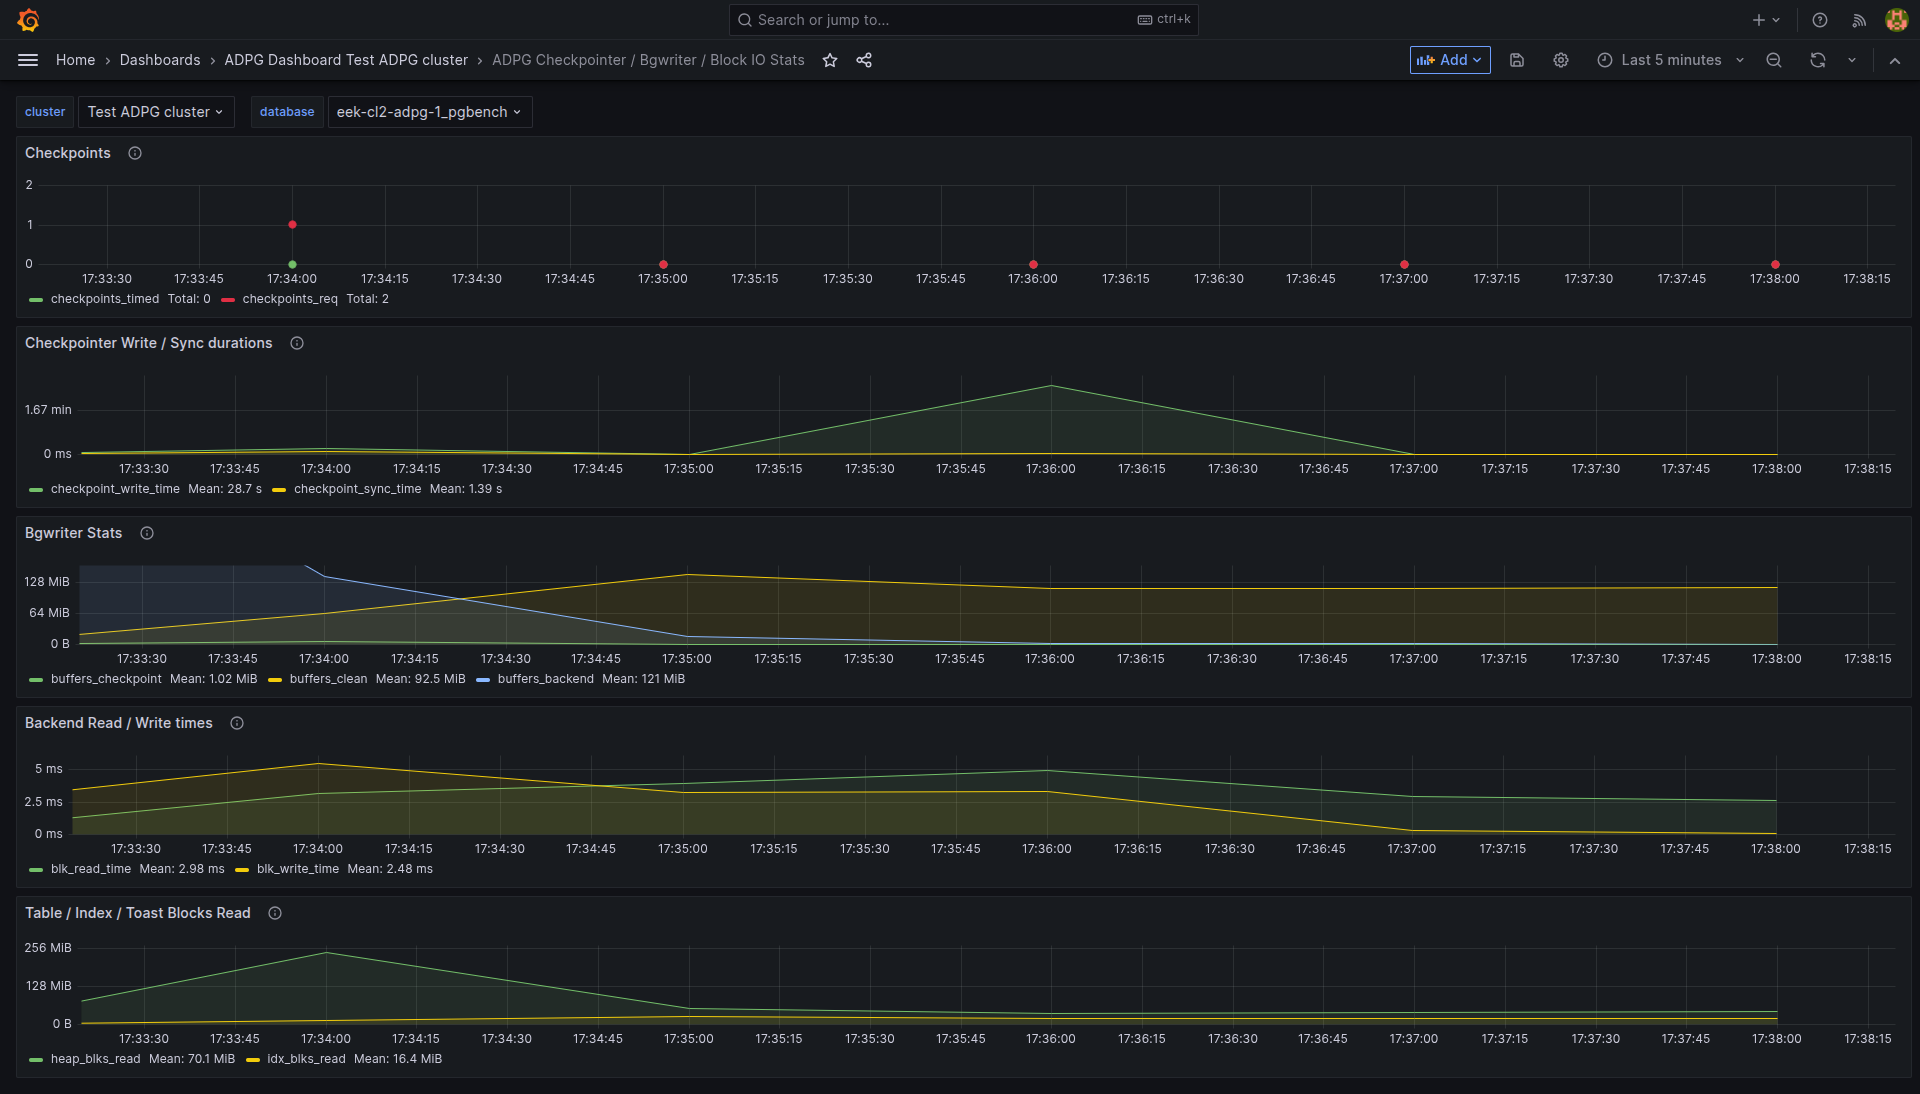
ADPG Checkpointer / Bgwriter / Block IO Stats includes the following graphs:
-
Checkpoints. It represents the number of checkpoints during the aggregation period.
-
Checkpointer Write / Sync durations.
-
Bgwriter Stats. It displays the
buffers_checkpoint,buffers_clean, andbuffers_backendvalues. -
Backend Read / Write times. It is based on the
pg_stat_databaseview. It requires that thetrack_io_timingoption is set toon. -
Table / Index / Toast Blocks Read. Information about the numbers of blocks of each type read from the database. Note, that Reads could be served by the file system cache.
ADPG DB overview
This dashboard contains visual graphs for ADP node characteristics and helps to analyze the weaknesses of a particular node.
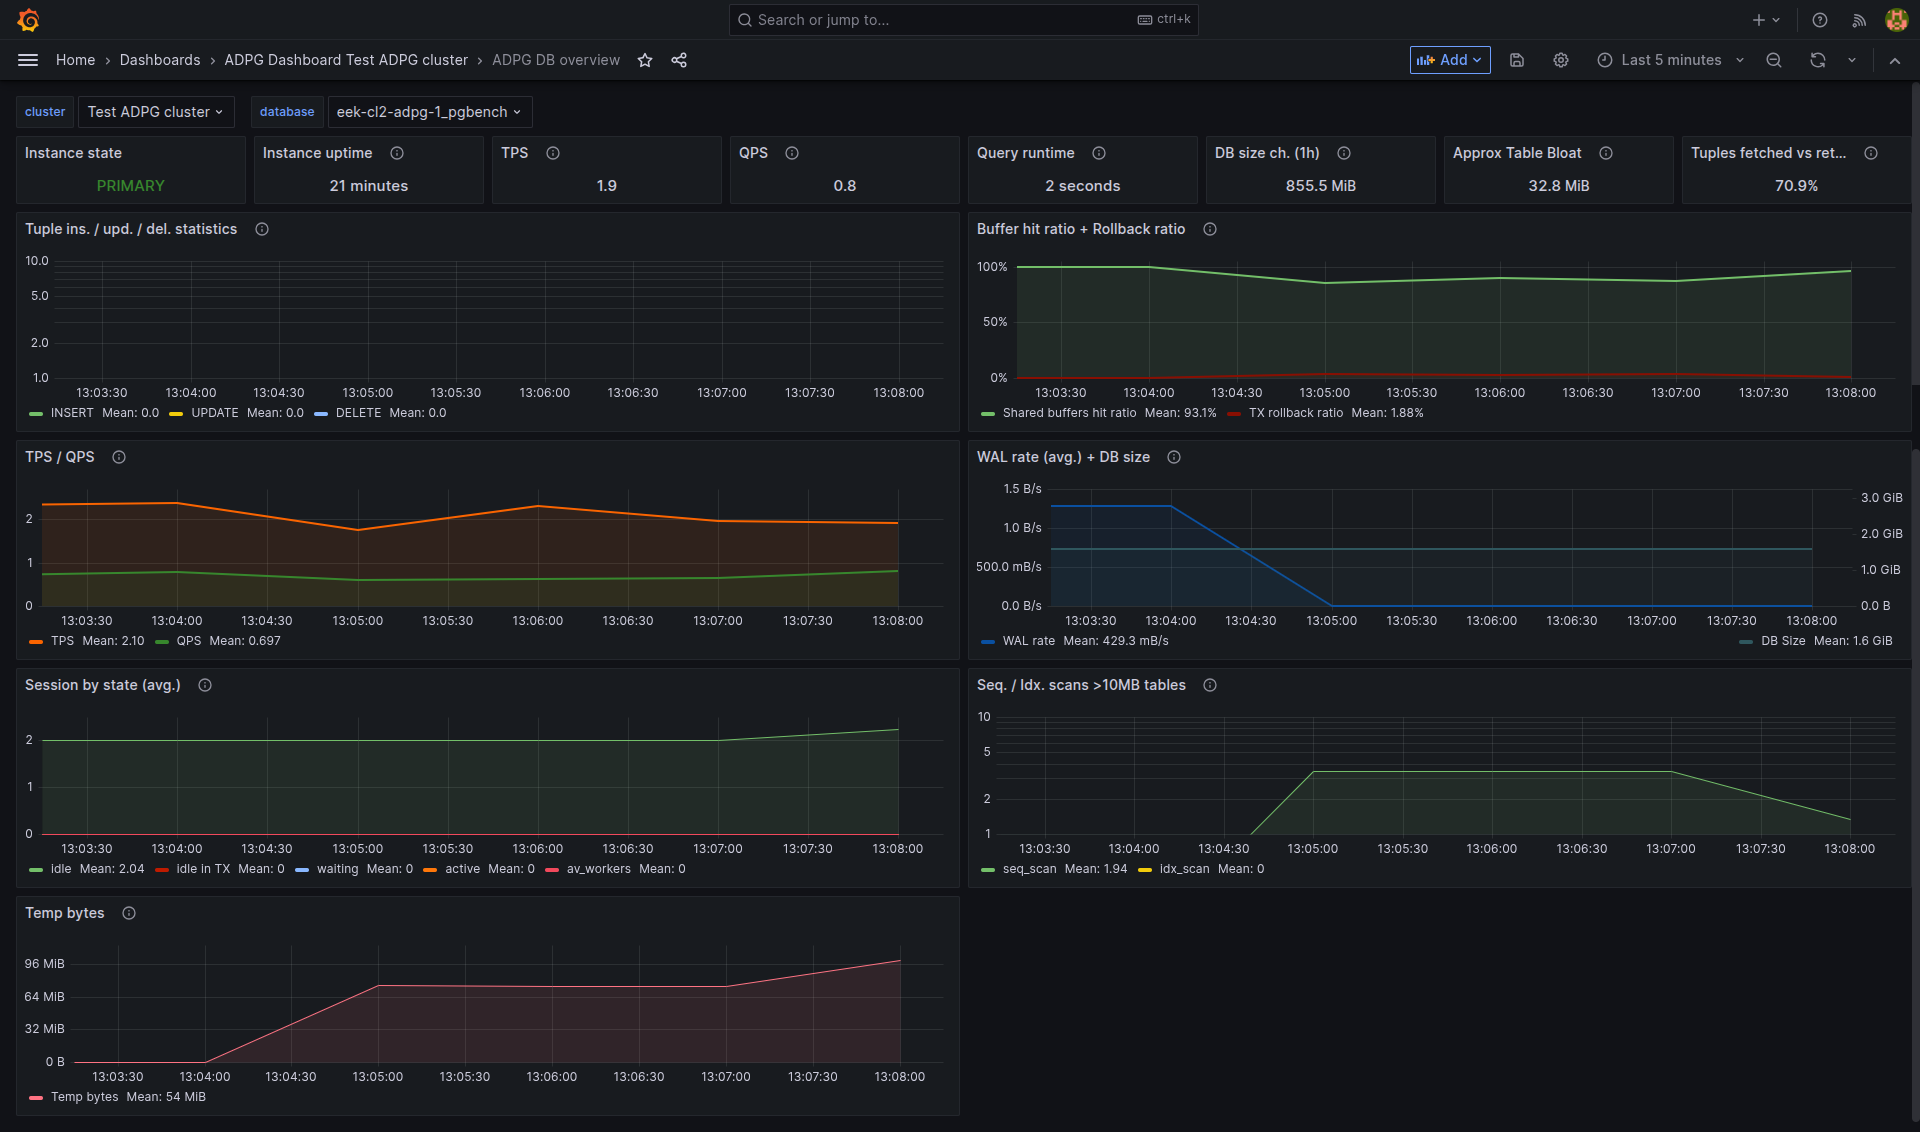
The ADPG DB overview dashboard includes the following states:
-
Instance state — PRIMARY/REPLICA.
-
Instance uptime.
-
TPS — transactions per second.
-
QPS — queries per second.
-
Query runtime — average query runtime.
-
DB size ch. (1h) — DB size that is calculated for each hour.
-
Approx Table Bloat.
-
Tuples fetched vs returned.
The ADPG DB overview dashboard contains the following graphs:
-
Tuple ins. / upd. / del. statistics.
-
Buffers hit ratio + Rollback ratio.
-
TPS / QPS avg.
-
WAL rate (avg.) + DB size.
-
Session by state (avg.).
-
Seq. / Idx. scans >10MB tables.
-
Temp bytes — it appears when large grouping and sorting operations require more memory than the
work_memvalue.
ADPG Health-check
This dashboard displays state characteristics of a specific database, which can be selected in the database filter at the top of the page.
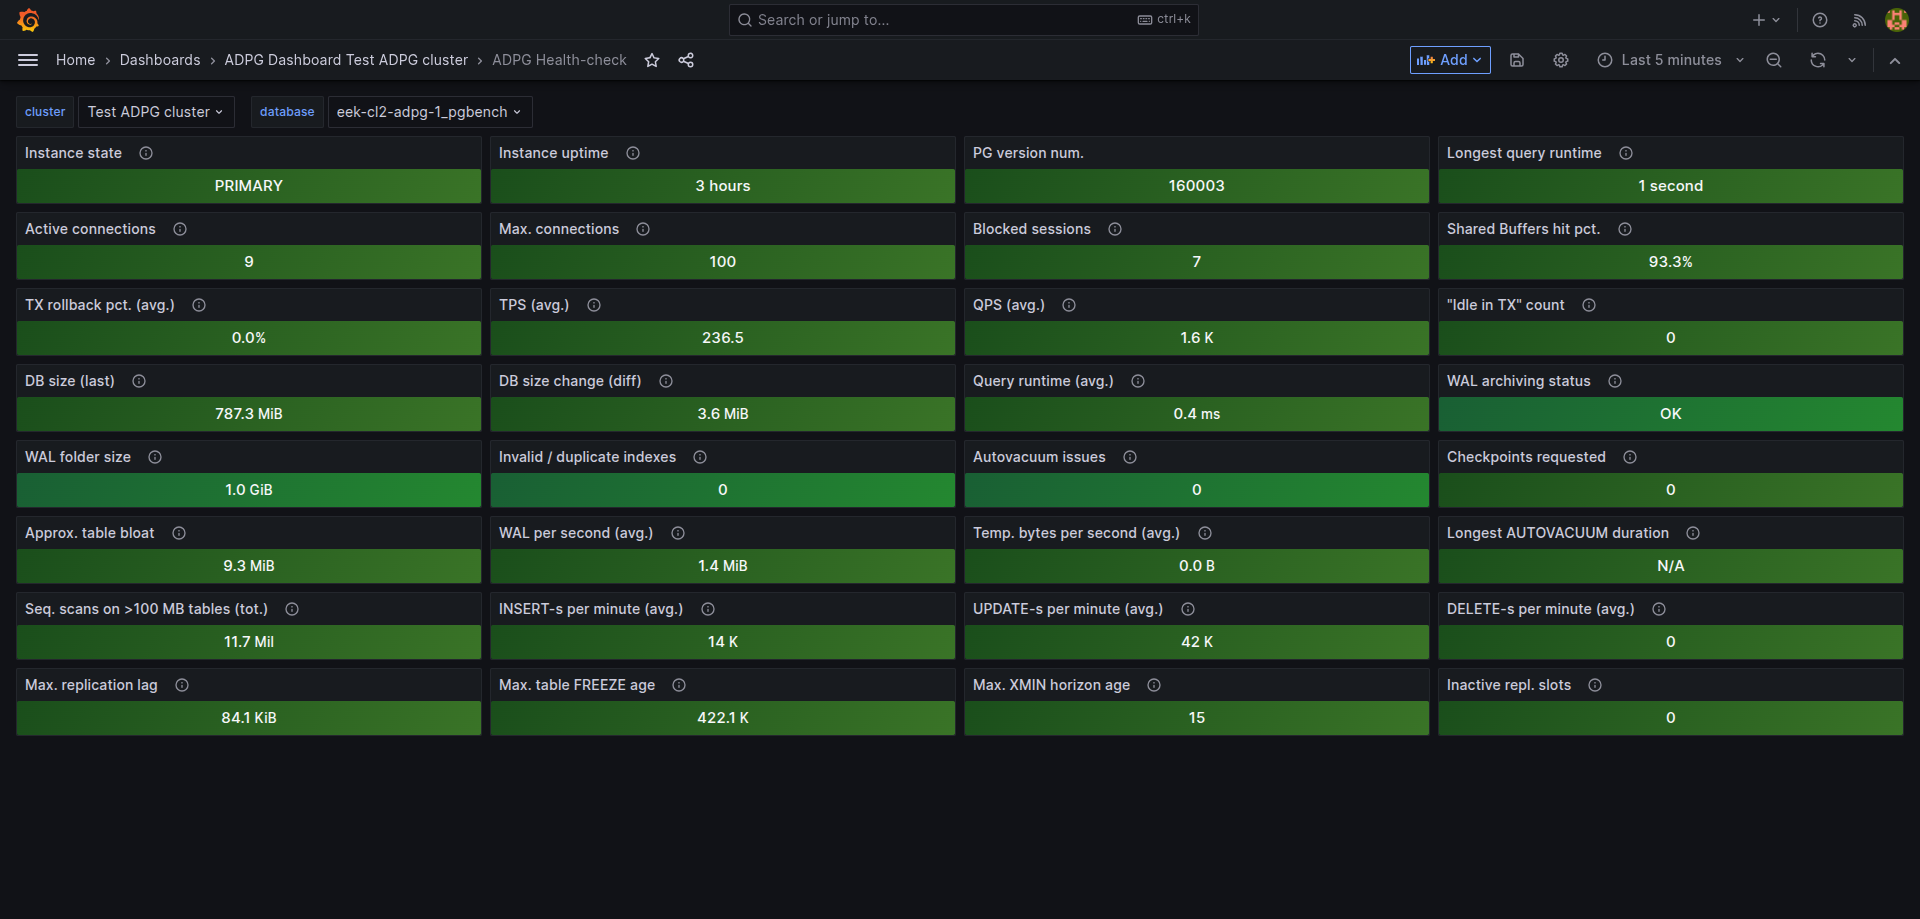
The ADPG Health-check dashboard includes the following states:
-
Instance state.
-
Instance uptime.
-
PG version number.
-
Longest query runtime.
-
Active connections.
-
Max. connections.
-
Blocked sessions.
-
Shared buffer hit pct.
-
TX rollback pct. (avg.).
-
TPS(avg.).
-
QPS(avg.).
-
"Idle" in TX count.
-
DB size(last).
-
DB size change(diff).
-
Query runtime(avg.).
-
WAL archiving status.
-
WAL folder size.
-
Invalid/duplicate indexes.
-
Autovacuum issues.
-
Checkpoints requested.
-
Approx. table bloat.
-
WAL per second(avg.).
-
Temp. bytes per second(avg.).
-
Longest AUTOVACUUM duration.
-
Seq. scans on >100 MB tables (tot.).
-
INSERT-s per minute(avg.).
-
UPDATE-s per minute(avg.).
-
DELETE-s per minute(avg.).
-
Max replication lag.
-
Max table FREEZE age.
-
Max. XMIN horizon age.
-
Inactive replication slots.
ADPG Replication
The ADPG Replication dashboard contains replication metrics.
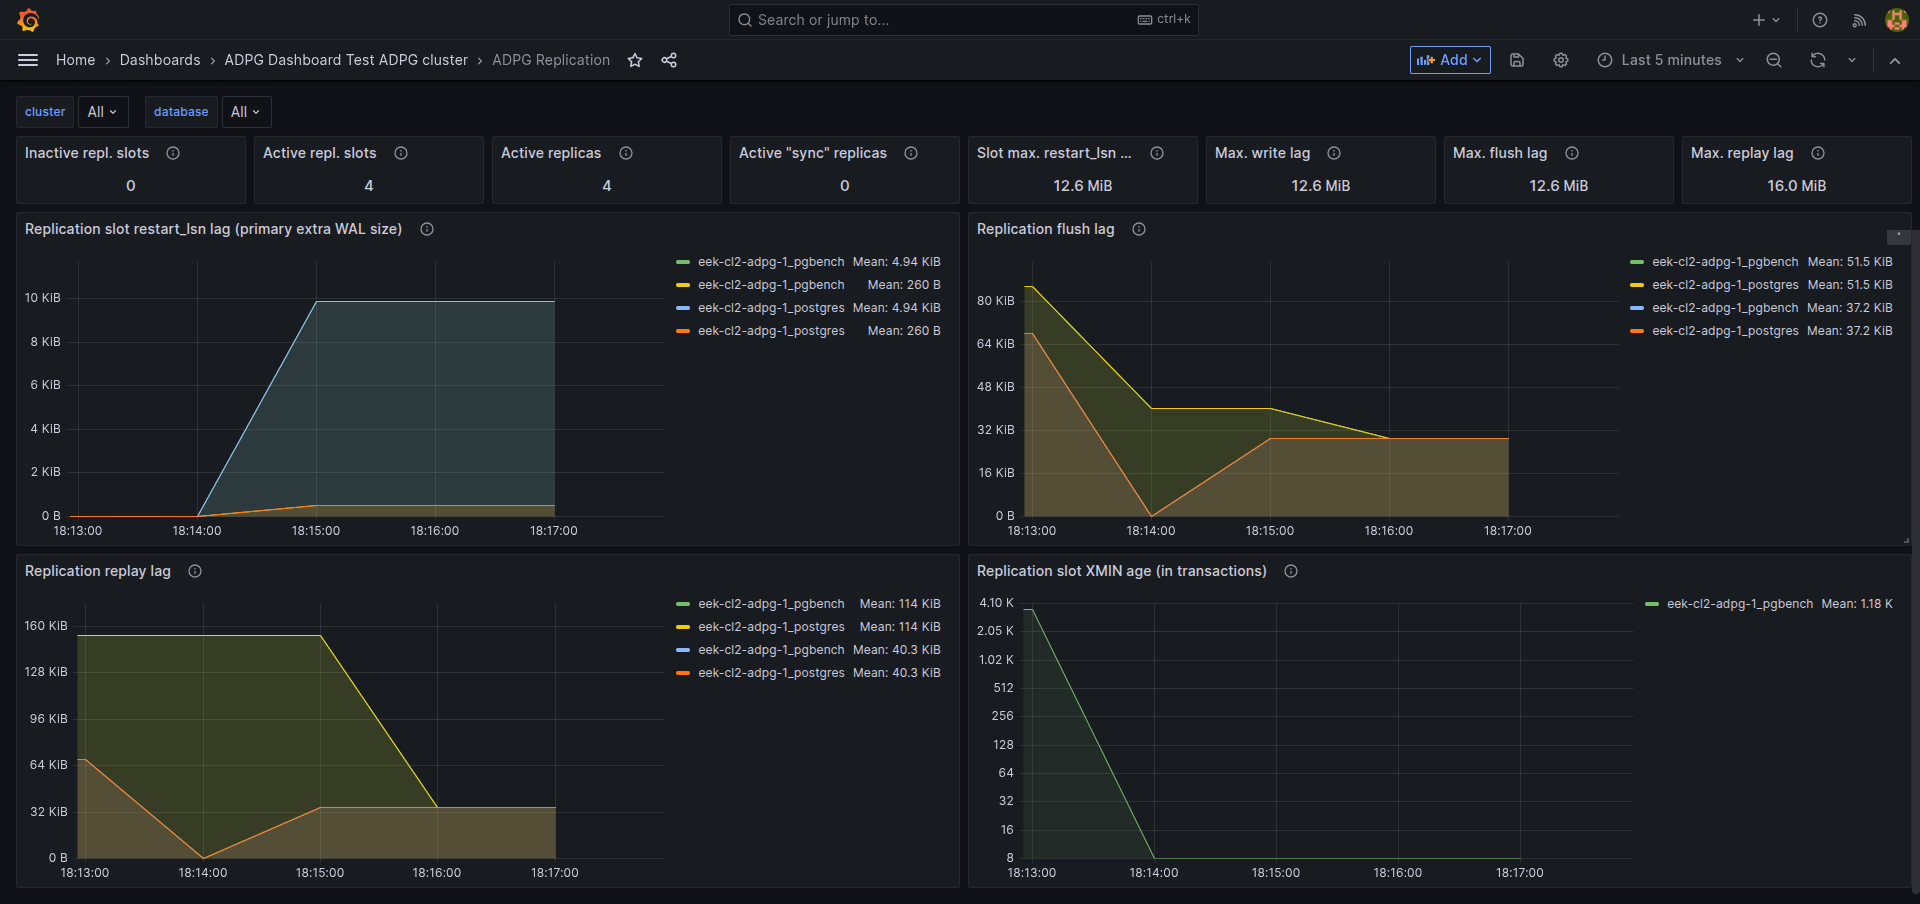
The ADPG Replication dashboard includes the following states:
-
Inactive repl. slots.
-
Active repl. slots.
-
Active replicas.
-
Active "sync" replicas.
-
Slot max. restart_lsn lag.
-
Max. write lag.
-
Max. flush lag.
-
Max. replay lag.
The ADPG Replication dashboard contains the following graphs:
-
Replication slot restart_lsn lag (primary extra WAL size). It is calculated based on the pg_replication_slots view only for primary nodes.
-
Replication flush lag. It is calculated based on the pg_stat_replication view for primary nodes. Note that data is available only on connected replicas.
-
Replication replay lag. It is calculated based on the pg_stat_replication view for primary nodes. Note that data is available only on connected replicas.
-
Repl. slot XMIN age (in transactions). It is calculated based on the
xminfield of the pg_replication_slots view.
ADPG Sessions overview
The ADPG Sessions overview dashboard provides session statistics.
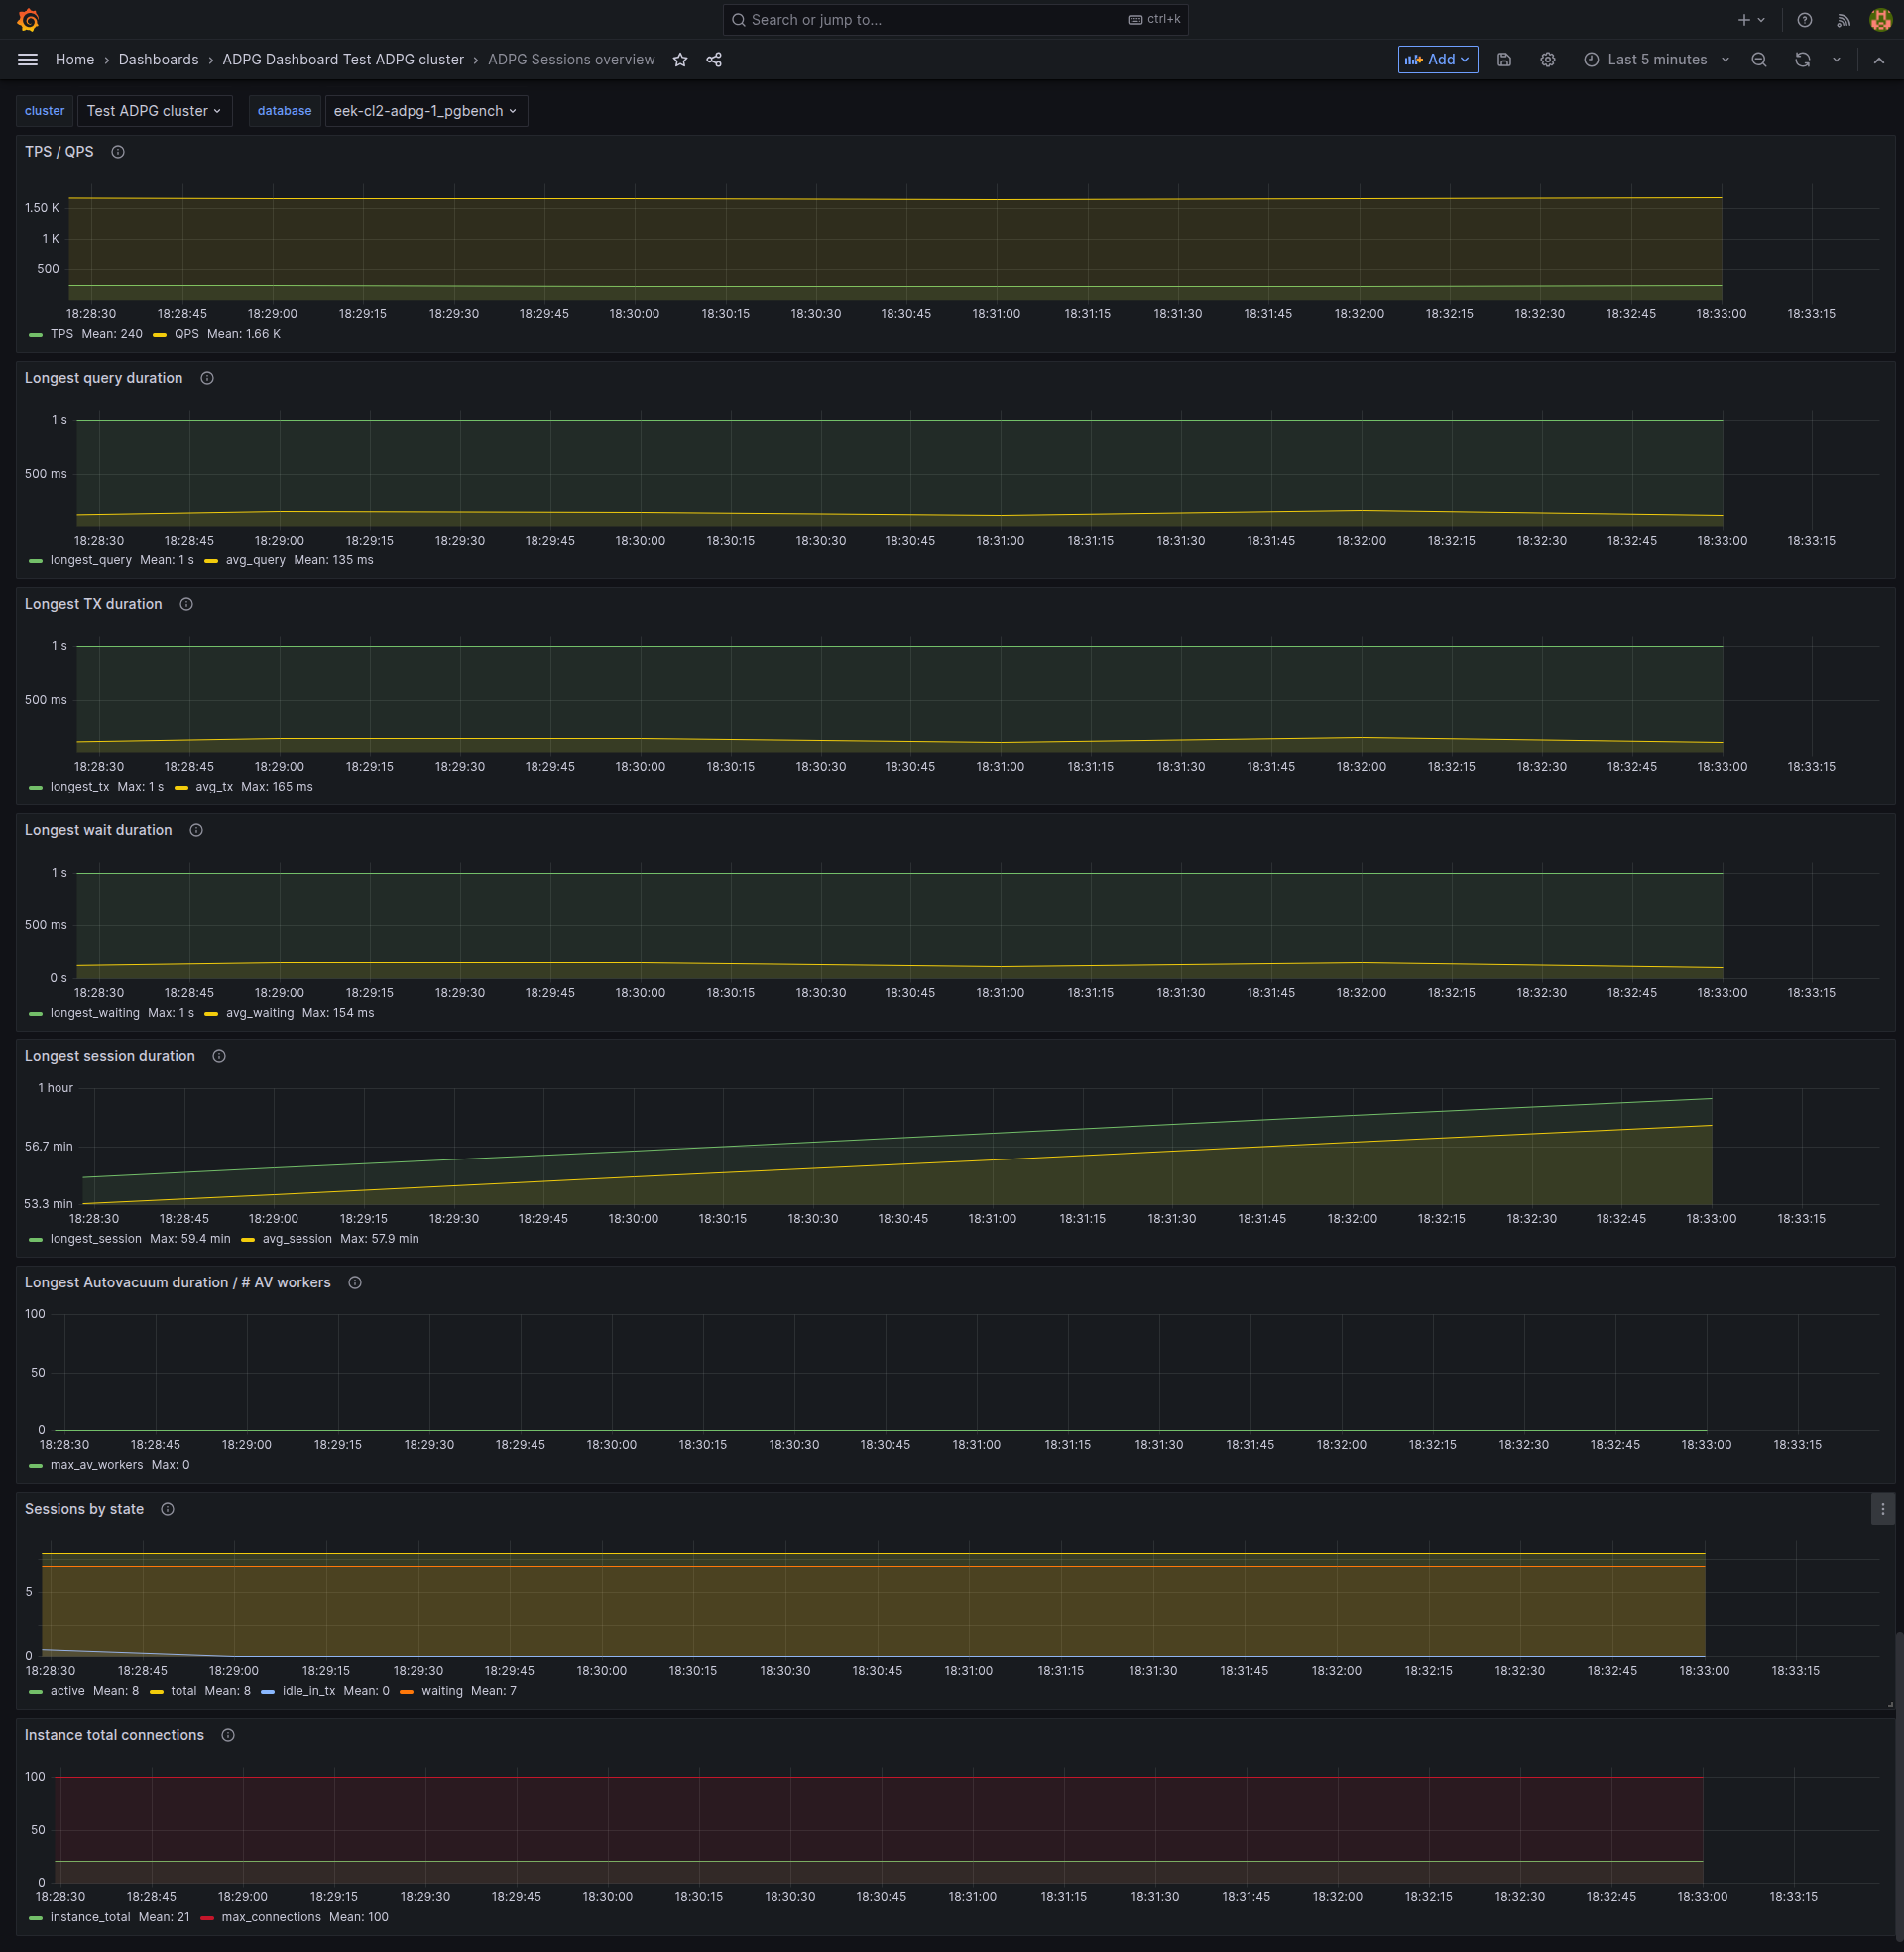
The ADPG Sessions overview dashboard contains the following graphs:
-
TPS/QPS.
-
Longest query duration.
-
Longest TX duration.
-
Longest wait duration.
-
Longest session duration.
-
Longest Autovacuum duration / # AV workers.
-
Sessions by state.
-
Instance total connections.
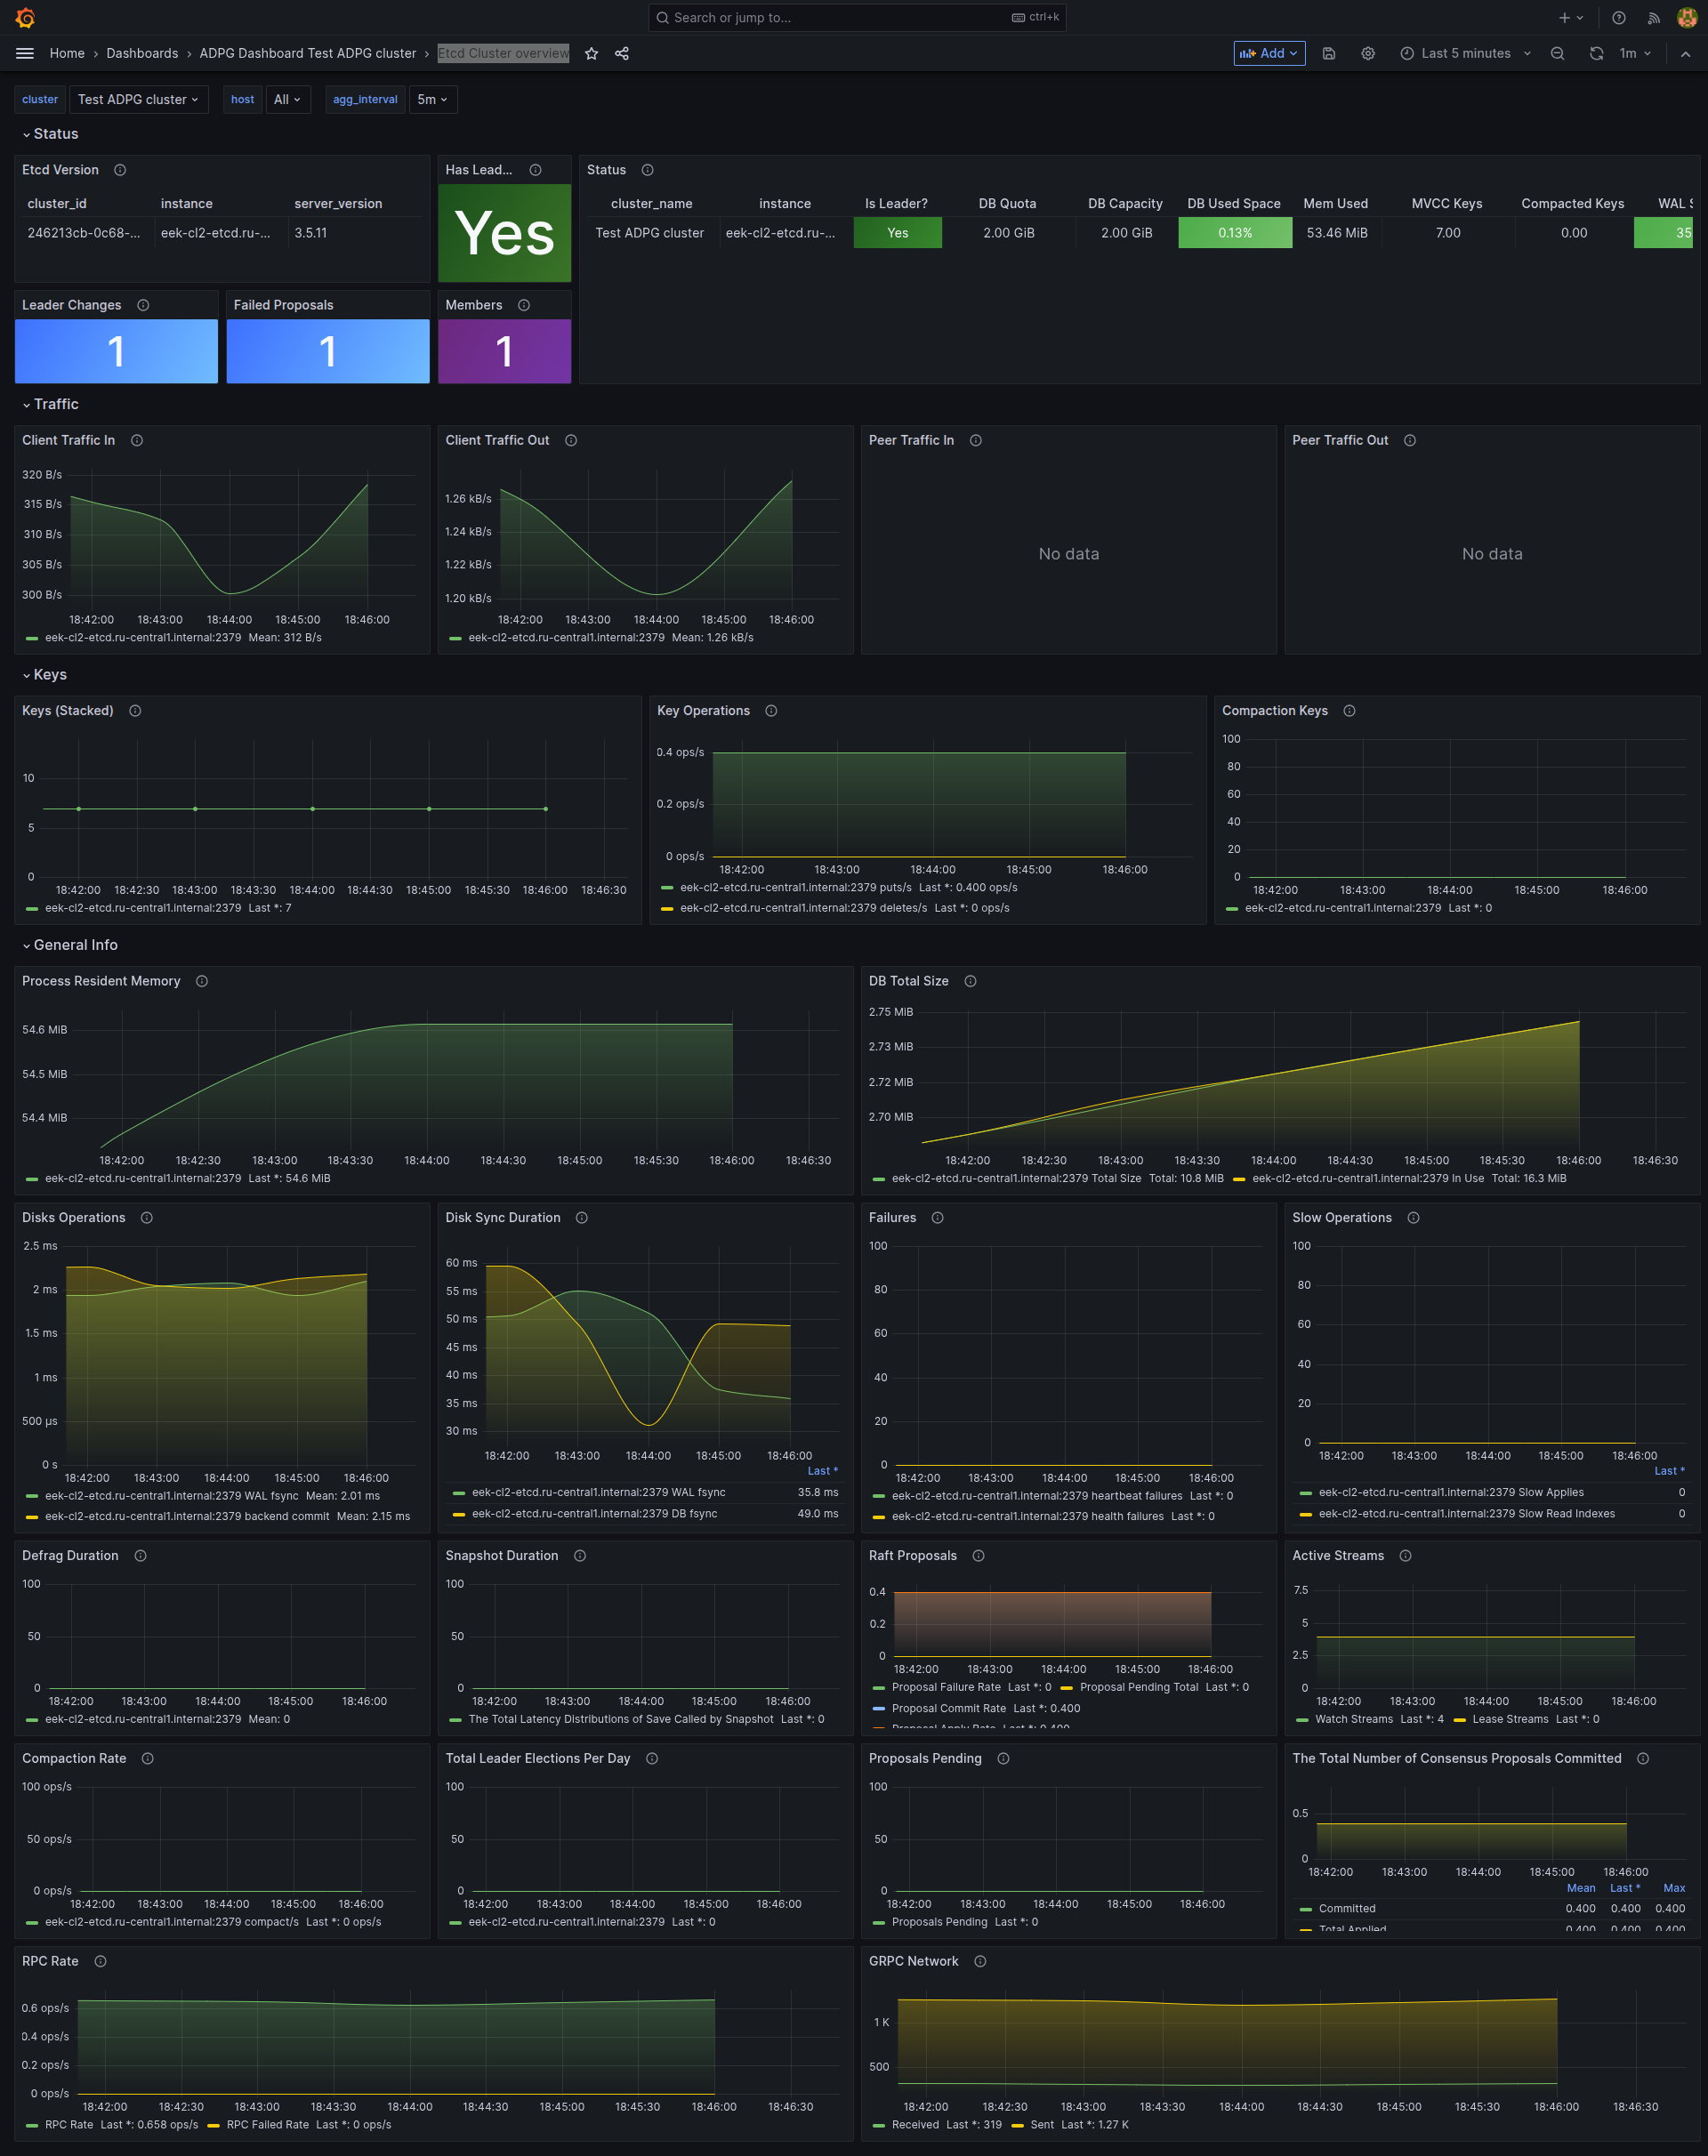
Etcd Cluster overview
The Etcd Cluster overview dashboard provides statistics on the Etcd cluster.
Global ADPG dashboard
The Global ADPG dashboard provides general database statistics and can alert you to critical issues in the cluster.
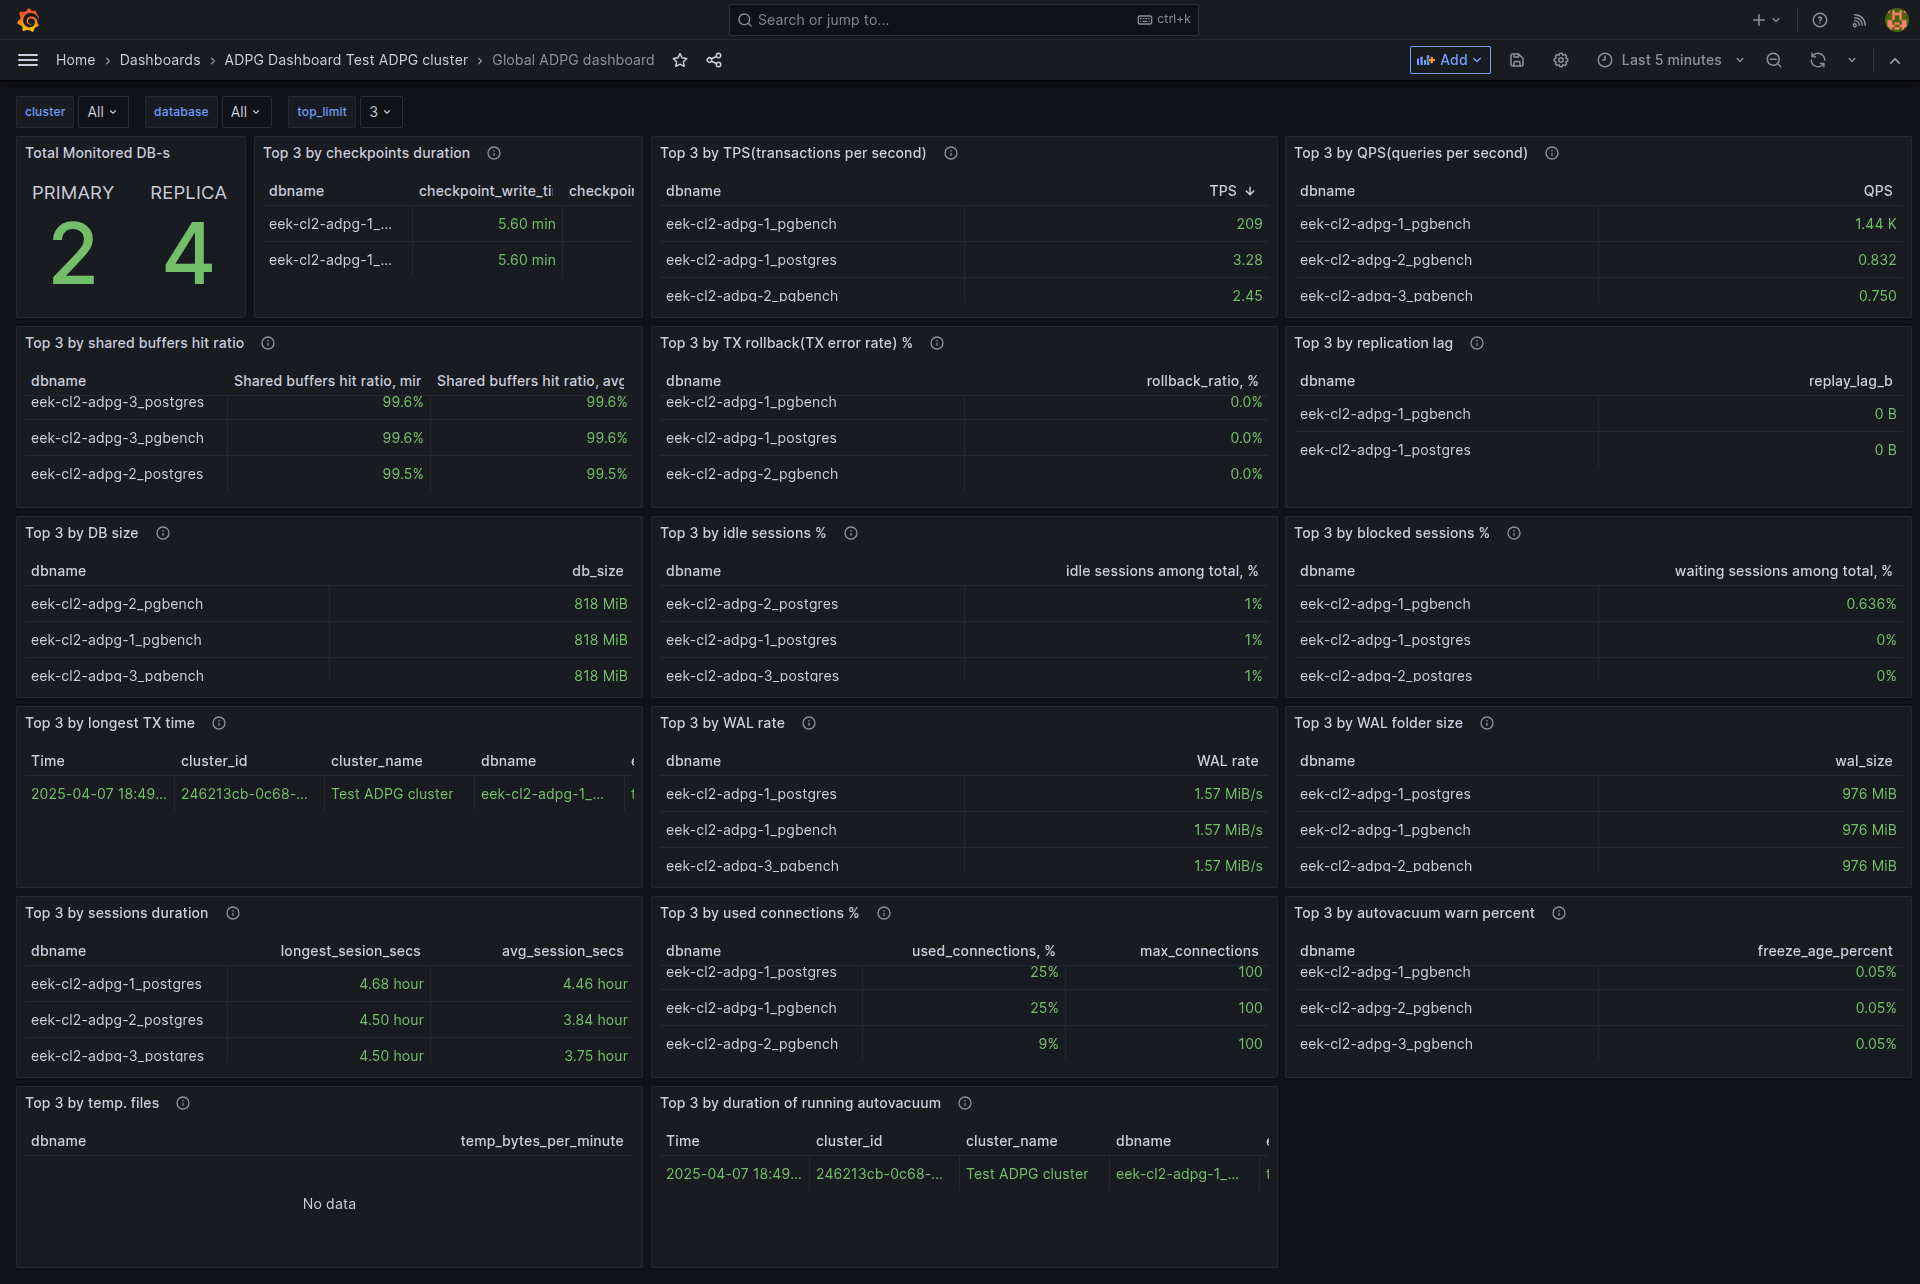
The Global ADPG dashboard includes the following values:
-
Total Monitored DB-s.
It also contains the tables listed below:
-
Top N by checkpoints duration
-
Top N by TPS.
-
Top N by QPS.
-
Top N by shared buffers hit ratio.
-
Top N by TX rollback.
-
Top N by replication lag.
-
Top N by DB size.
-
Top N by idle sessions %.
-
Top N by blocked sessions %.
-
Top N by longest TX time.
-
Top N by WAL rate.
-
Top N by WAL folder size.
-
Top N by session duration.
-
Top N by used connections.
-
Top N by autovacuum warn percent.
-
Top N by temp files.
-
Top N by duration of running autovacuums.
Where "Top N" is the number of first values, the size of the output that is set by the top_limit filter, the default value is 3.
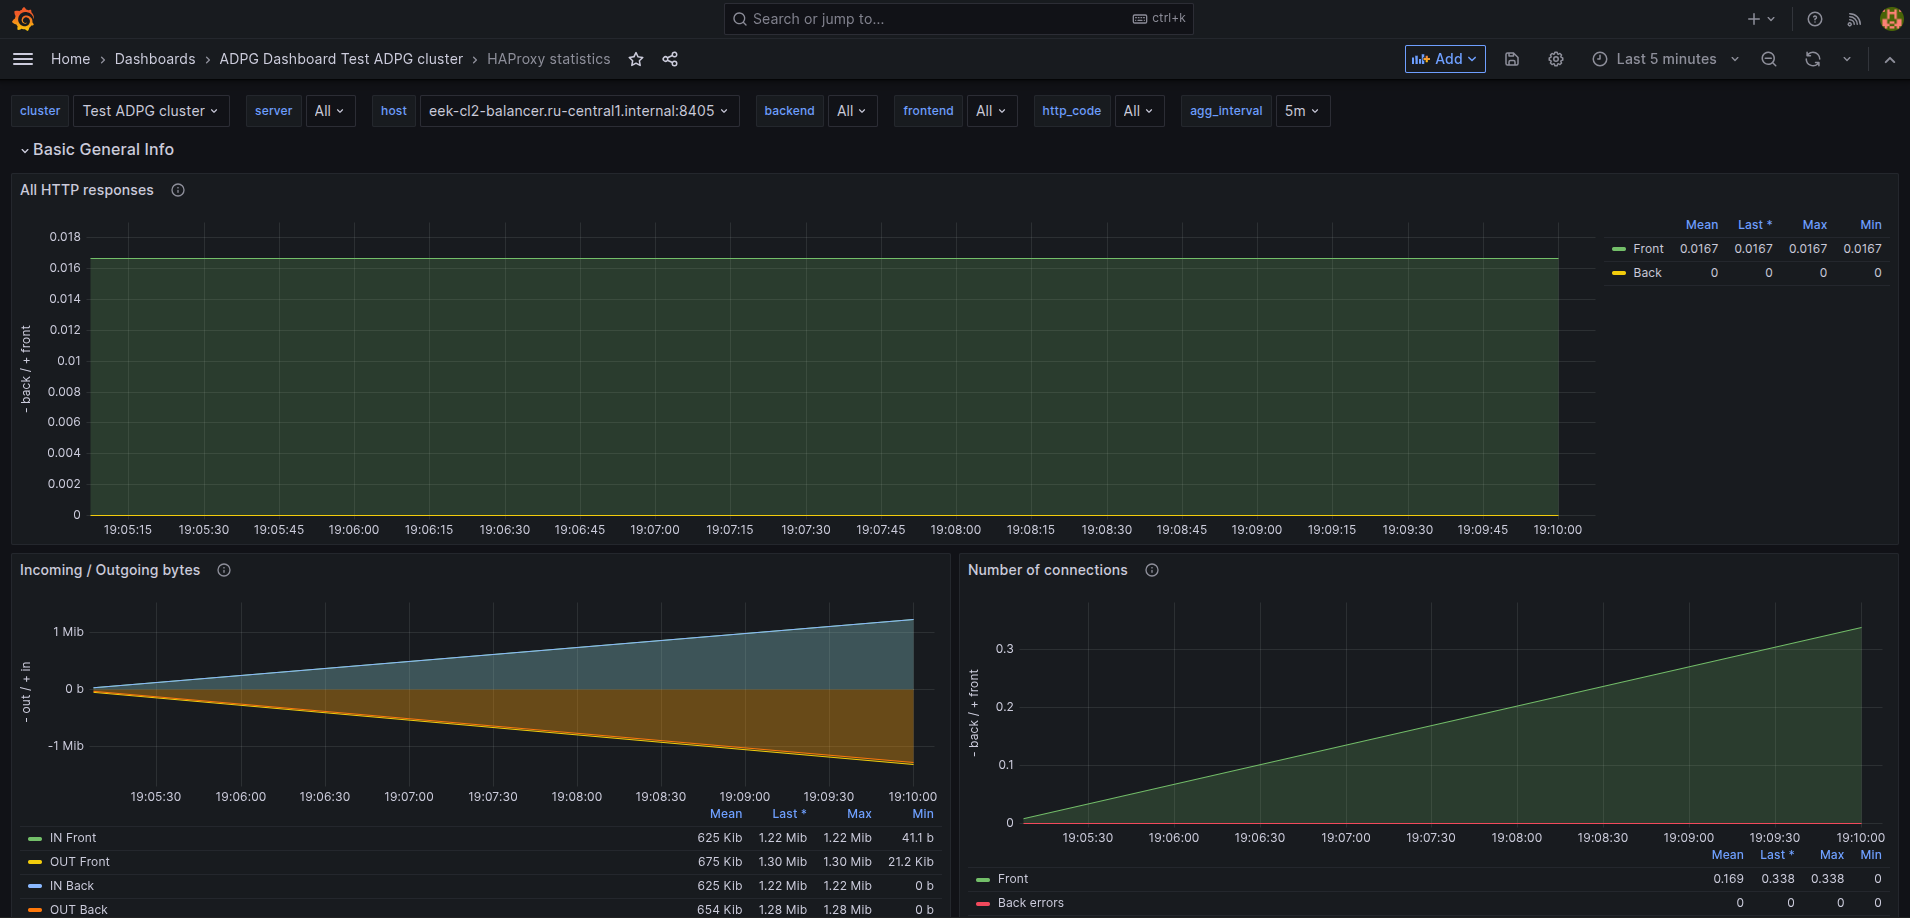
HAProxy statistics
The HAProxy statistics dashboard provides statistics on the Balancer service (HAProxy).
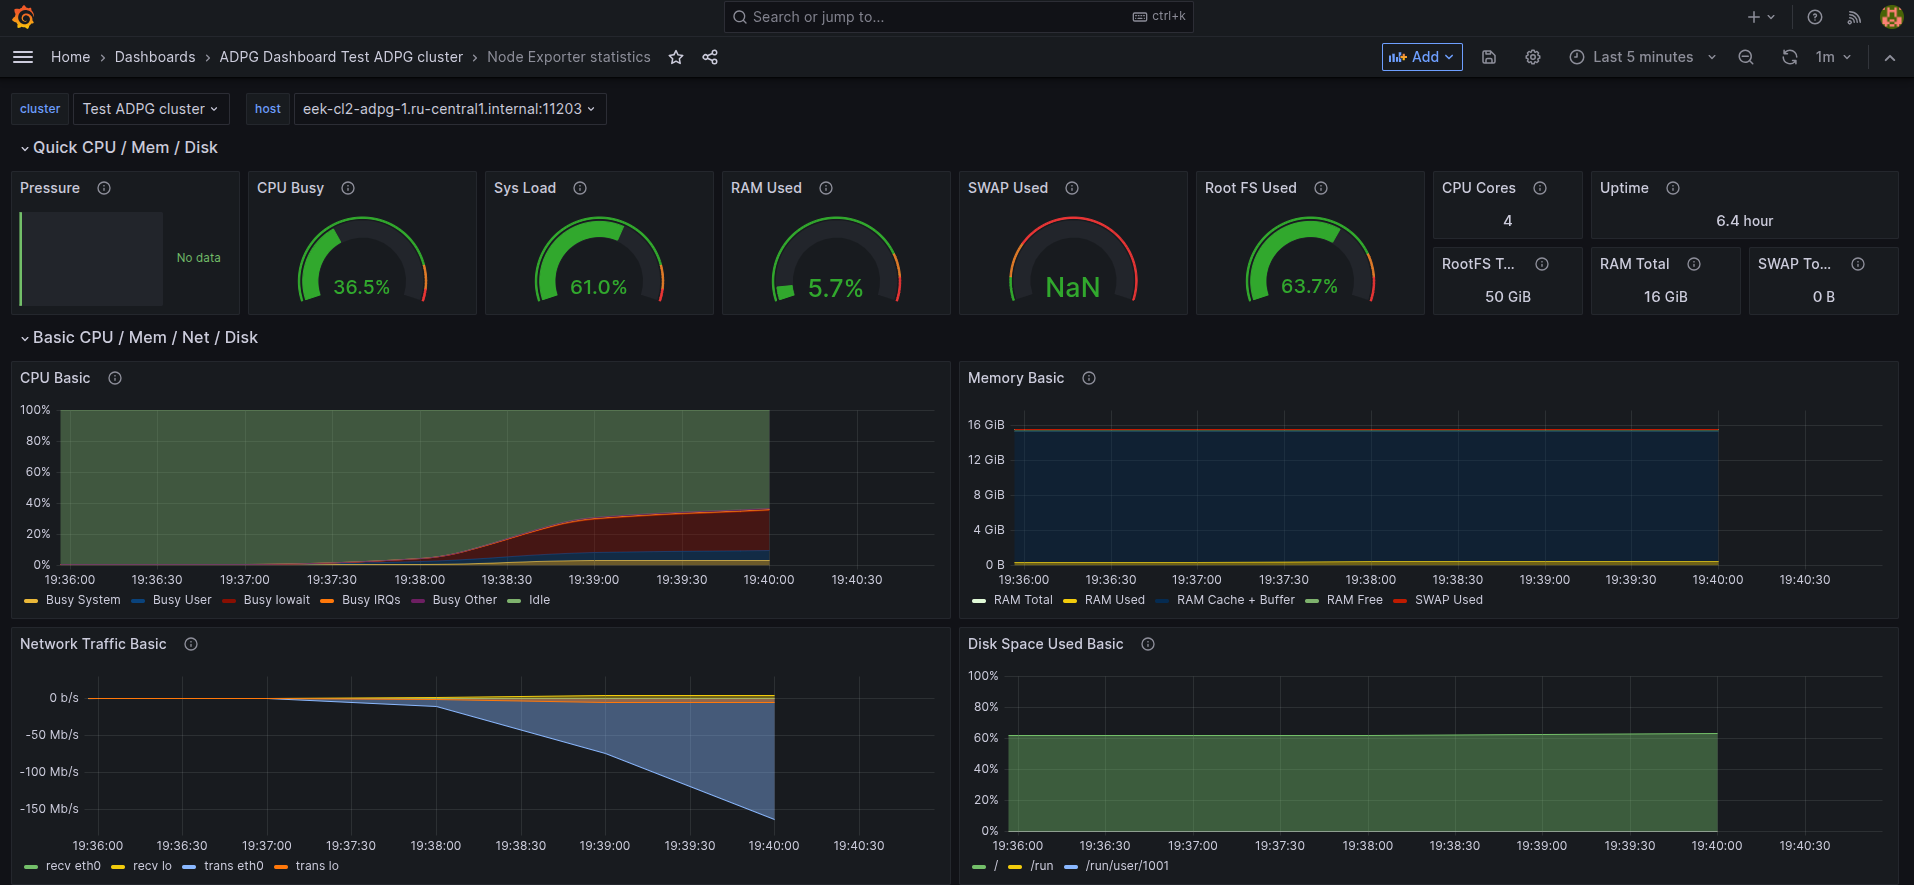
Node Exporter statistics
The Node Exporter statistics dashboard provides system metrics for each node in the cluster, where the Node Exporter component is installed. You can select a node in the host filter at the top of the page.
PgBouncer statistics
The PgBouncer statistics dashboard contains statistics that reflect the PgBouncer performance.
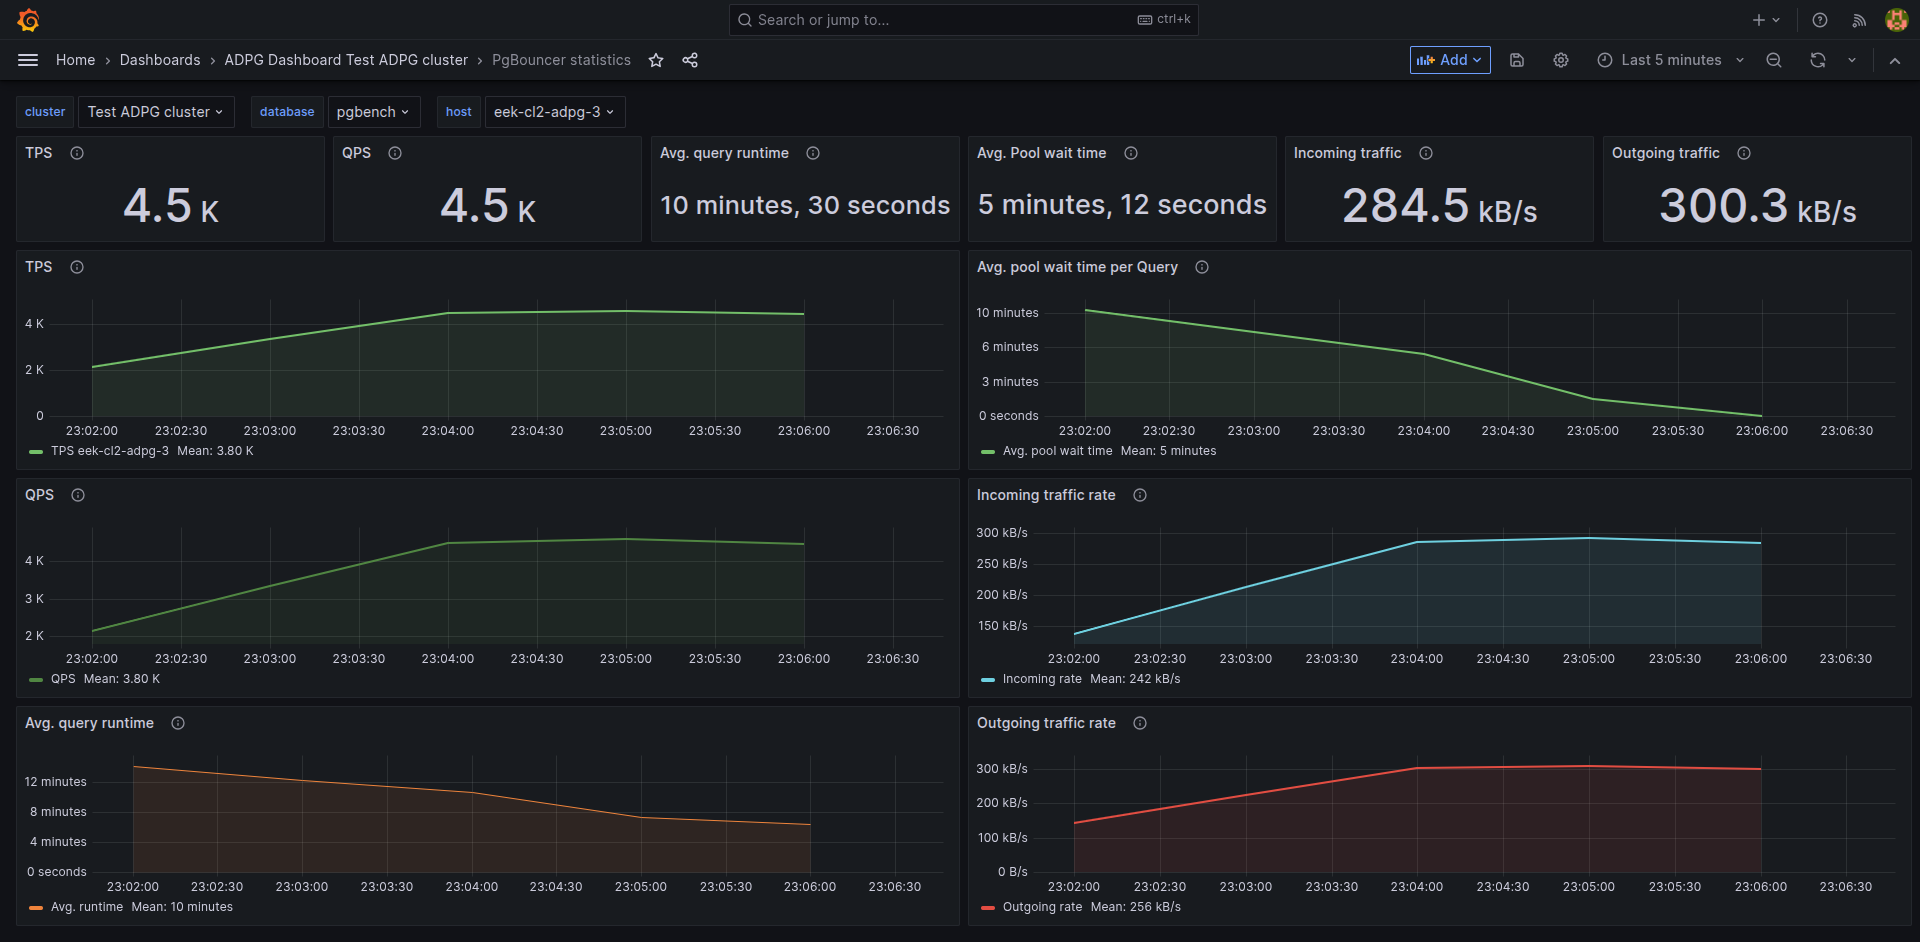
The PgBouncer statistics dashboard includes the following values:
-
TPS — the total number of SQL transactions that have passed through PgBouncer.
-
QPS — the total number of requests processed by PgBouncer.
-
Avg. query runtime — average execution time of a query through PgBouncer. Calculated as the ratio of the total execution time of all queries that passed through PgBouncer to the total number of queries processed by PgBouncer.
-
Avg. Pool wait time — average wait time to get a connection via PgBouncer. Calculated as the ratio of the wait time for clients to access the database via PgBouncer to the total number of requests processed by PgBouncer.
-
Incoming traffic — the total amount of network traffic received by PgBouncer. It reflects the number of bytes received since PgBouncer started.
-
Outgoing traffic — the total amount of network traffic sent by PgBouncer. It reflects the number of bytes sent since PgBouncer started.
The PgBouncer statistics dashboard displays the following graphs:
-
TPS — transactions per second.
-
QPS — queries per second.
-
Avg. query runtime — the average query runtime, in microseconds.
-
Avg. pool wait time per Query — the average waiting time for queries in the pool, in microseconds.
-
Incoming traffic rate — the incoming traffic rate, bytes/sec.
-
Outgoing traffic rate — the outgoing traffic rate, bytes/sec.