Install monitoring
ADP bundle includes a monitoring system. If you did not install the Monitoring service during the cluster installation, you can do it separately by following the steps described below.
Step 1. Add the Monitoring service
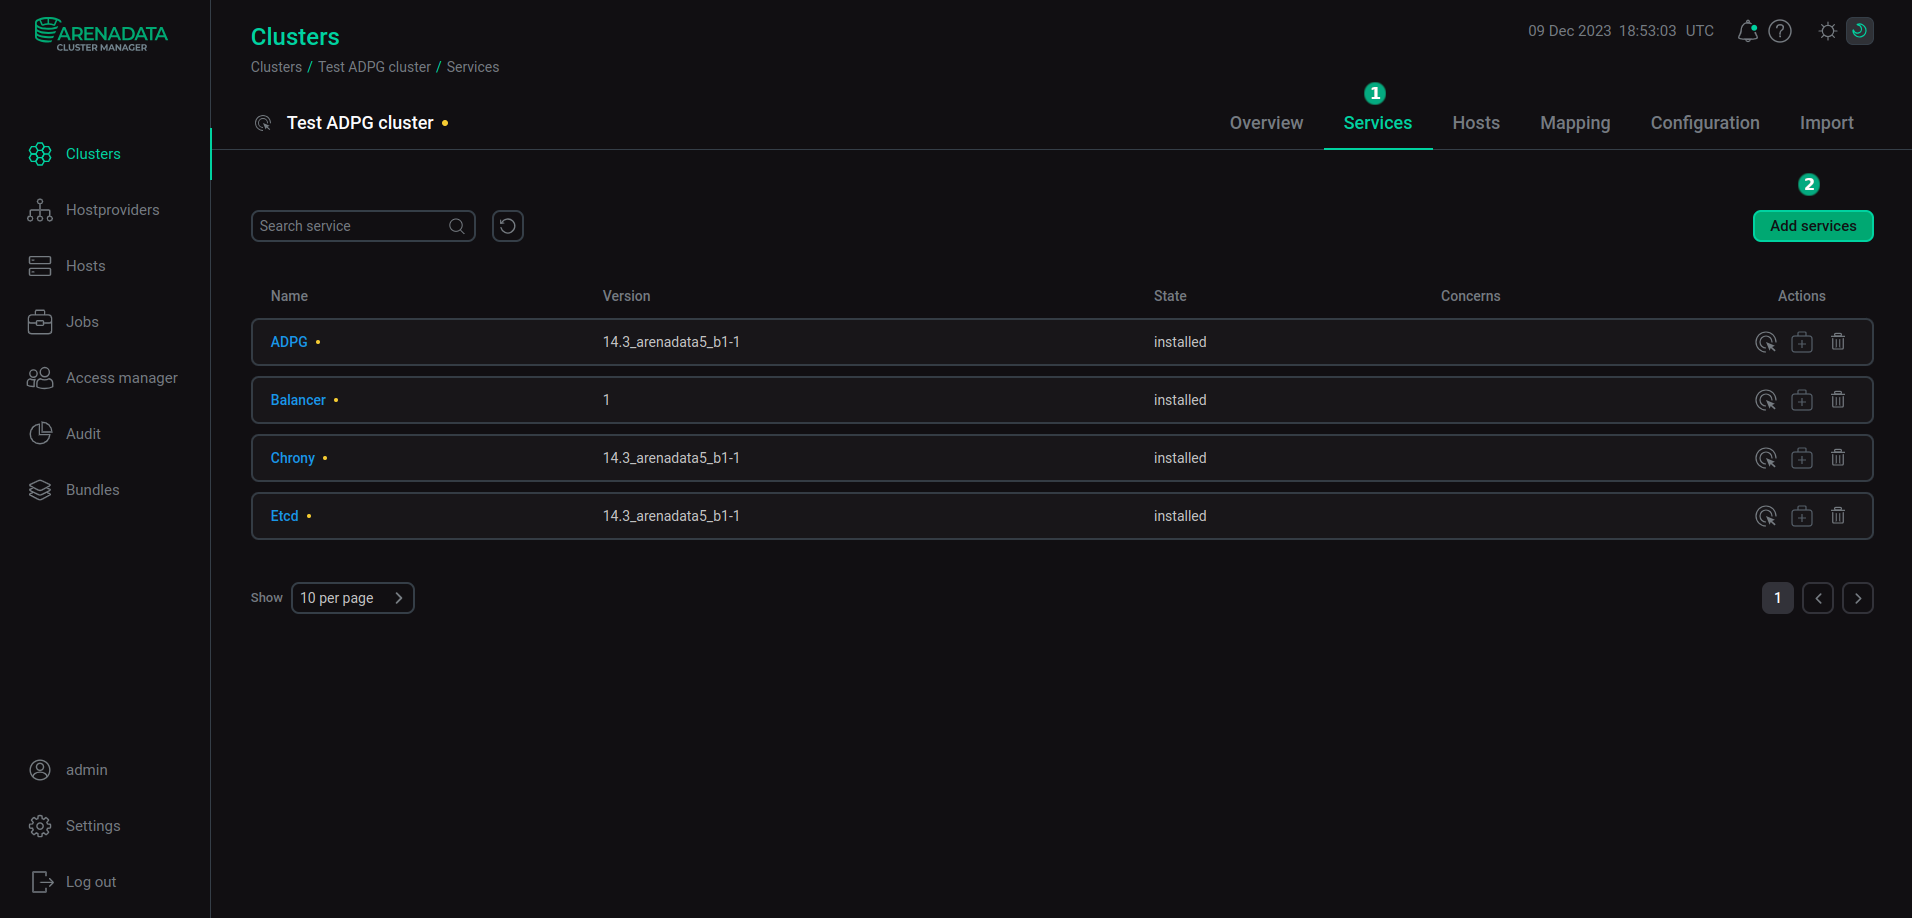
Open the Clusters page in ADCM UI and select an ADP cluster. Open the Services tab and click Add services.
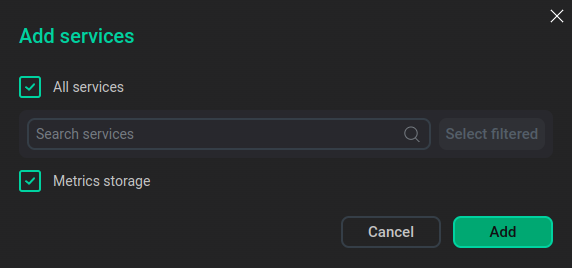
In the dialog that opens, select the Monitoring service and click Add.
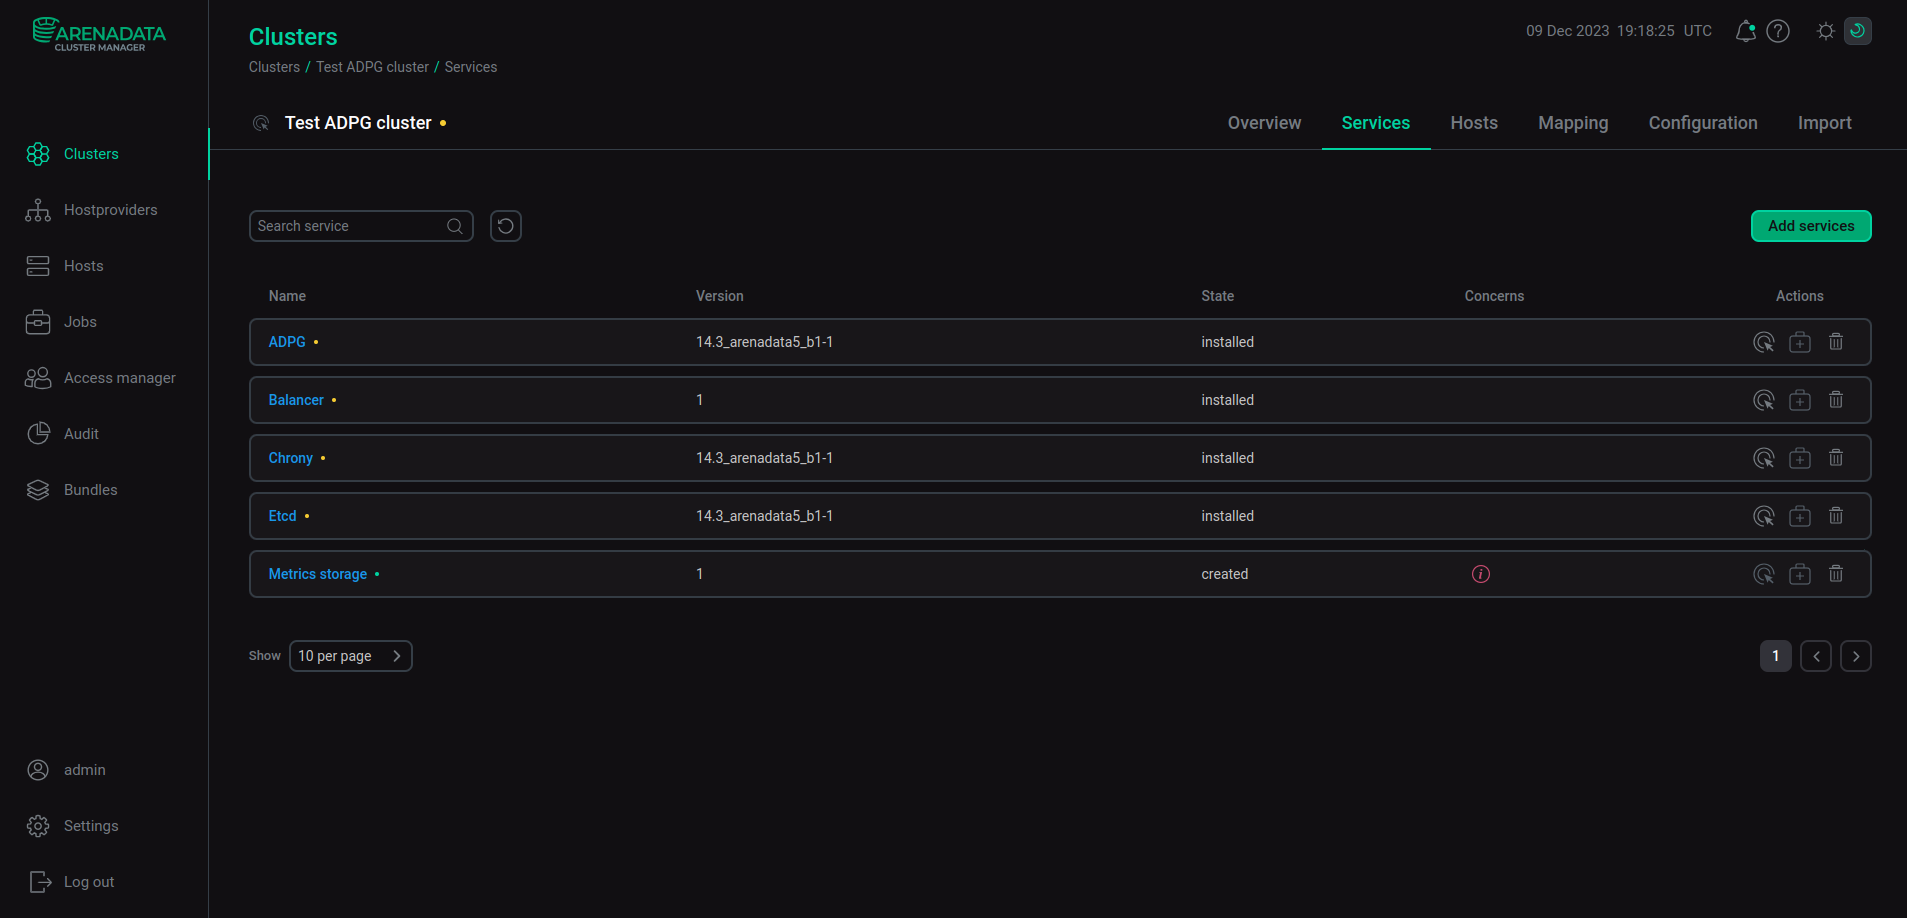
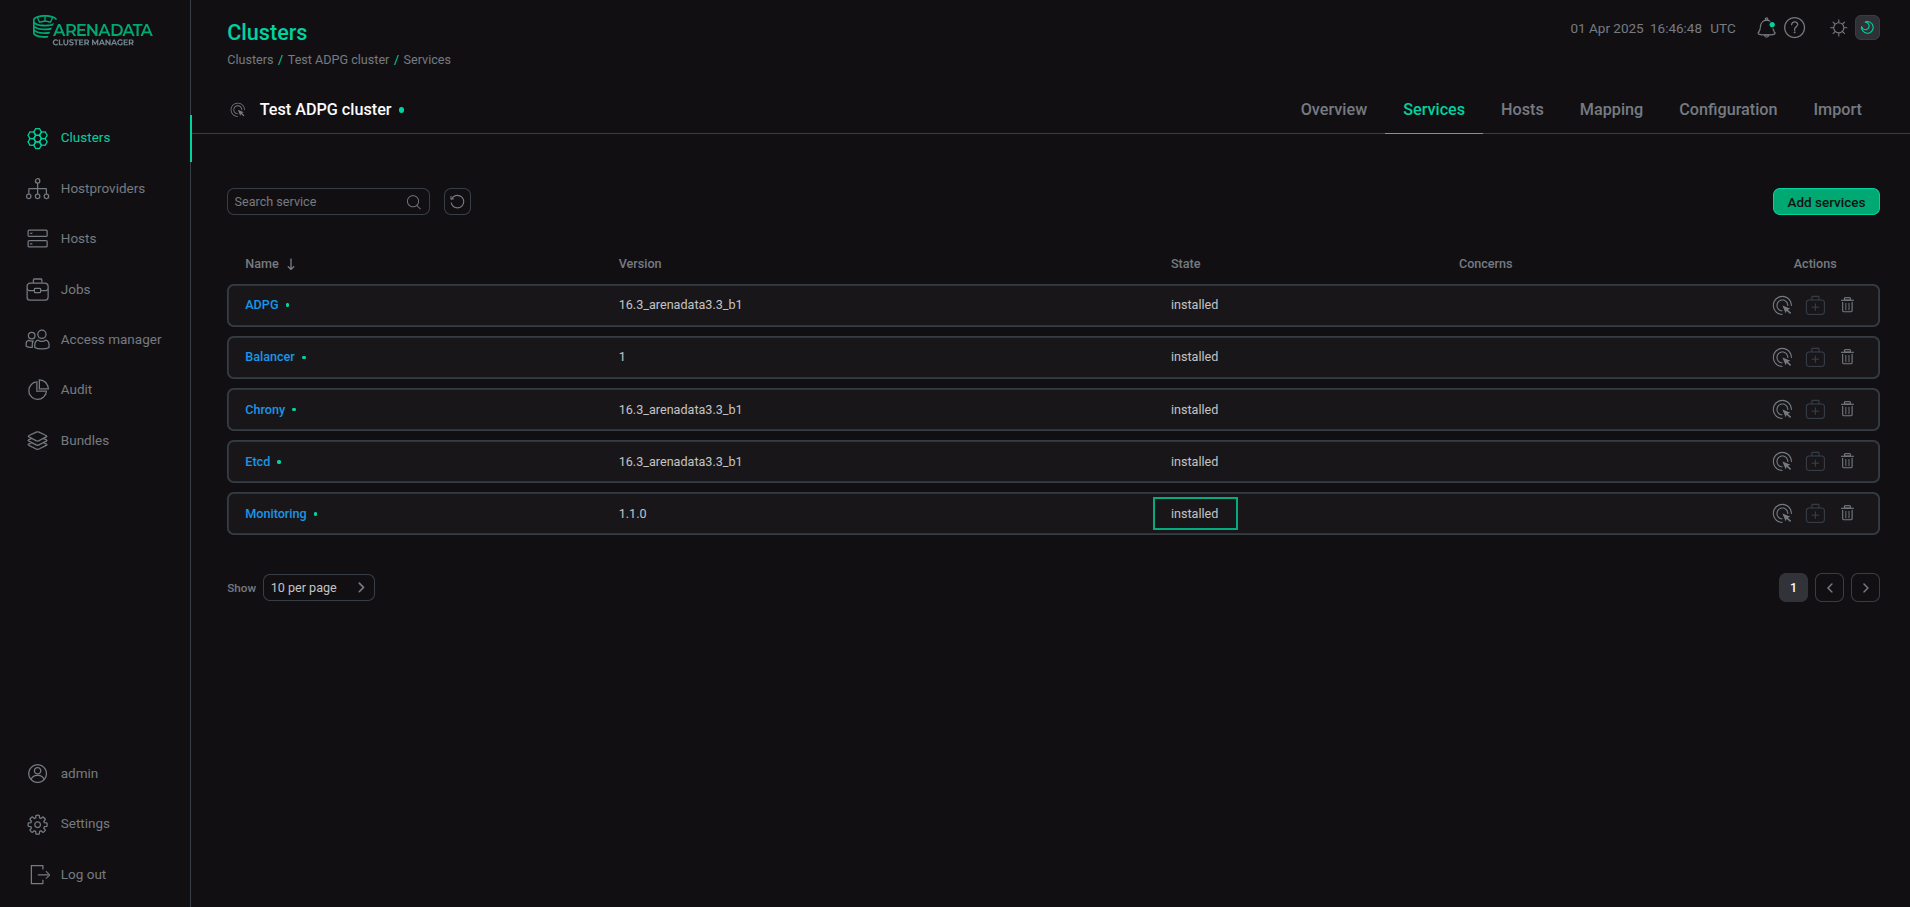
As a result, the added Monitoring service is displayed on the Services tab.
Step 2. Configure monitoring
The Concerns icon ![]()
![]() indicates that you need to specify required configuration parameters and distribute monitoring components across hosts.
indicates that you need to specify required configuration parameters and distribute monitoring components across hosts.
Click the Monitoring service and set configuration parameters on the Primary configuration tab.
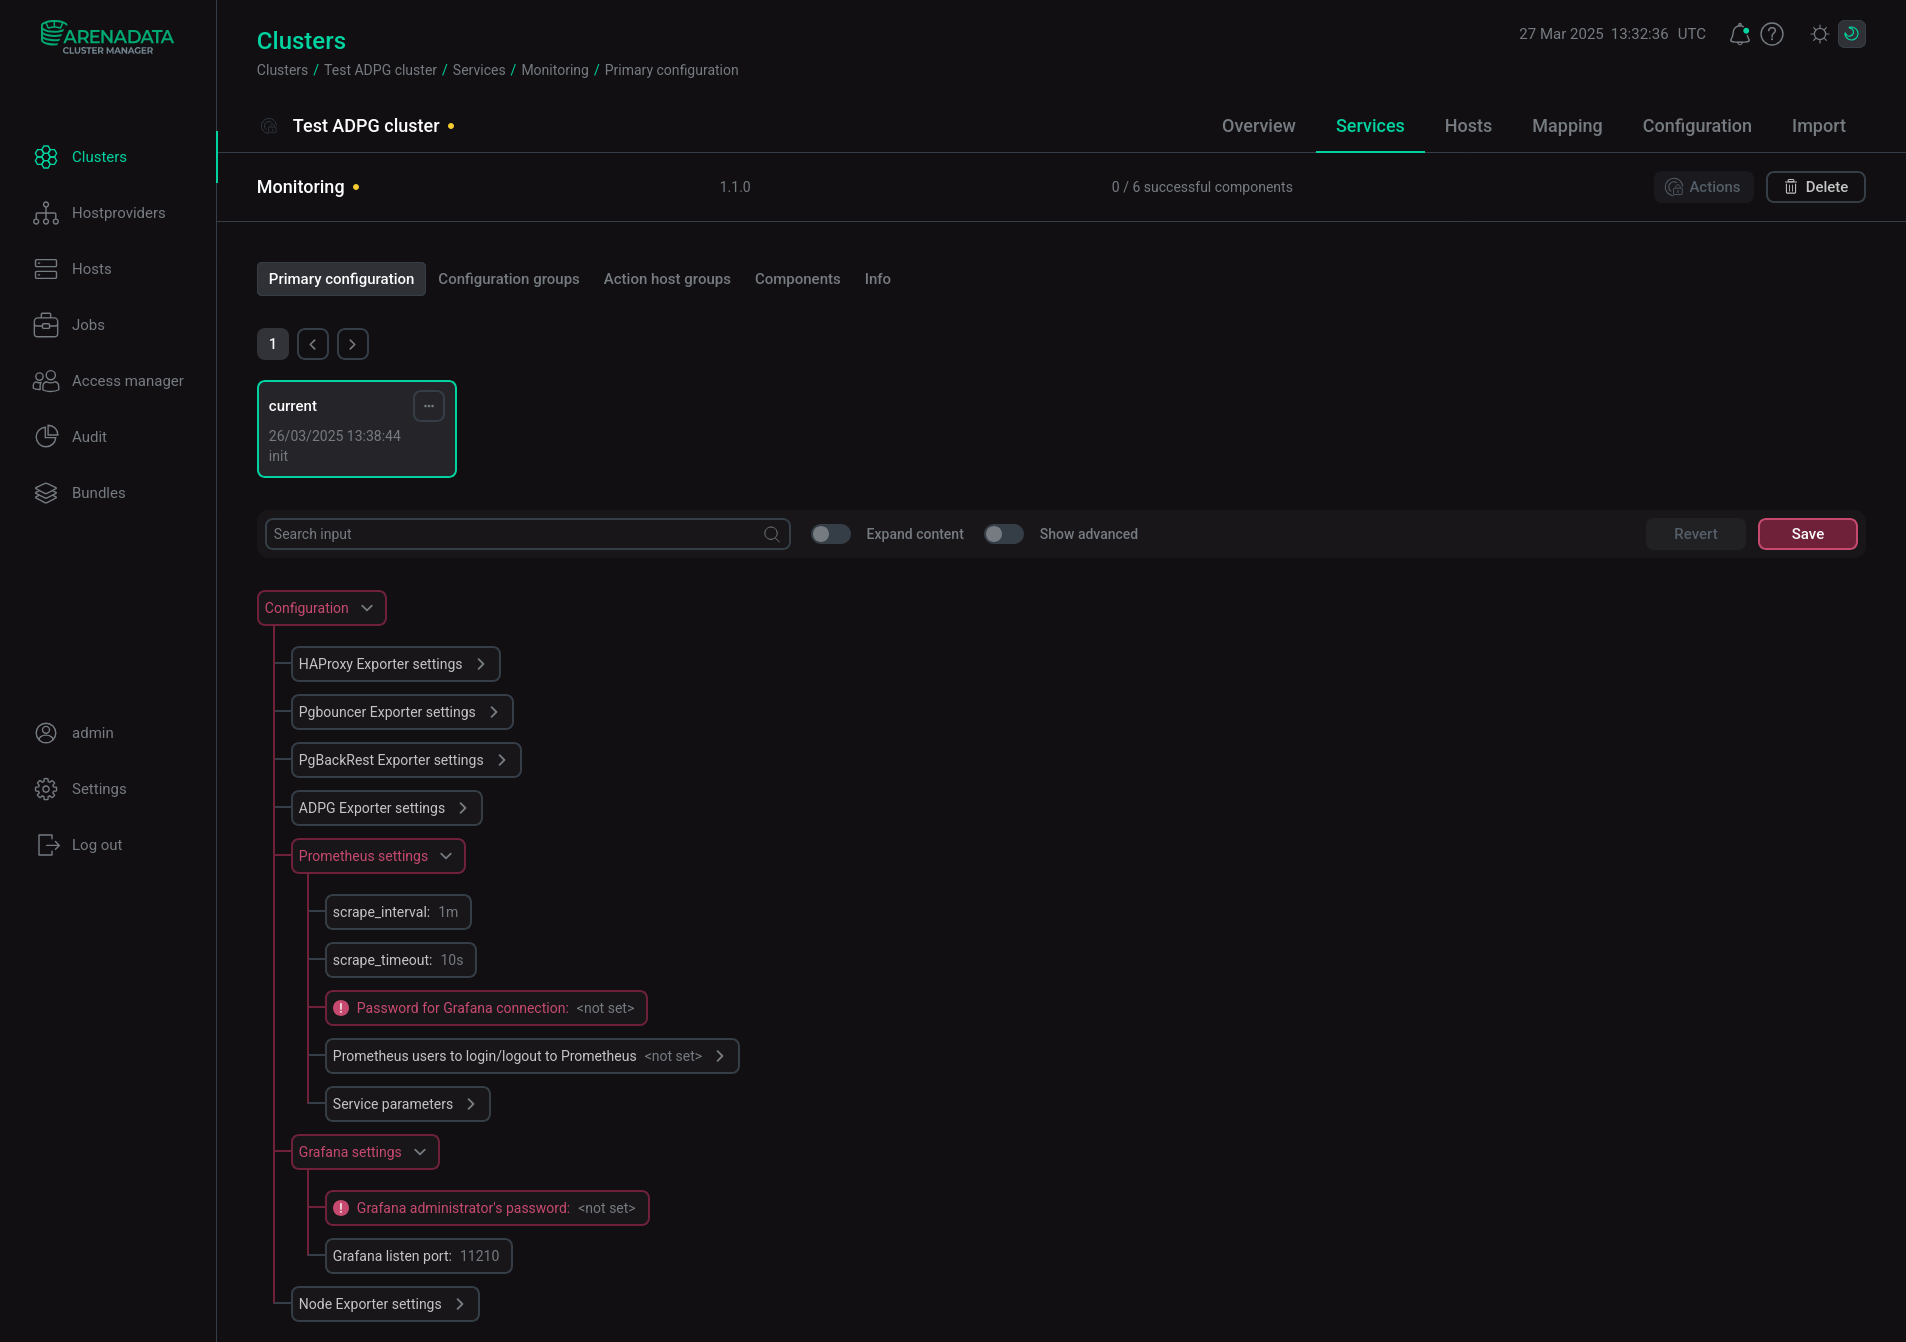
You should set the following required parameters marked in red:
-
Prometheus settings → Password for Grafana connection — a password of a Grafana user (
admprom_grafana) that is used to connect to Prometheus. The password should contain a combination of numbers, symbols, lowercase and uppercase letters and have a minimum length of 8. -
Grafana settings → Grafana administrator’s password — a password of the Grafana
adminuser. The password should contain a combination of numbers, symbols, lowercase and uppercase letters and have a minimum length of 8.
All monitoring parameters are described in the "Monitoring" section of the Configuration parameters article.
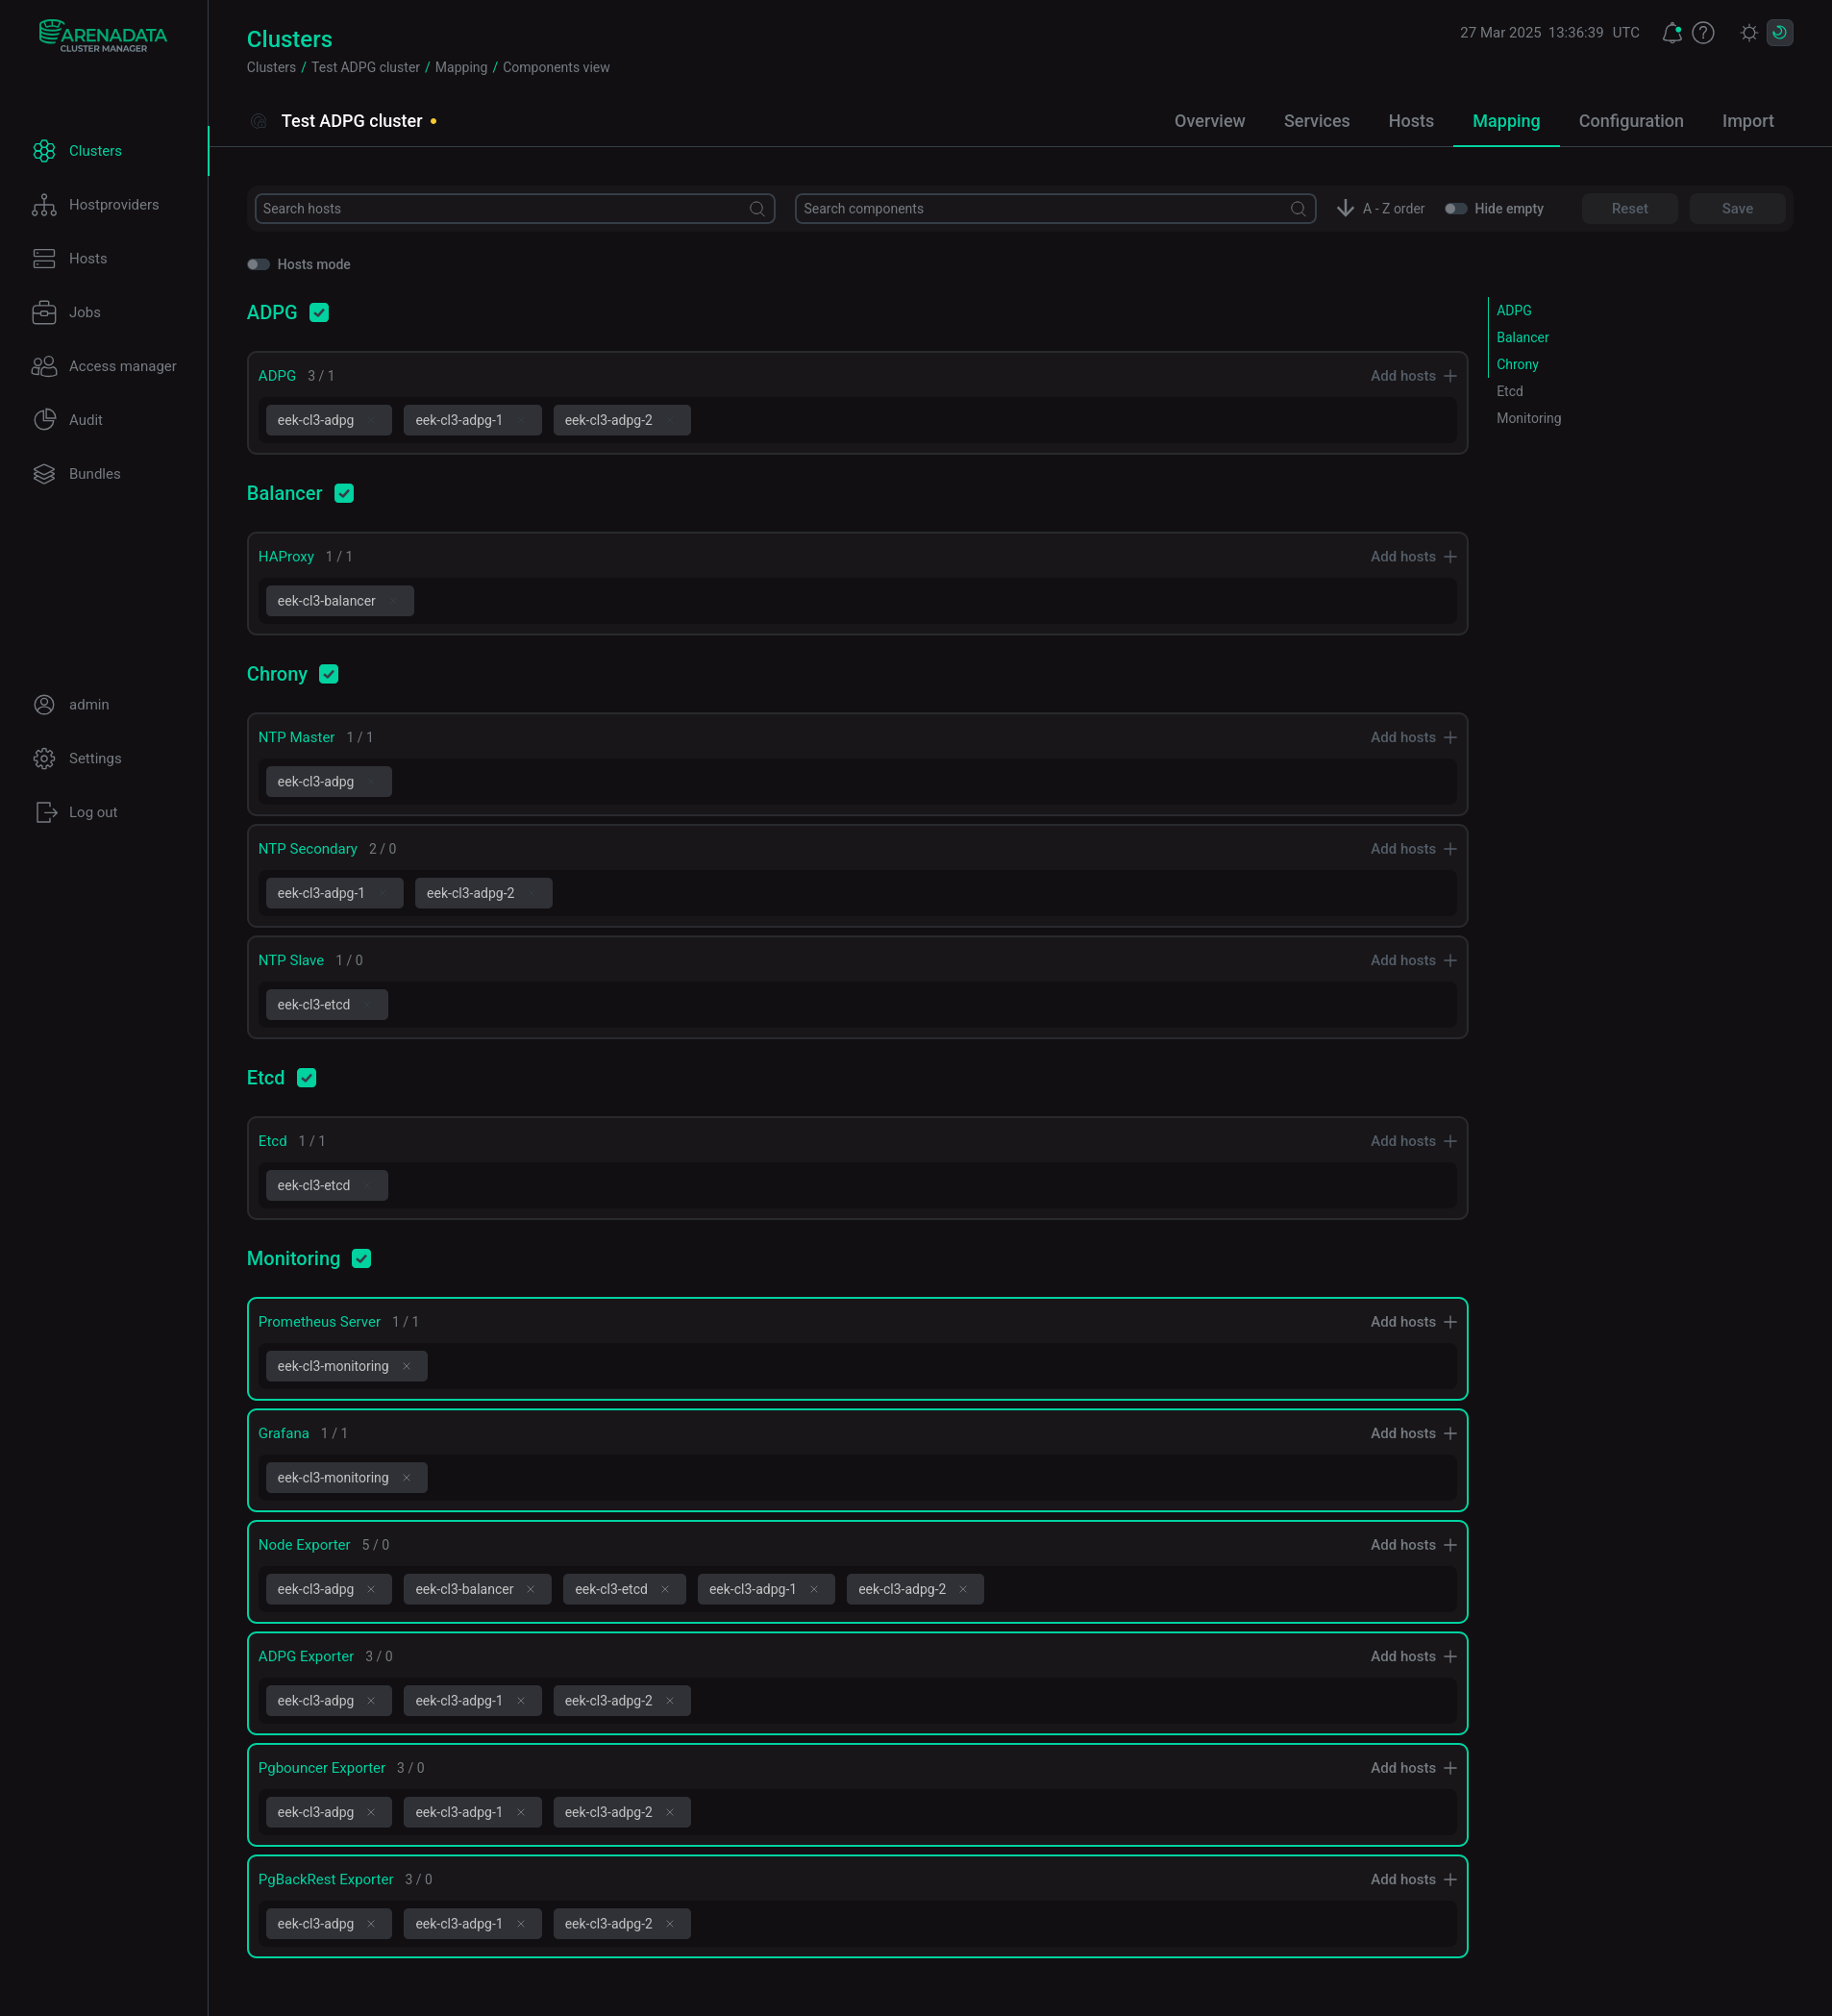
Then open the Mapping tab. Map components as described in Add components using the following recommendations:
-
ADPG Exporter and PgBouncer Exporter — to each host with the ADPG service.
-
Prometheus Server and Grafana — to a separate host.
-
Node Exporter — to each host from which you need to collect system metrics.
Click Save to save the configuration.
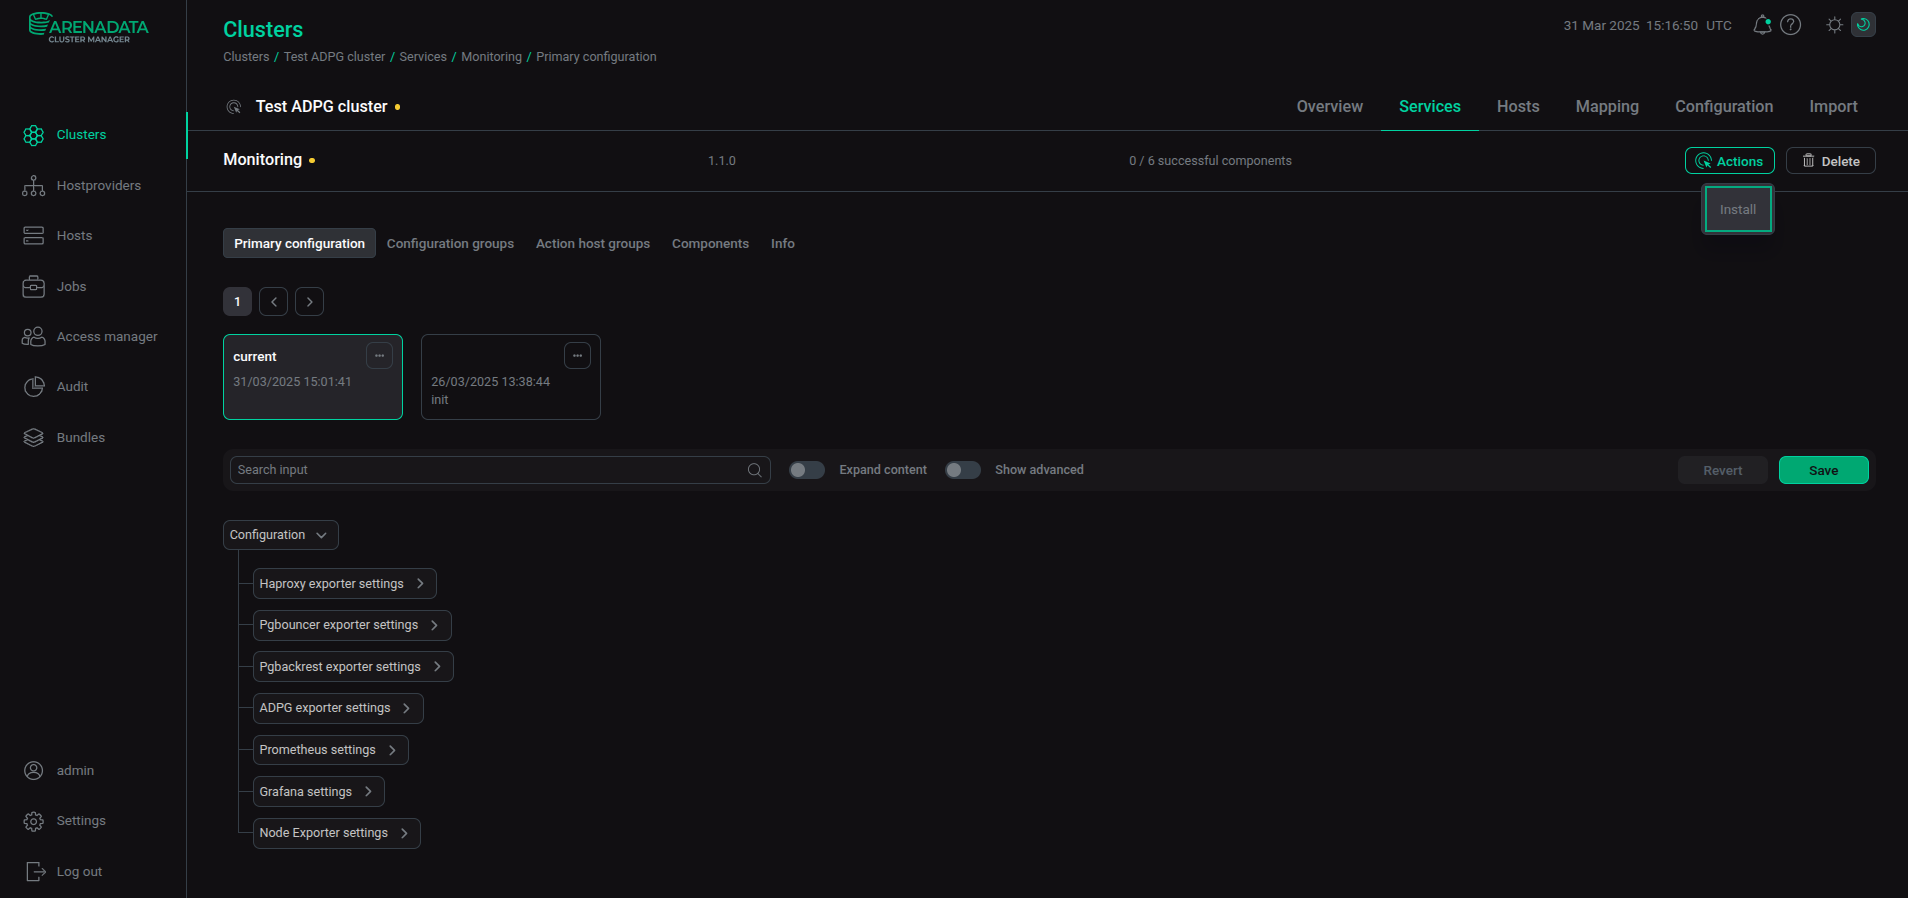
Step 3. Install the Monitoring service
Execute the Install action of the Monitoring service.
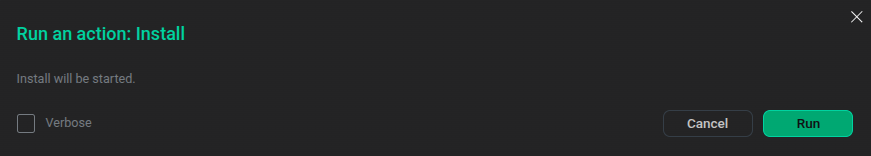
In the next dialog window, click Run to confirm the action. You can also activate the Verbose checkbox to see additional execution details on the Jobs page.
As a result, the Monitoring service state is changed to installed.
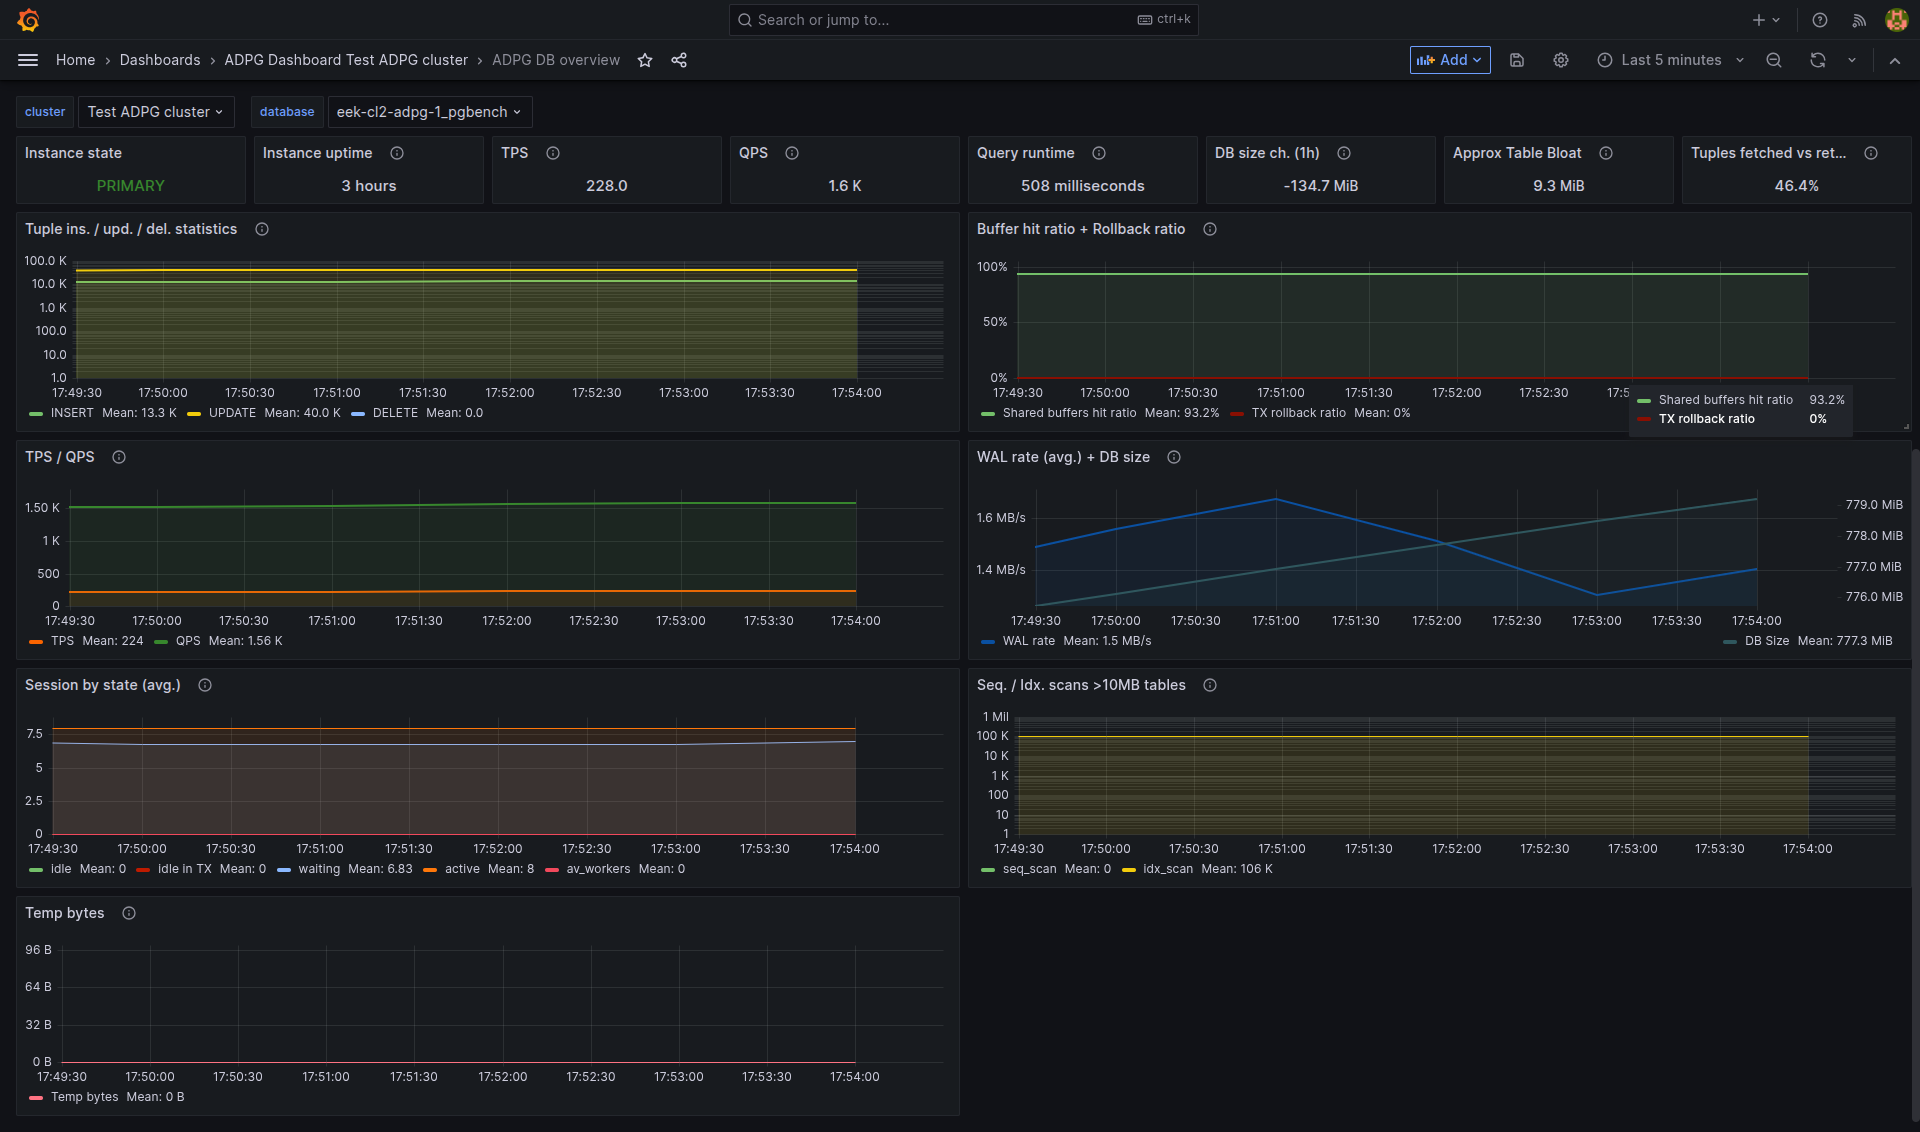
Step 4. View dashboards
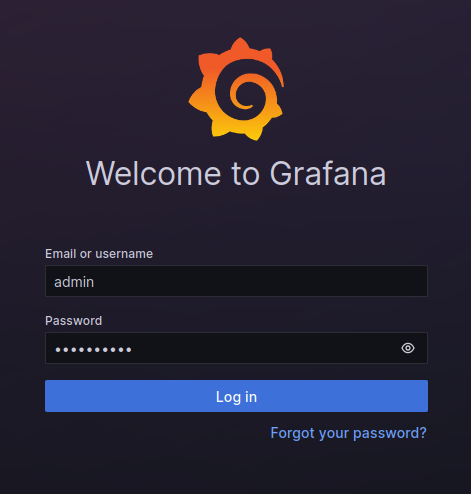
The ADP monitoring system includes the Grafana component. Grafana visualizes metrics data. After monitoring with the Grafana component is installed, you will be able to view dashboards that display metrics in a browser. Enter the address of the host where the Grafana component is deployed and add the port number — the Grafana listen port parameter (the default value is 11210). For example, http://10.92.6.91:11210. For login, use admin as a username, and the Grafana administrator’s password parameter value as a password. You can find the Grafana parameters on the Configuration tab of the Monitoring service.
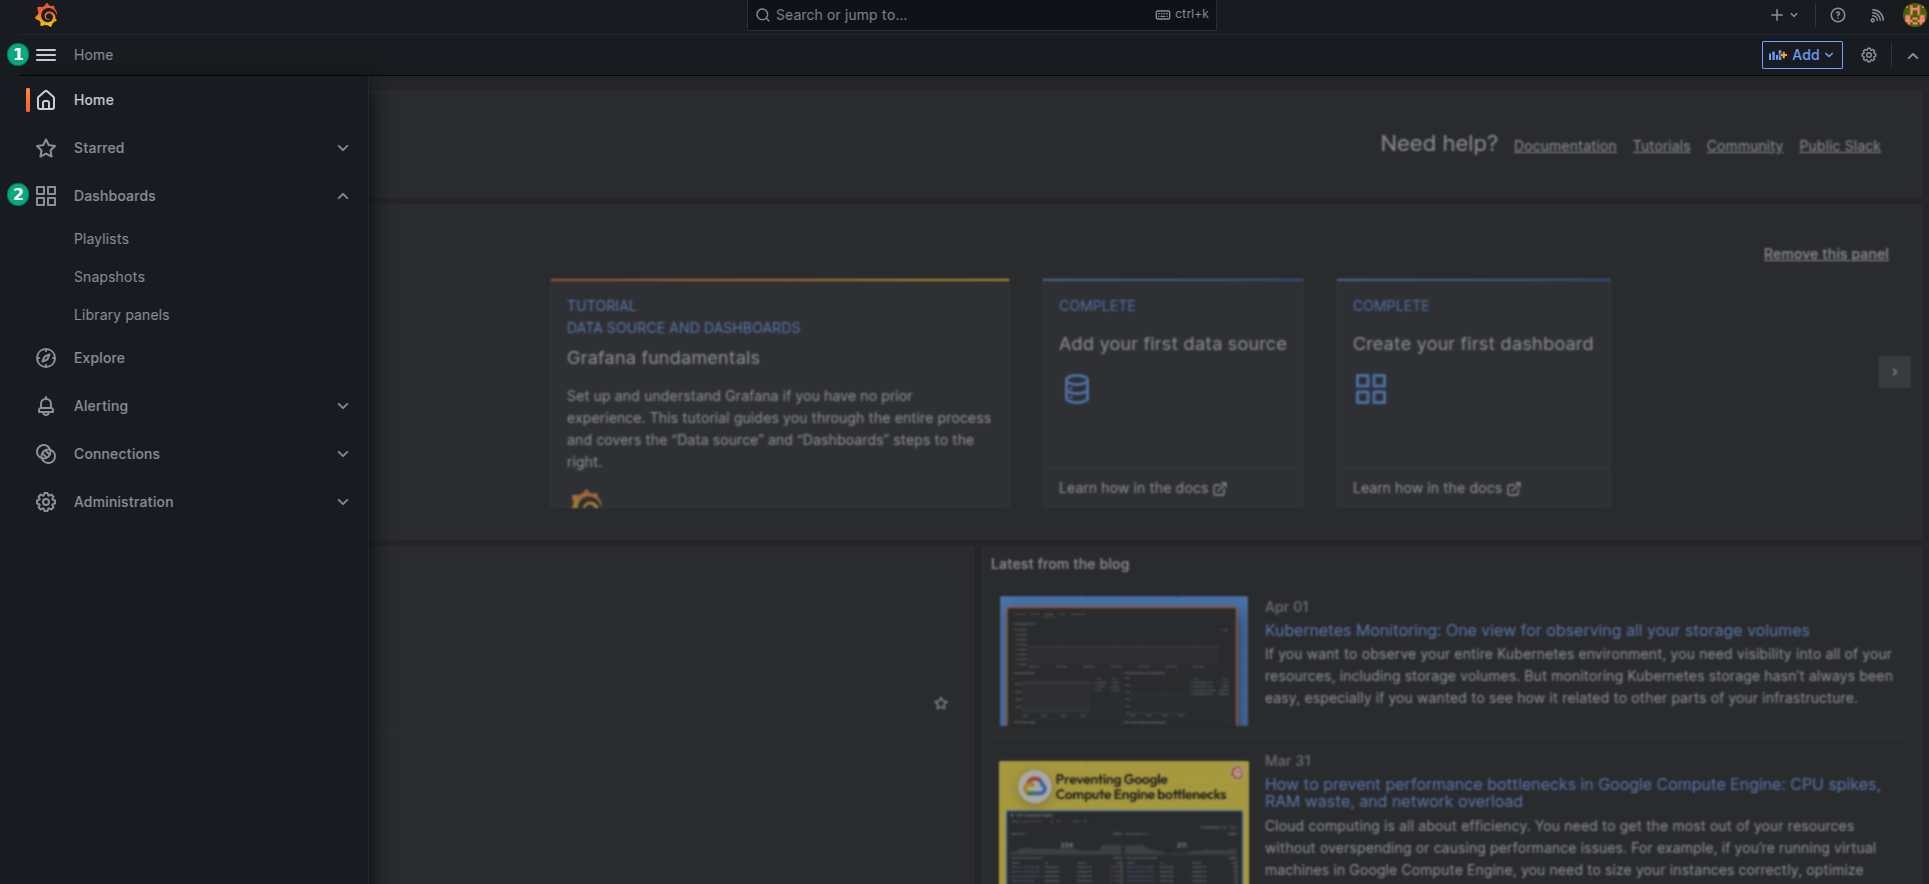
Expand the Grafana menu and click the Dashboards item.
The page with the dashboard list will be displayed. Expand the ADPG Dashboard… item for your cluster to display available dashboards.
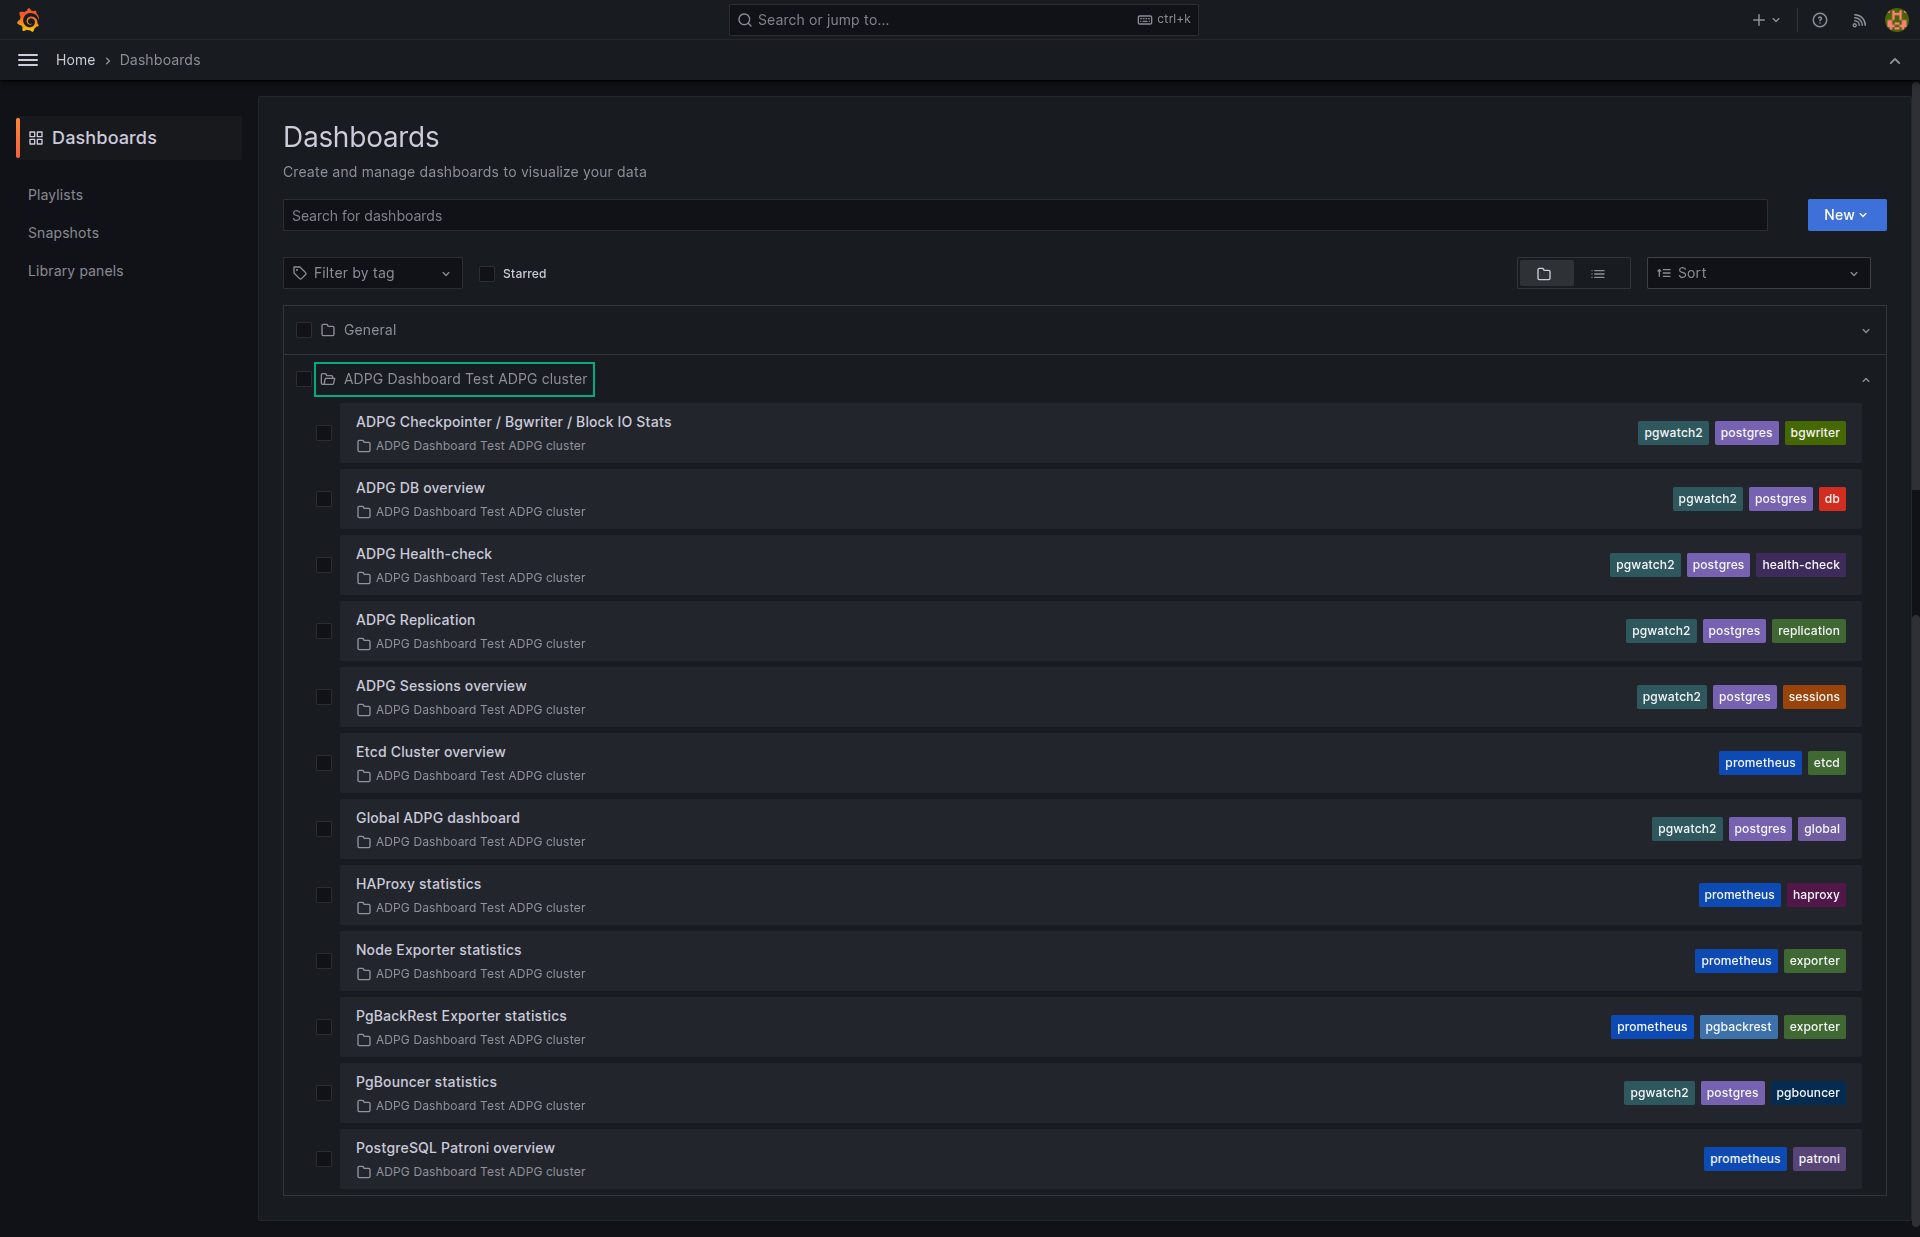
Click on any desired item to view graphs, for example, ADPG DB overview.