

Install monitoring
Overview
Prometheus, a monitoring toolkit, collects and stores monitoring metrics. It receives metrics from a predefined set of sources called exporters.
Grafana collects metrics from Prometheus and visualizes them as charts. Grafana in ADB ES includes a set of pre-configured dashboards that reflect the state of your cluster, databases, and hosts.
Step 1. Add the service
-
In the ADCM interface, open the Clusters page and click your ADB ES cluster name. On the cluster page that opens, switch to the Services tab and click Add services.
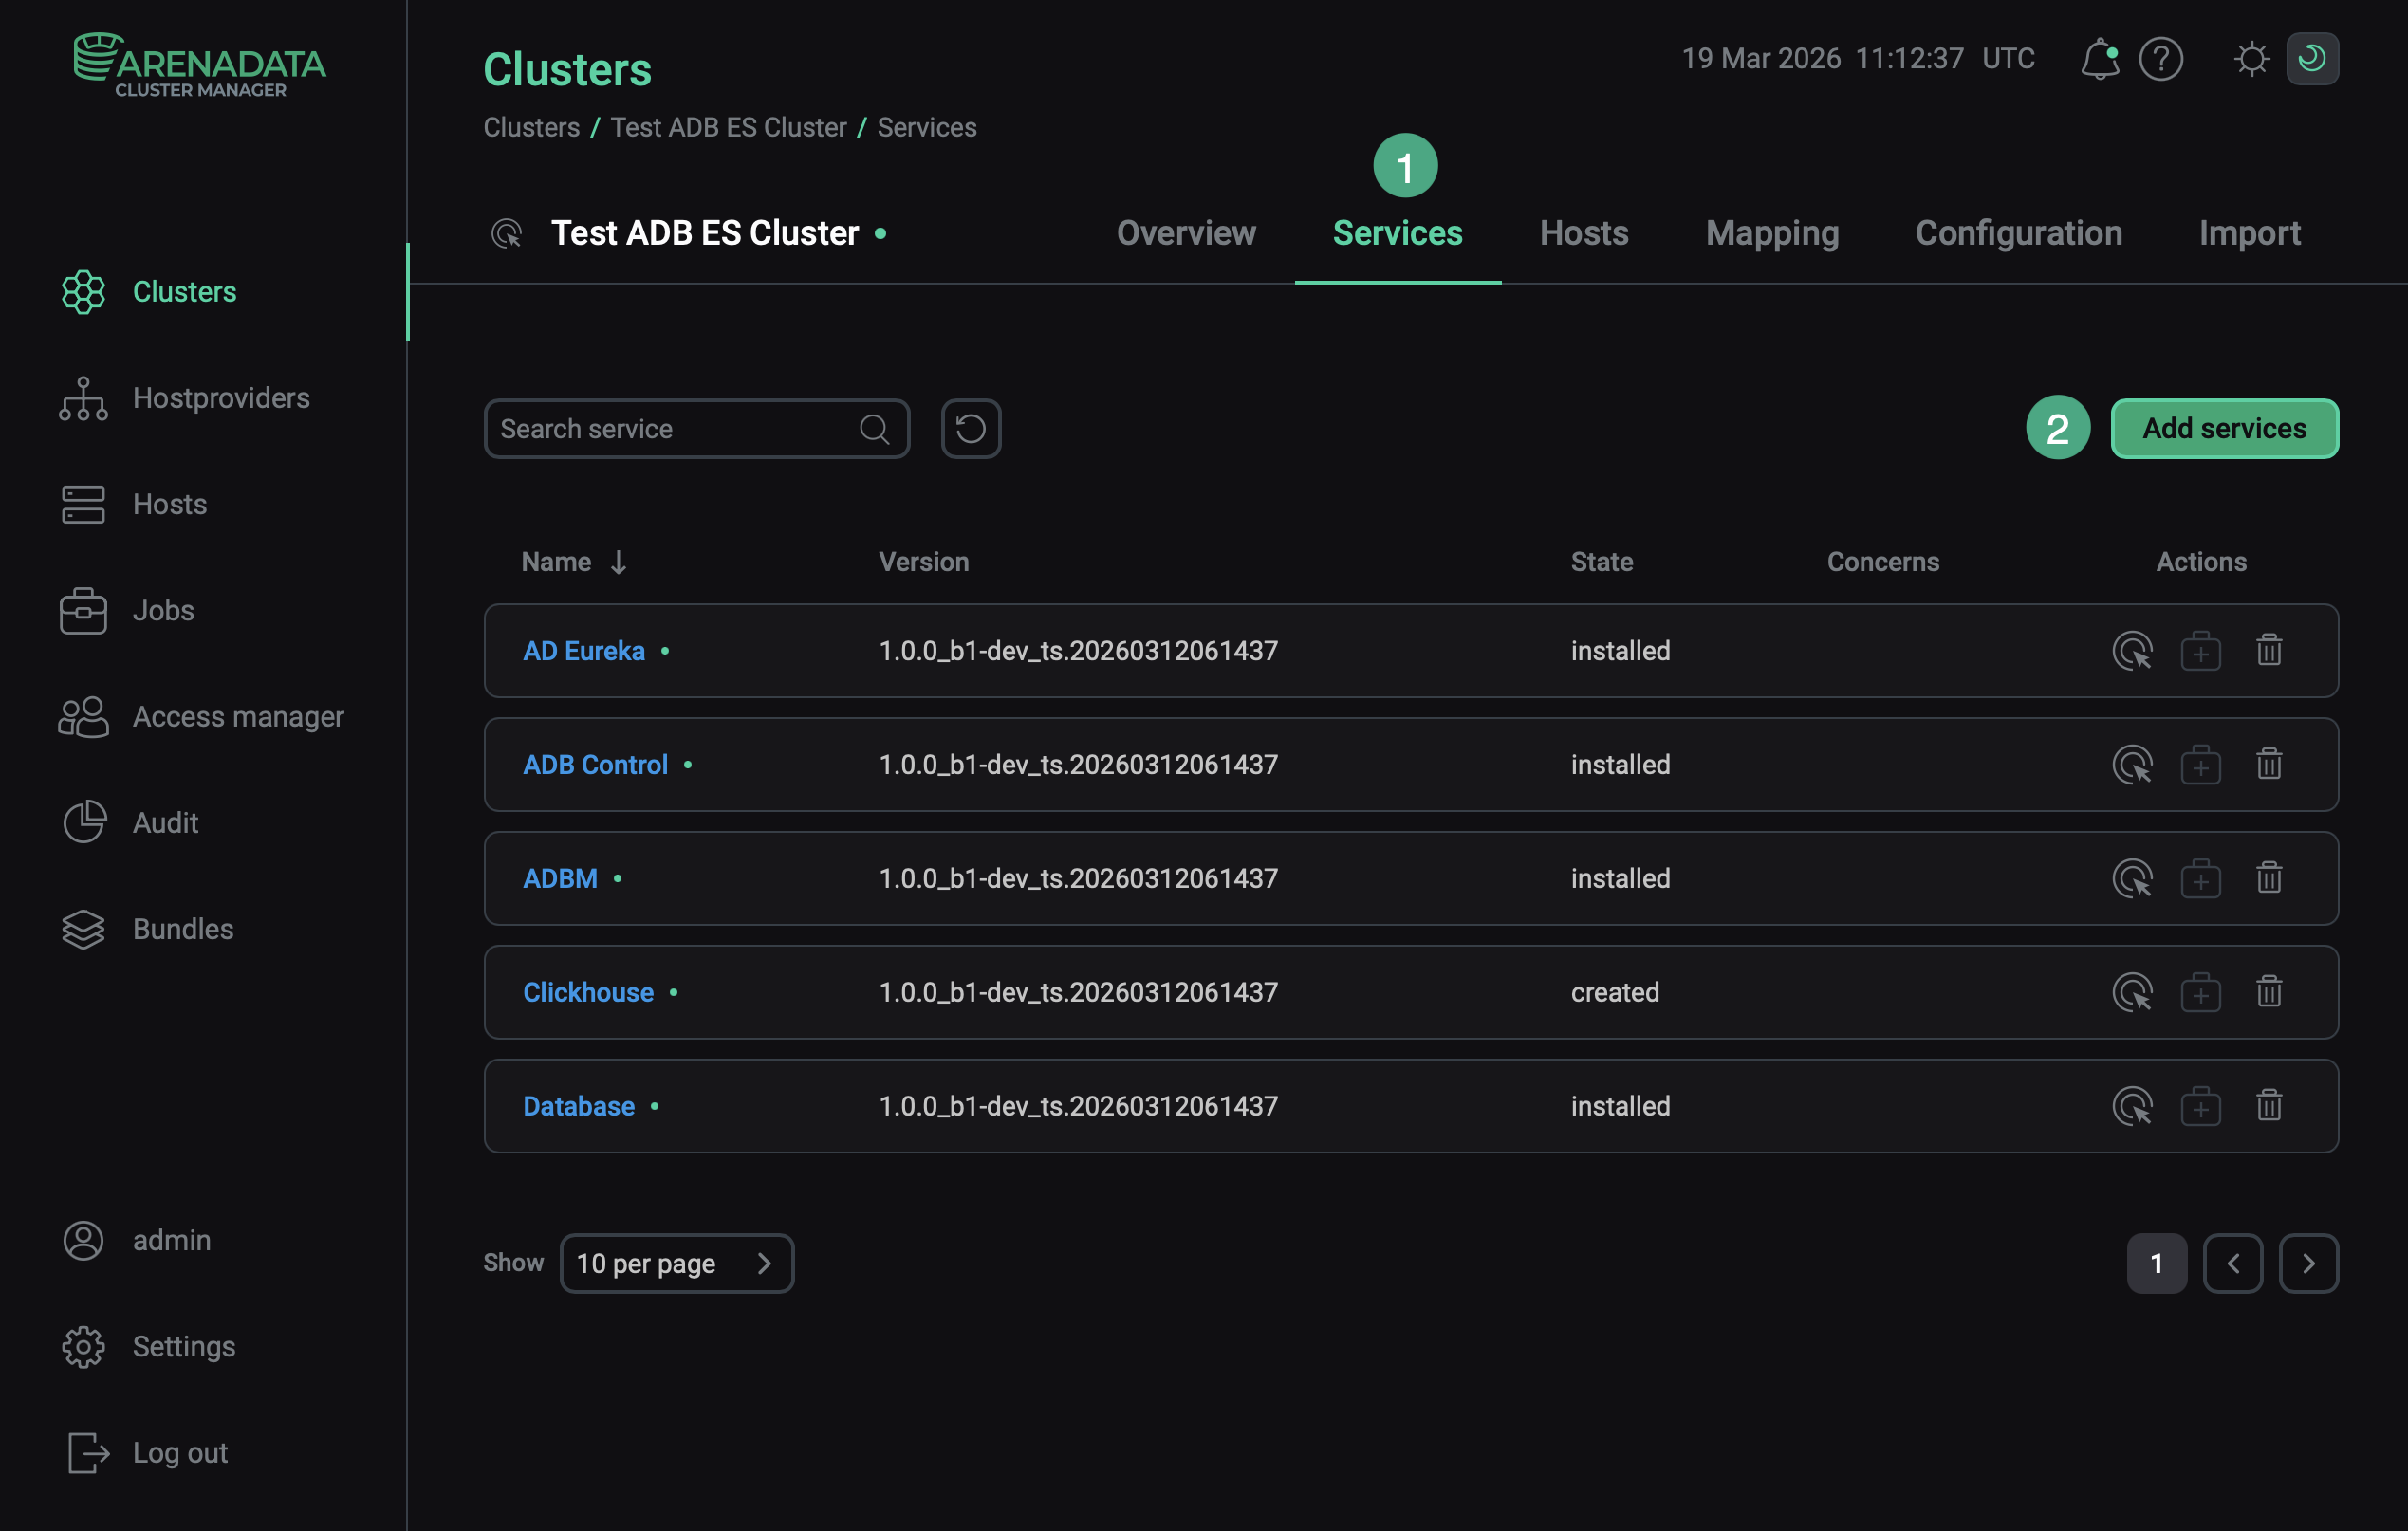 Switch to adding services
 -
In the opened dialog, select the Monitoring service and click Add.
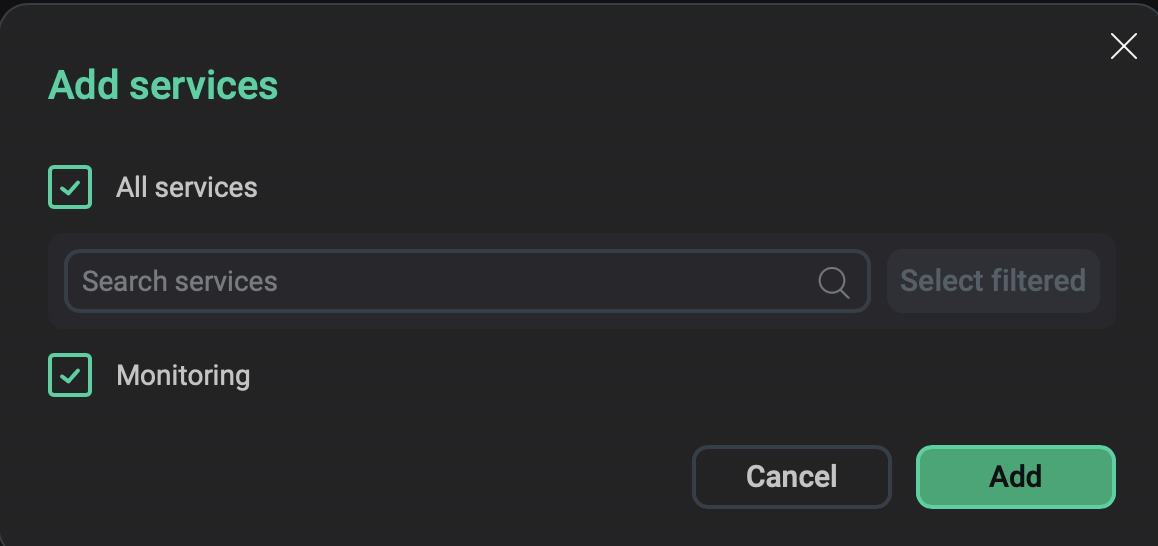 Select the service
As a result, the added service is displayed on the Services tab.
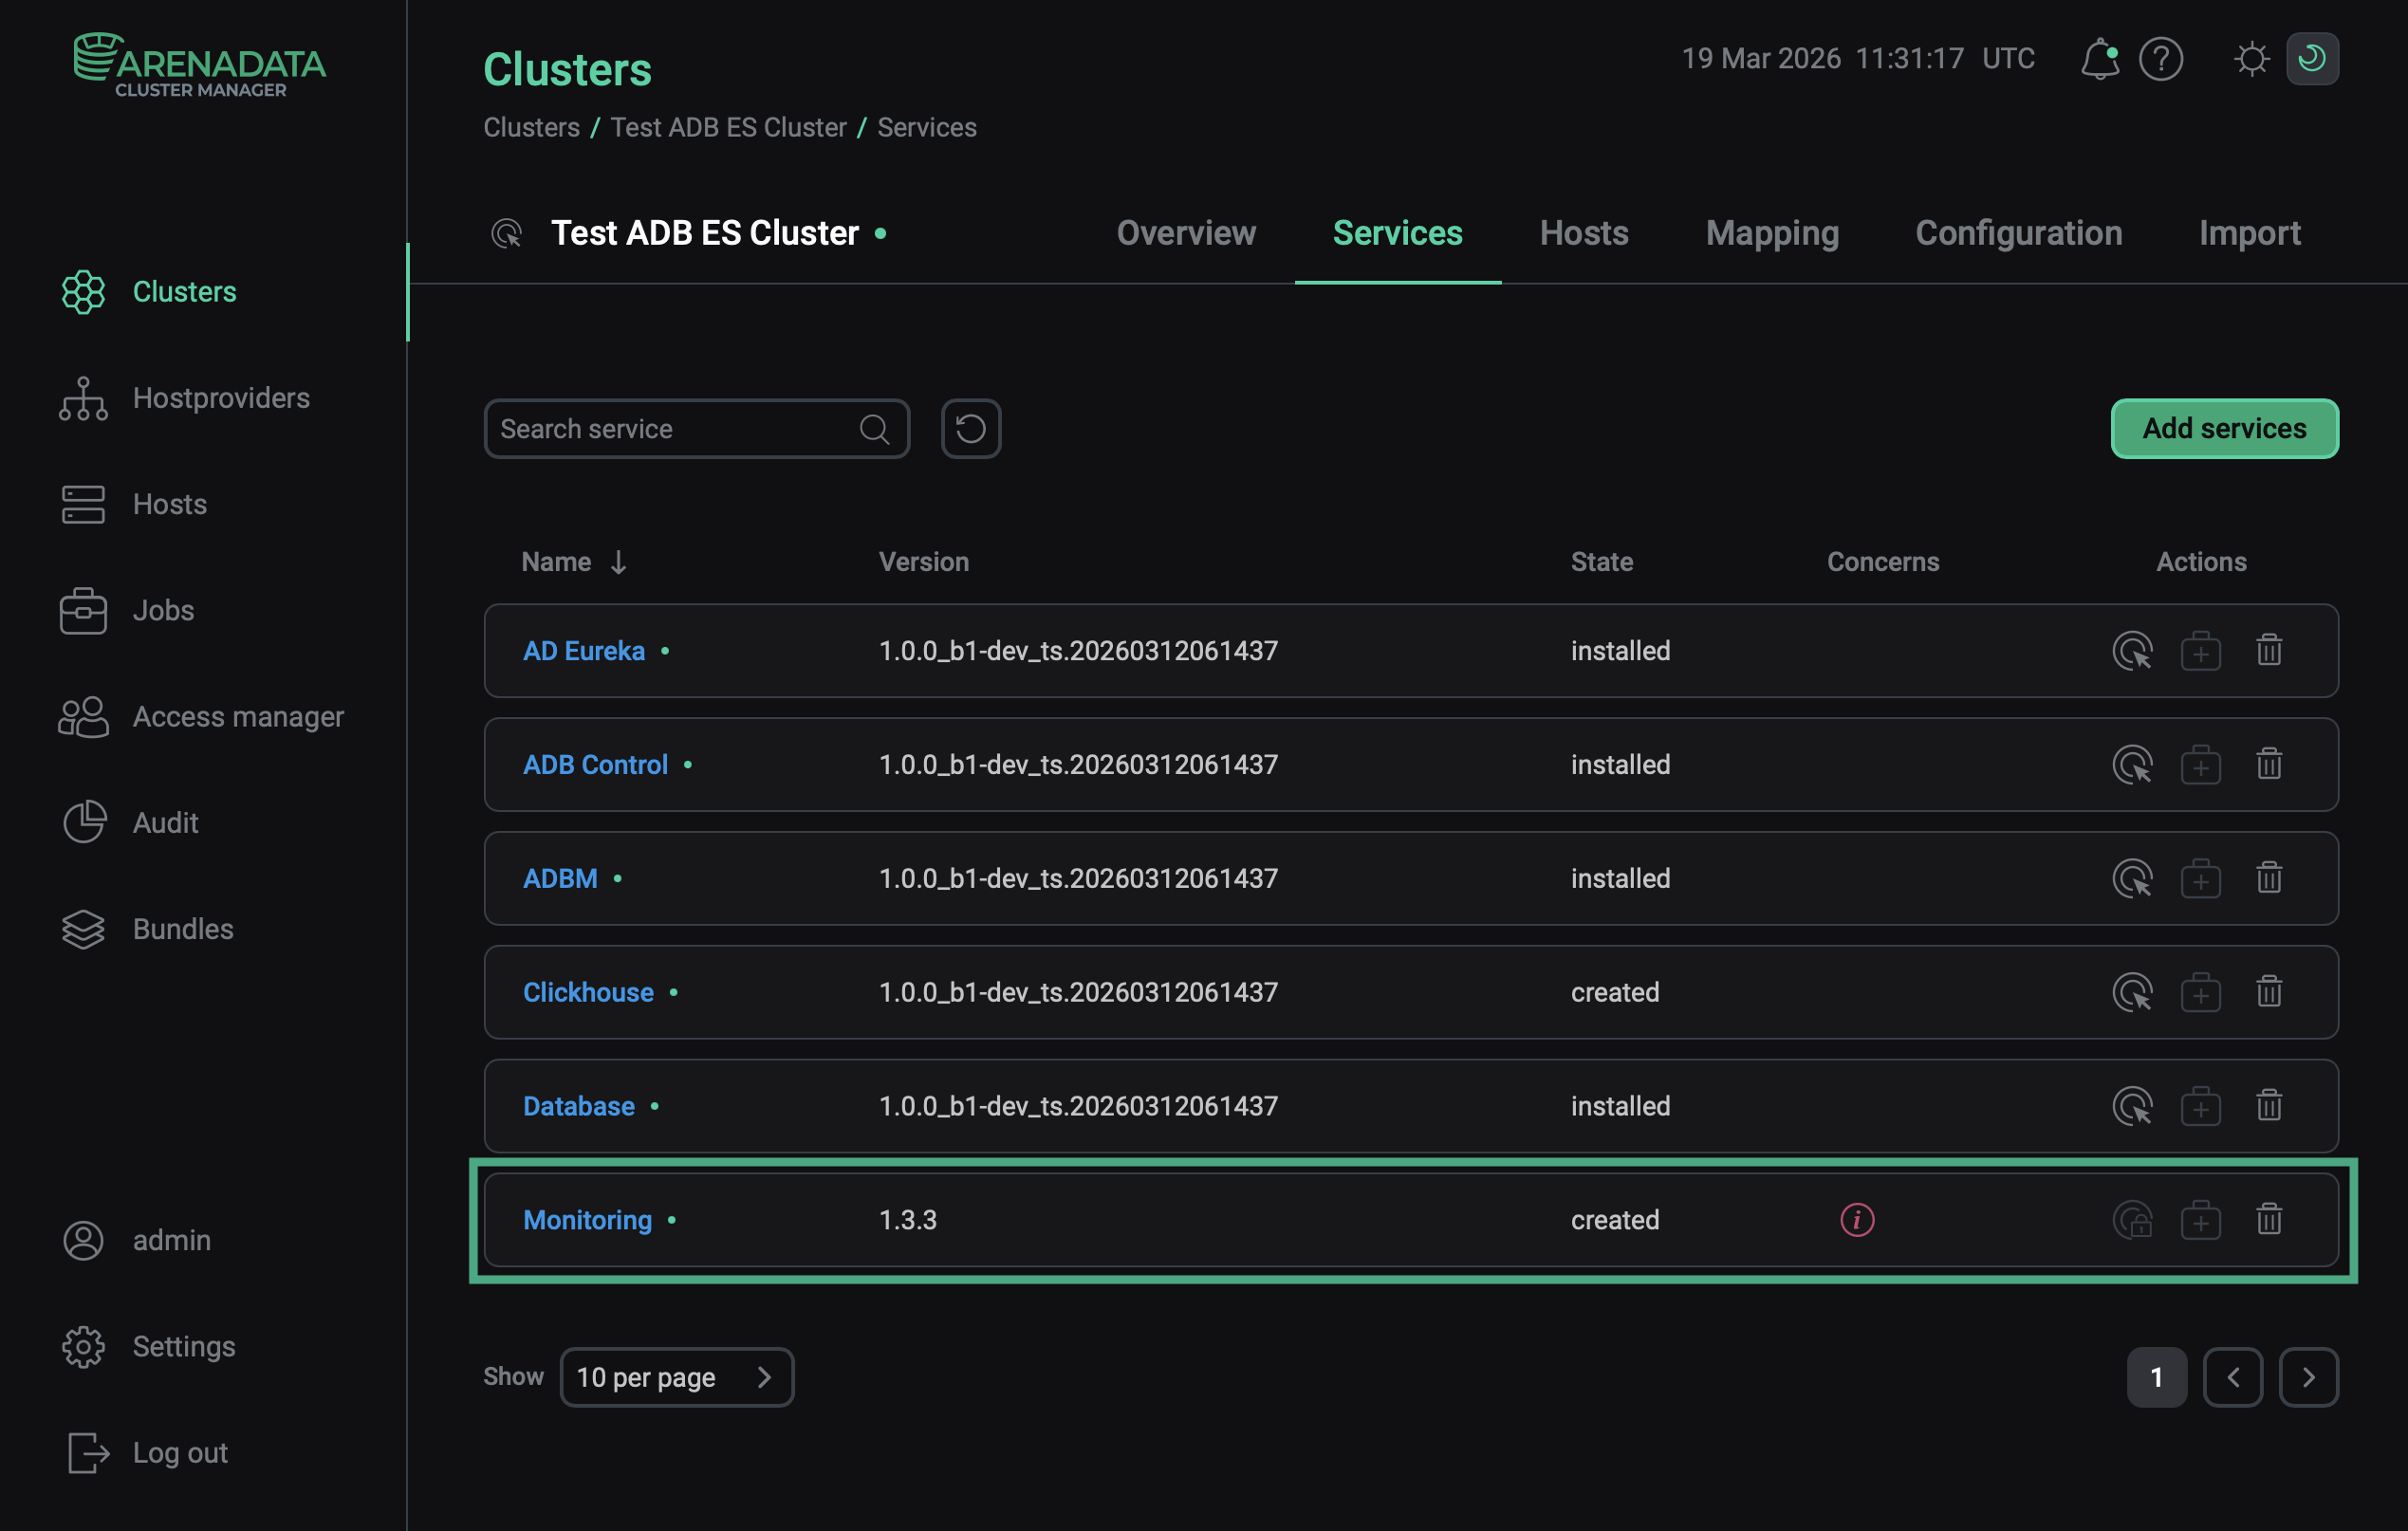 The result of successfully adding the service to the cluster
Step 2. Add components
-
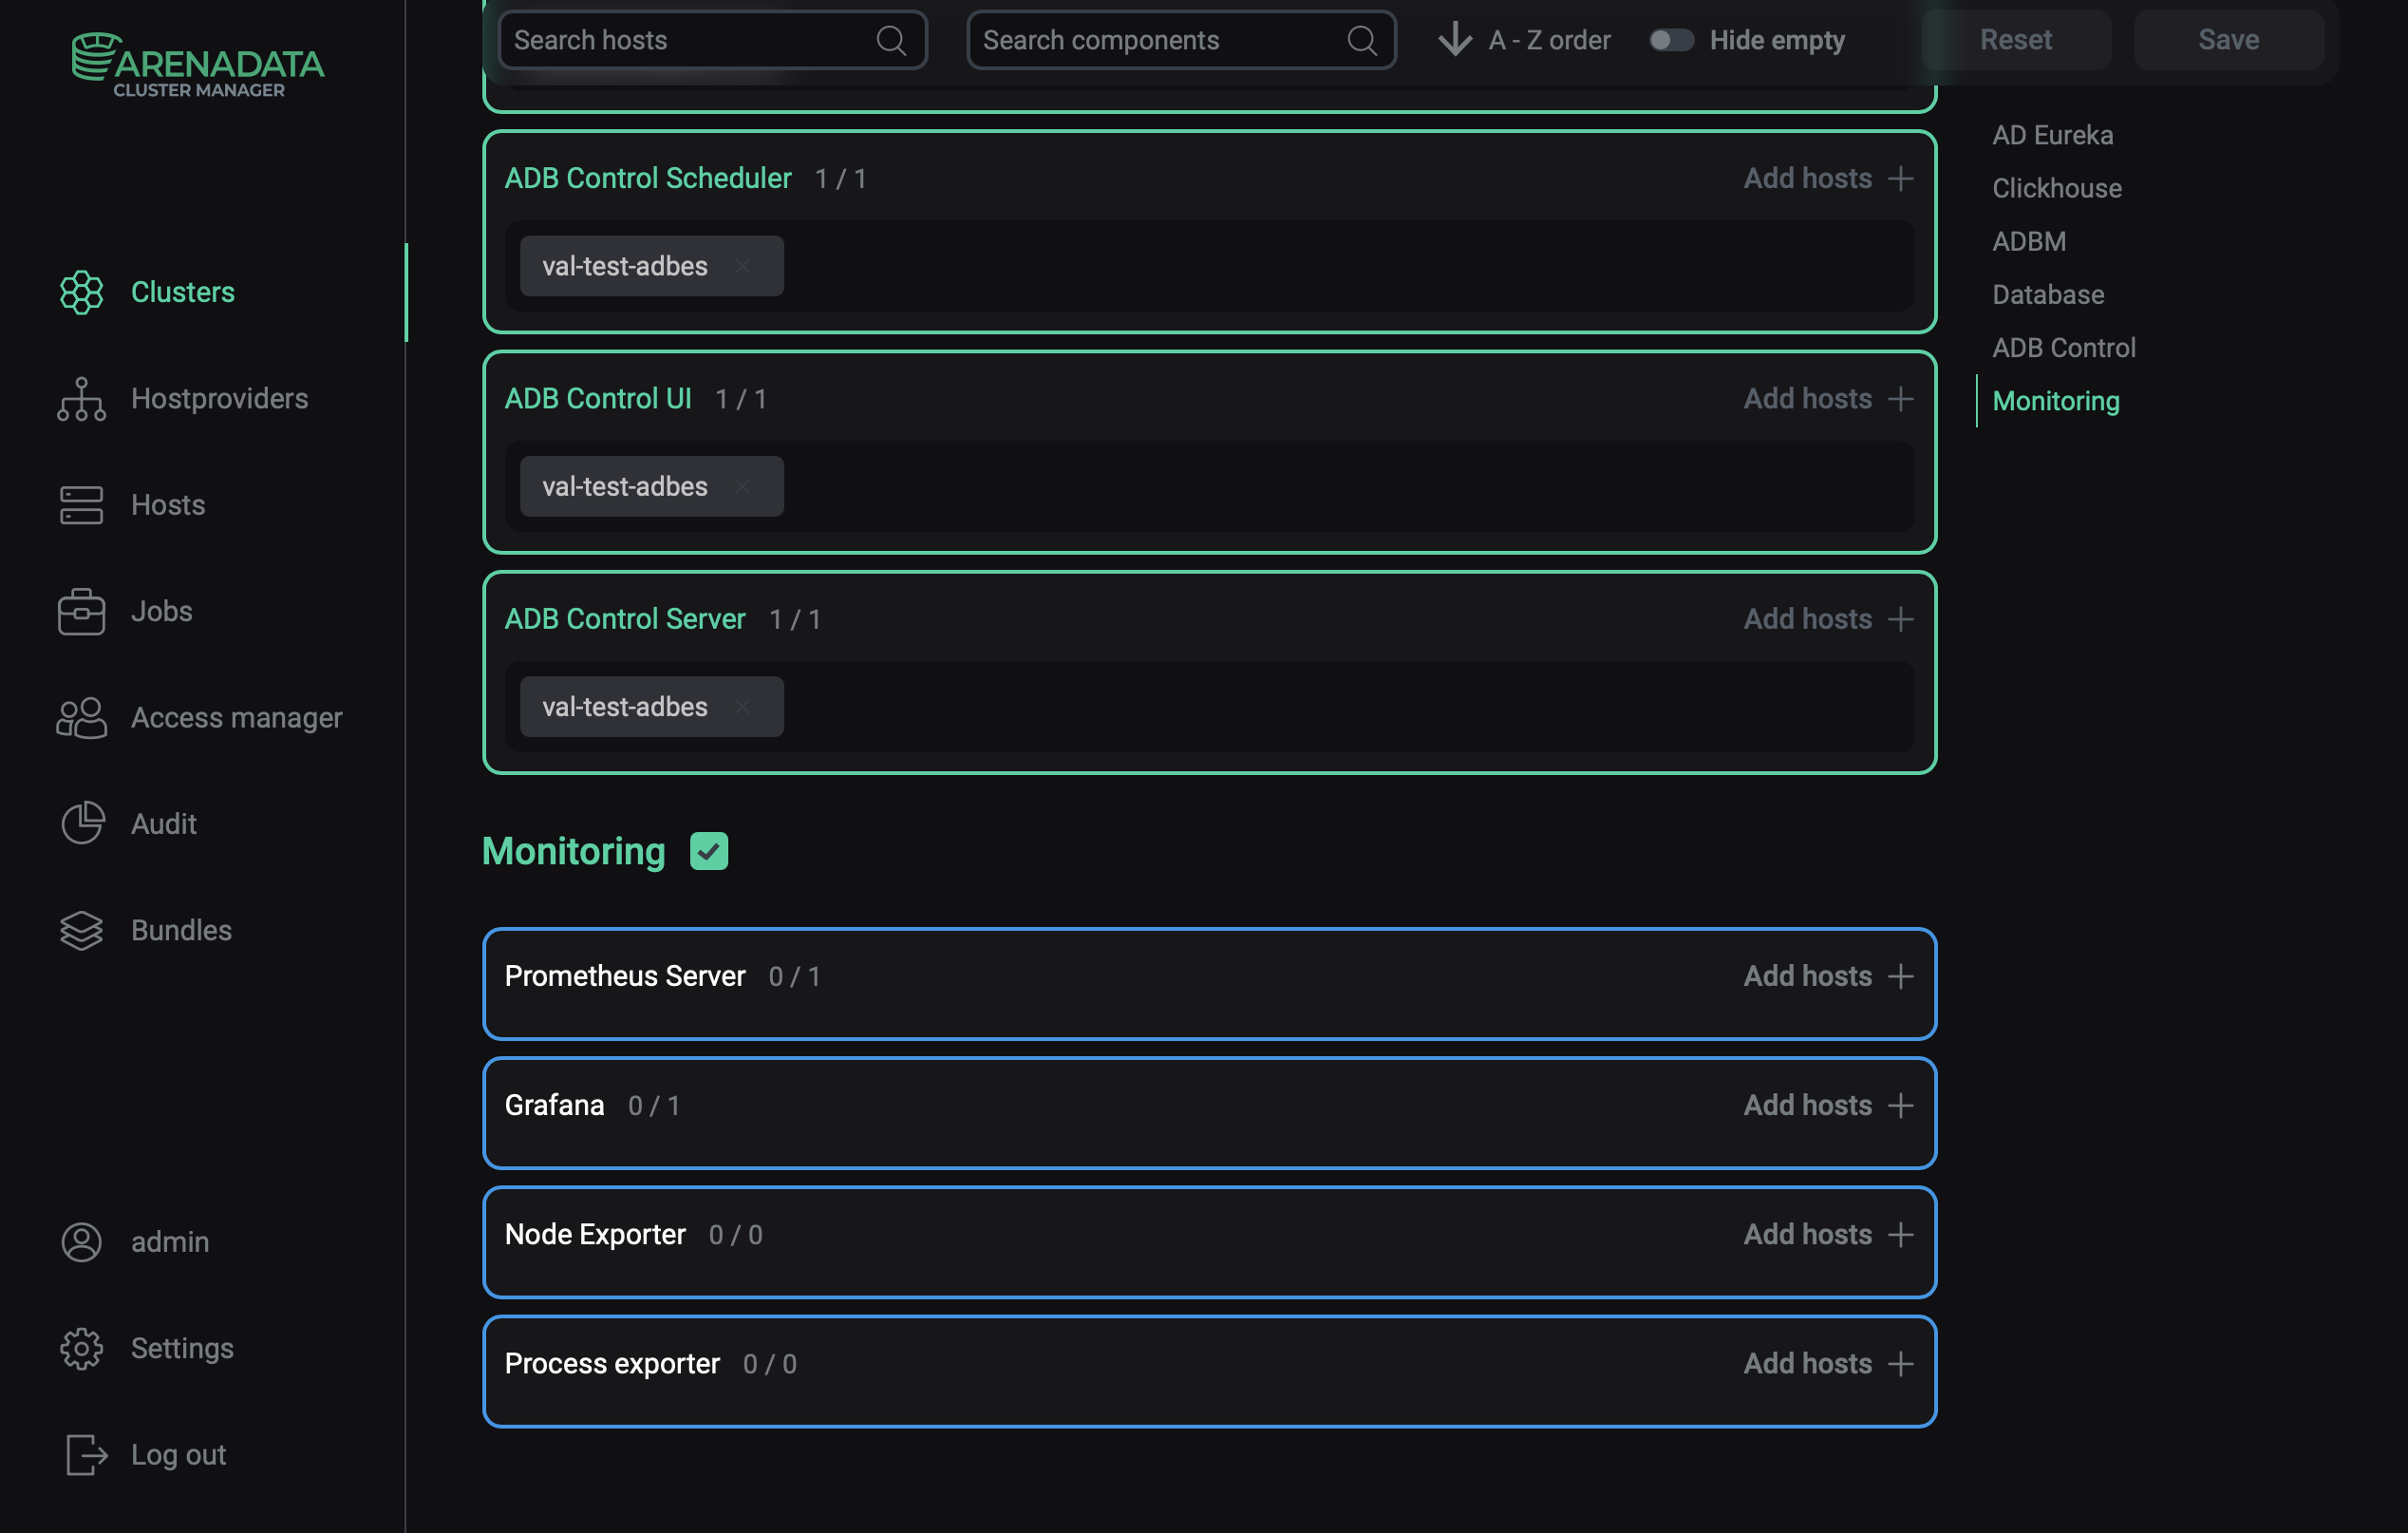
On the cluster page, open the Mapping tab to proceed to mapping service components to cluster hosts. Scroll down to the Monitoring section.
 Switch to mapping service components
 -
Assign hosts to components of the Monitoring service — click Add hosts and select the hosts:
-
The Prometheus Server and Grafana components are recommended to be installed on a host separate from ADB ES components. This setup ensures independent monitoring access even during an ADB ES failure.
-
For the Node Exporter component, select hosts from which you want to collect hardware and operating system metrics. In practice, this means installing it on every host in the cluster.
-
For the Process Exporter component, select hosts where ADBM and ADB Control are installed.
For example, map the components as depicted in the image below.
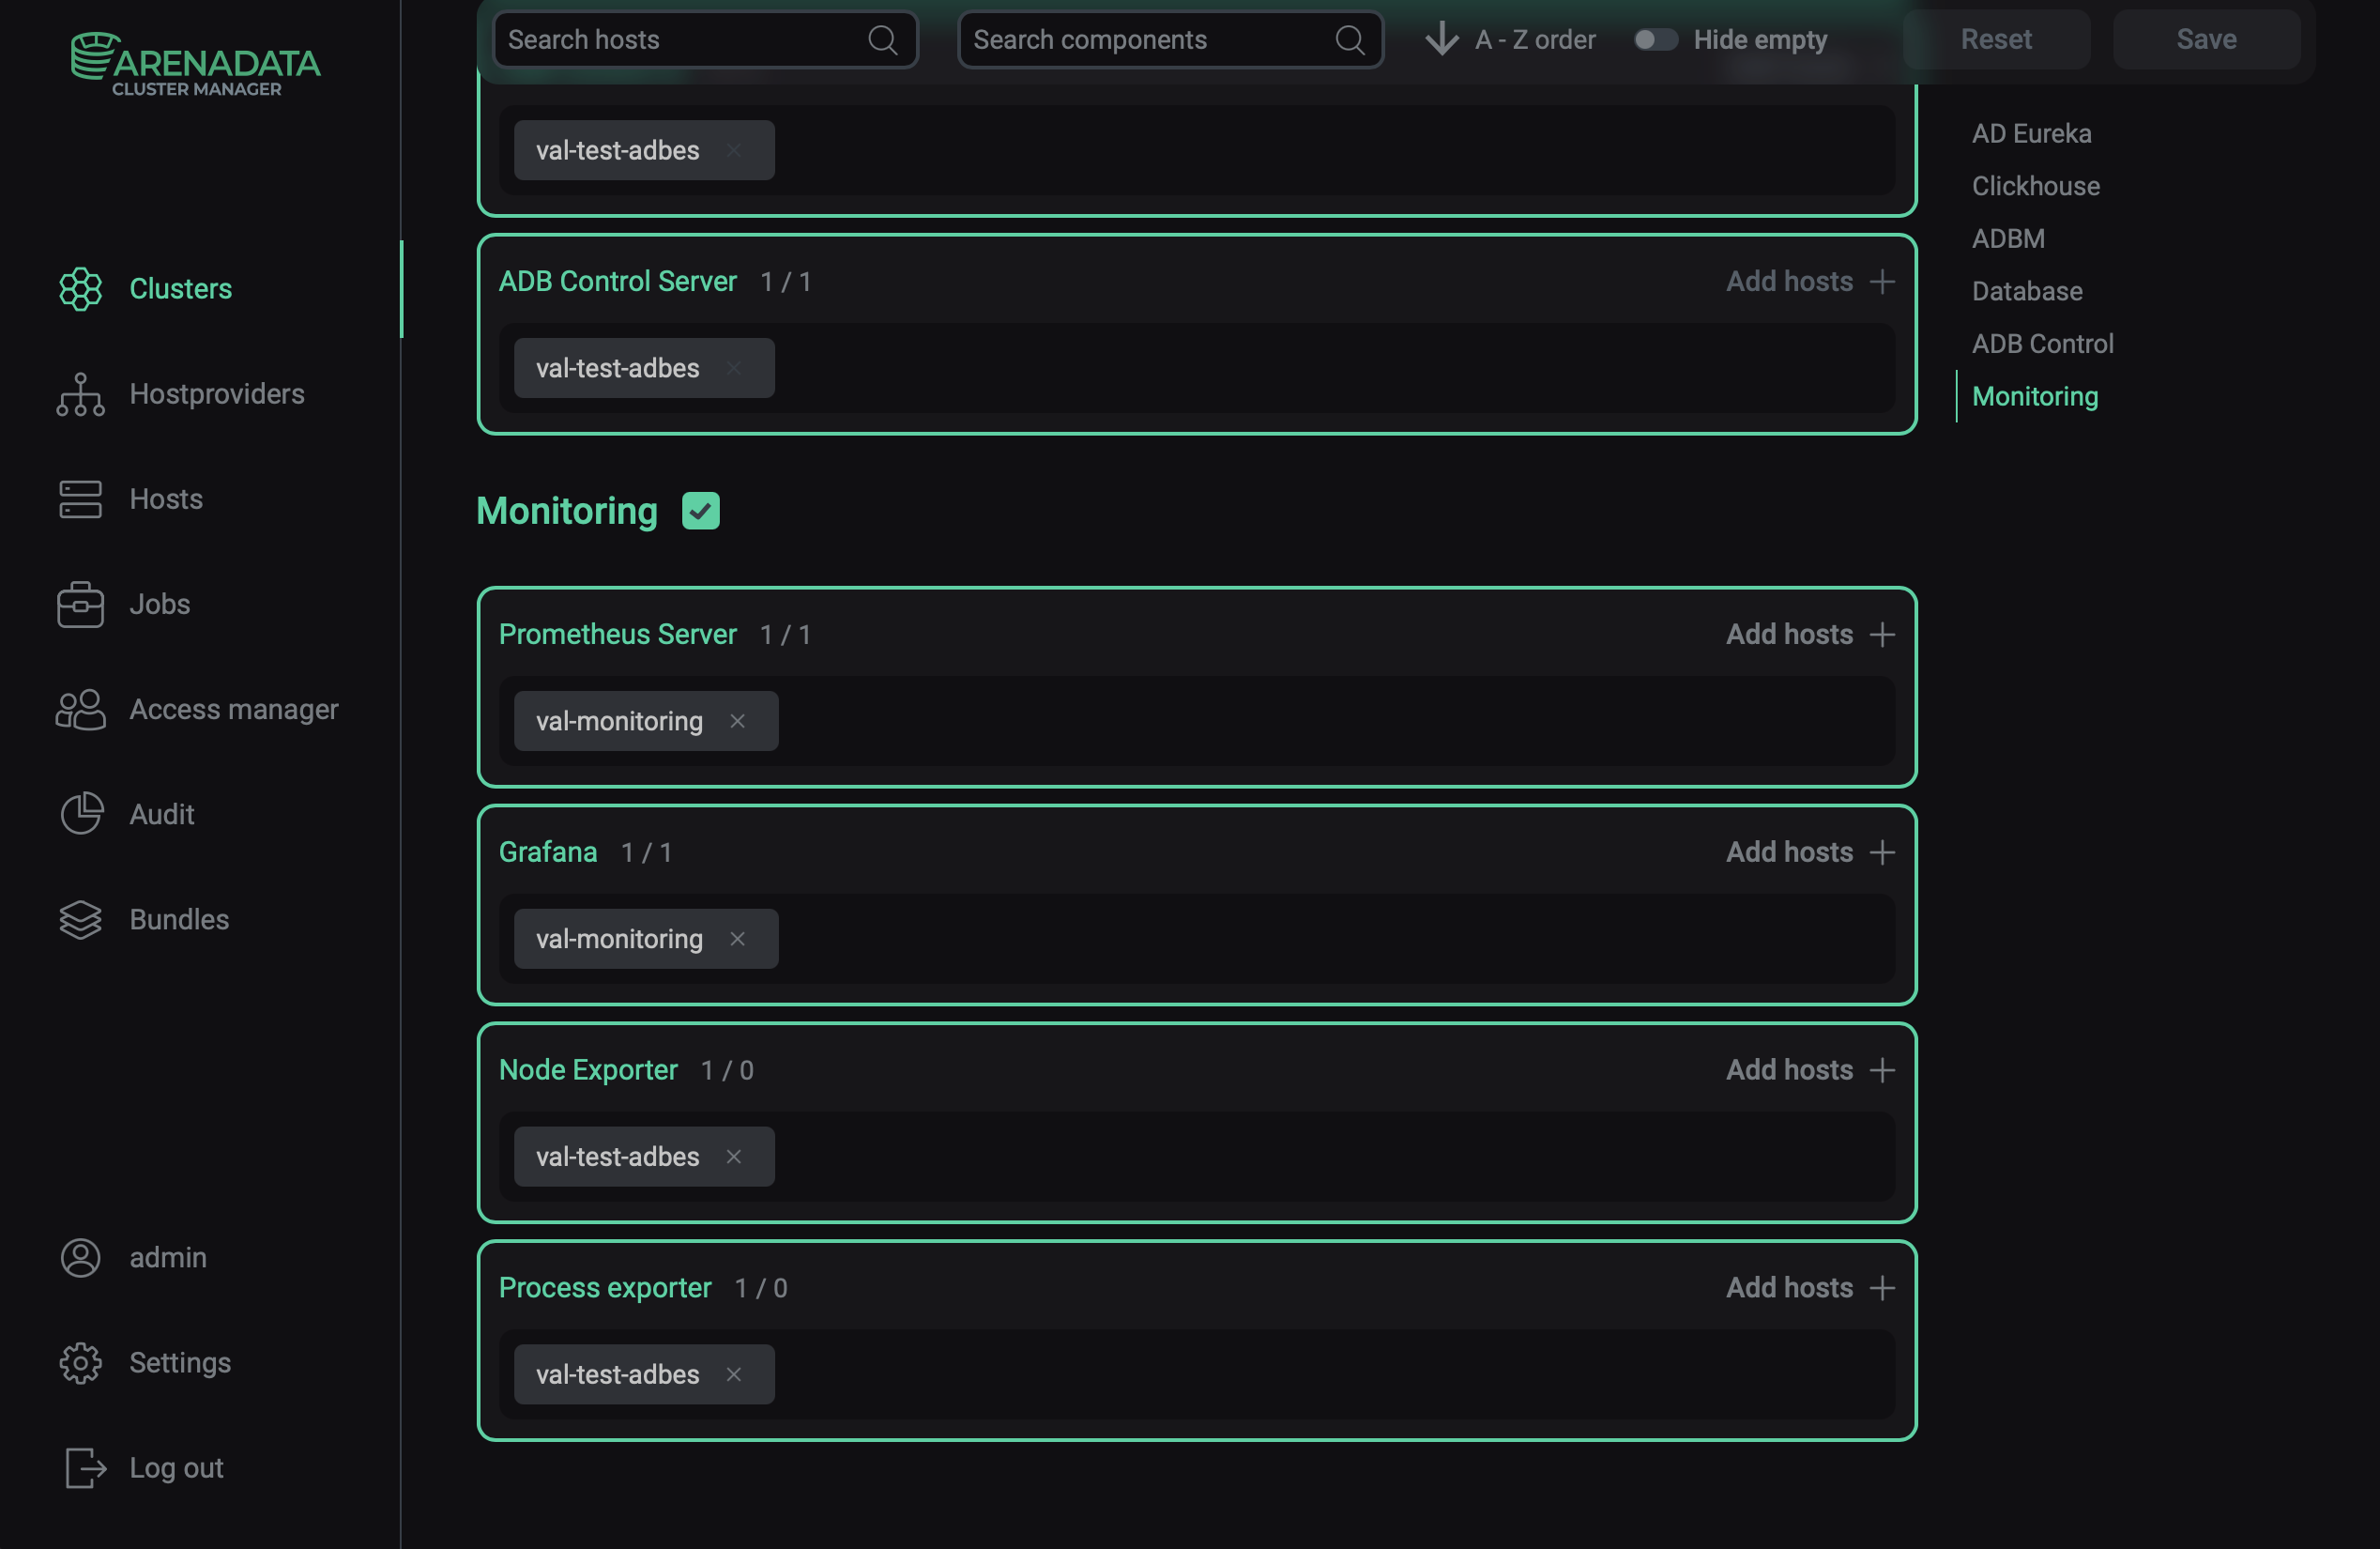 Mapping of monitoring components
-
-
Click Save to save the mapping.
Step 3. Configure the service
-
Open the Services tab on the cluster page and click the Monitoring service name in the Name column.
-
On the page that opens, fill in the service configuration parameters — see the Monitoring section in the Configuration parameters article for parameter descriptions. Fields highlighted in red are required.
You will need the password from the Grafana administrator’s password field to open the Grafana web interface and view dashboards.
If you need to access the Prometheus web interface, create a user account for it using Prometheus settings → Prometheus users to login/logout to Prometheus.
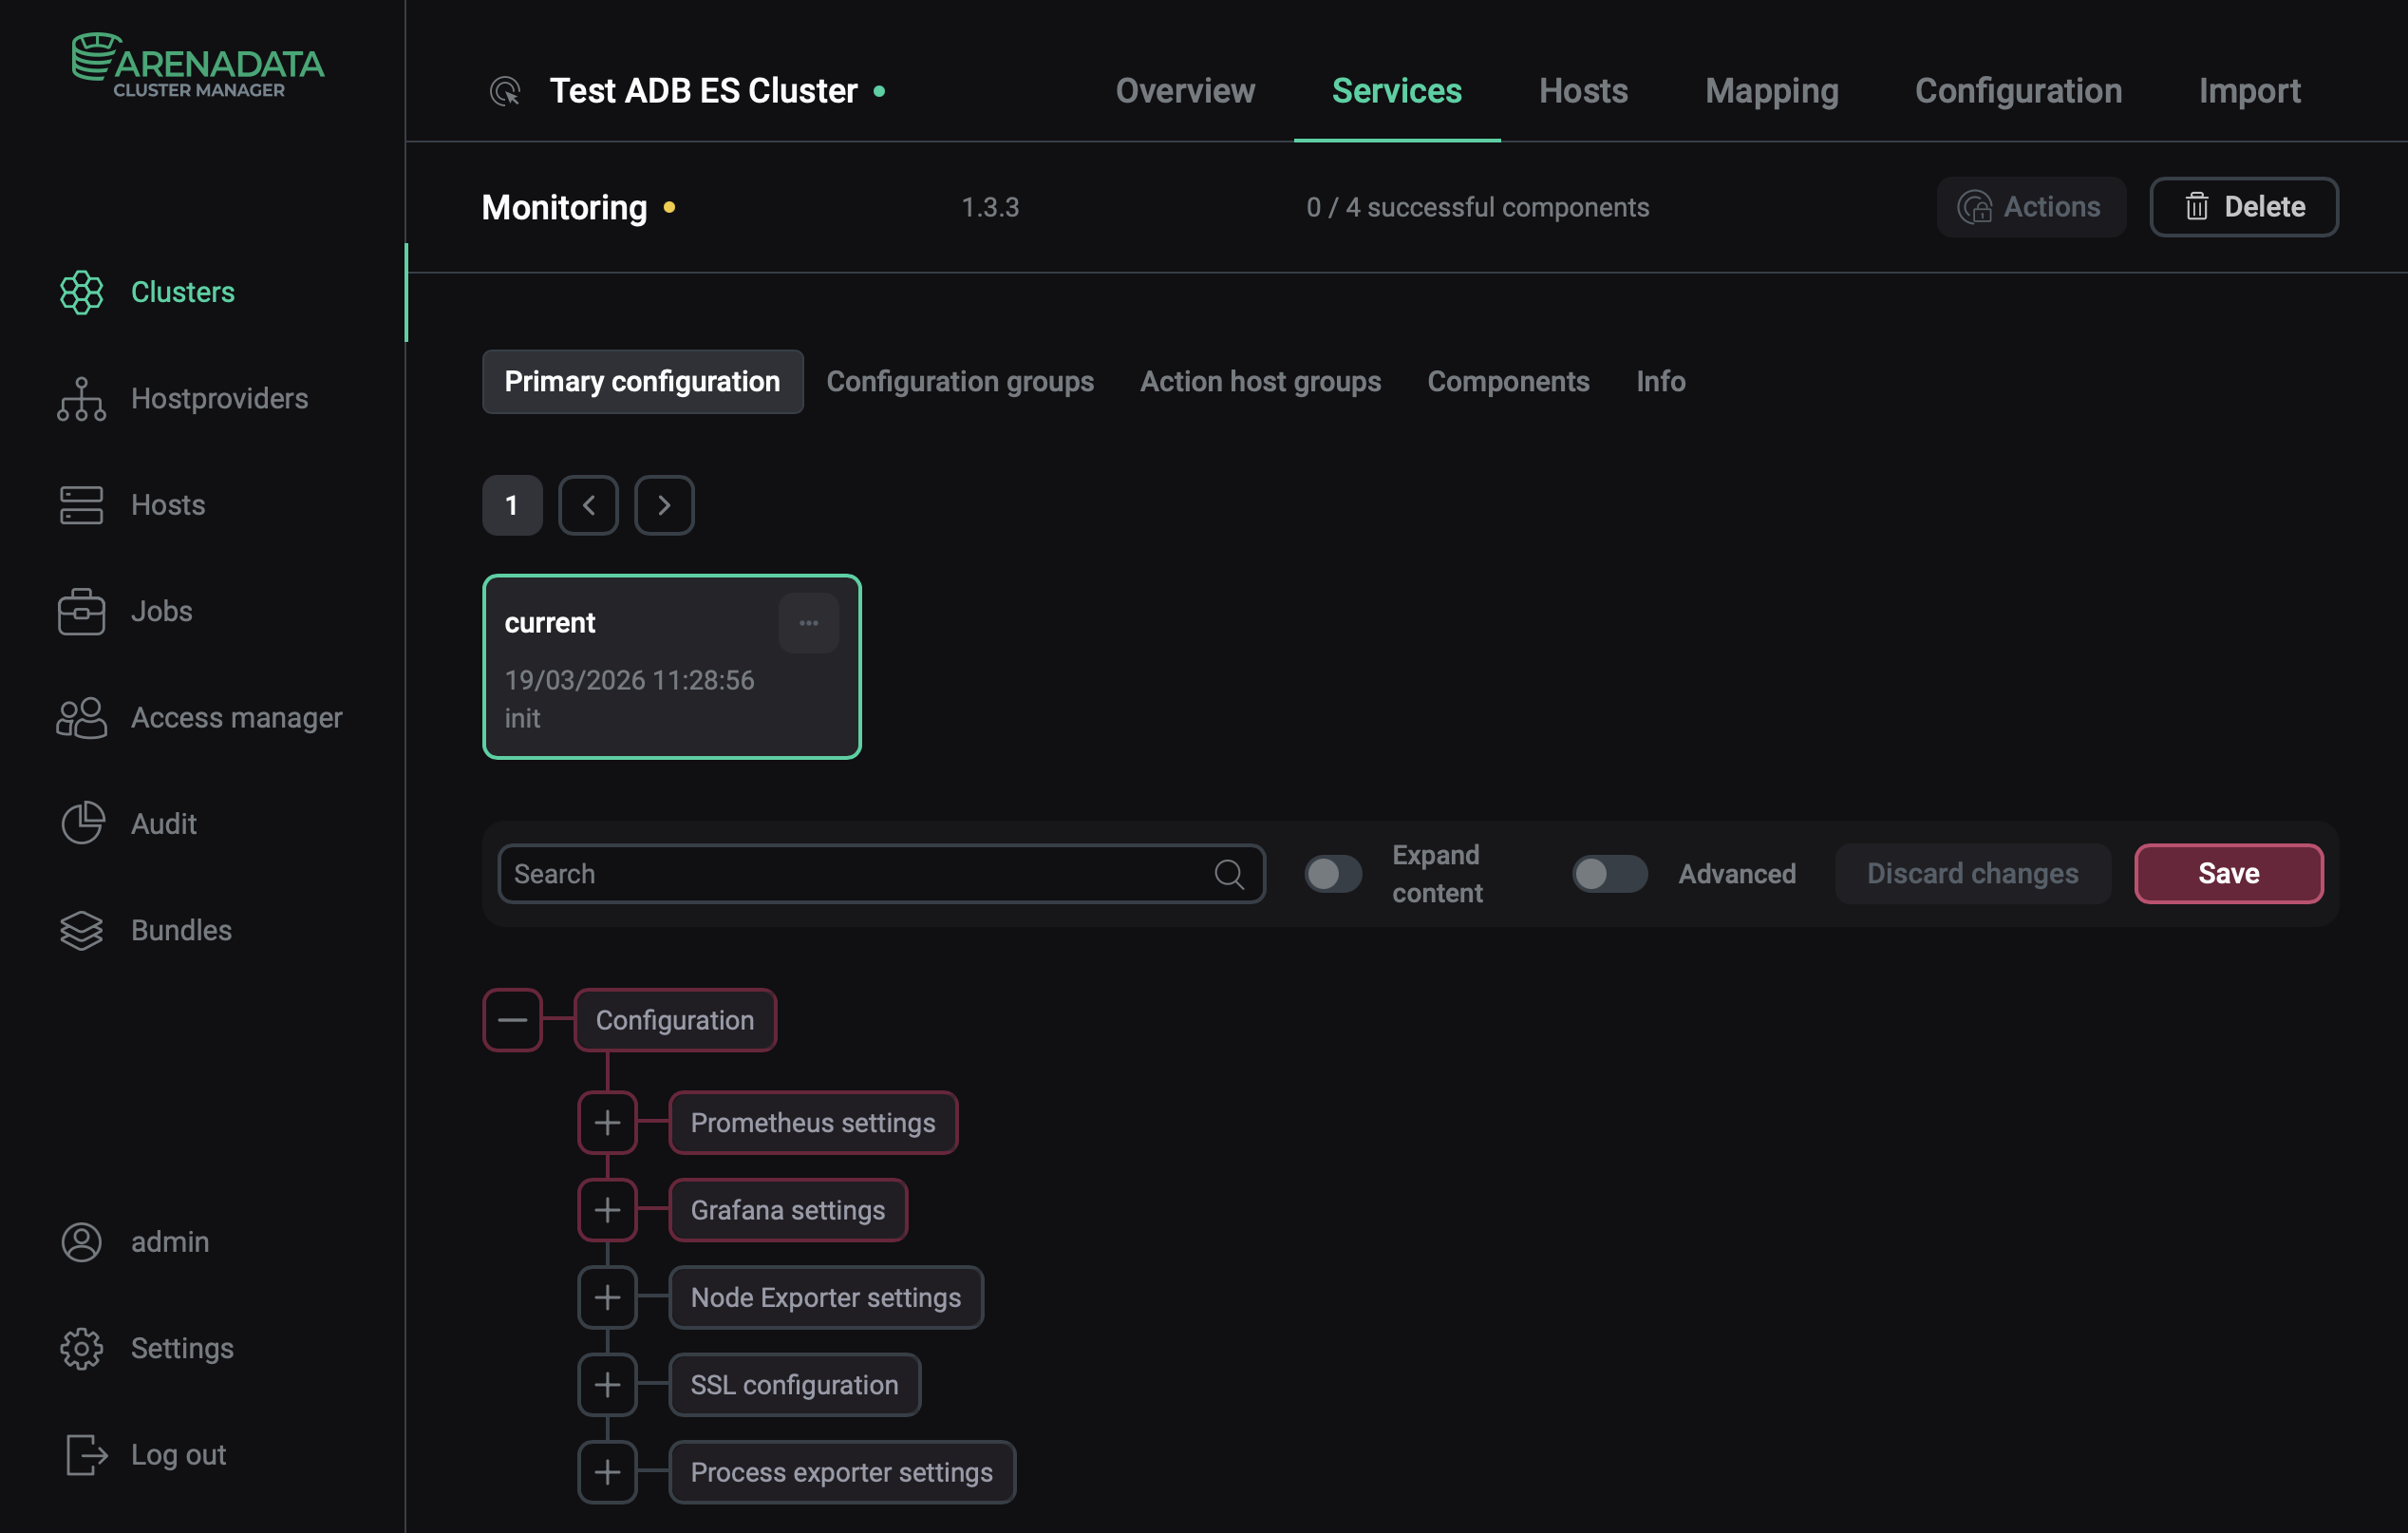 Configure the Monitoring service
 -
After specifying all necessary parameters, click Save.
Step 4. Install the service
-
On the Services tab, click the icon

 for the Monitoring service in the Actions column and run the Install action.
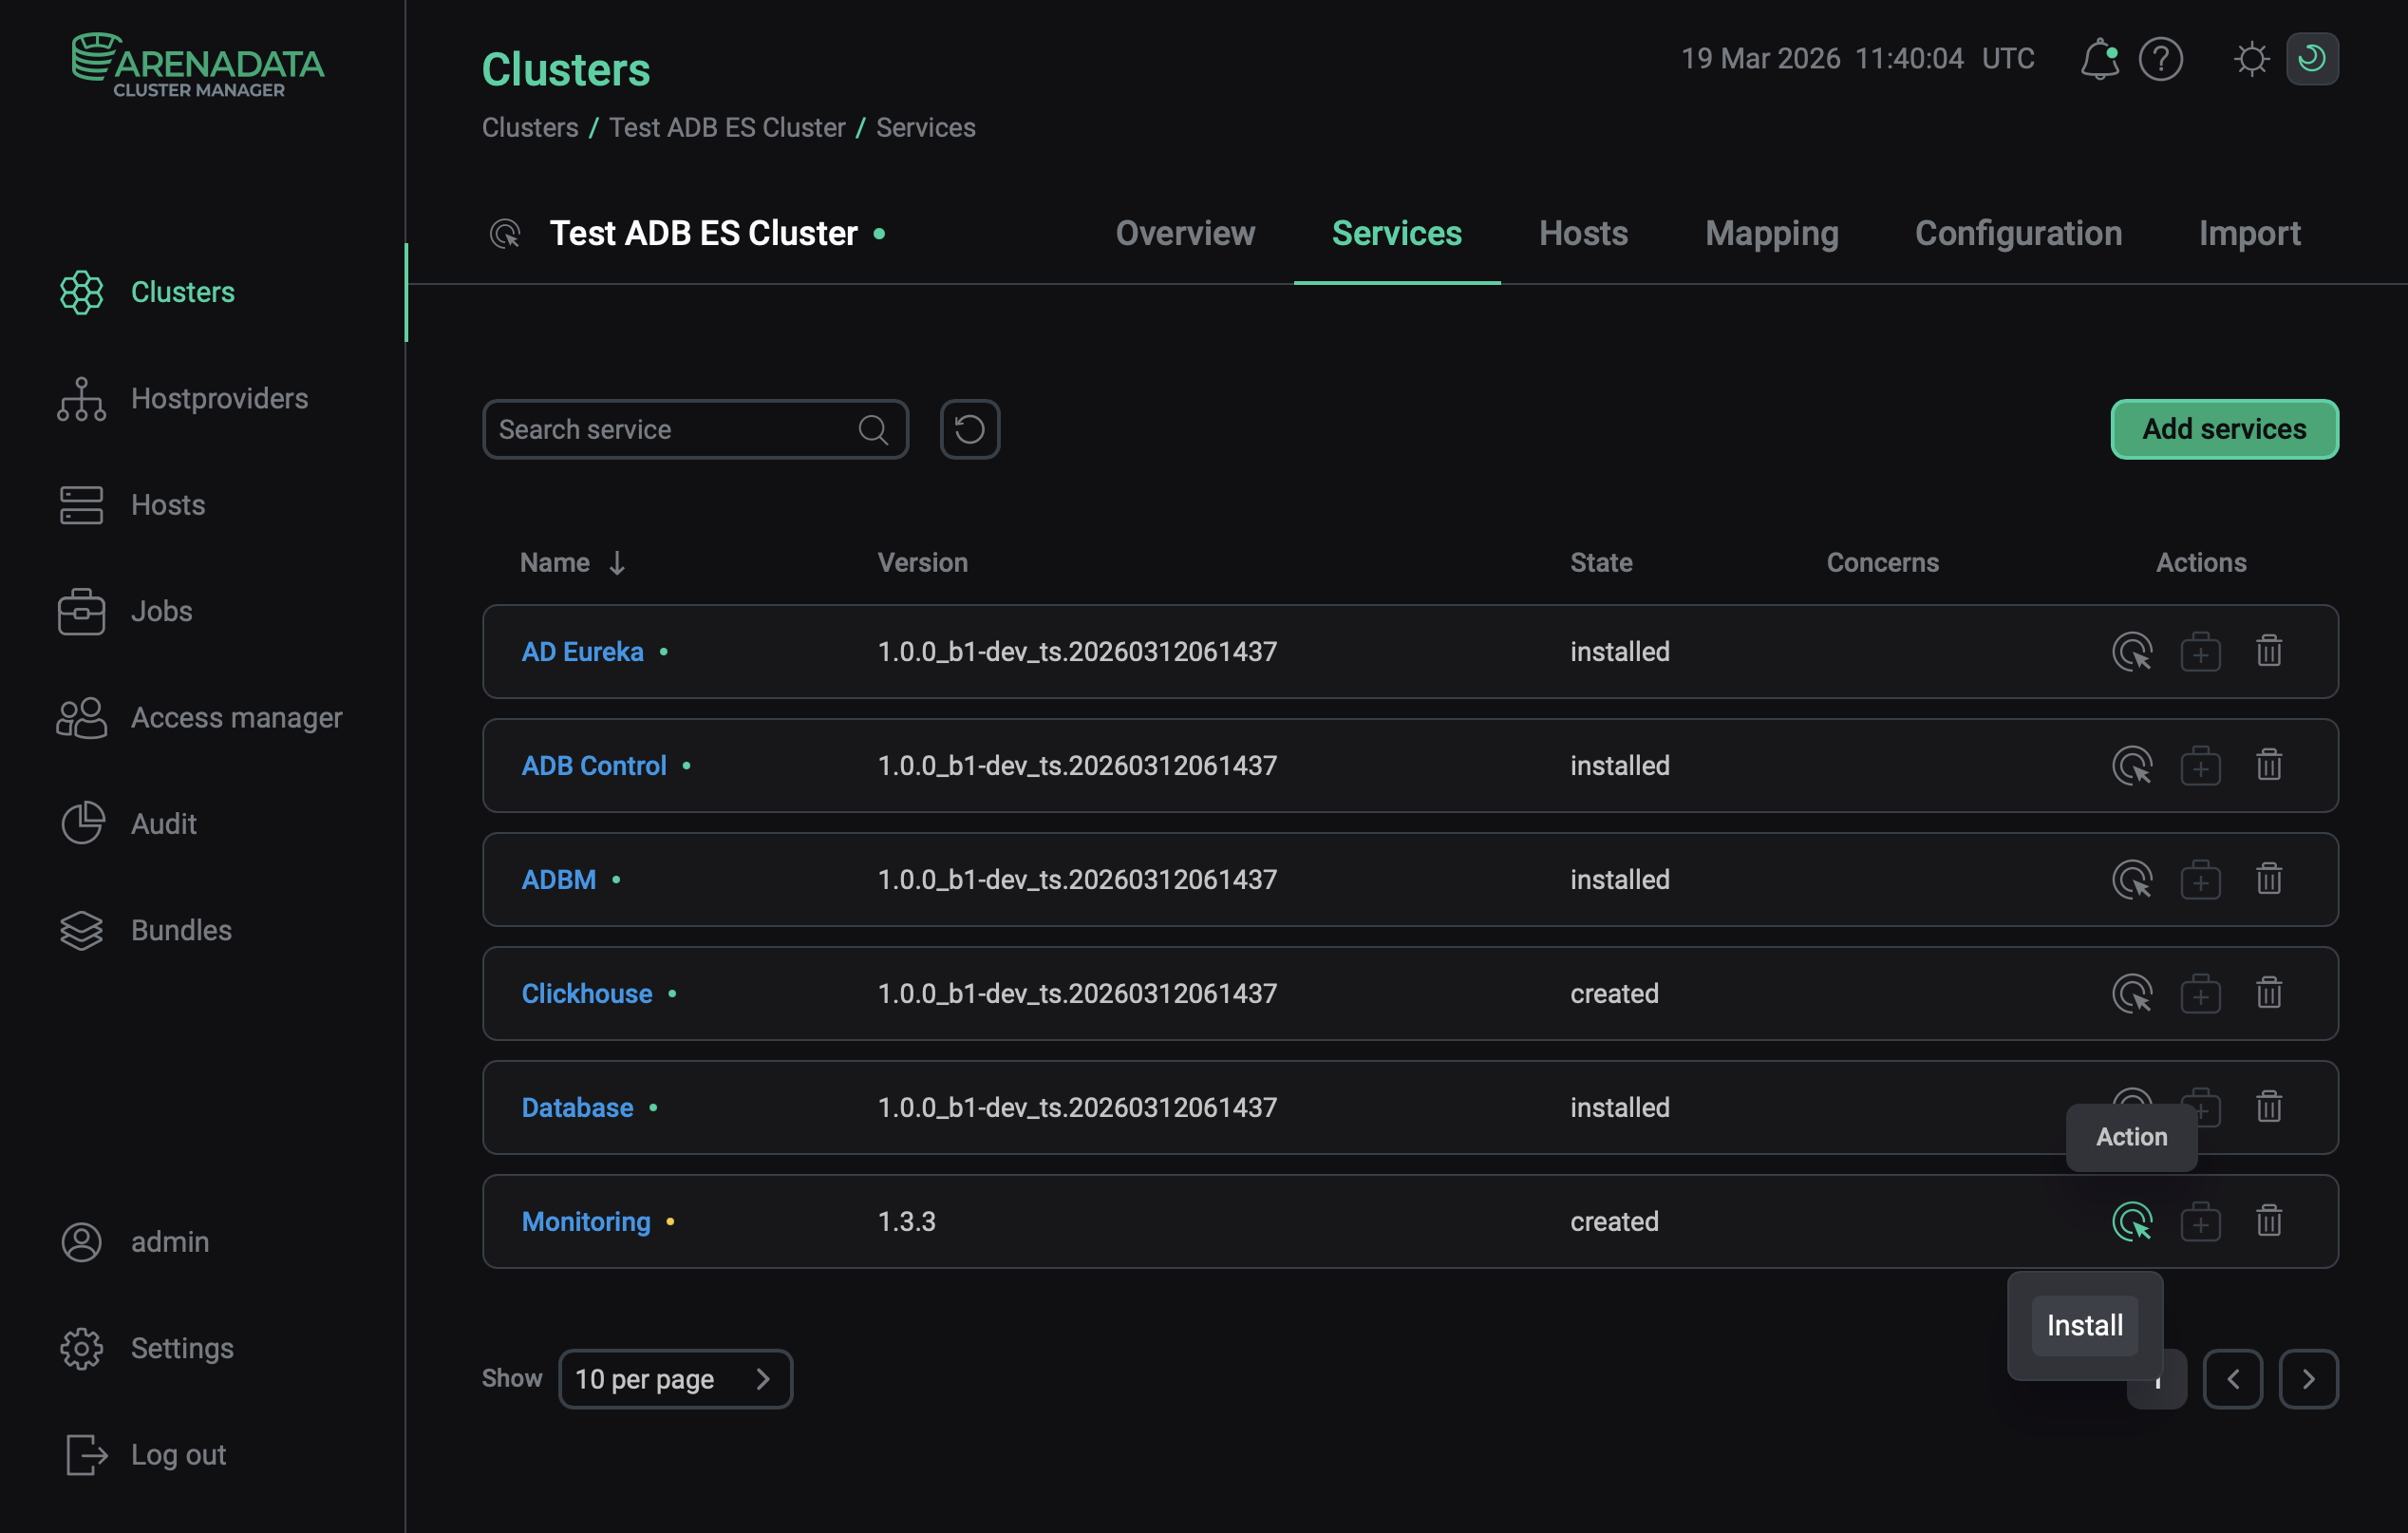 Switch to the service installation
 -
Wait until the installation is completed. Then check that the service state has changed from
createdtoinstalled.To view the service installation progress and analyze errors if they occur, select Jobs in the left navigation menu and click the Install job name in the Jobs list.
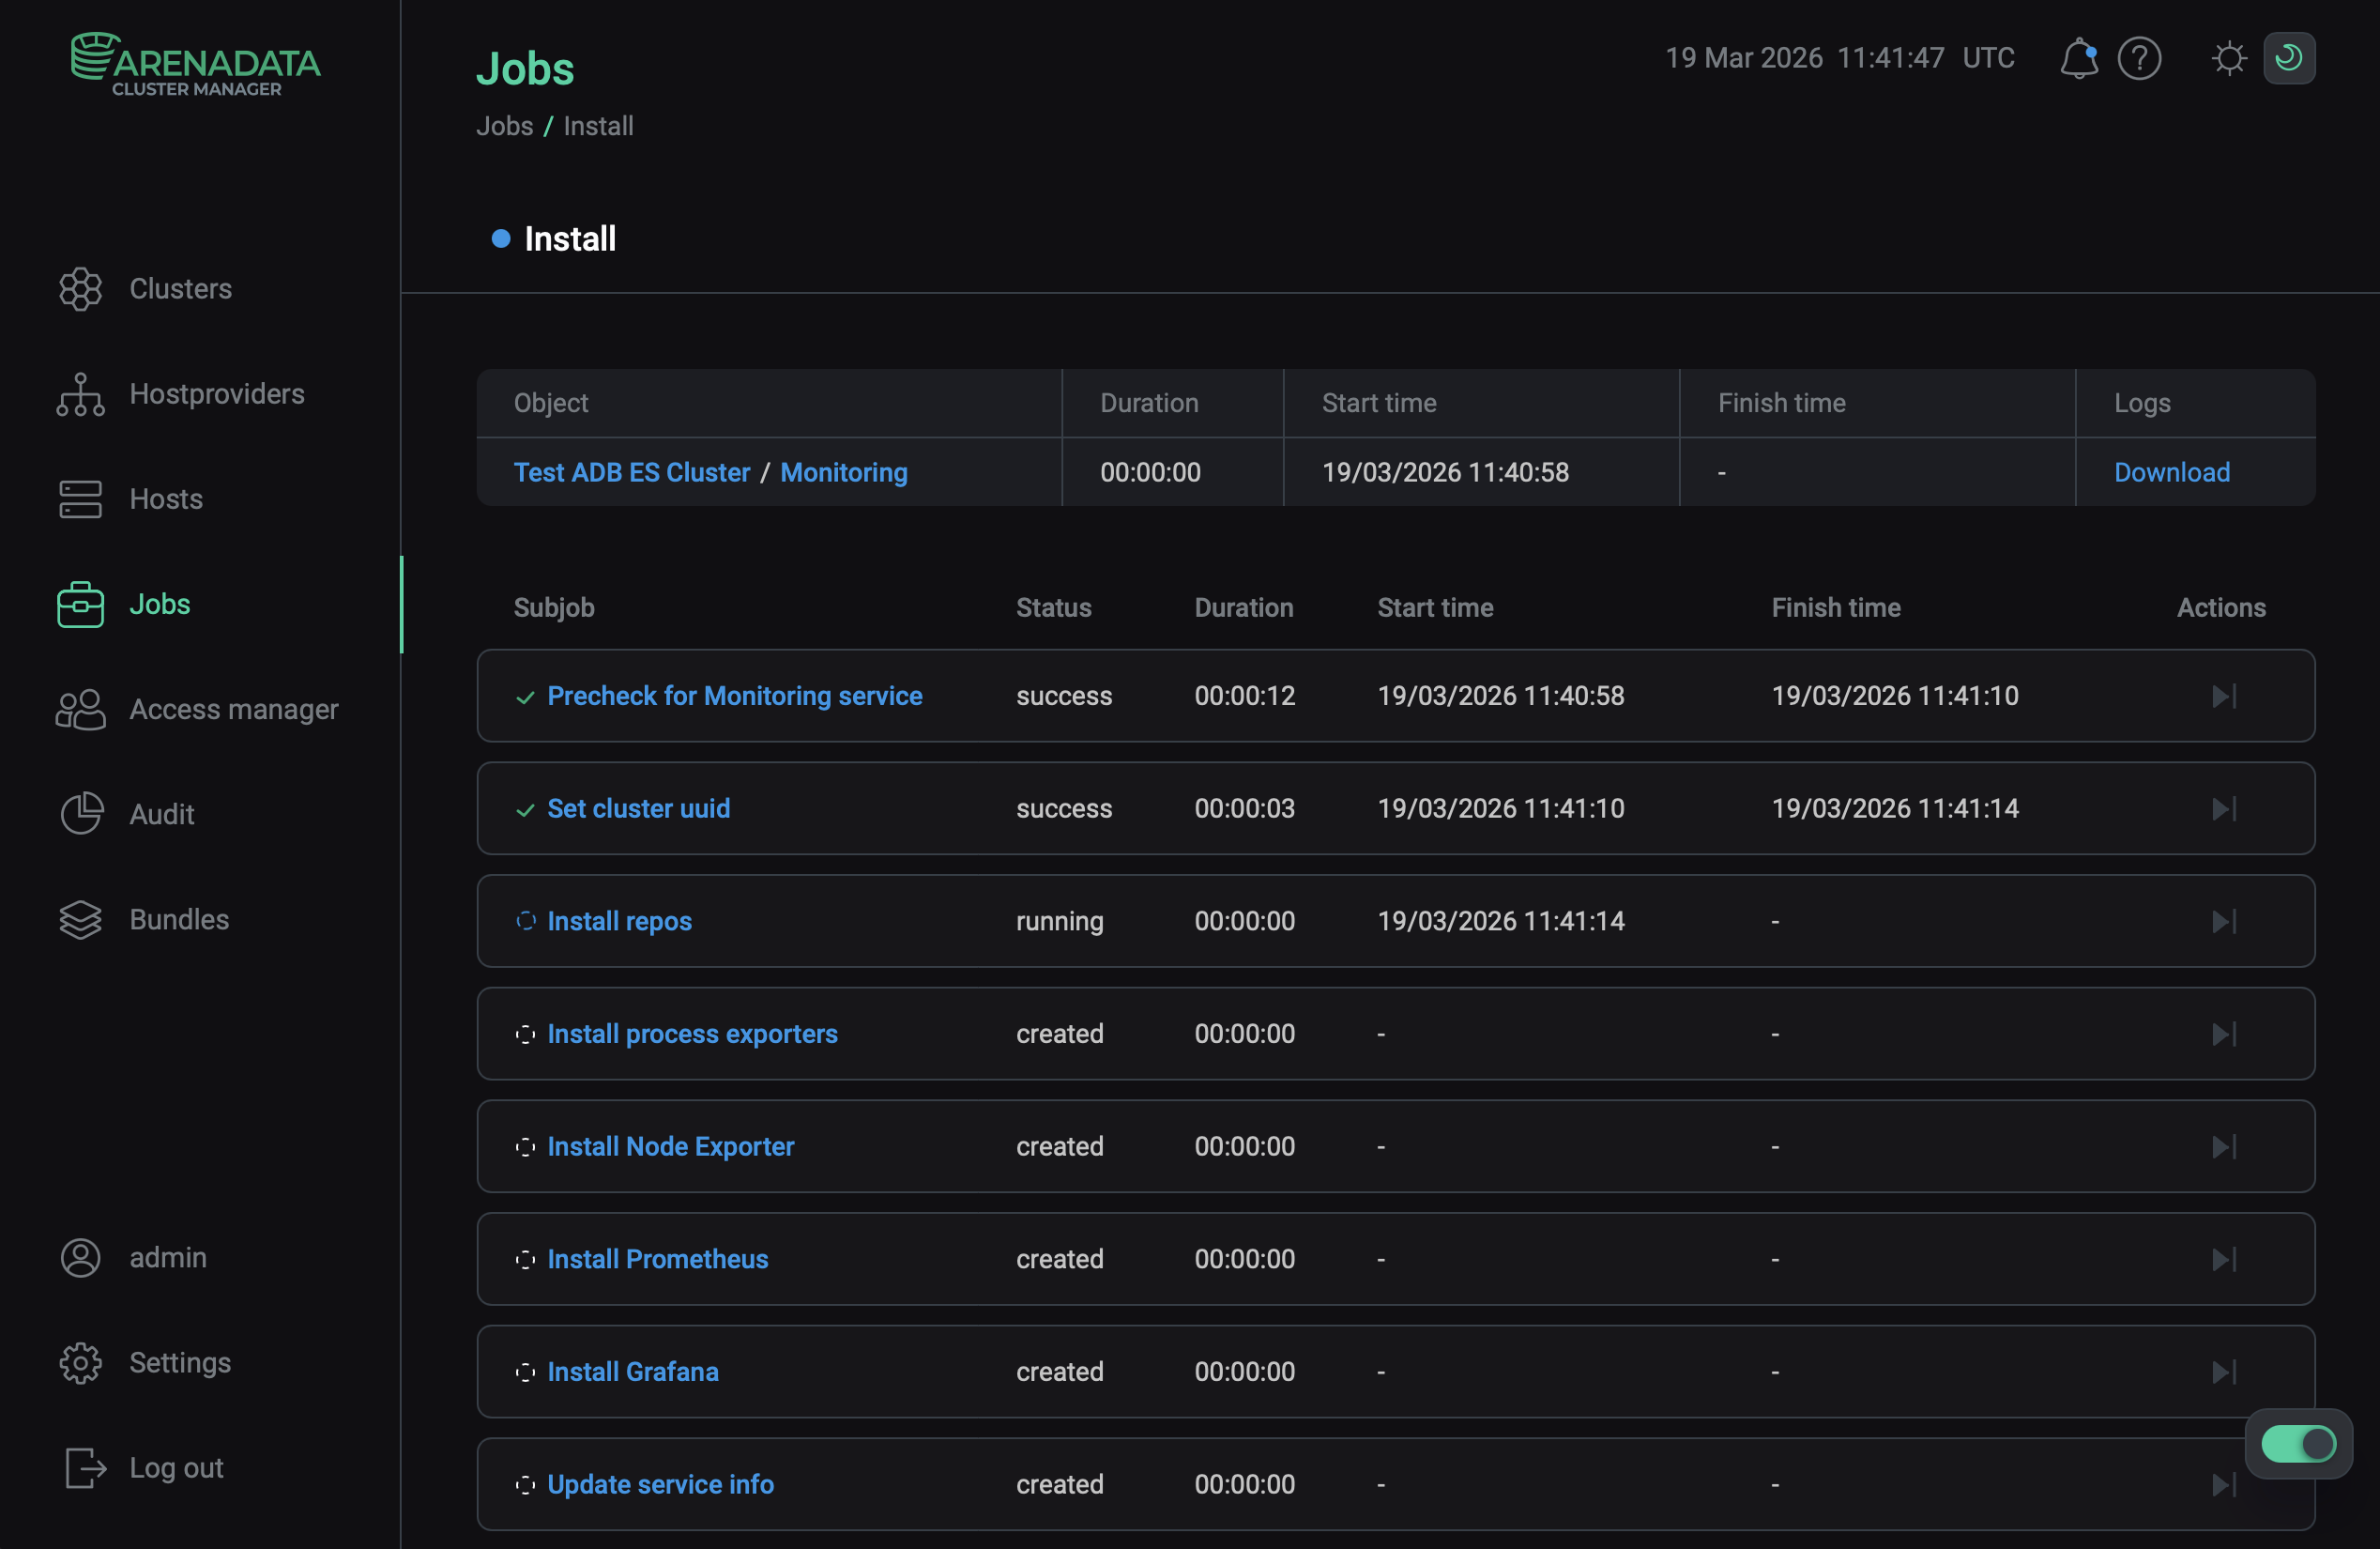 Install service job page
Refer to ADCM documentation for description of the Jobs tab.
View results
To check that the configured exporters send metrics to Prometheus, open the Prometheus web interface as described in View metrics in Prometheus.
To check that Grafana collects metrics from Prometheus for its dashboards, open the Grafana web interface as described in Open Grafana.