
Filter and sort data on UI pages
Data on the Monitoring, Users, Audit, Jobs, and Configuration → Clusters pages in ADB Control is presented in tables. You can use filters in the column headers to narrow down the information displayed in these tables.
Filter data
To use a filter, click 
 in the column header and enter the value to filter rows by.
The input values depend on the filter type — see the table below for details.
| Filter type | Description | Usage examples |
|---|---|---|
Substring search |
Returns all rows where the column value contains the search substring |
|
Exact number |
Returns all rows where the column value matches exactly the input value. Only digits are allowed as an input value |
|
Single select |
Lets you choose exactly one value from a predefined list. It’s typically used when values are few and known in advance. For example, you can choose between GPORCA and Legacy planners to filter commands. It usually has the option to select all values, which effectively clears this filter |
|
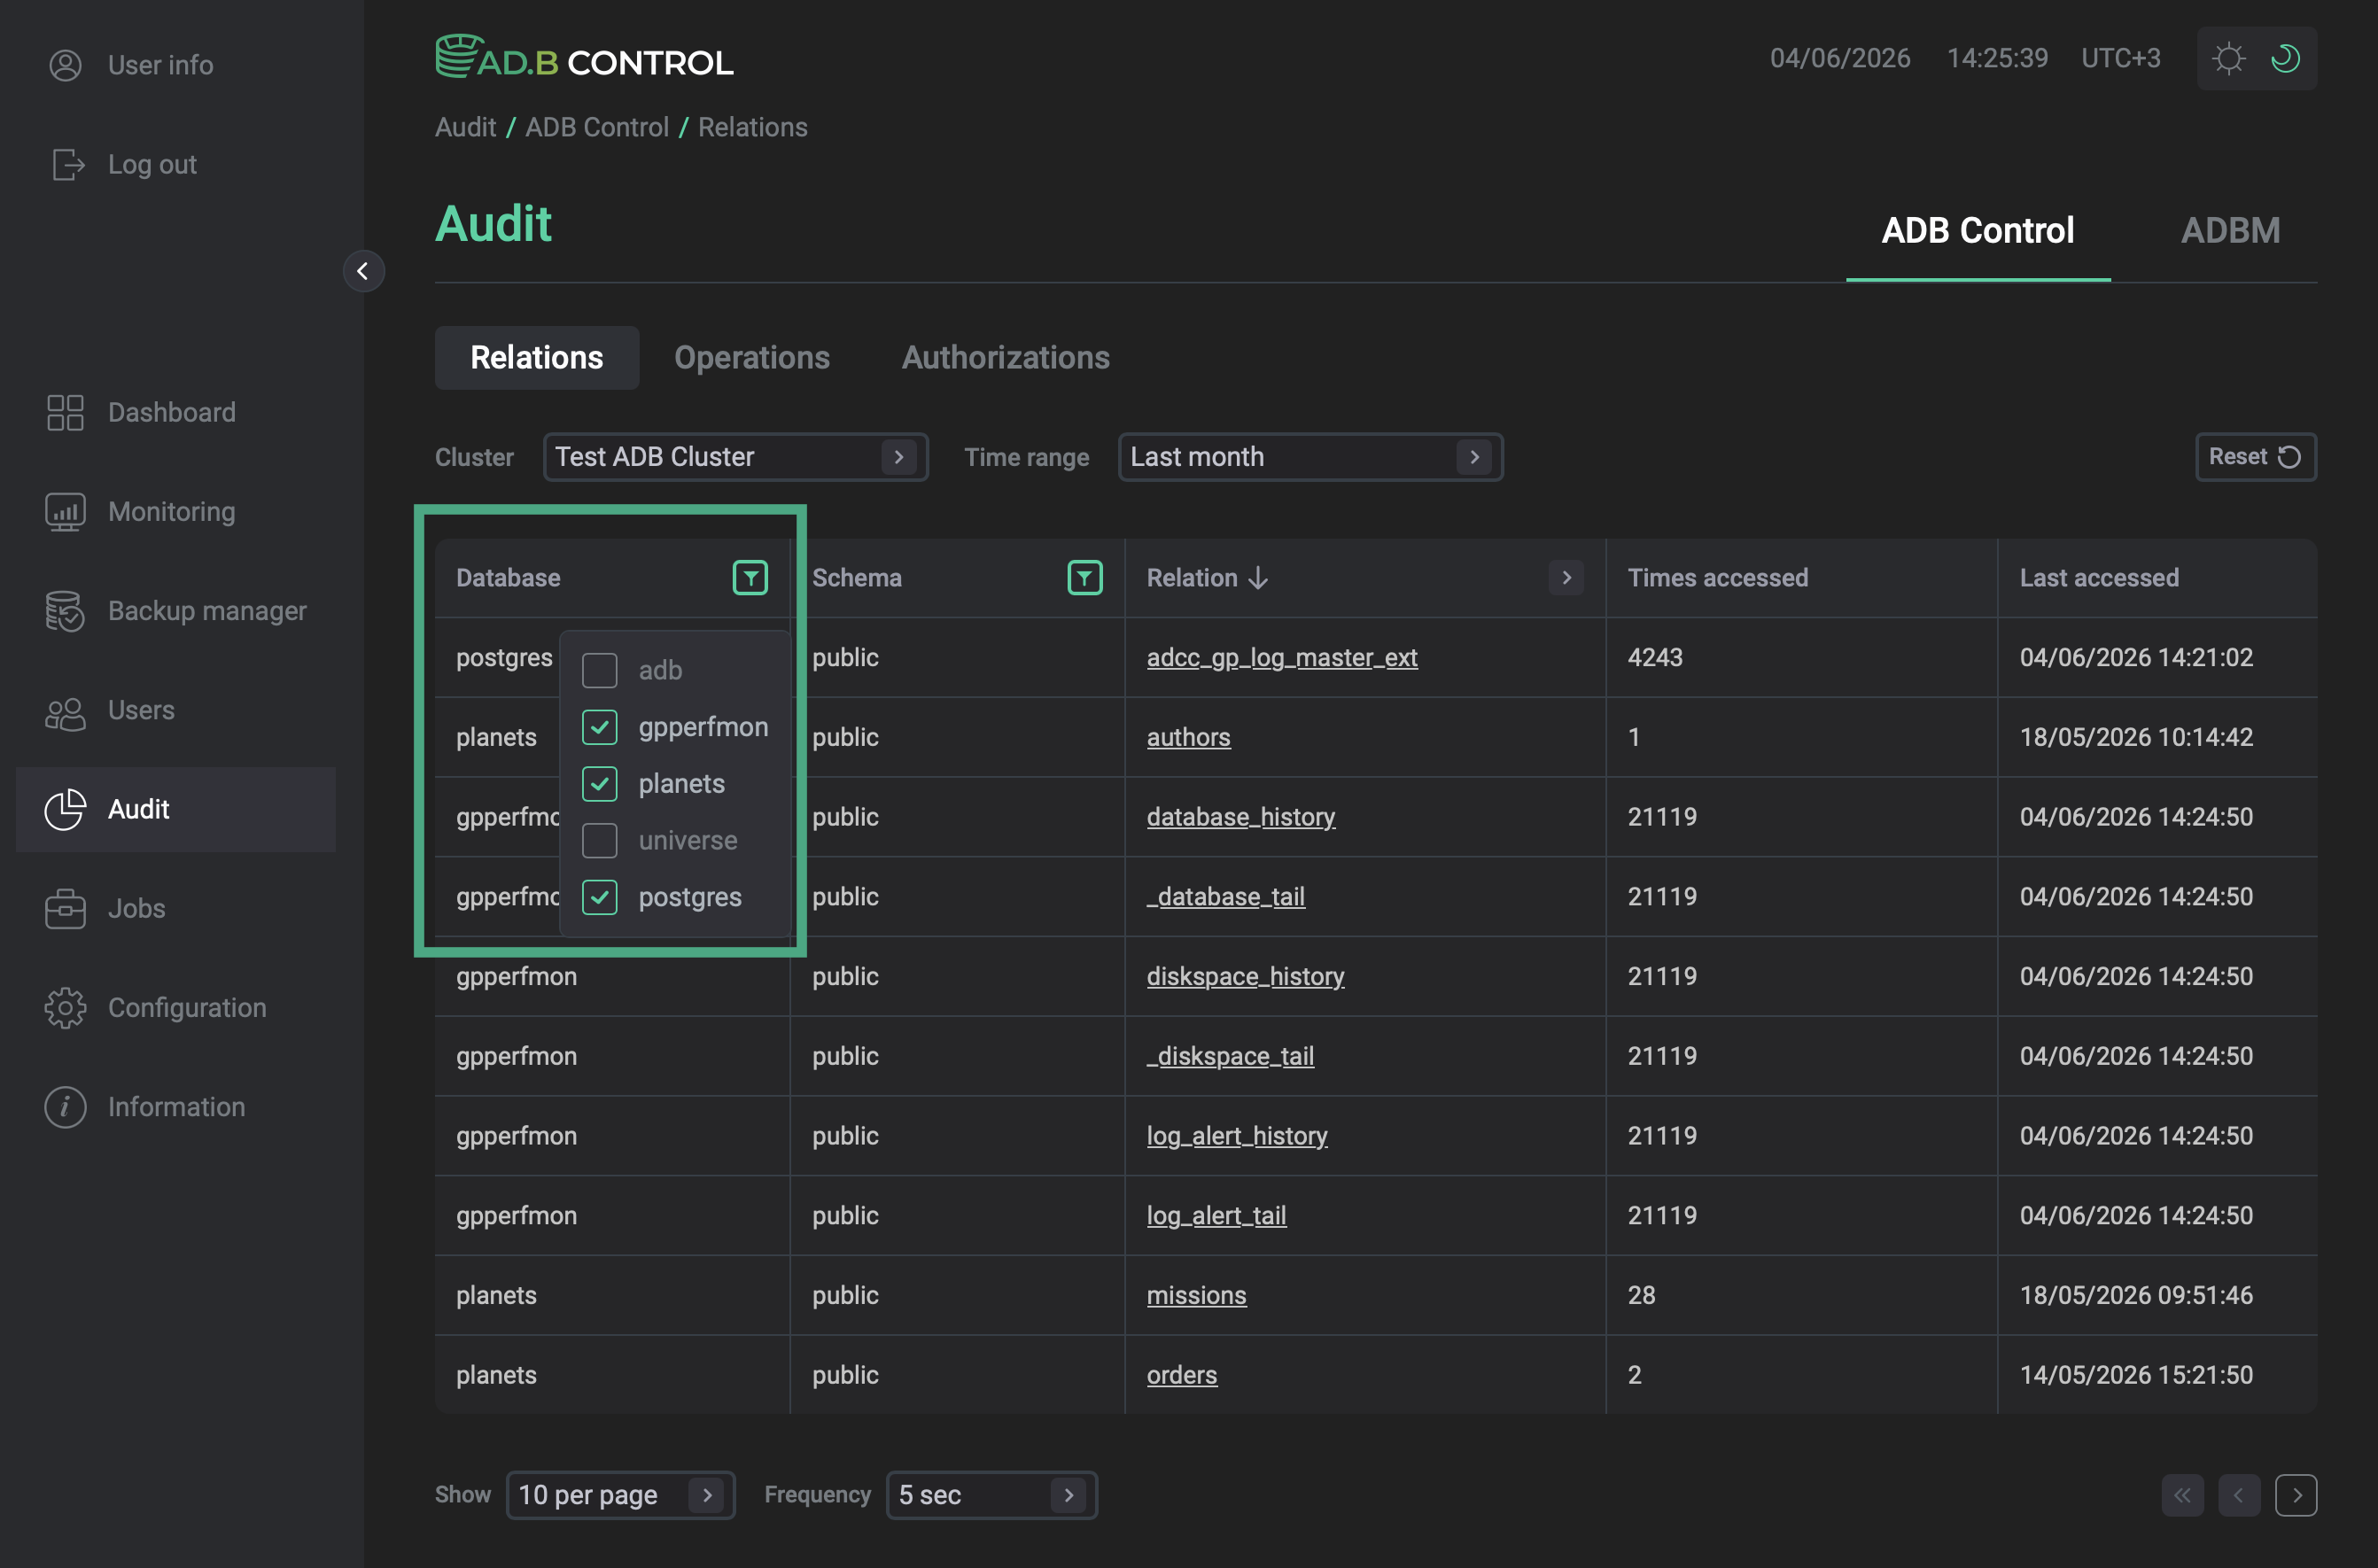
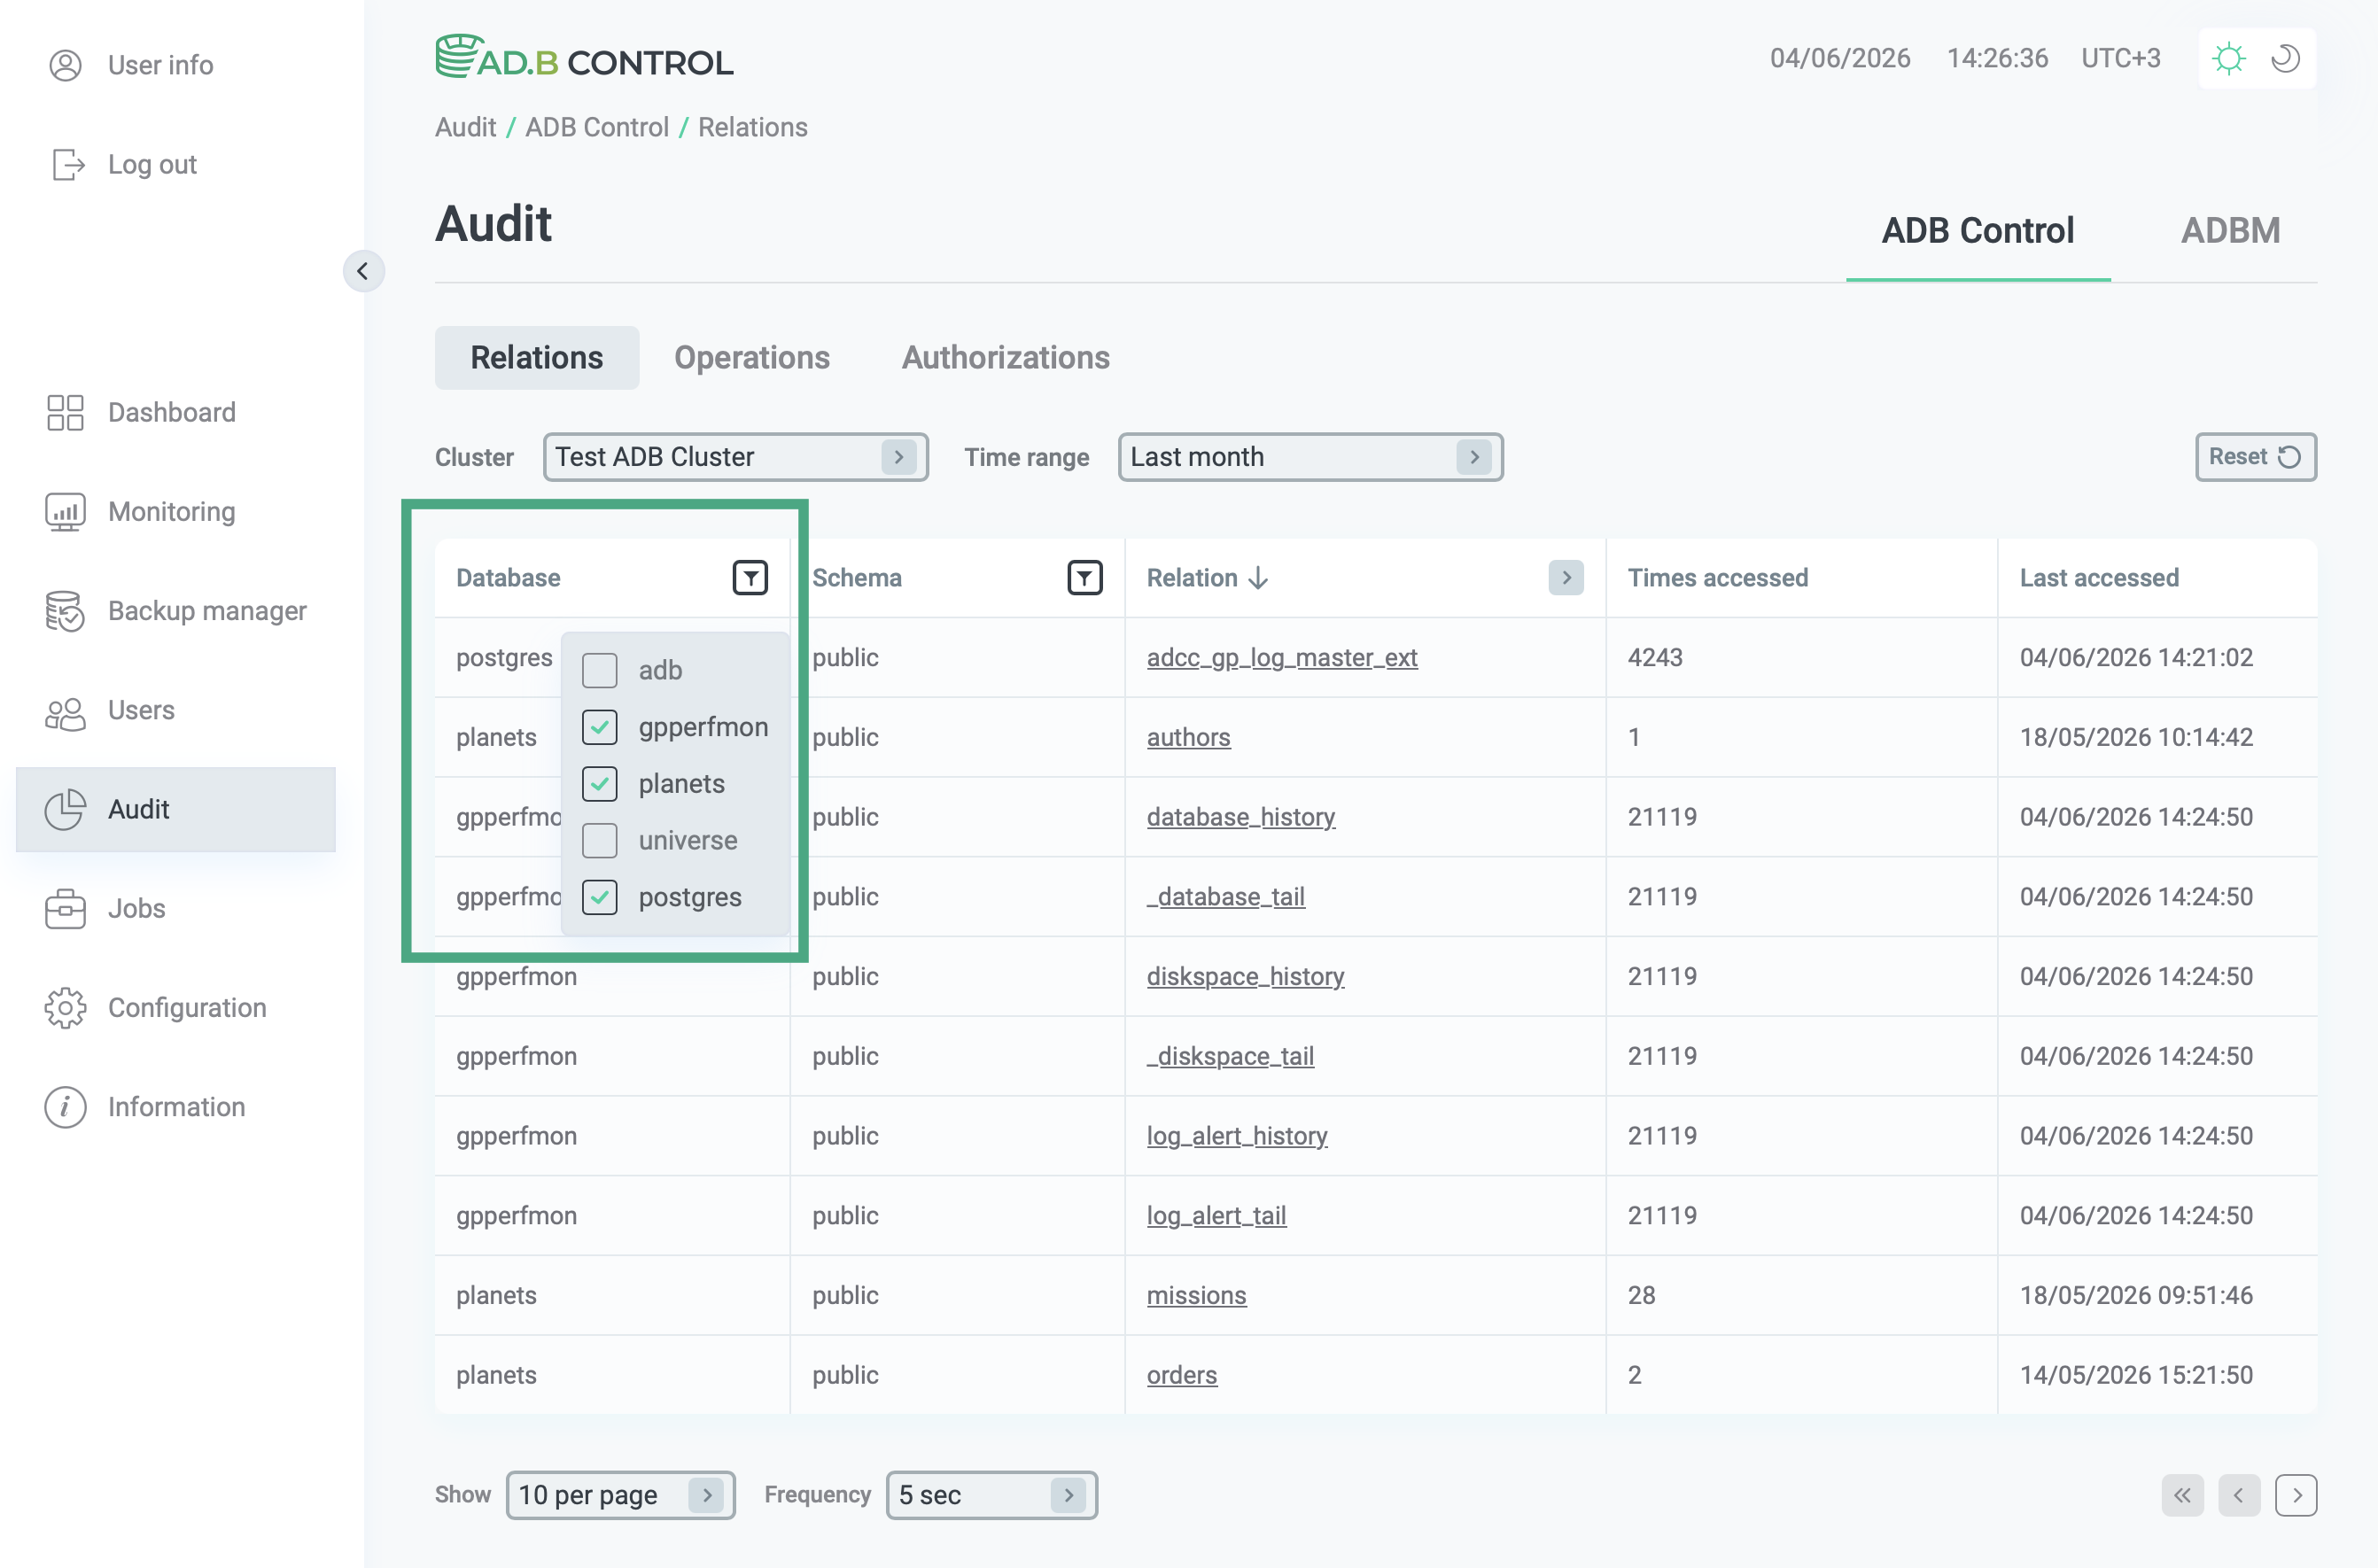
Multiselect |
Lets you choose one or more values from the list.
Possible values in the list are based on the real data in the connected cluster.
For example, when a new database is created, its name appears in the filter.
When multiple values are used, they are combined with the |
|
Time range |
Lets you select the time or date range |
|
Tag filter |
A special filter used for tags.
In the Tags column header, click |
The Tags columns on the Monitoring page |


Additionally, there are filters that are not used as column headers. For example, the Monitoring and Audit → Relations pages contain the Cluster filter that lets you select which cluster’s data to display.
|
NOTE
Filters available on the Dashboard page depend on the selected chart. They are described in the Dashboard article. |
When a filter is applied, the 
 icon in the column header indicates that the column is used as a filter.
The sorting and filtering conditions for a particular table are shown above the table.
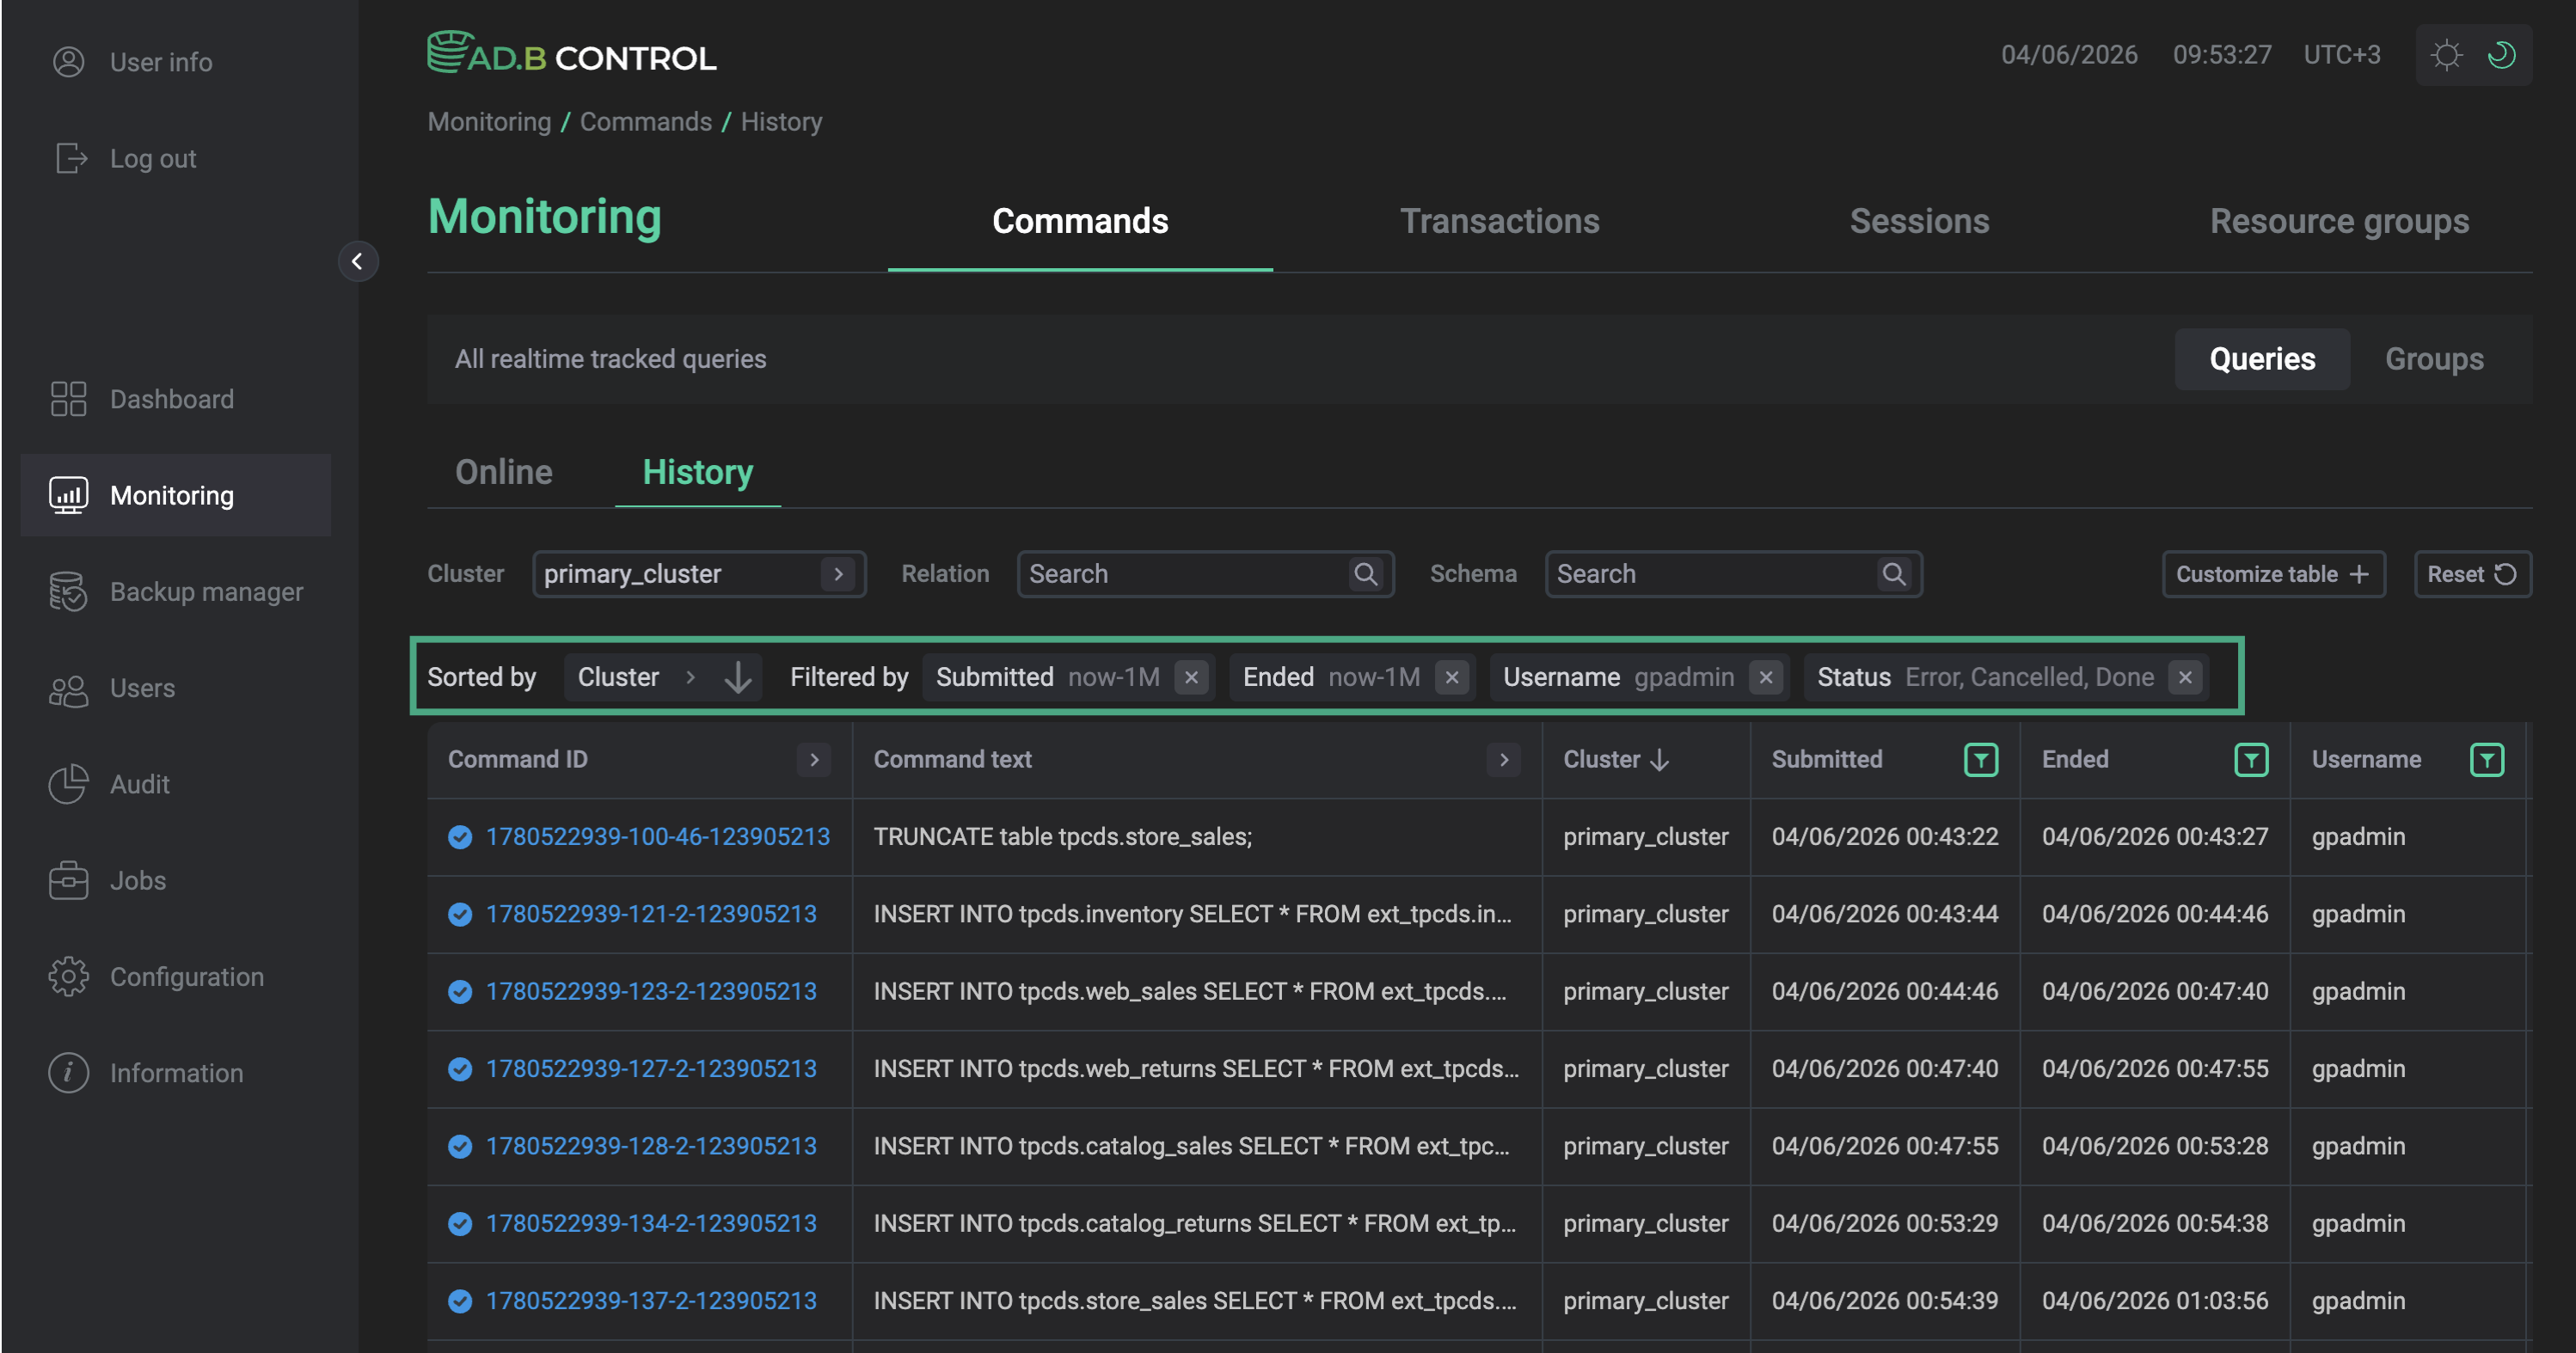
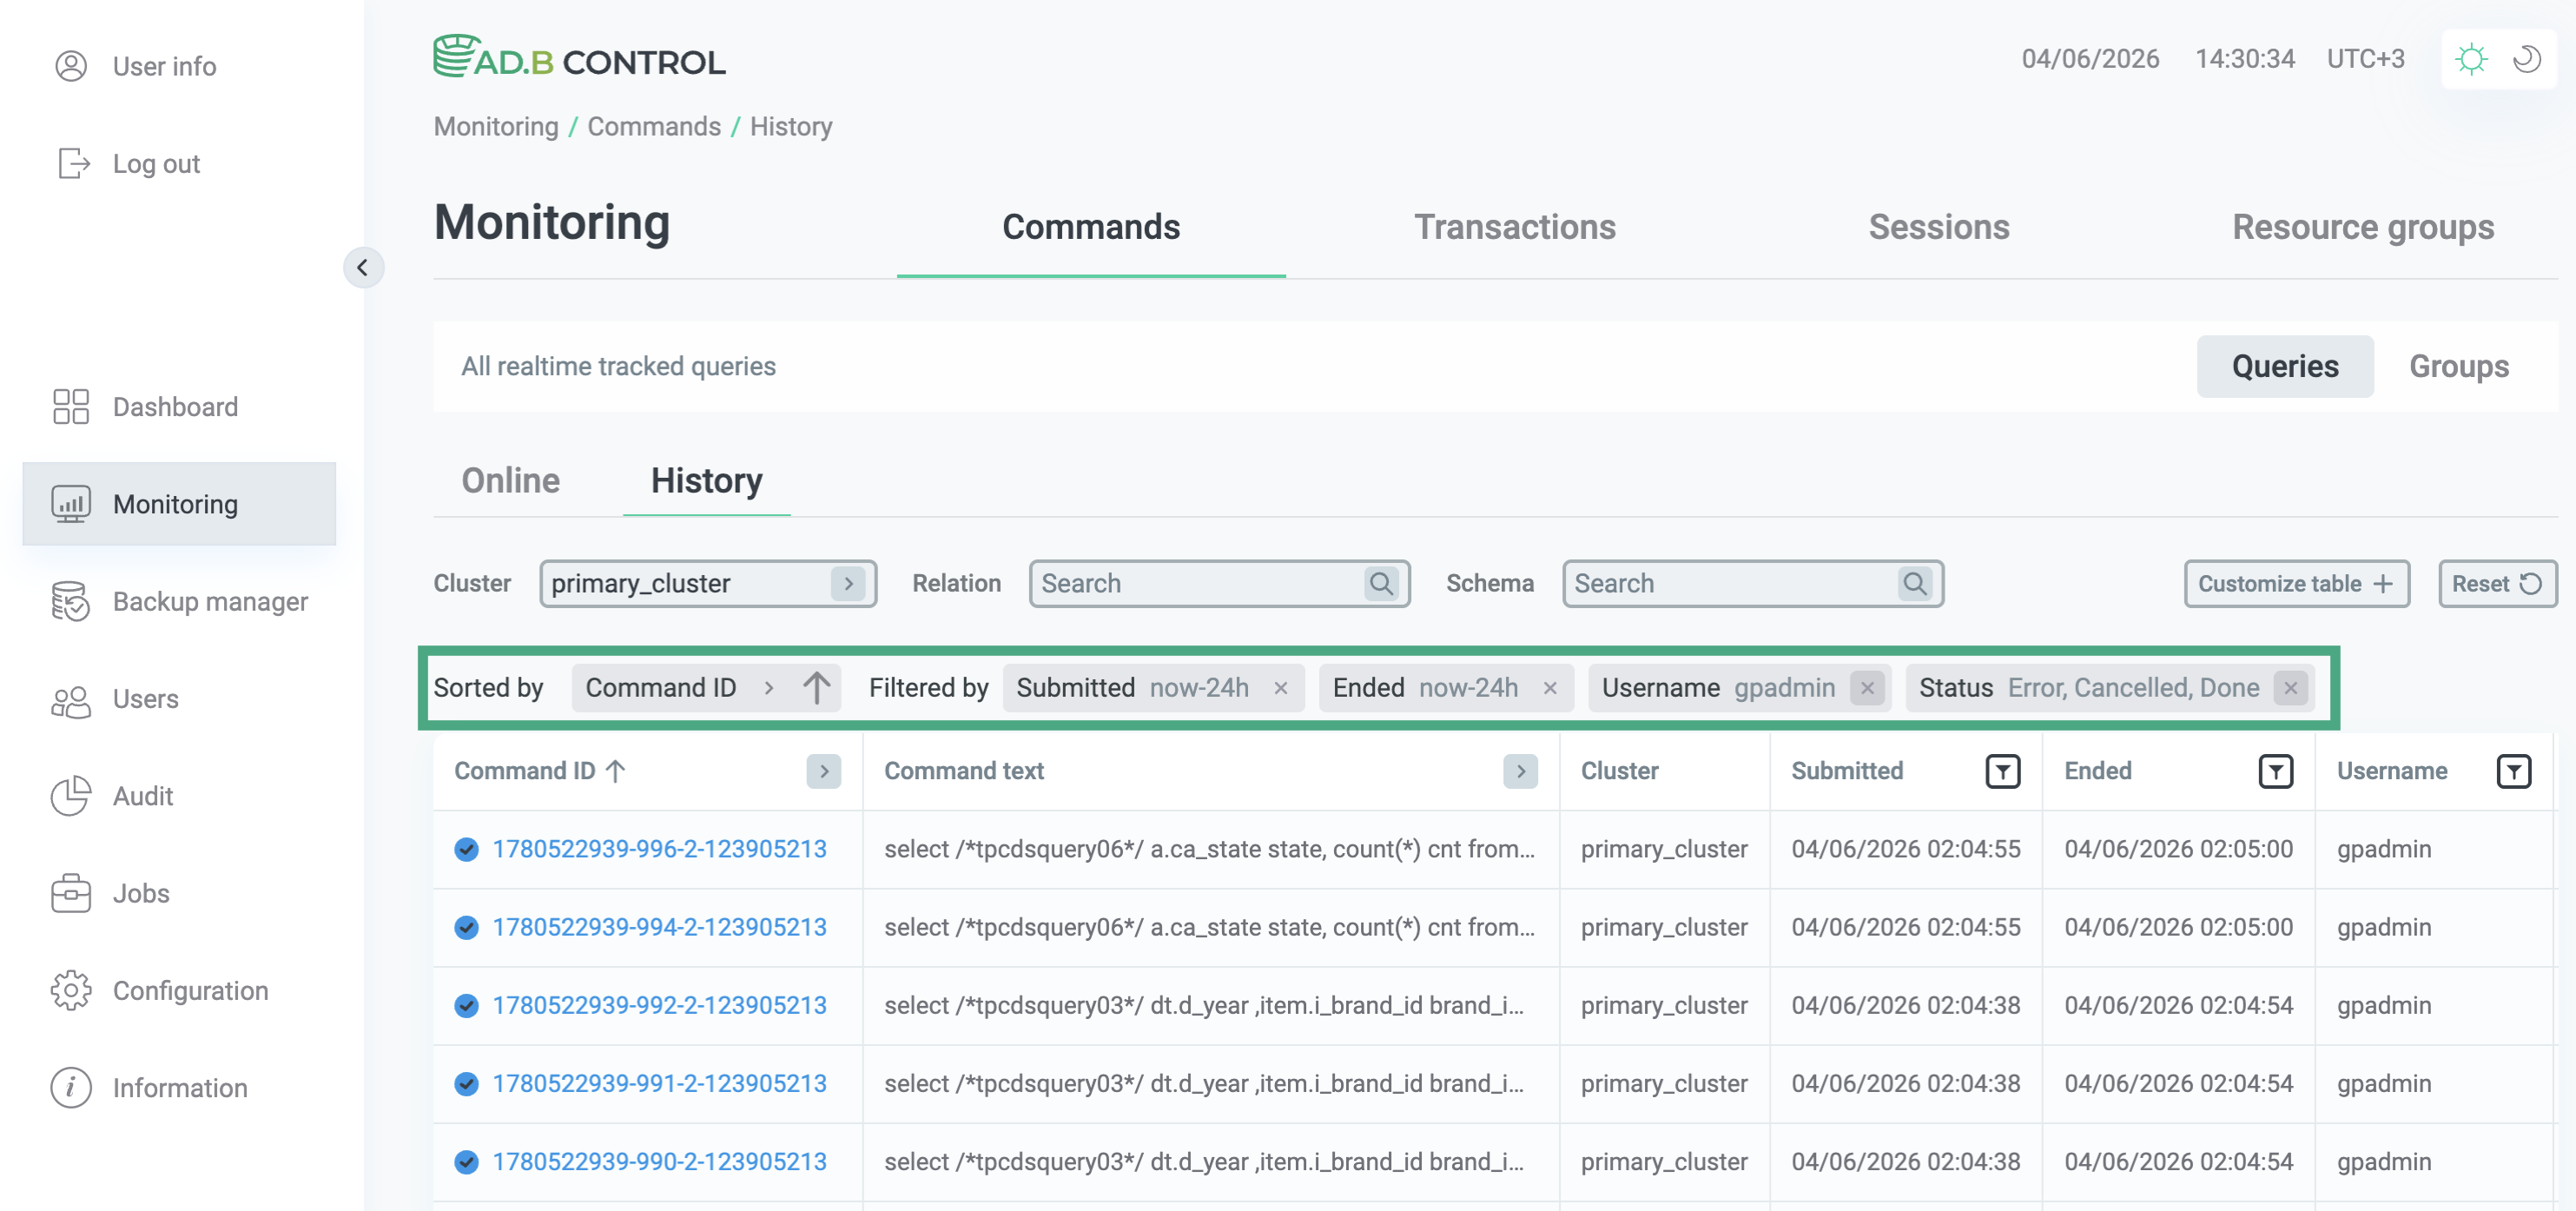
To remove a filter, click 
 next to the filter name above the table.
To reset all filters, click Reset.
Some filters cannot be removed. For example, commands on the Monitoring → Commands page are always displayed for a particular time range, so the Submitted filter is always applied. You can change the time range, but you cannot remove the filter entirely.
Sort data
You can sort rows in tables by clicking a column header.
To sort data:
-
Hover over a column header. If an arrow icon (

 ) appears, the column is sortable — that is, the rows can be sorted by that column.
 -
Click the column header to sort data.
-
To change the sort order (from ascending to descending or vice versa), click the column header again.
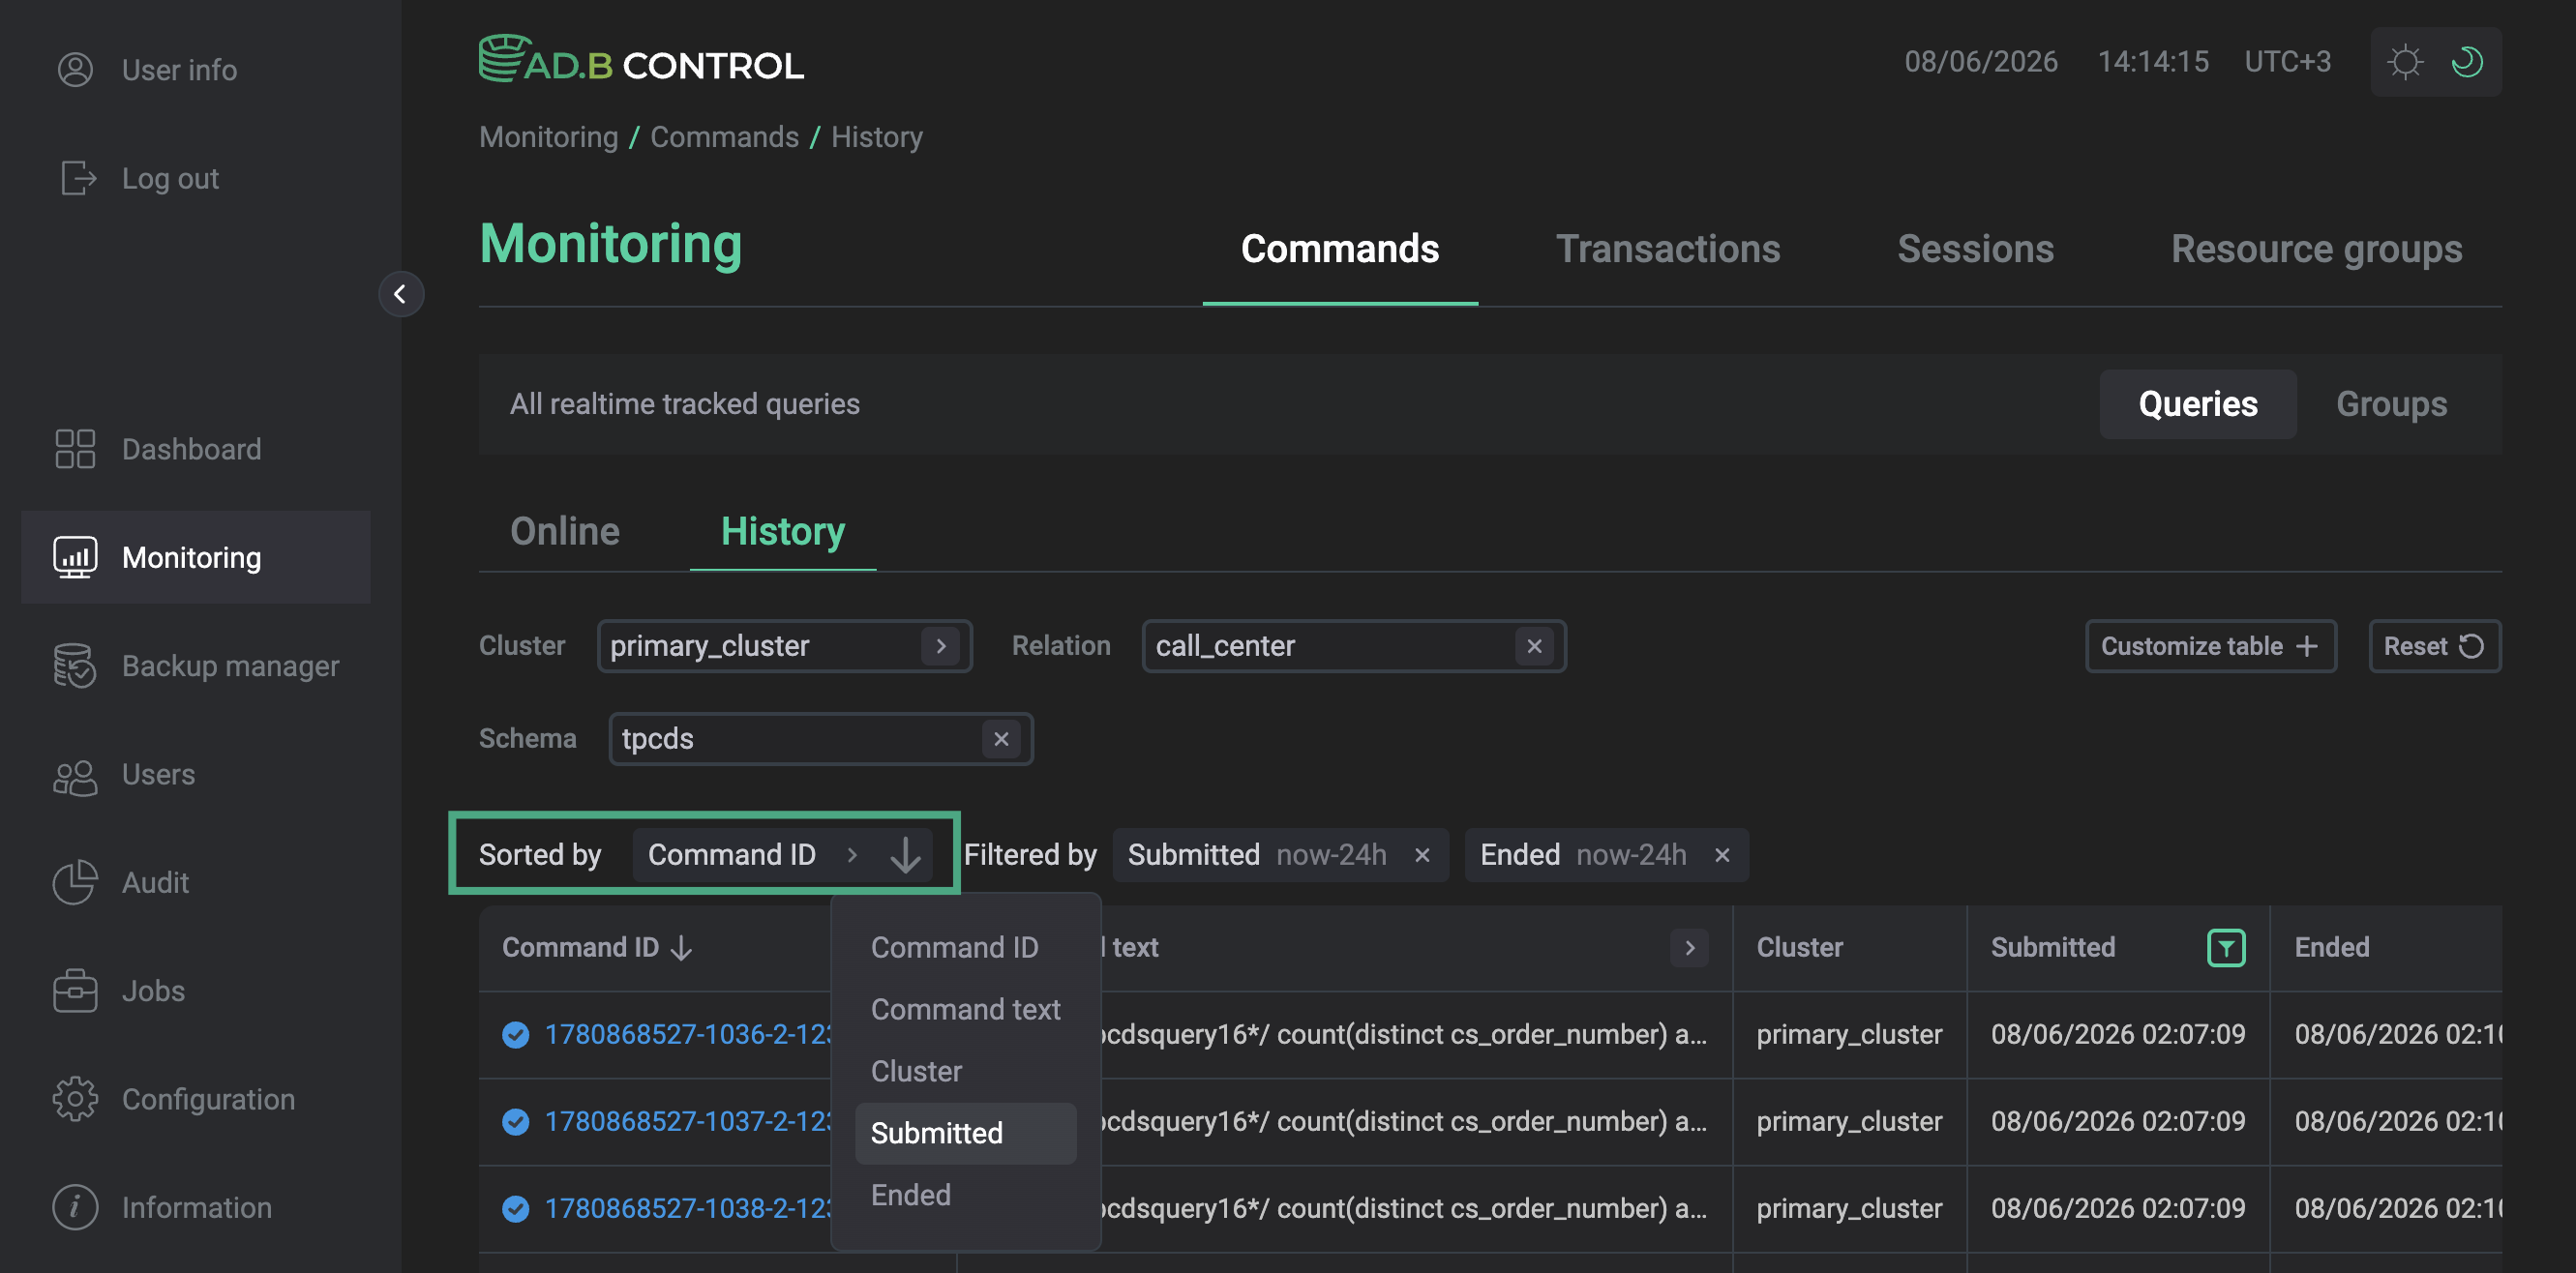
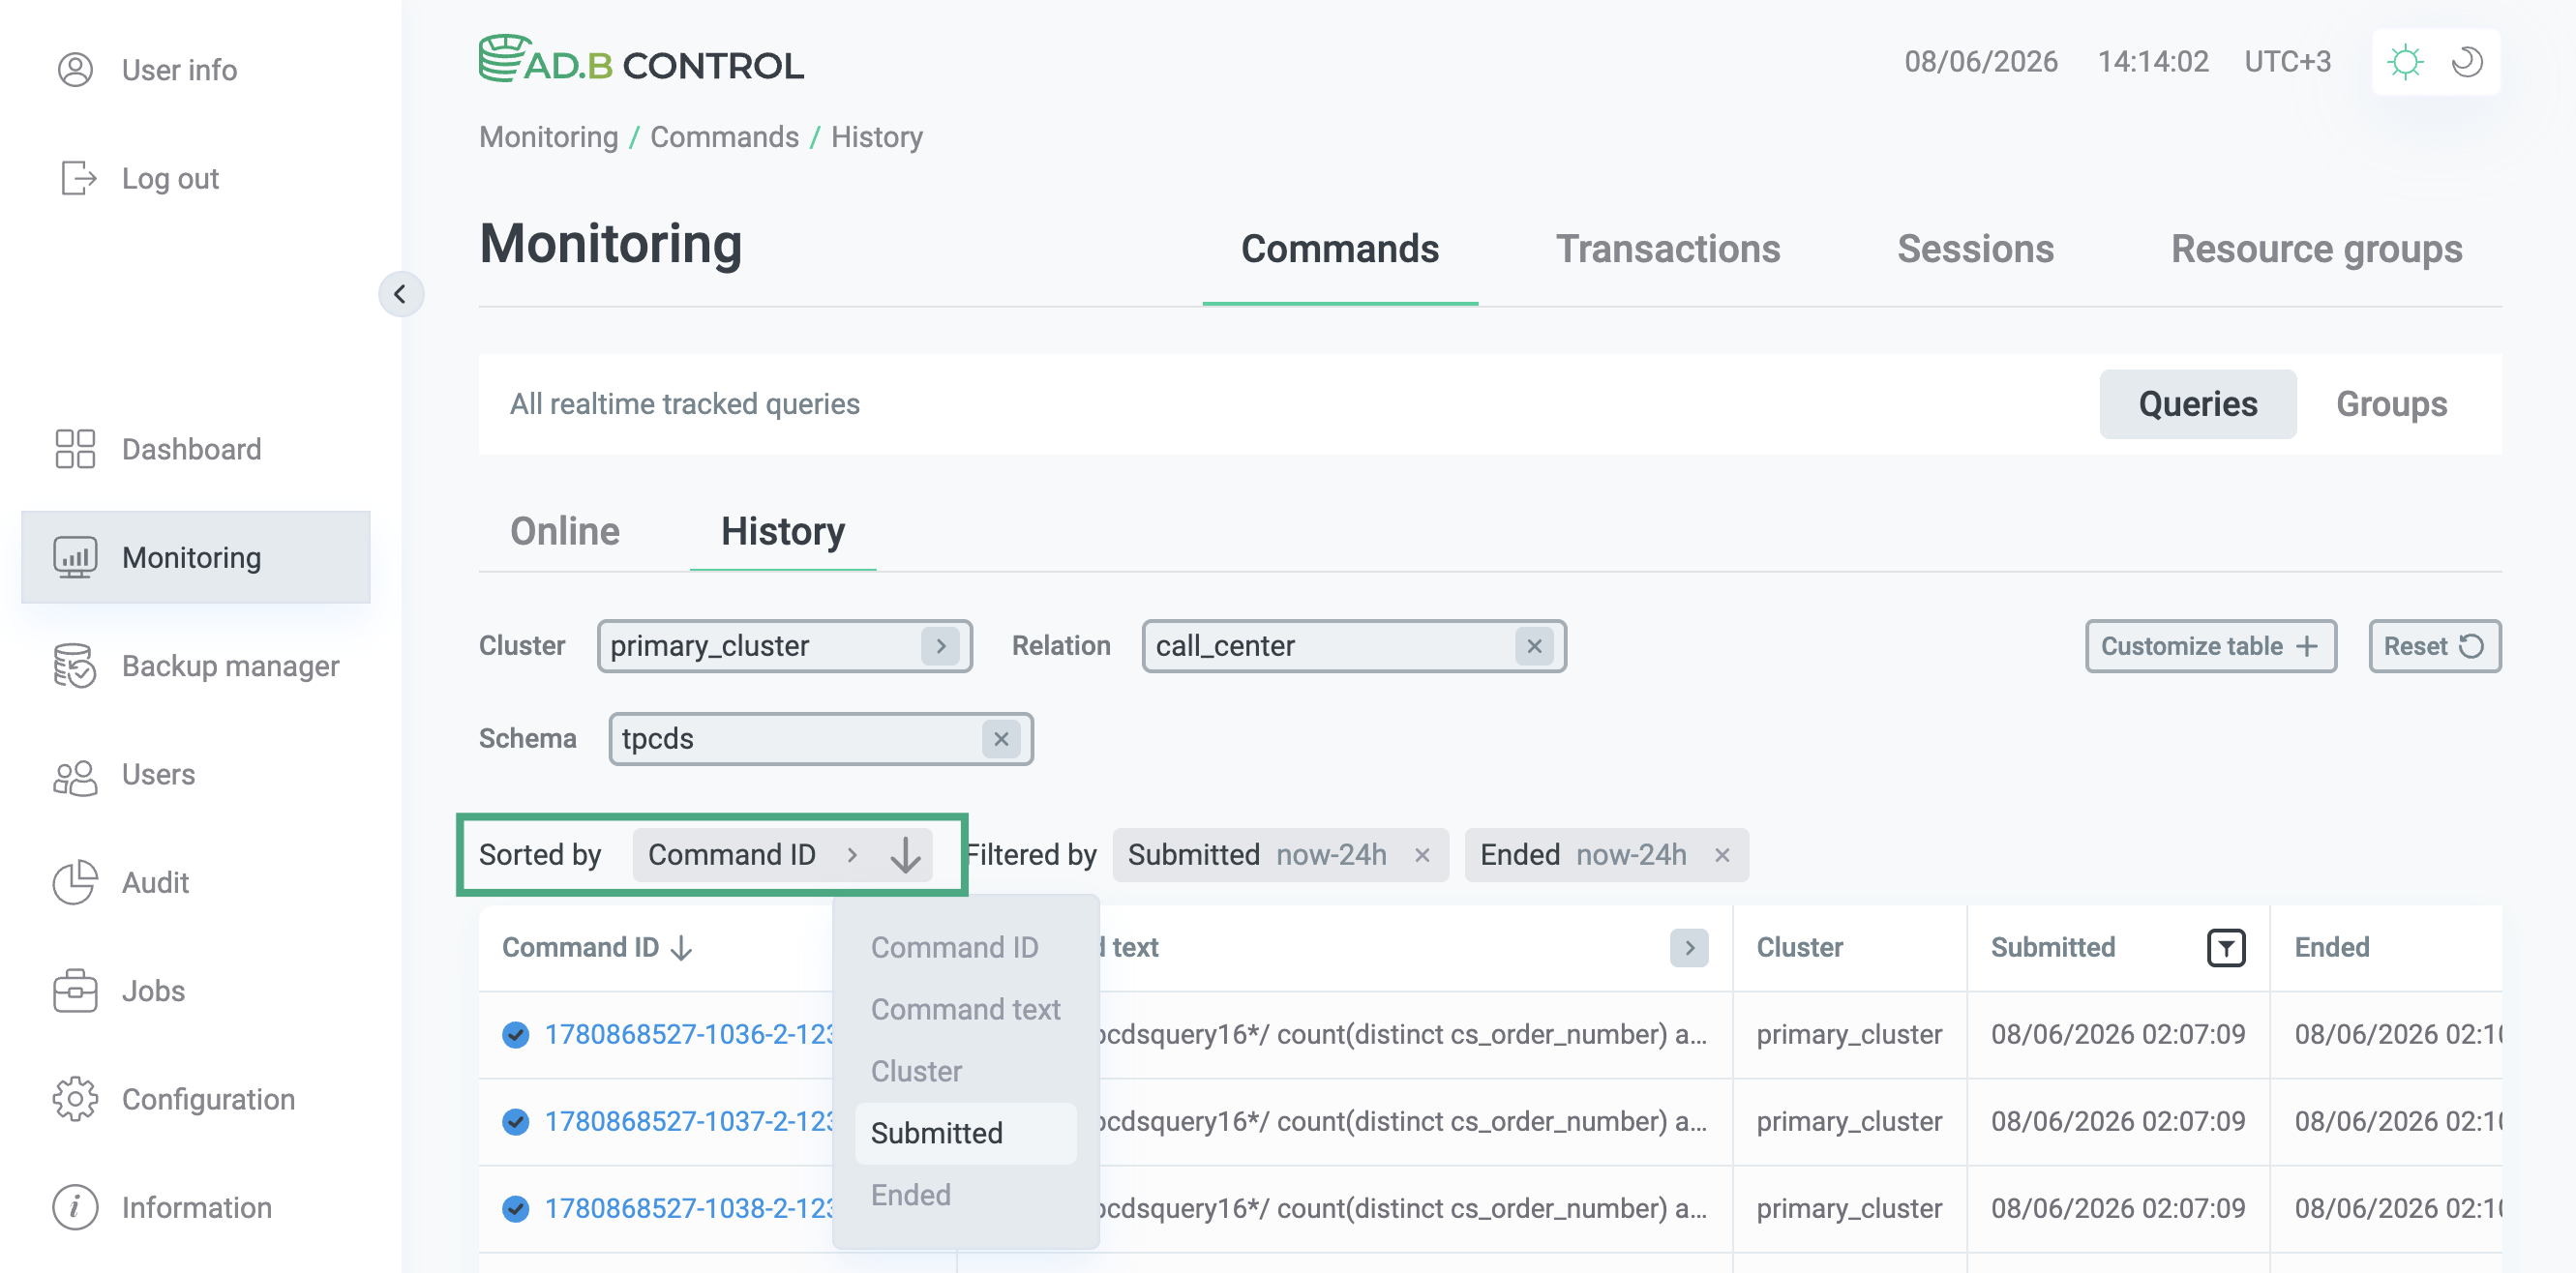
Alternatively, click in the Sorted by list and select a column to be used as a sorting criterion.
Customize tables
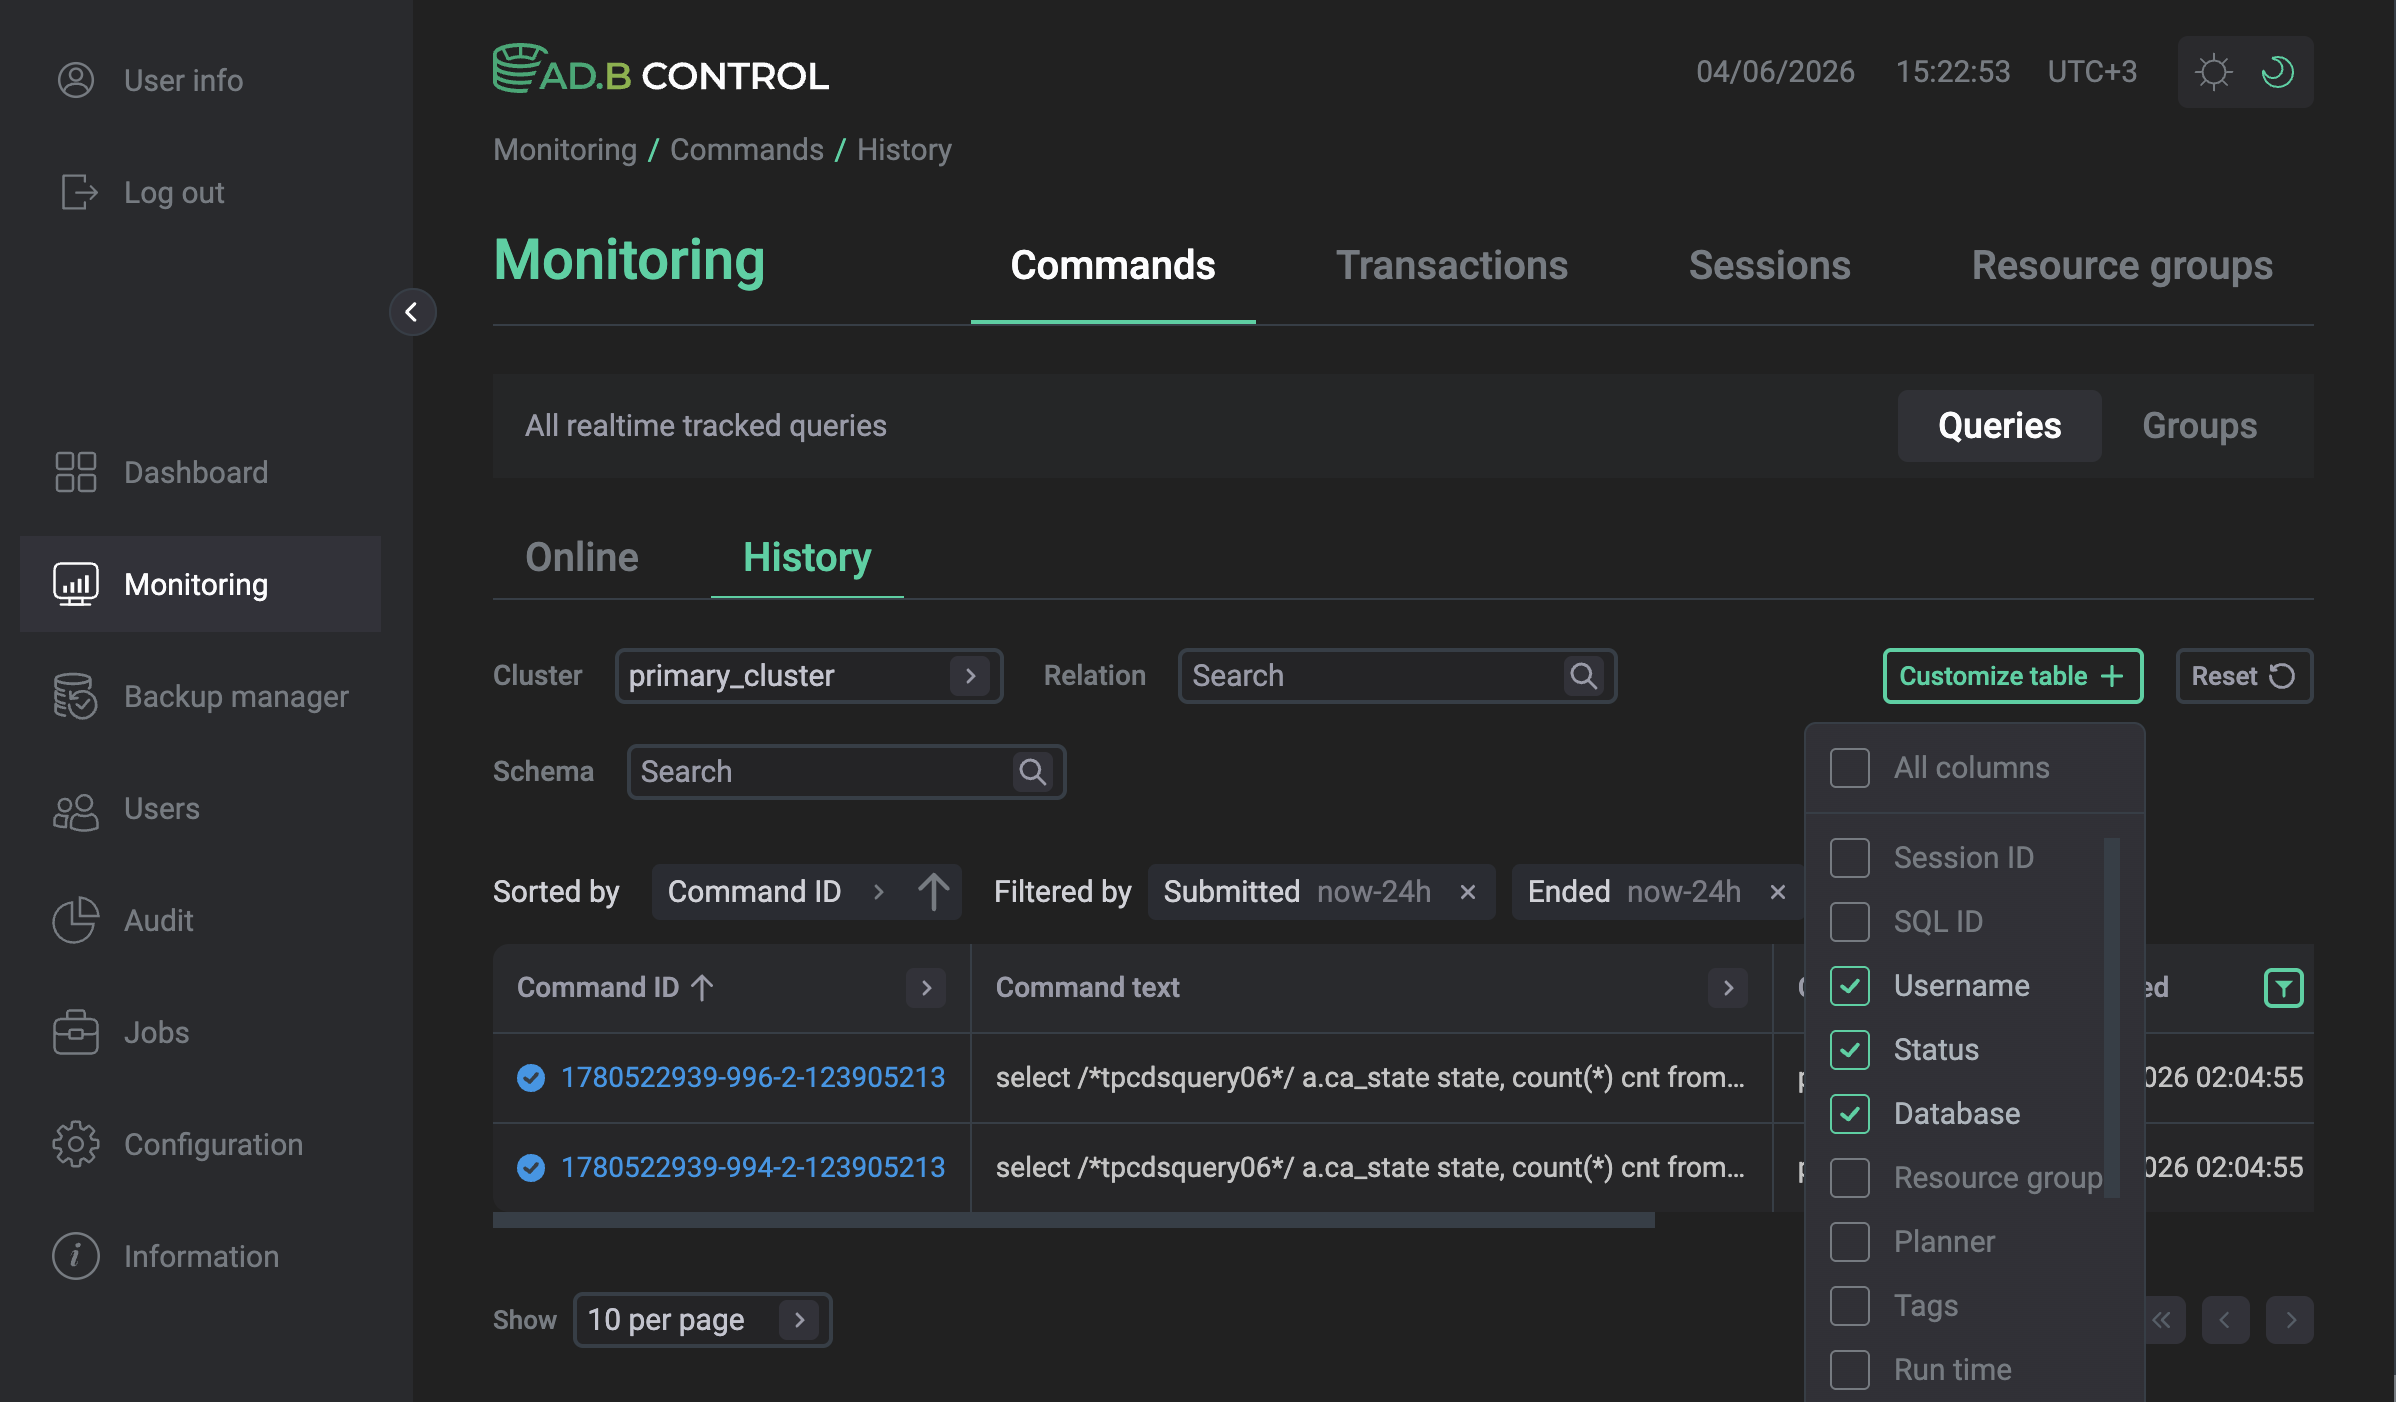
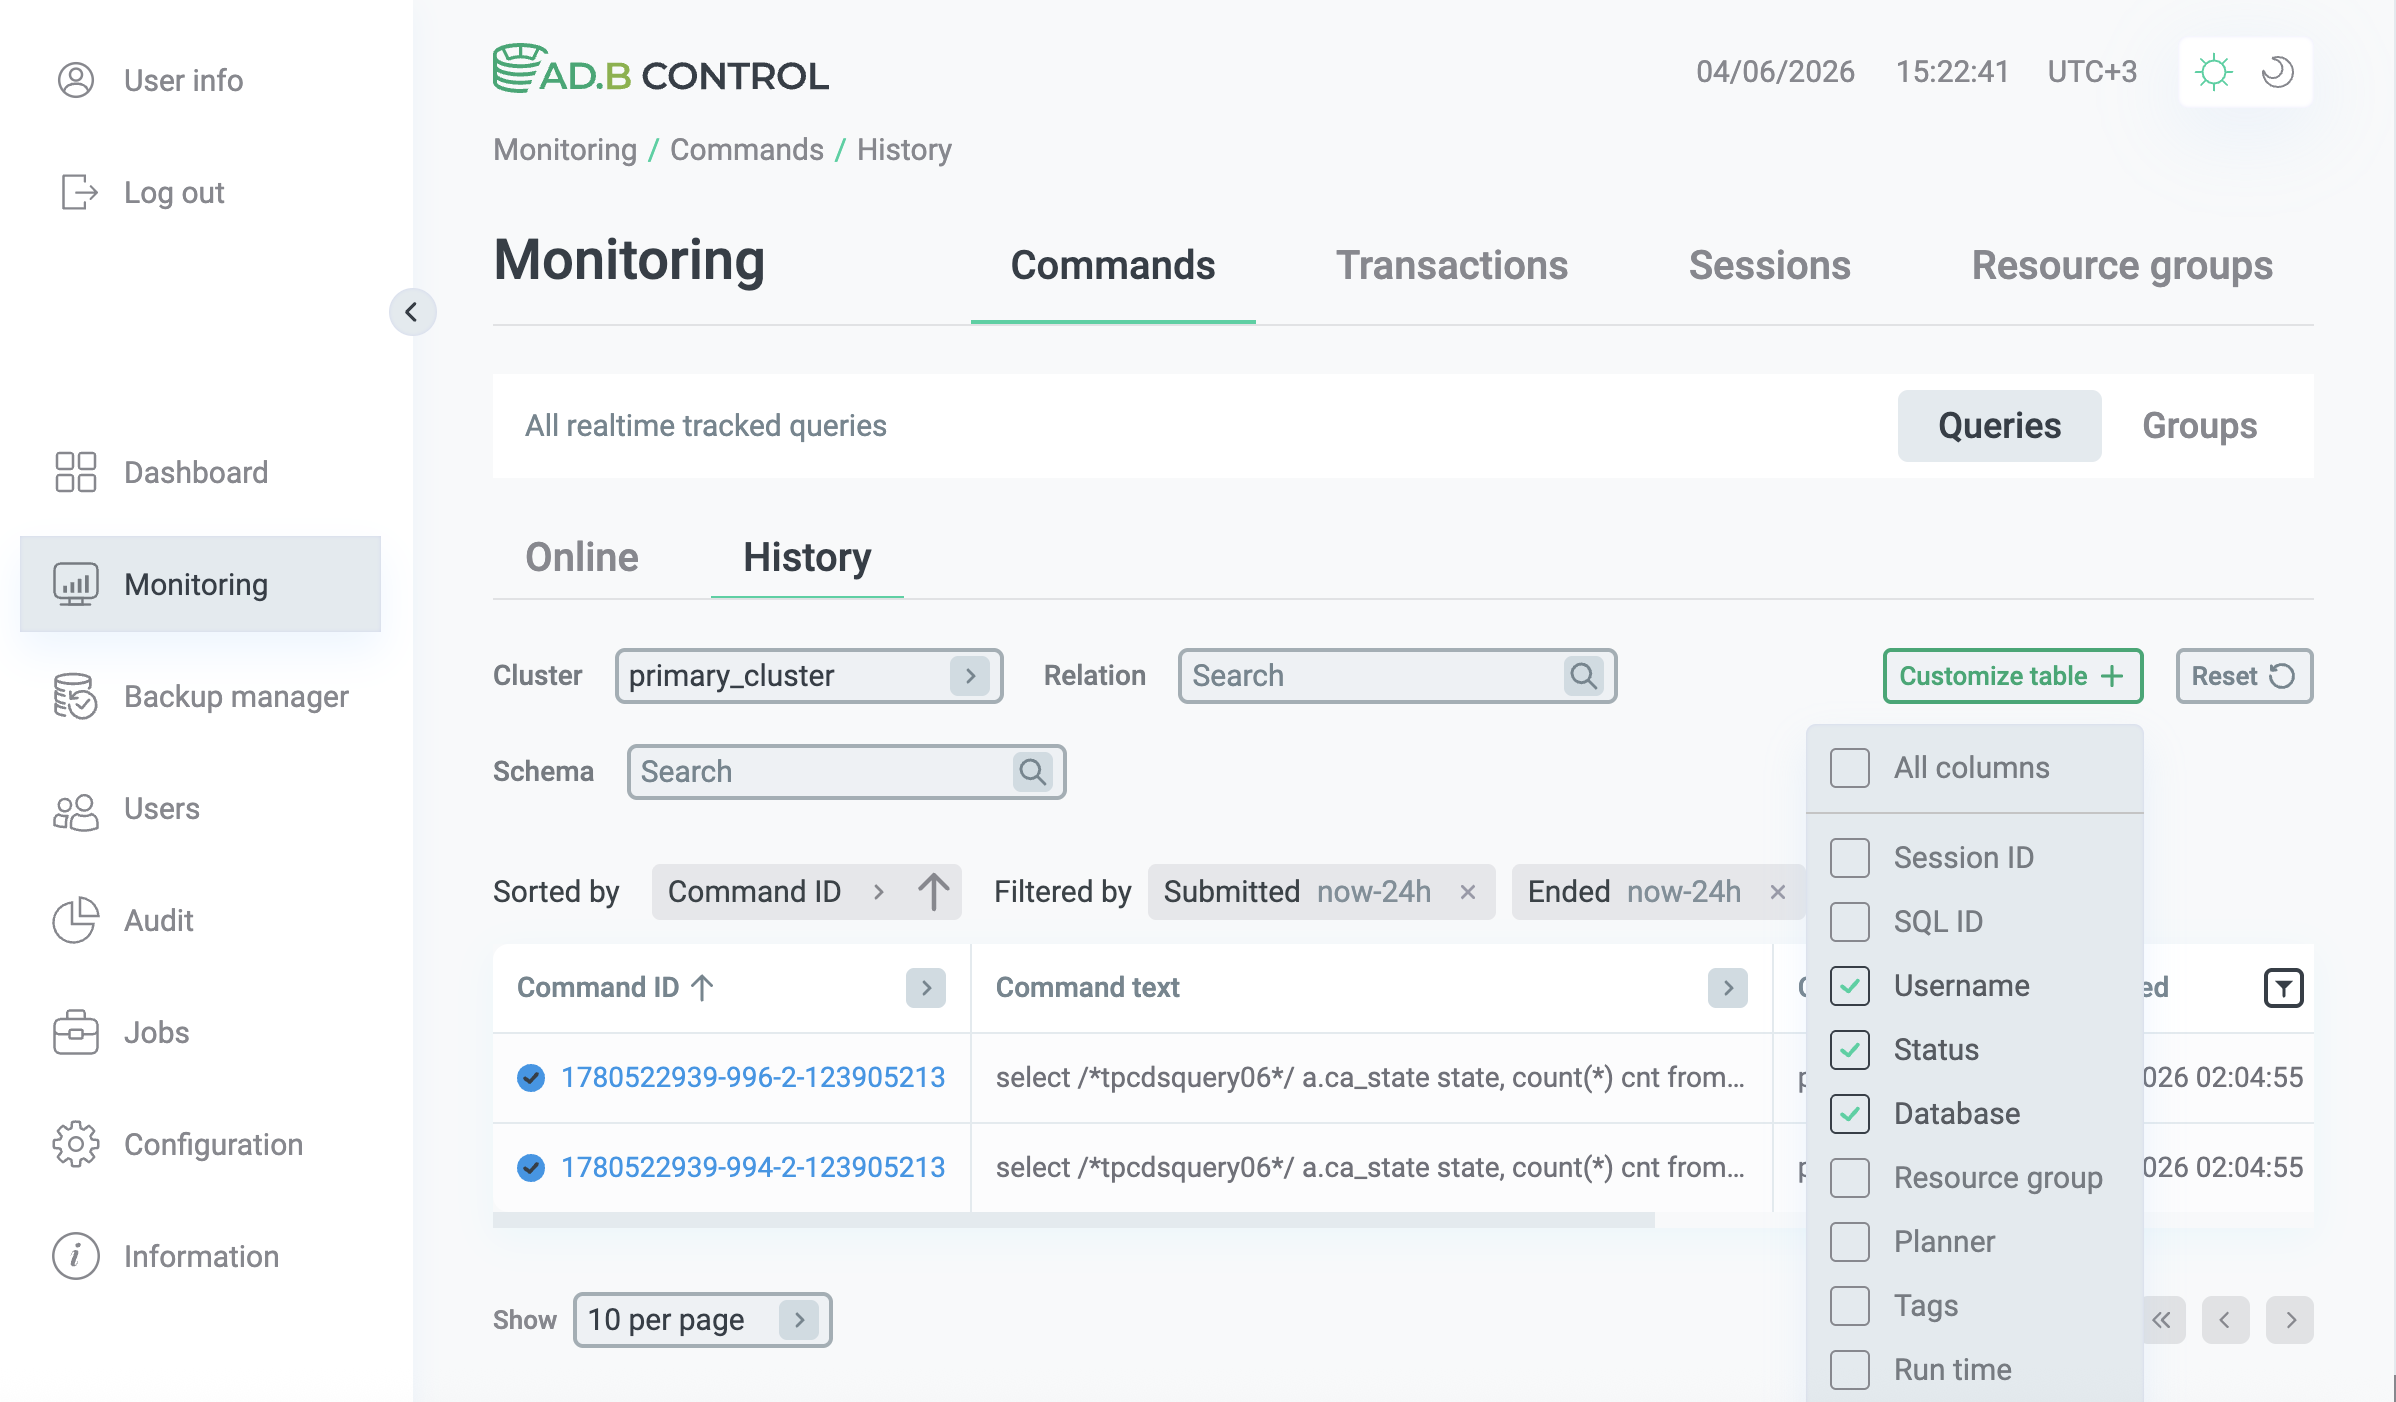
On some pages (for example, Audit → Authorization and Monitoring → Commands), you can add additional columns to the tables in addition to those displayed by default:
-
Click the Customize table button above the table.
-
In the drop-down list that opens, select columns to show. Or click All columns to display all available columns.