
Cluster management
ADB Control allows you to monitor multiple ADB clusters simultaneously.
To manage clusters, you can use the Clusters tab on the Configuration page in the ADB Control web interface.
View the list of clusters
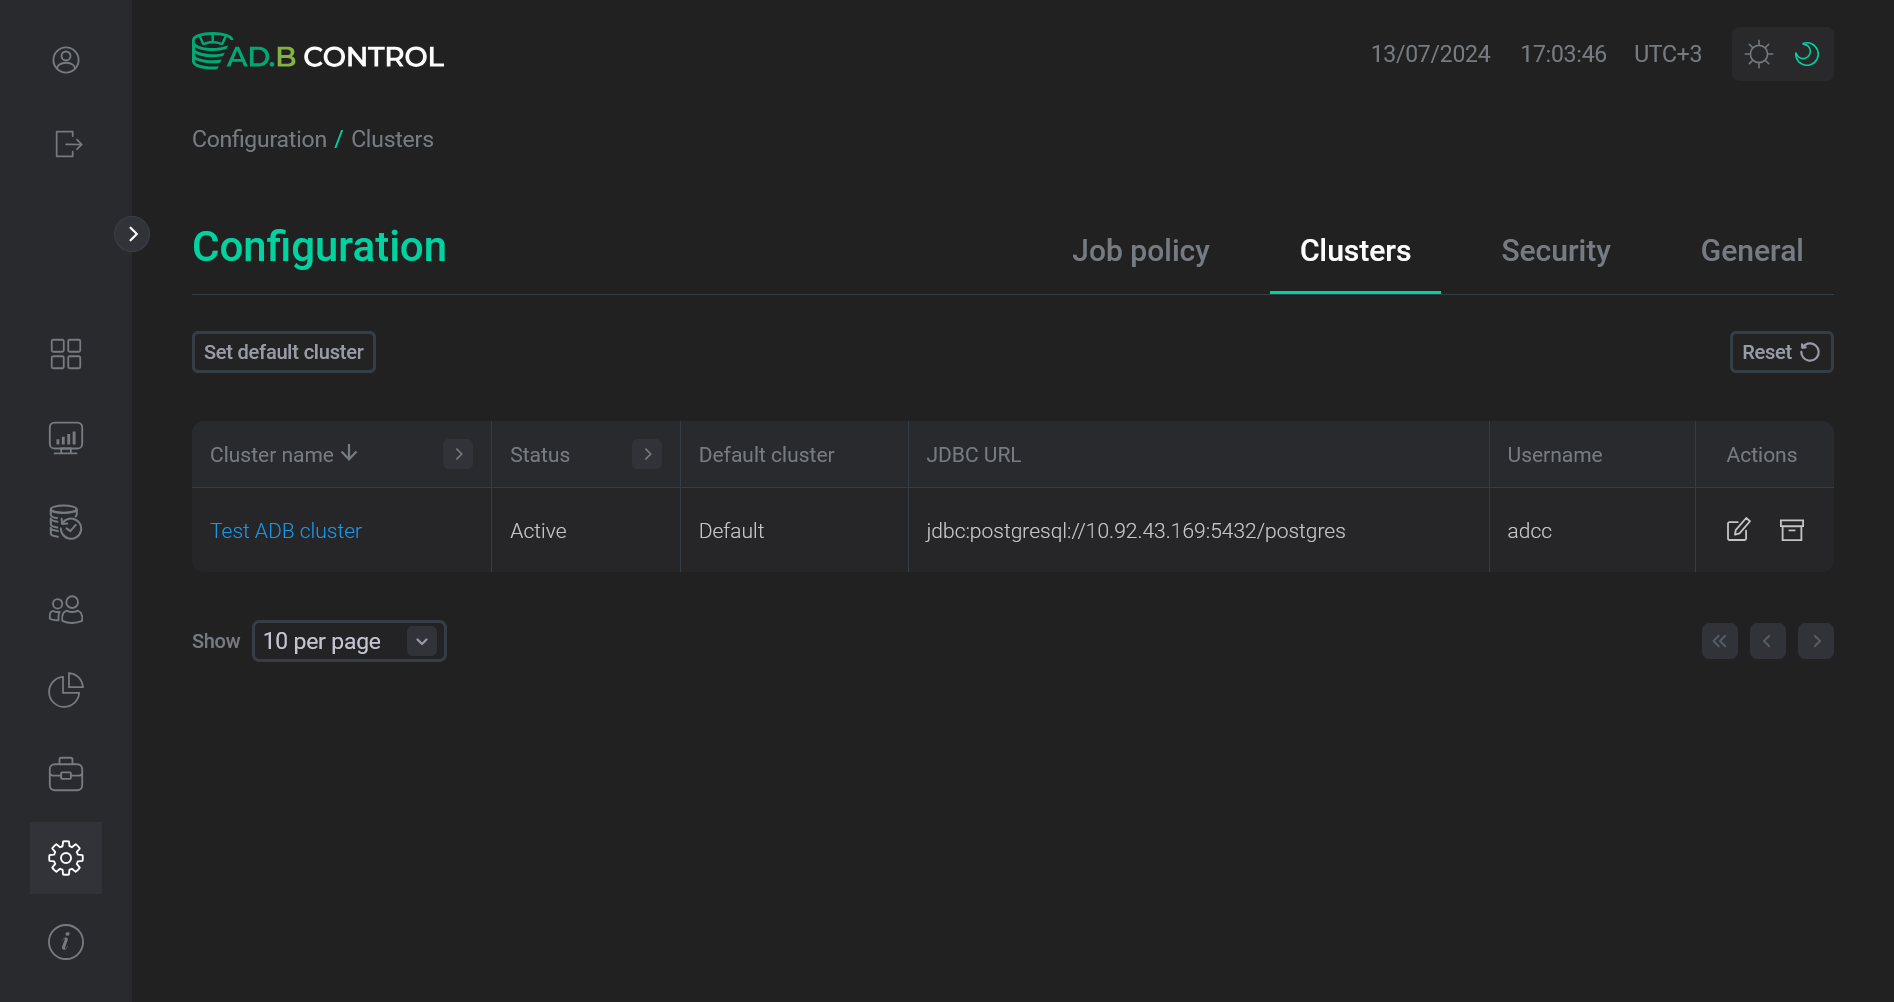
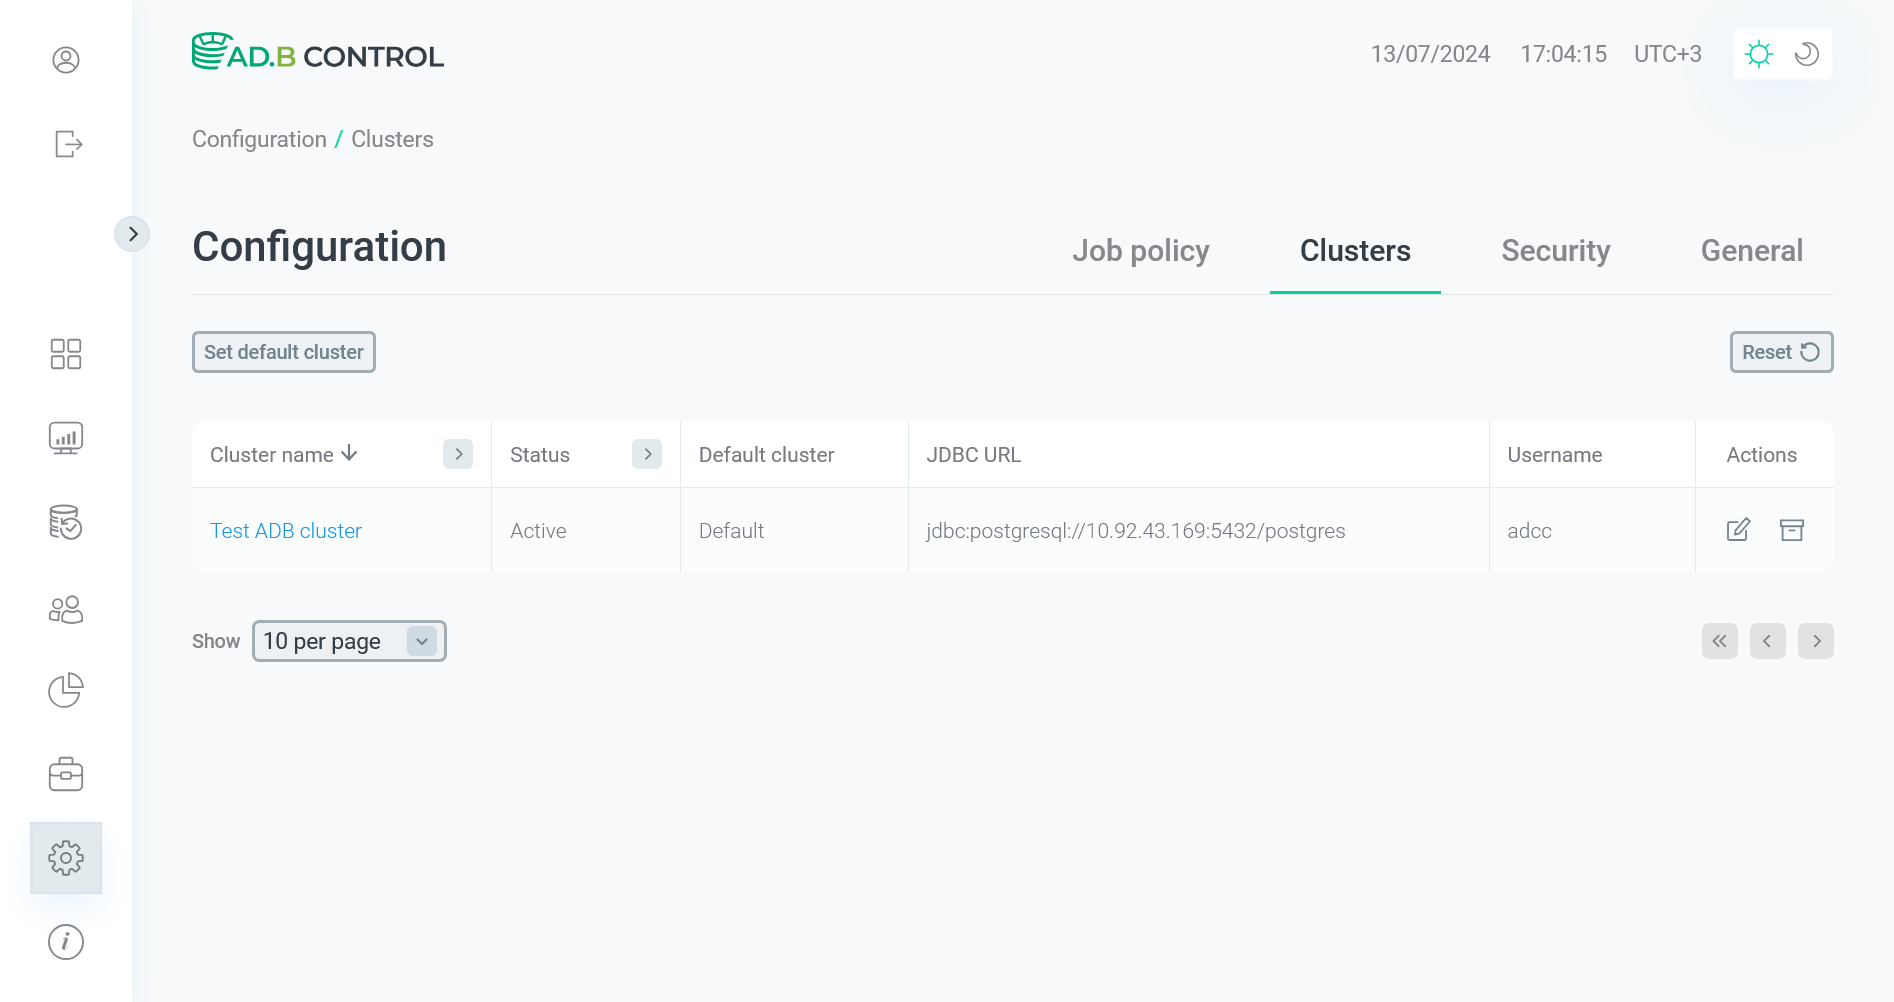
The Configuration → Clusters tab displays the following information on clusters.
| Field | Description |
|---|---|
Cluster name |
A cluster name |
Status |
A cluster status:
|
Default cluster |
For a default cluster, the |
JDBC URL |
A URL of the JDBC connection |
Username |
A role in ADB used by ADB Control for connecting to the cluster |
You can use column headers to filter and sort data in the table.
Add a cluster
To add a new ADB cluster to be monitored in ADB Control, follow the steps:
-
Using ADCM, in the ADB cluster that should be added to the existing monitoring system — add ADBC and ADBM agents, import ADB ES configuration, and install agents.
-
In the ADB Control web interface, open the Configuration → Clusters tab. The new cluster should be added automatically.
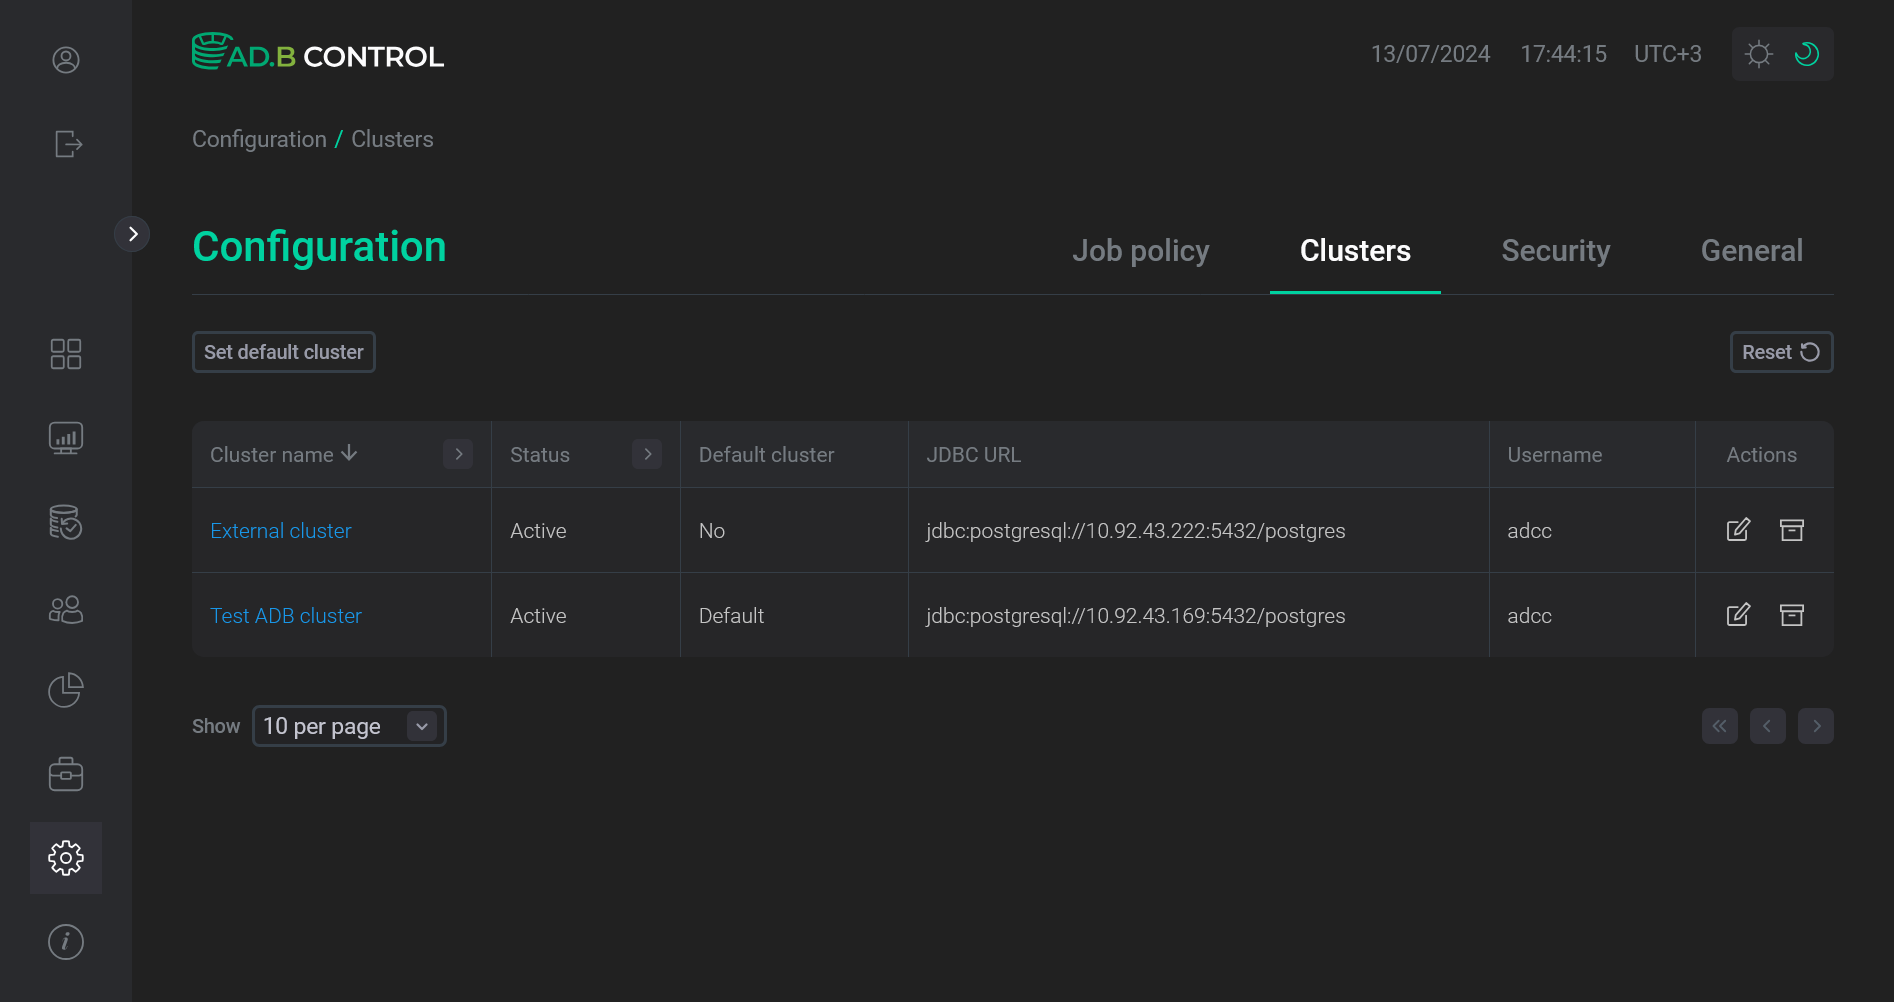 Cluster is added
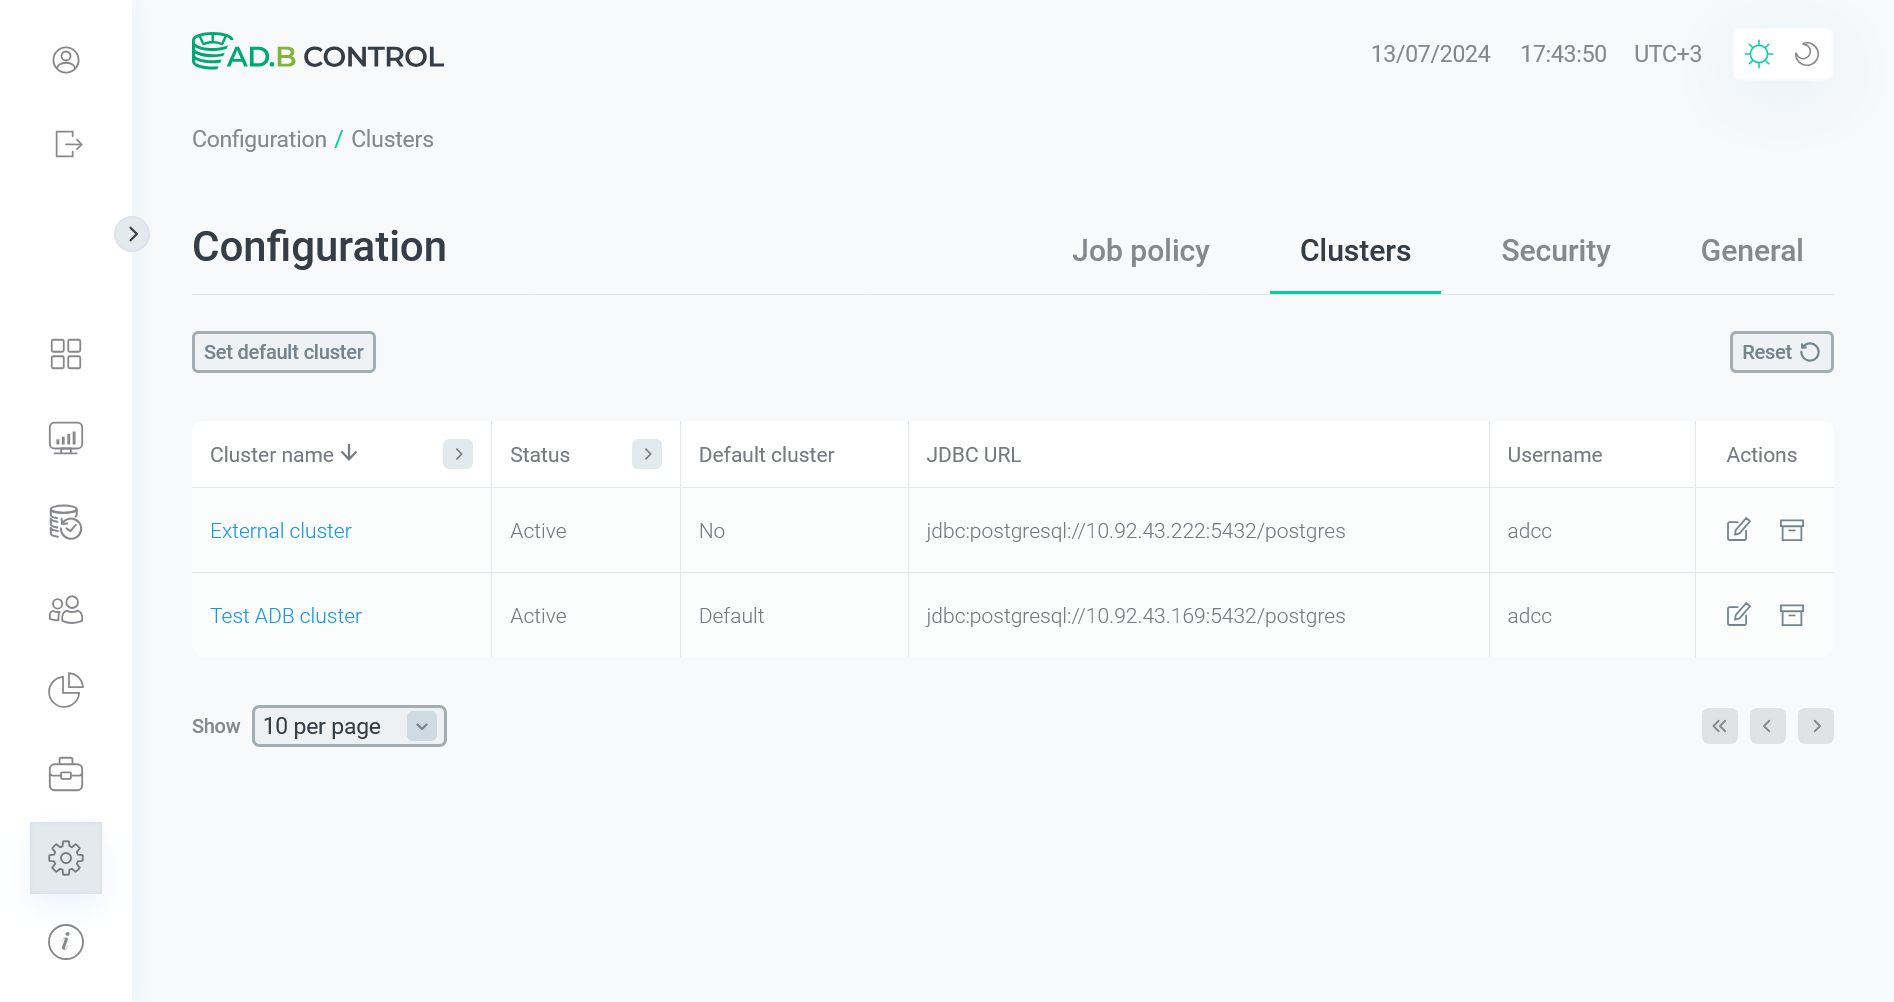 Cluster is added
 -
To ensure that the cluster connection is successful, you can run an SQL query in one of the cluster databases that were previously selected for monitoring, and verify that the query information appears on the Monitoring page. Note that the added cluster must be pre-selected in the filters on the page (if the cluster is not marked as default). You can use a test query as follows:
SELECT pg_sleep(60);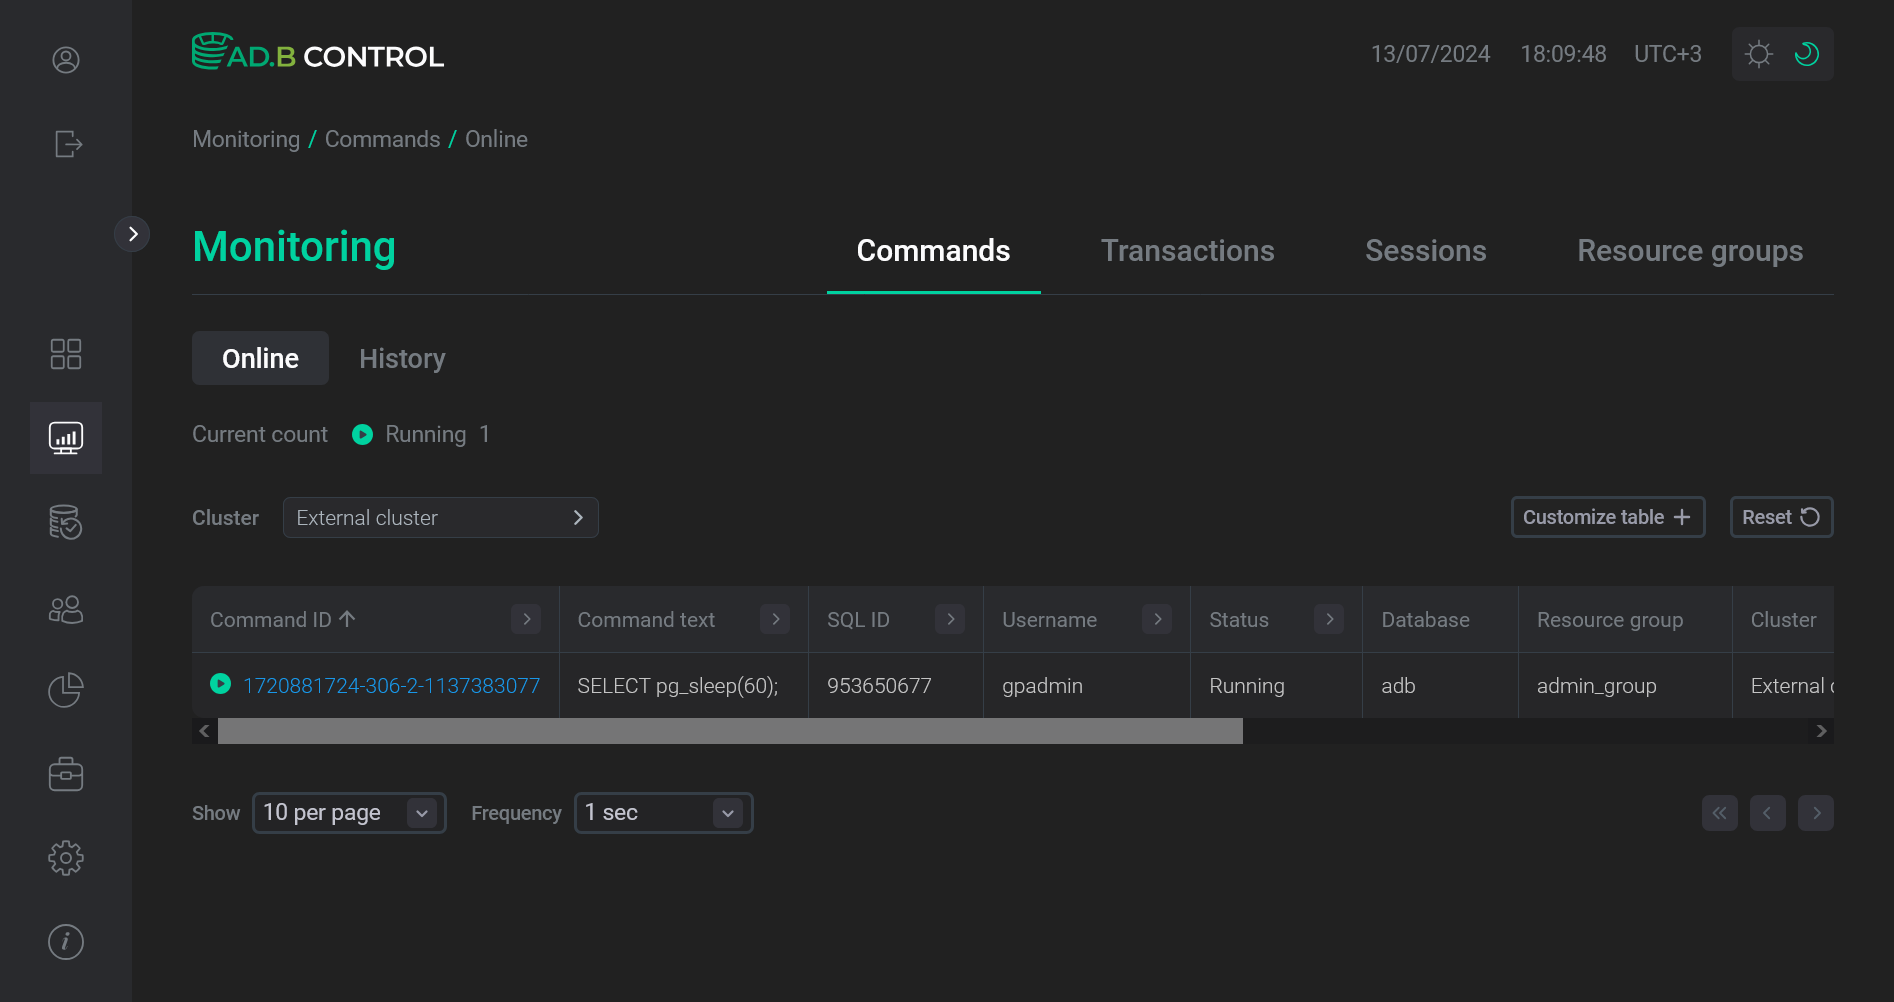 Cluster is available for monitoring
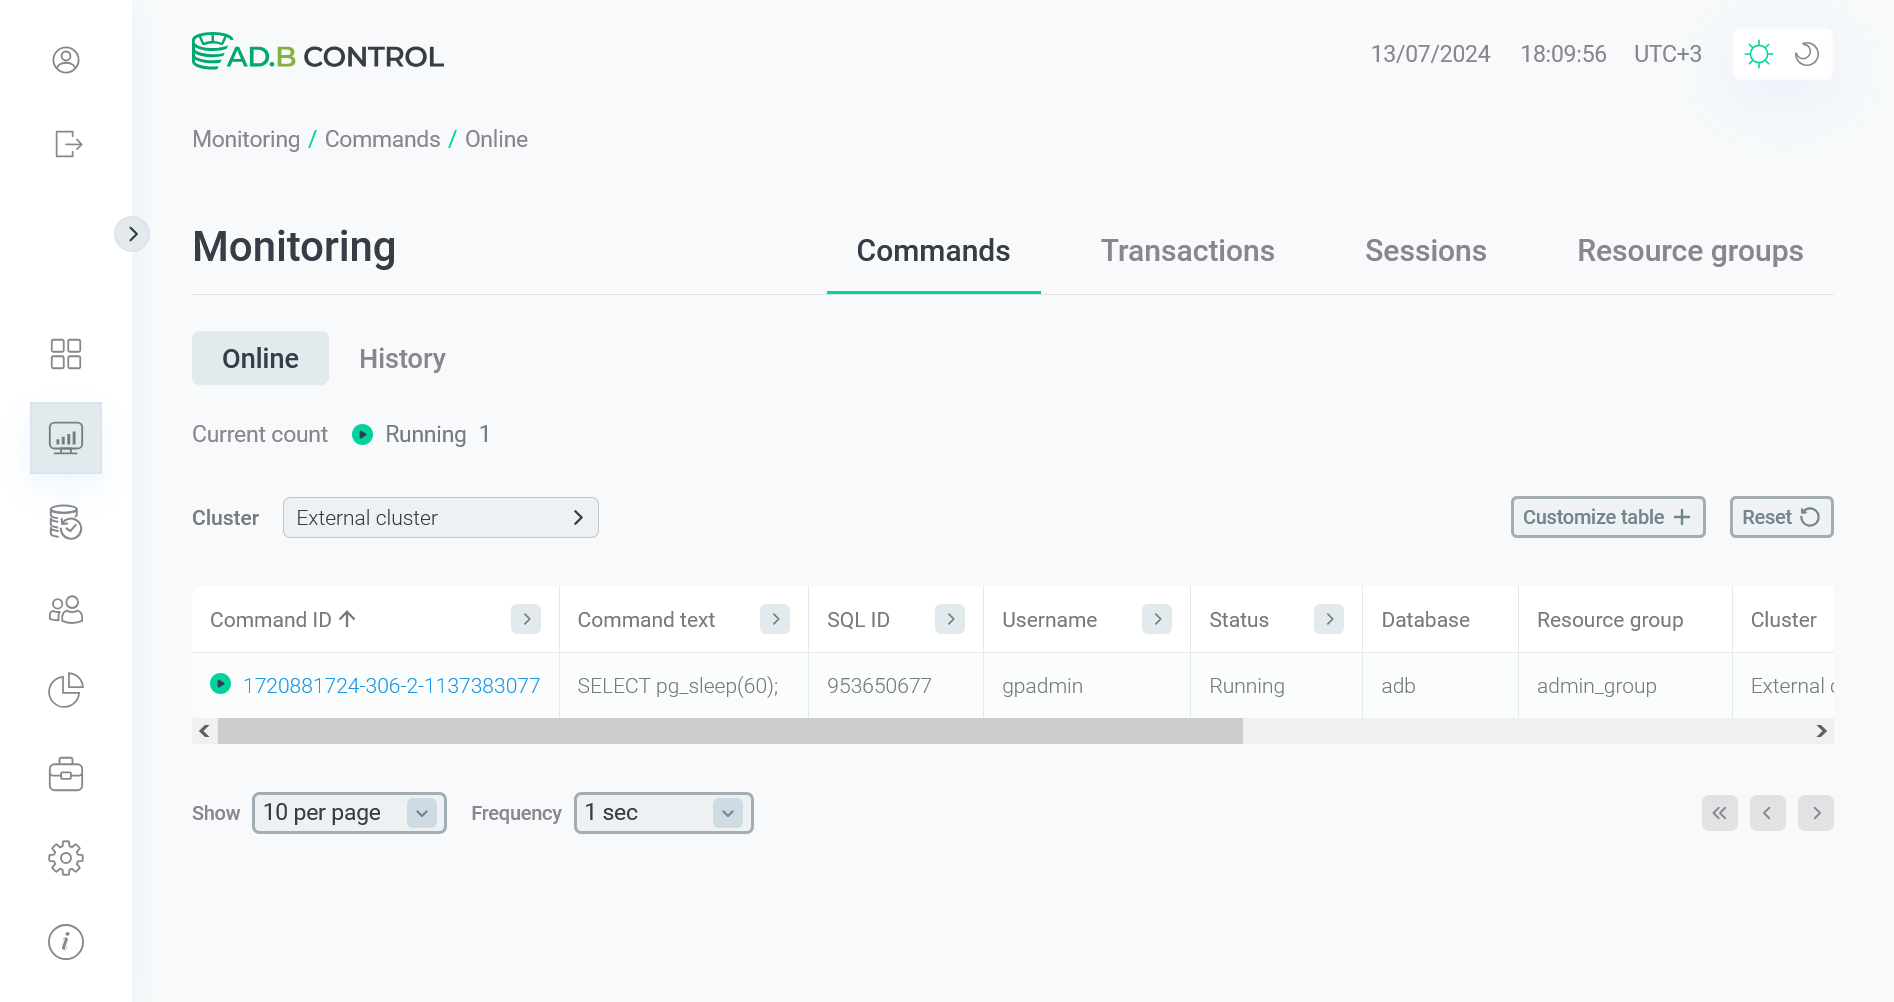 Cluster is available for monitoring
Set a default cluster
Many pages of the ADB Control web interface have cluster name filters. To assign the cluster to be selected in these filters by default, follow the steps:
-
Click Set default cluster on the Configuration → Clusters tab.
-
In the window that opens, select a default cluster from the Cluster name drop-down list.
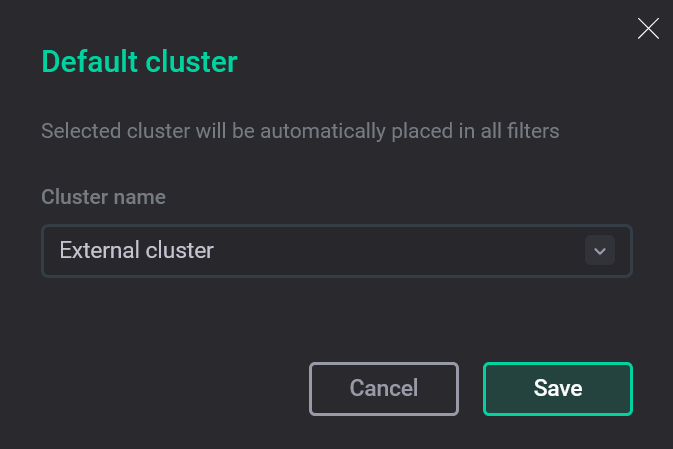 Select a default cluster
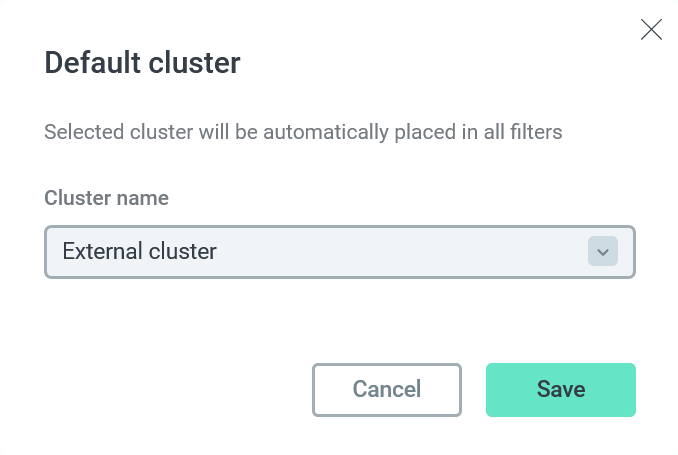 Select a default cluster
 -
Click Save. As a result, the Default cluster column in the table of clusters displays
Defaultfor a new default cluster andNo— for a previous default cluster.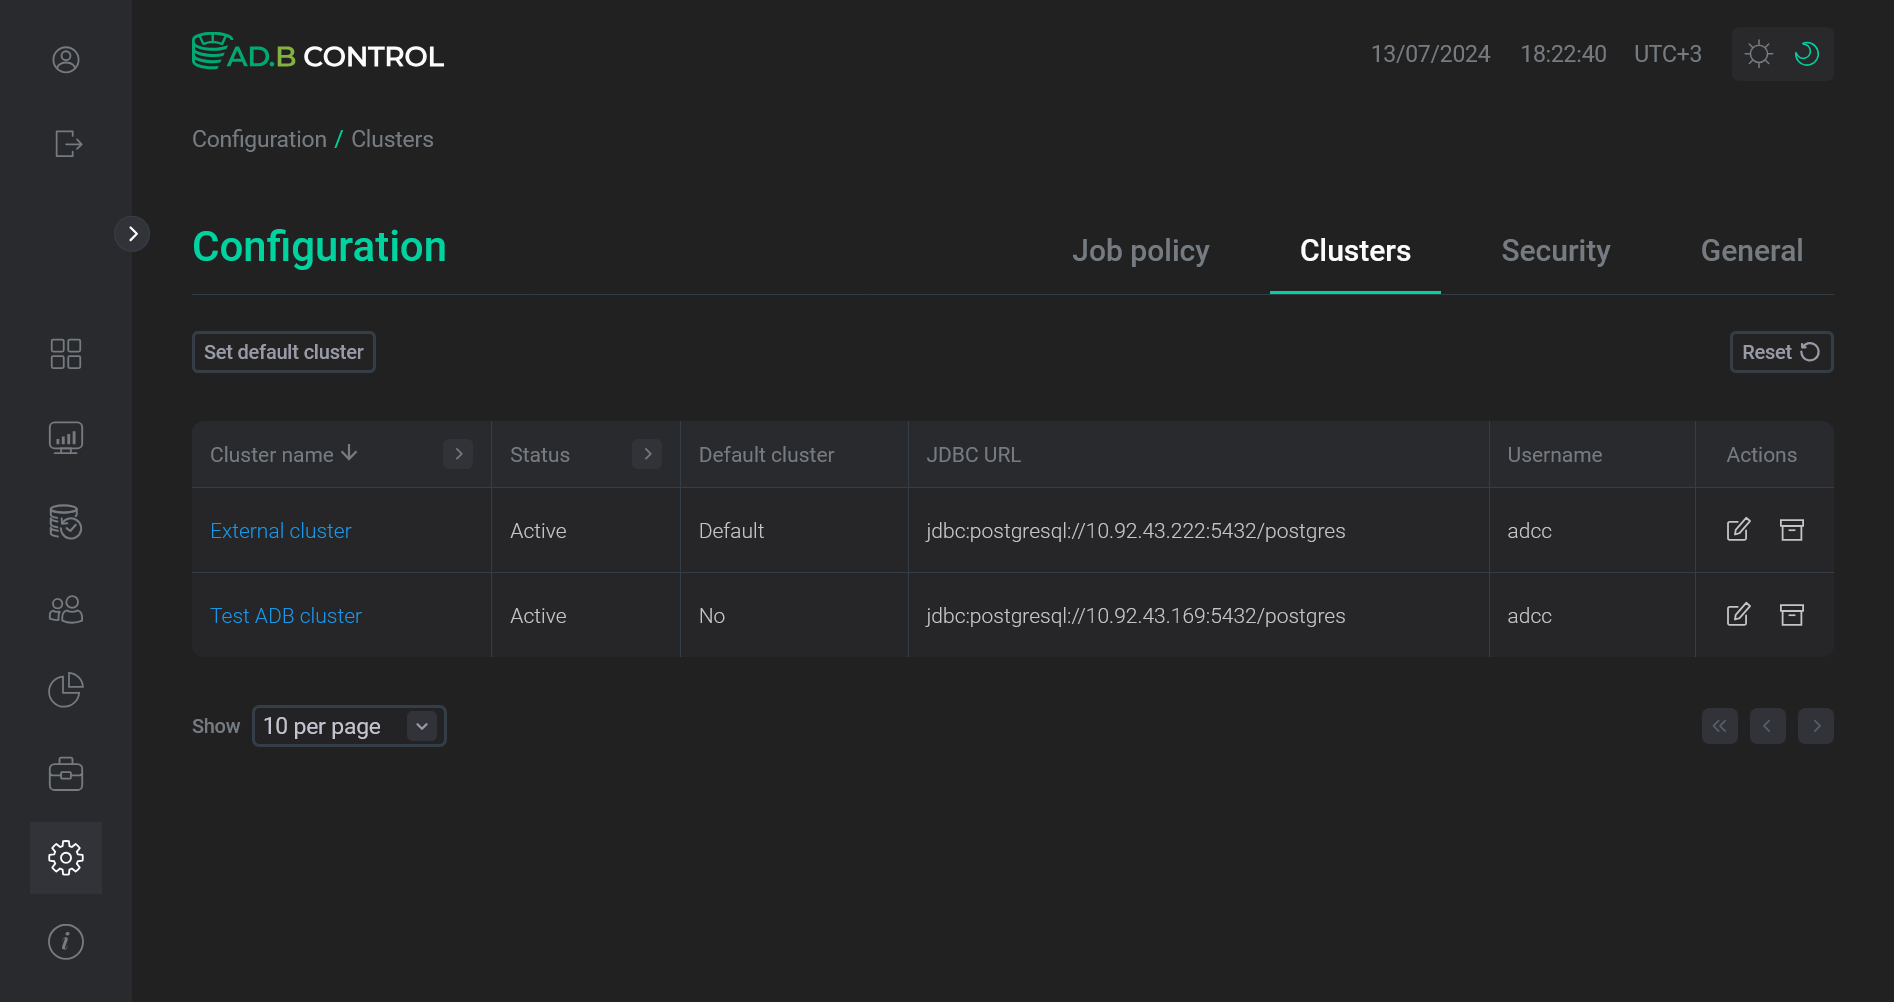 Default cluster is changed
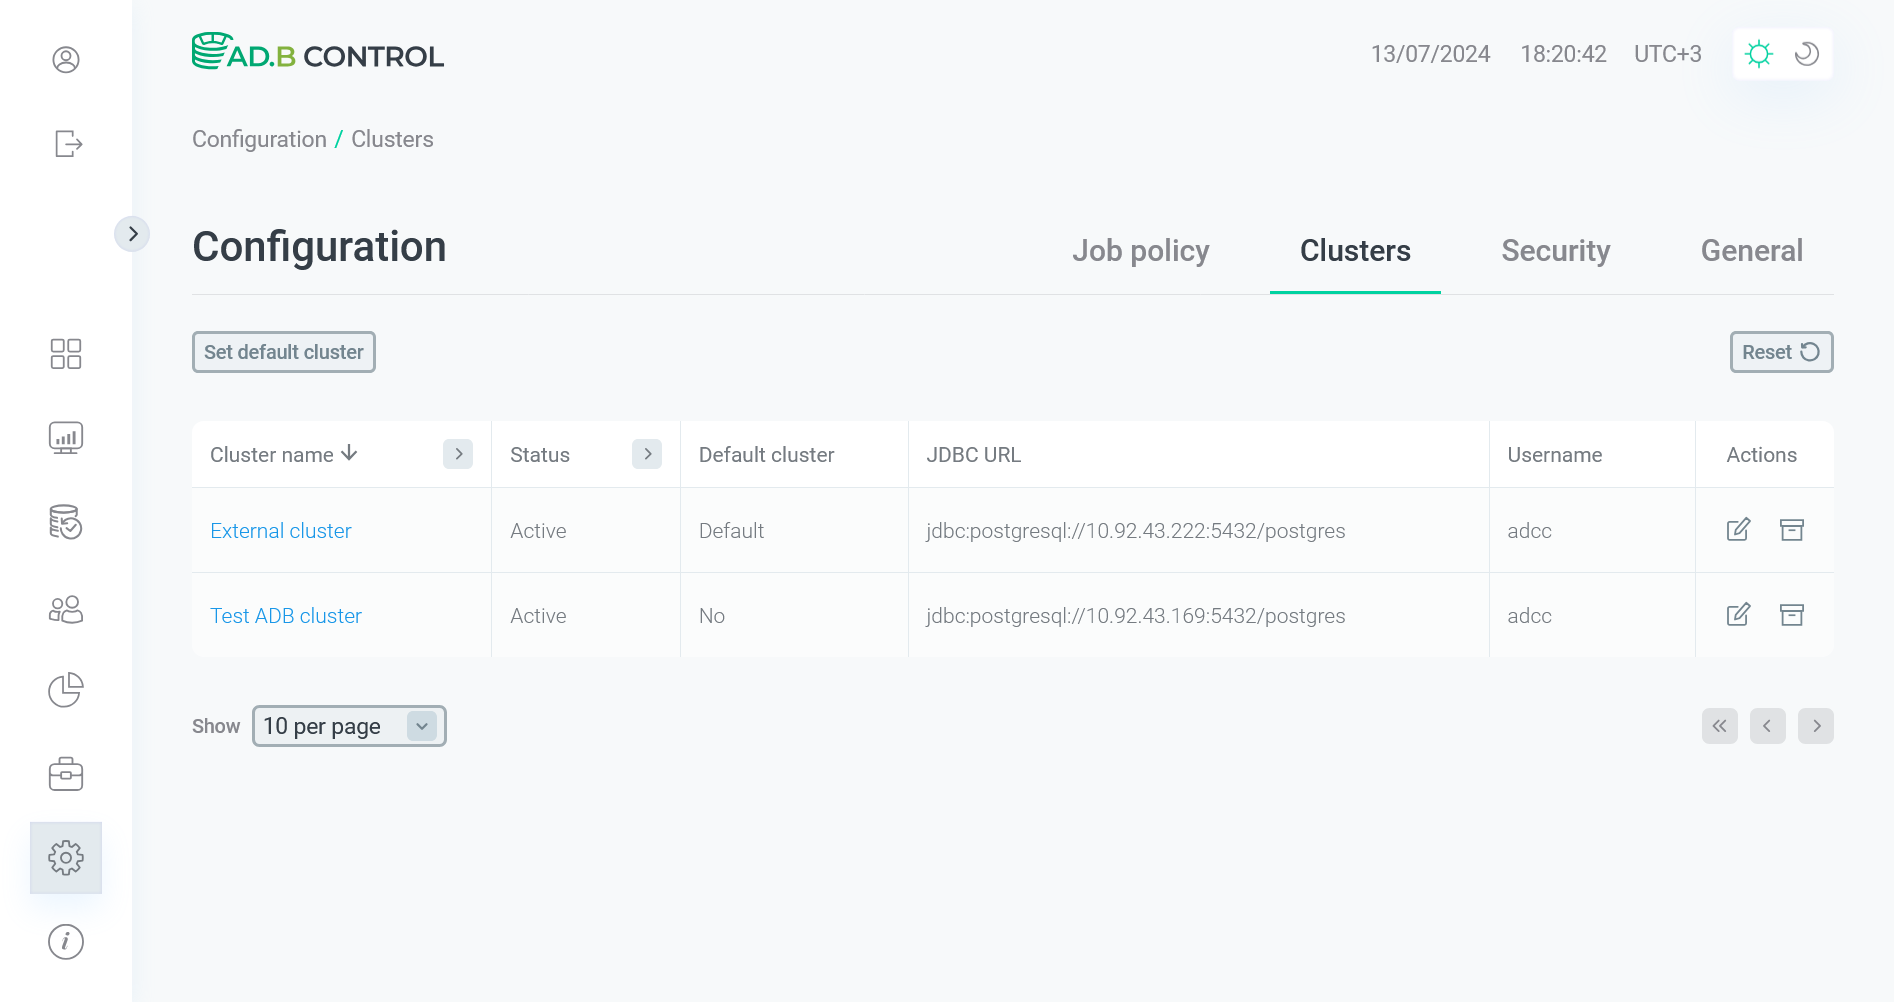 Default cluster is changed
Archive a cluster
In some cases, it is necessary to suspend the processing of monitoring metrics in ADB Control for a specific cluster. For this purpose, you can archive a cluster, which means:
-
ADB Control does not collect audit events for the cluster.
-
The export job skips the data related to the archived cluster.
-
Resource group statistics is not collected for the cluster.
-
On the Information page, there are no cluster details.
To archive a cluster, follow the steps:
-
Click the

 icon in the Actions column on the Configuration → Clusters tab.
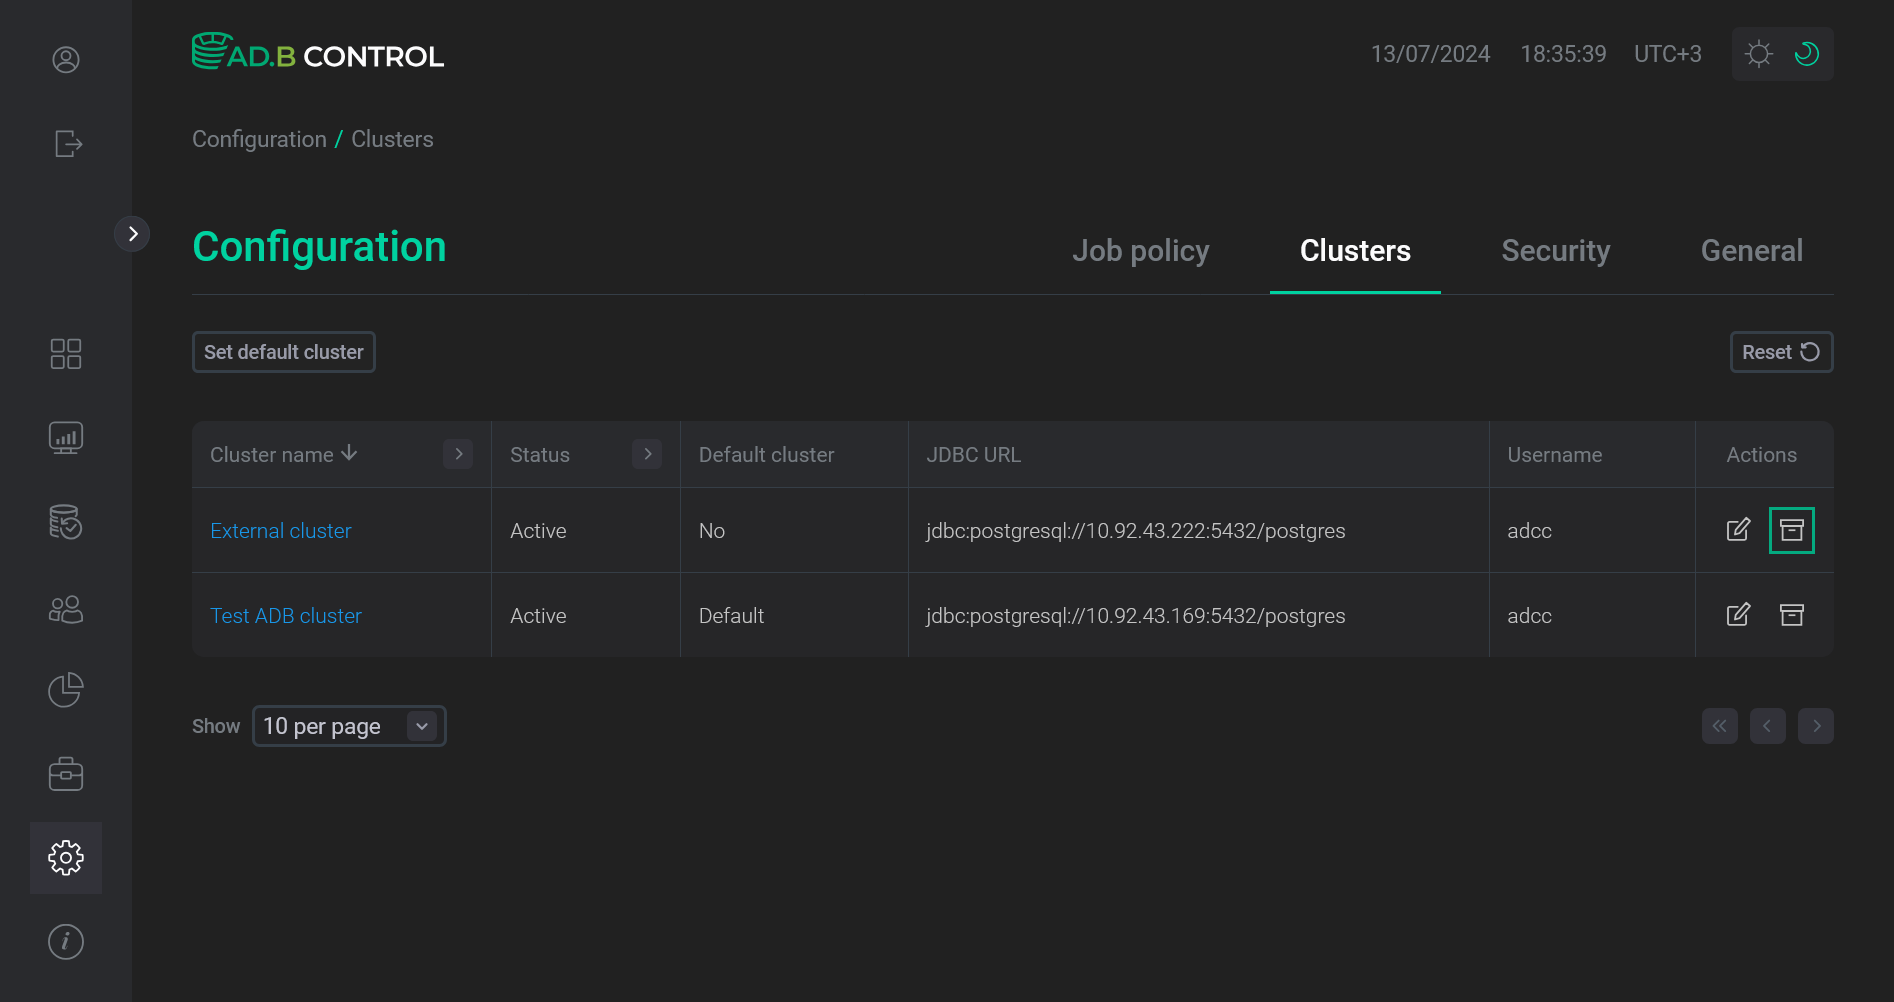 Switch to archiving a cluster
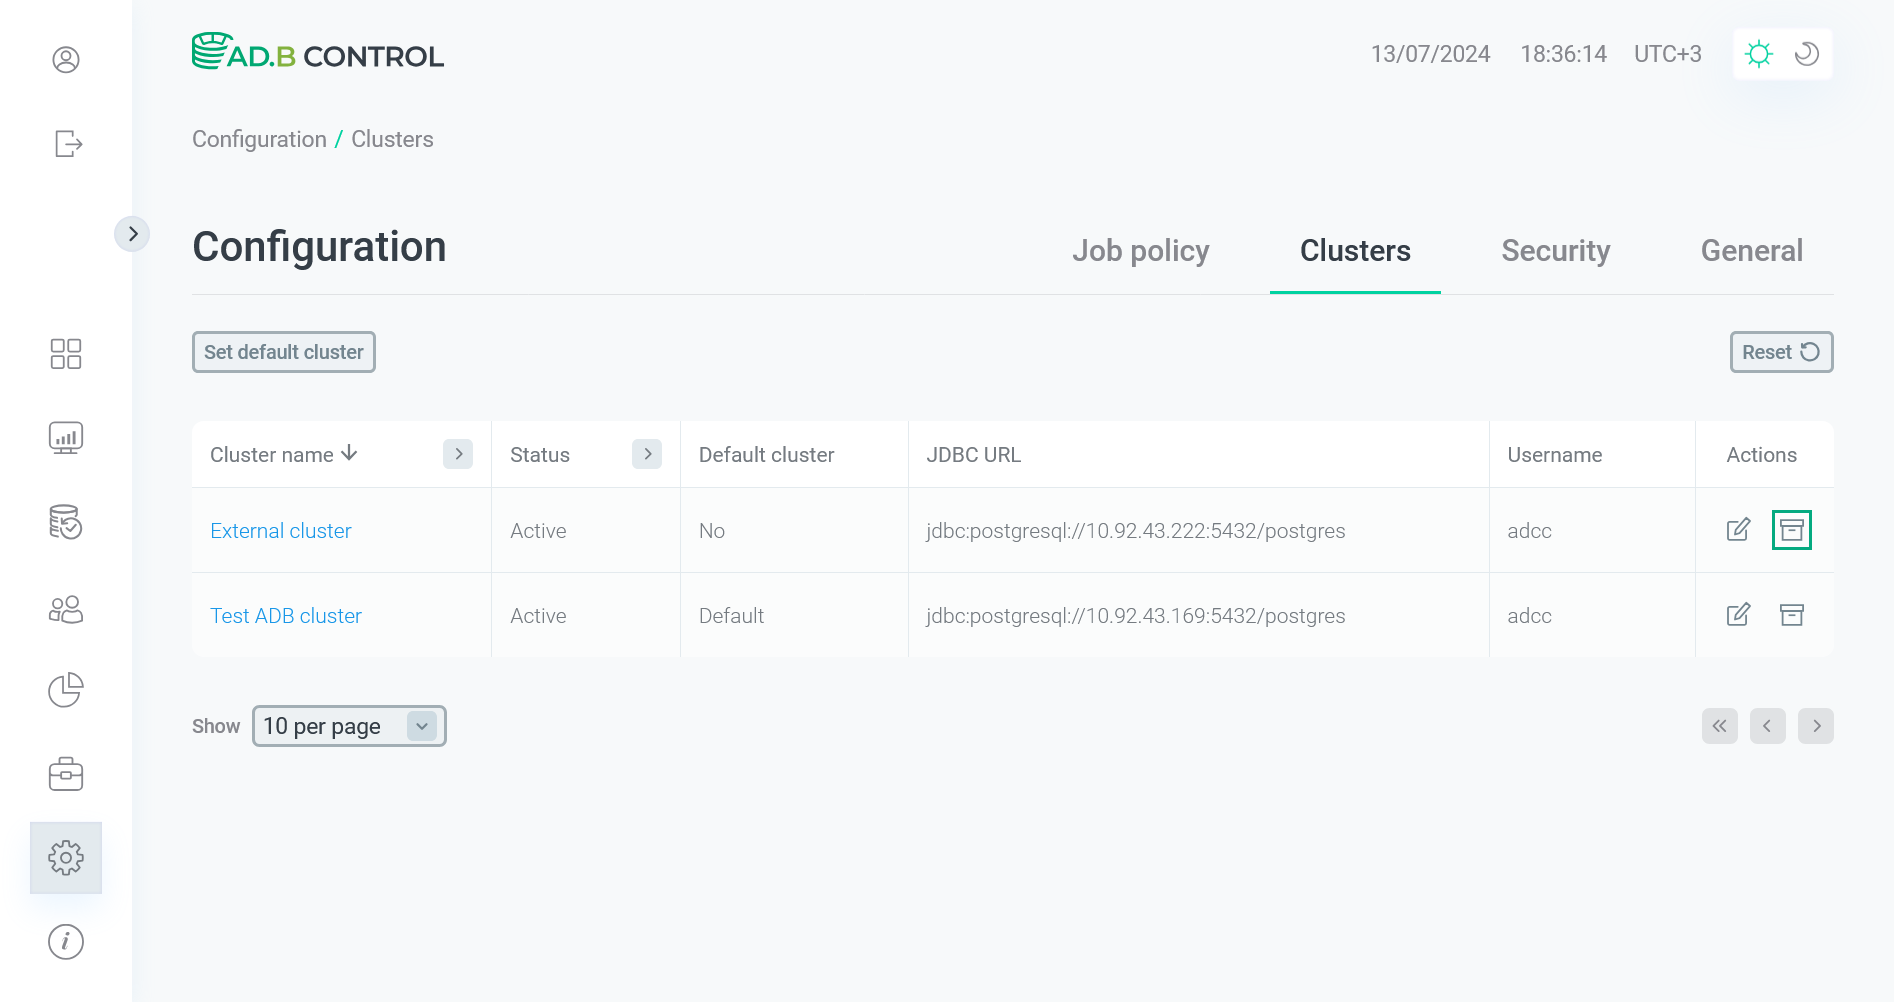 Switch to archiving a cluster
 -
In the window that opens, confirm the operation by clicking Apply.
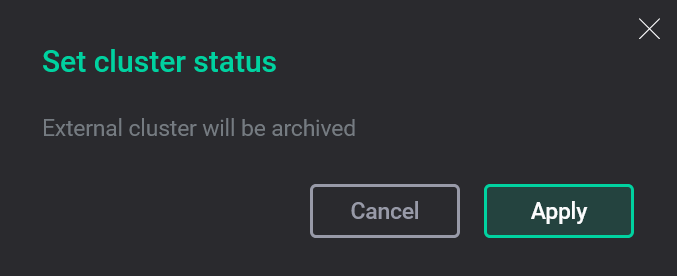 Confirm the operation
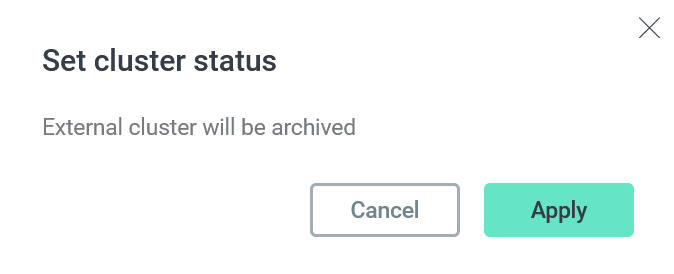 Confirm the operation
As a result, the cluster status is changed to
Archivedon the Configuration → Clusters tab.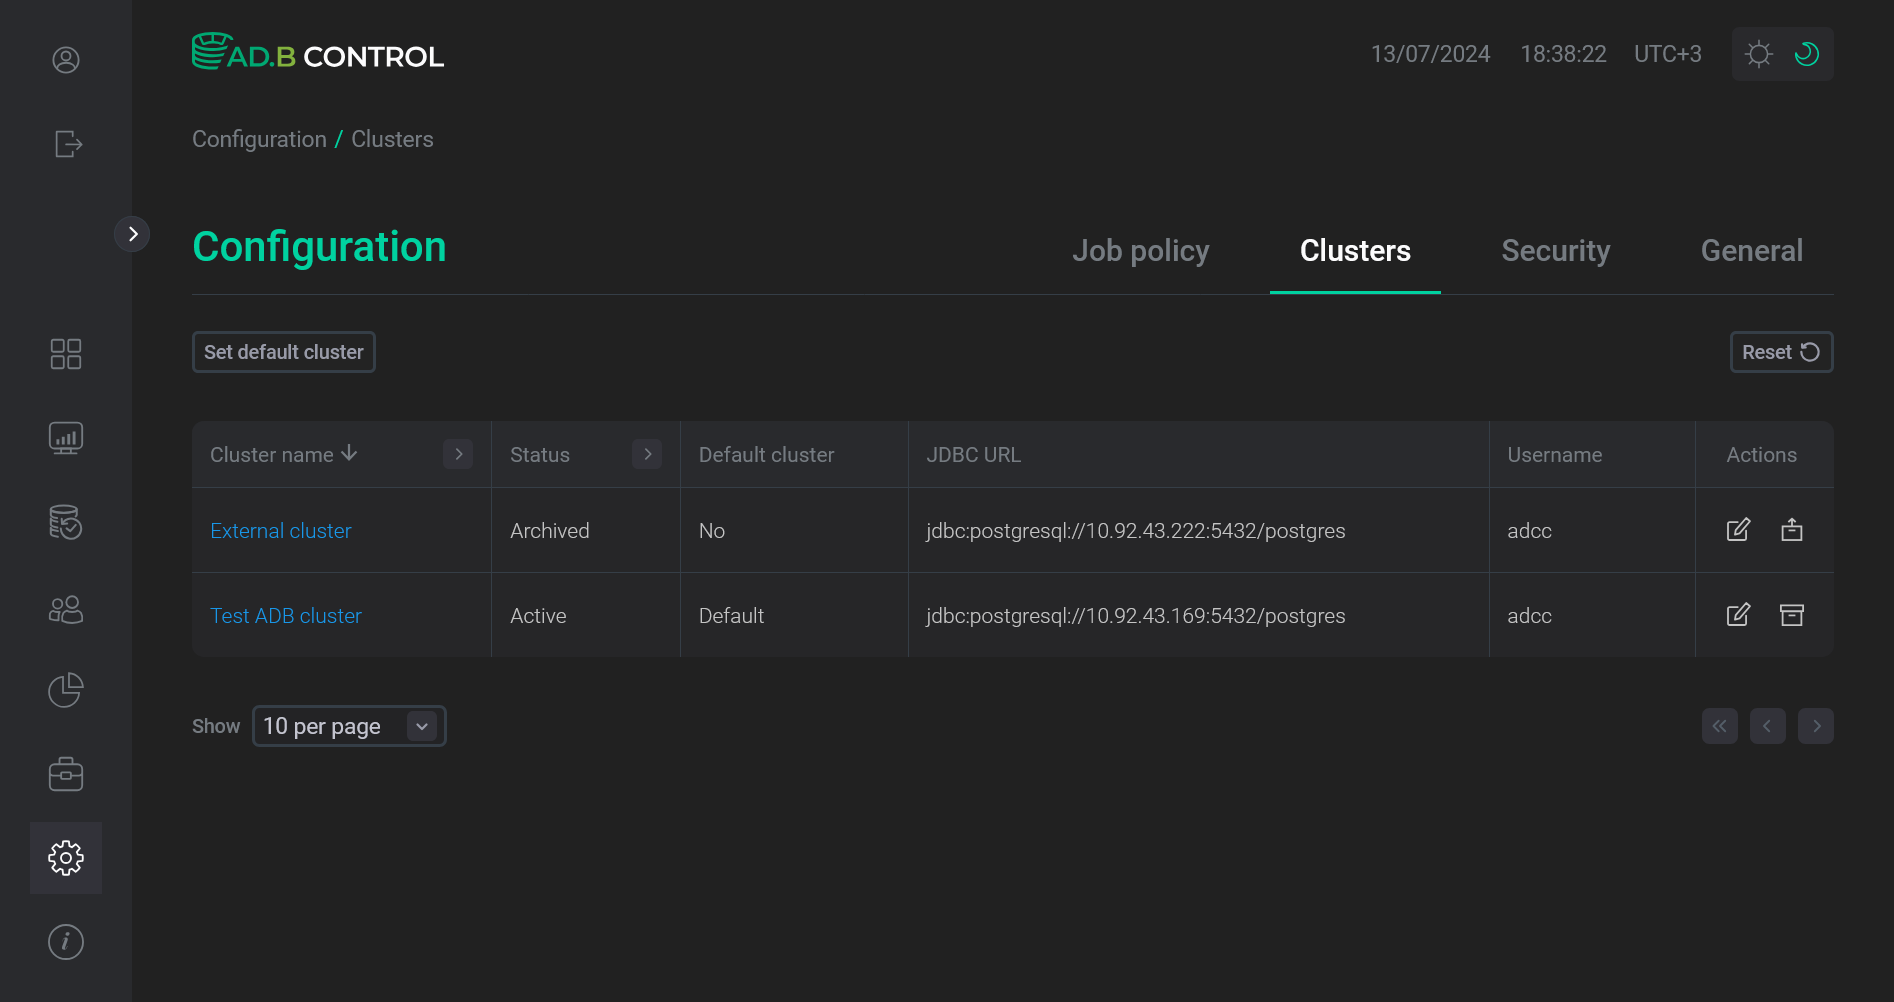 Cluster monitoring is stopped
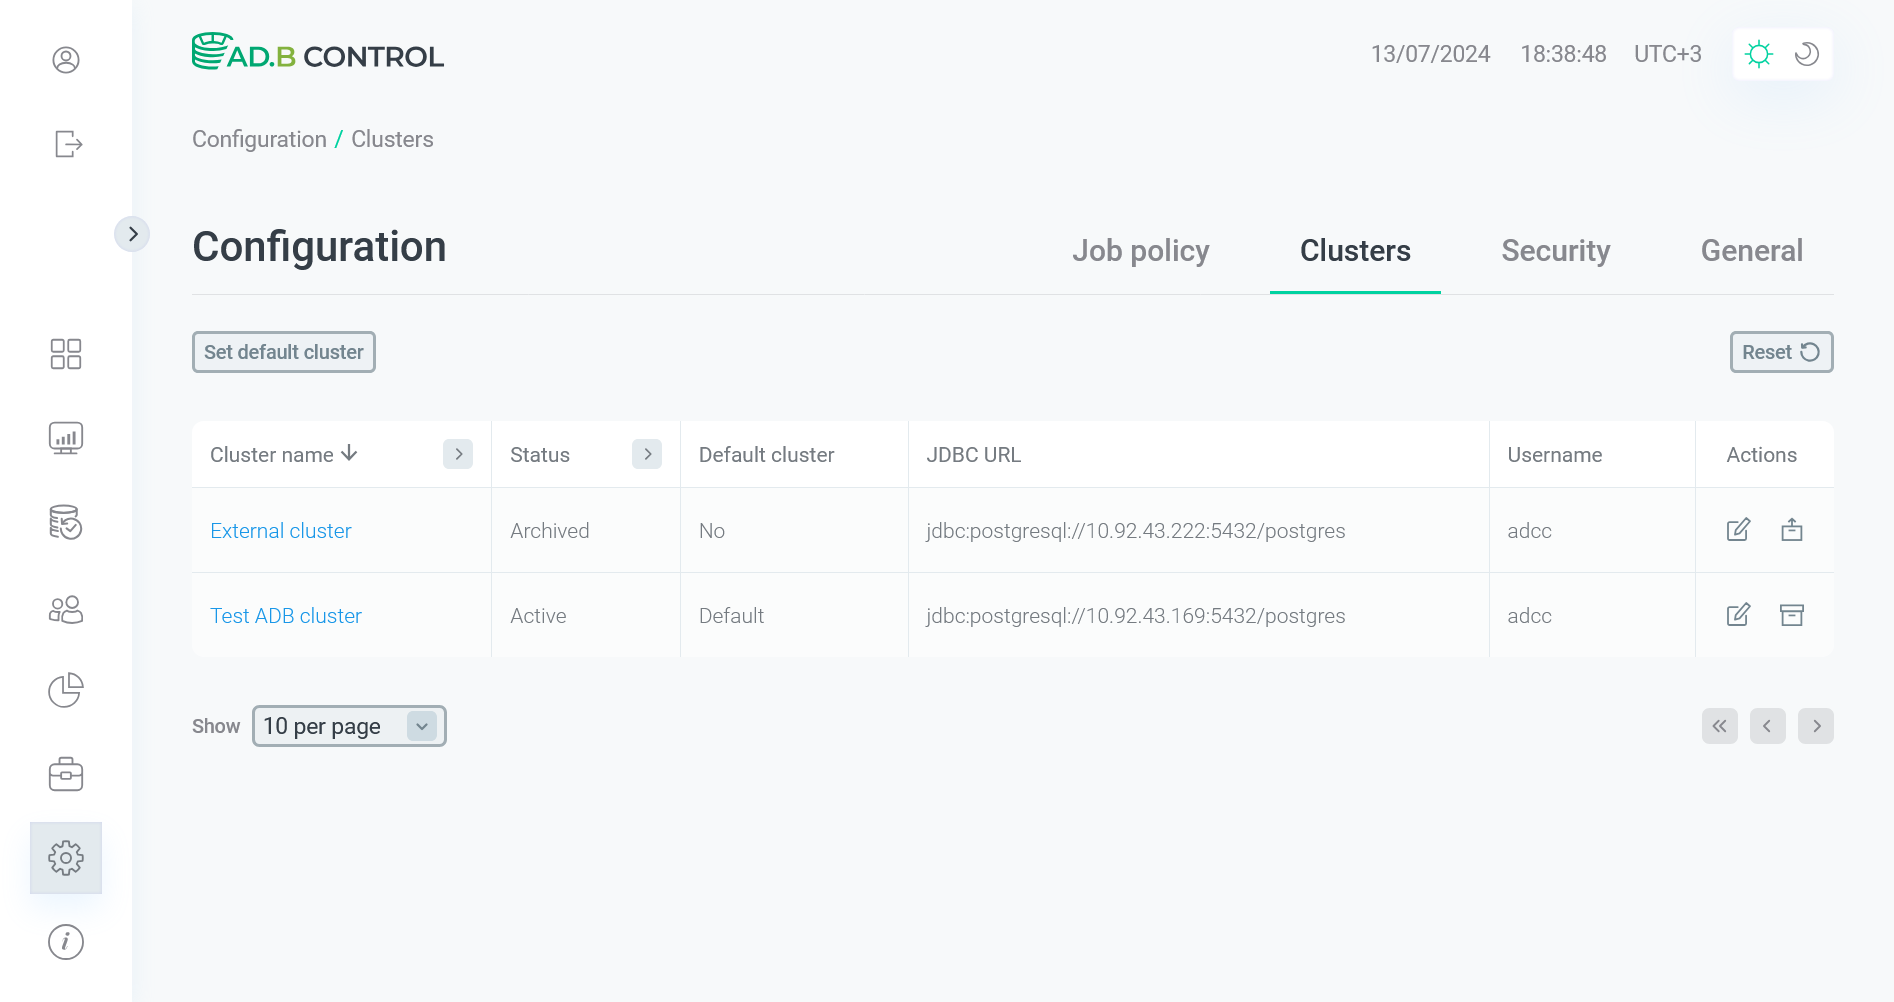 Cluster monitoring is stopped
|
NOTE
If you later need to resume the cluster monitoring, click the |
Configure monitoring of the selected cluster
To navigate to the cluster monitoring configuration, click a cluster name on the Configuration → Clusters tab.
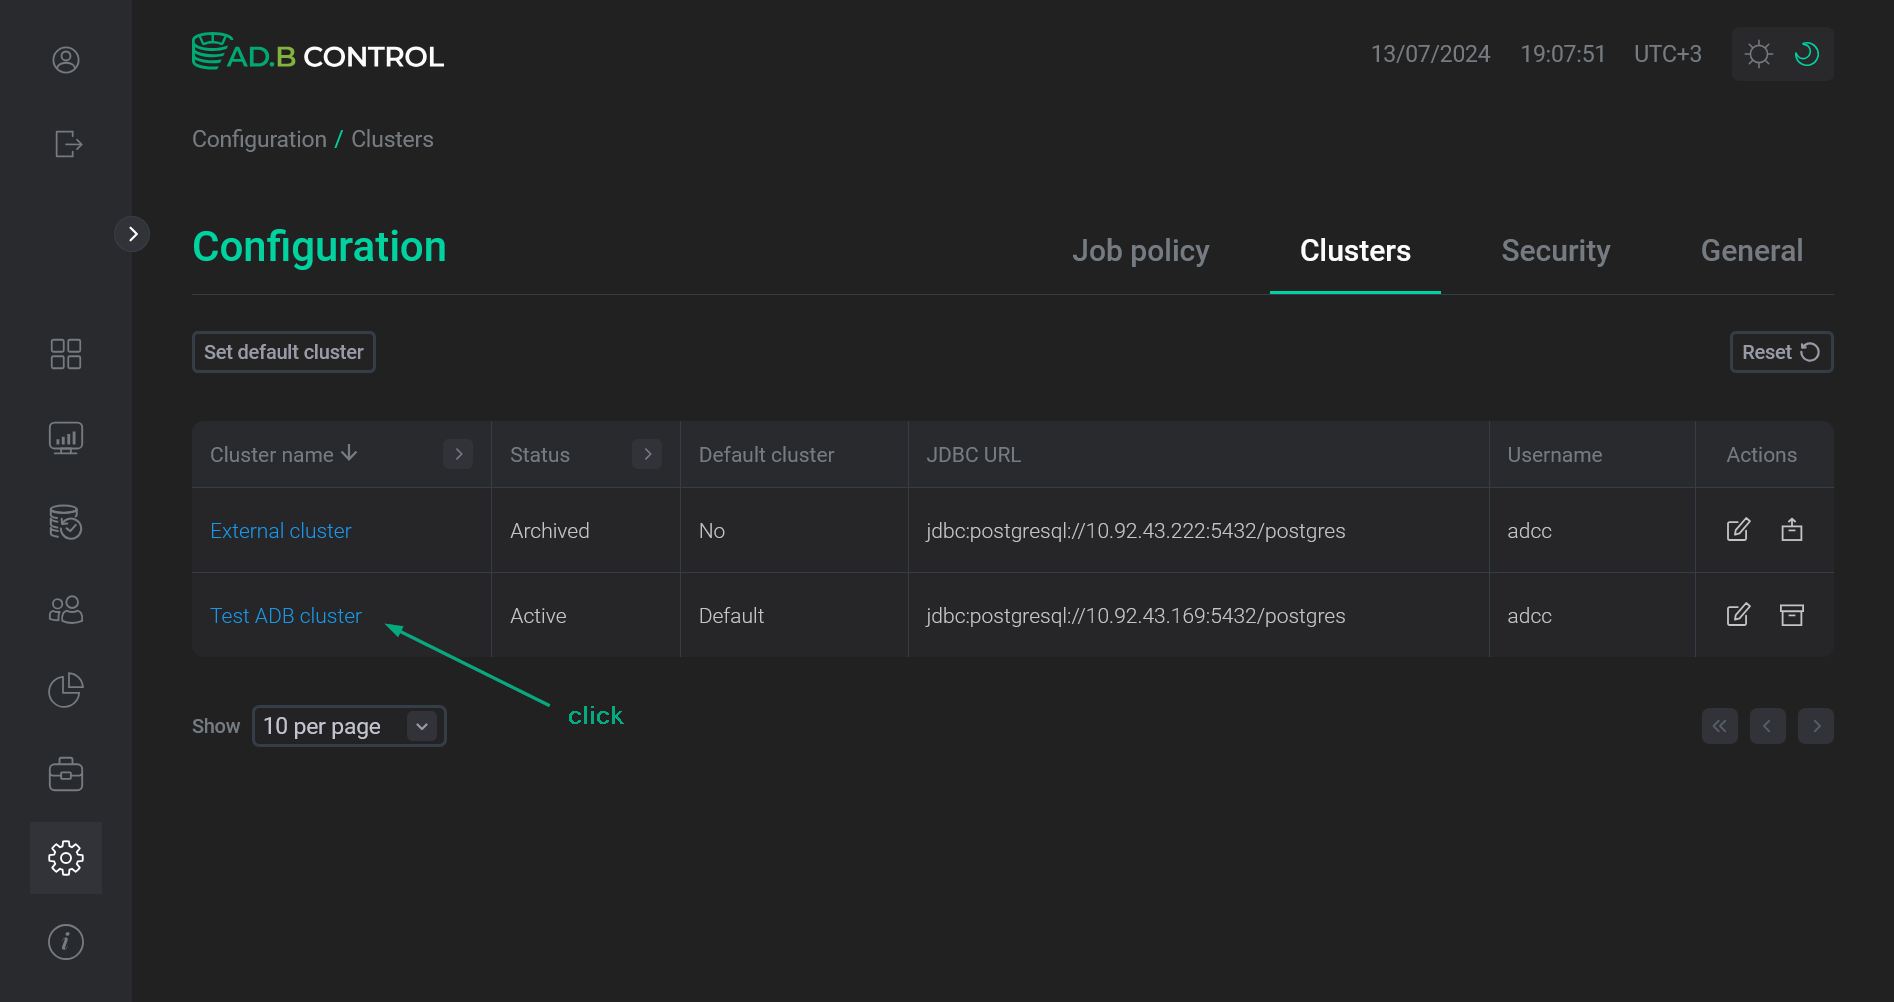
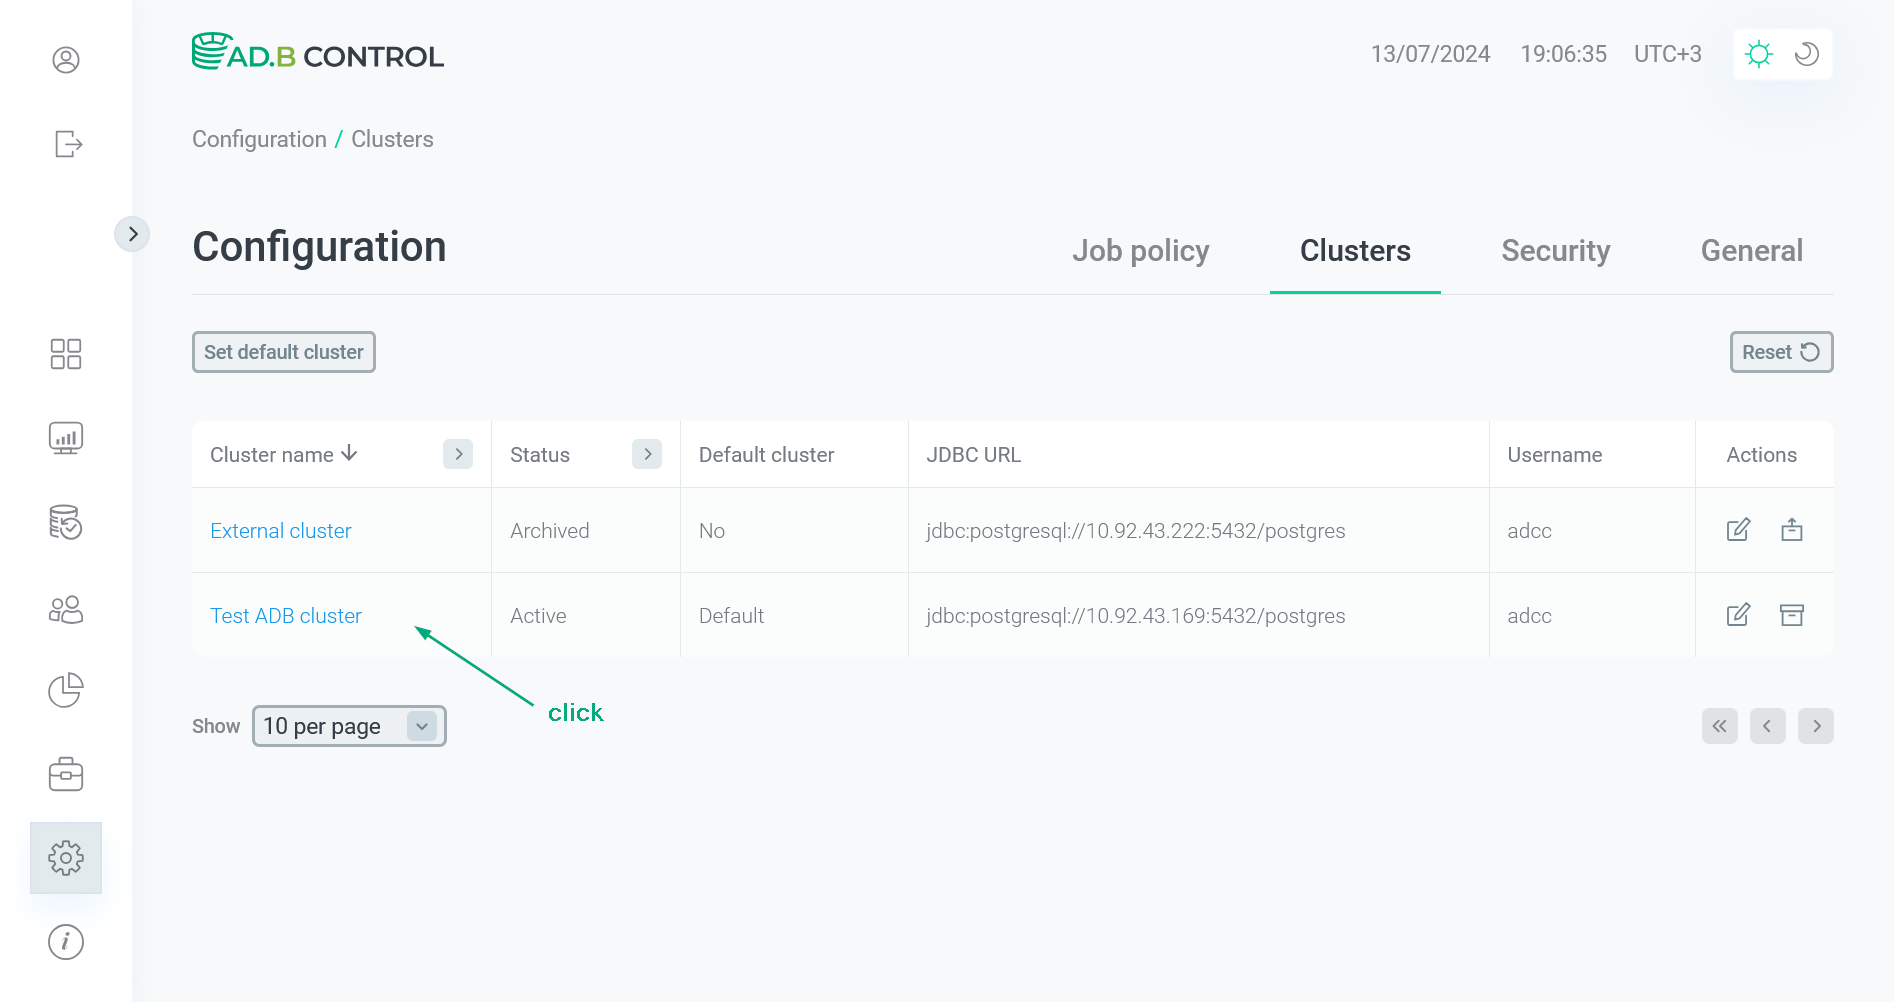
The top of the opened page displays a cluster name, the default label (if a cluster is selected by default), and a number of control elements for a quick transition to the actions described above:
-
Make default — make a cluster default.
-

 — activate an archived cluster.


The main part of the opened page contains several sections that are described below. To apply any changes to the parameters in these sections, click Apply in the appropriate section, to undo the changes that have not been yet saved — click Revert.
Databases monitoring
In the Databases monitoring section on the cluster page, you can select databases that should be monitored in ADB Control. By default, all databases are selected.


GUC management
In the GUC management section on the cluster page, you can configure values of the GUCs that control ADB Control behavior.
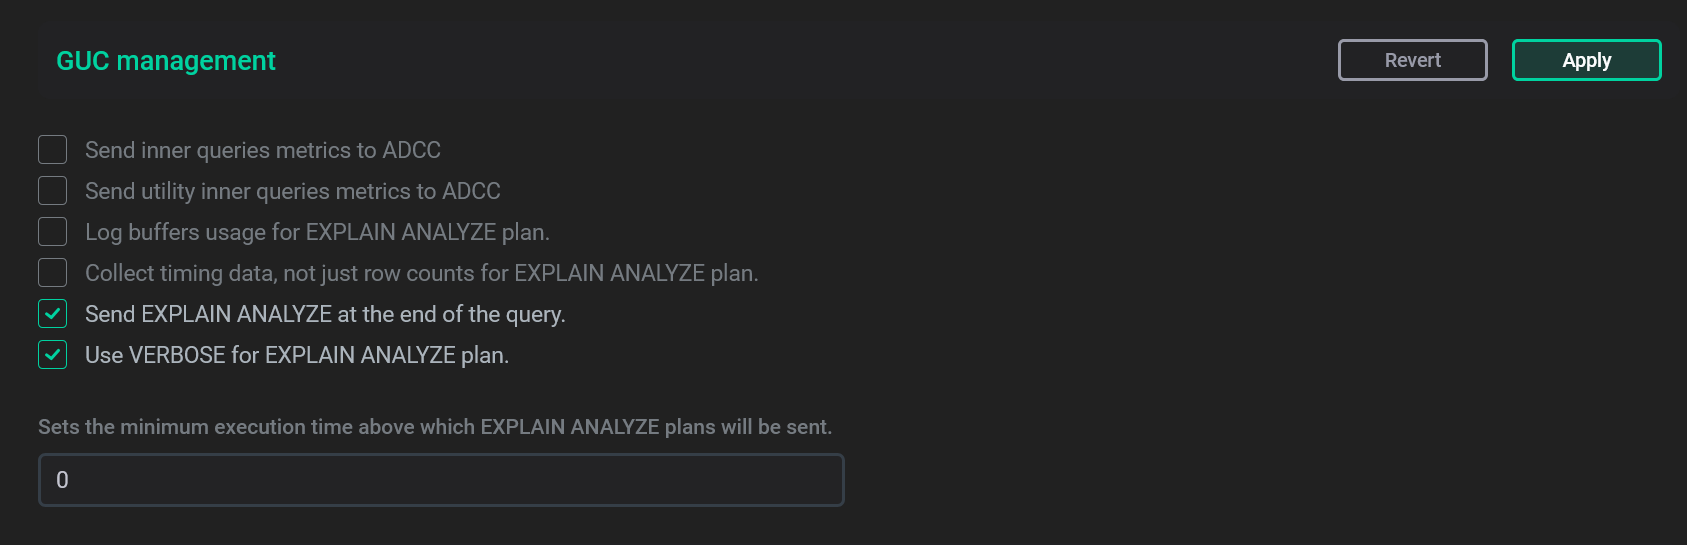
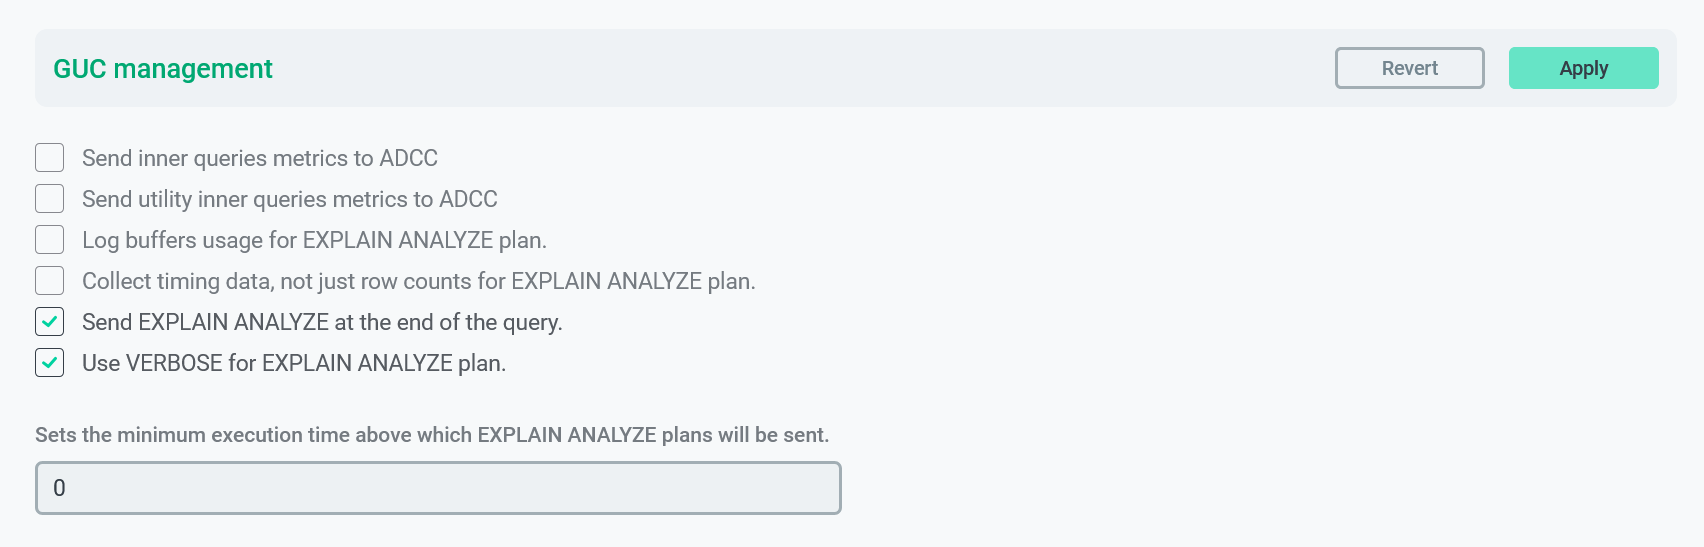
Available GUCs are shown in the table below.
| GUC name | UI name | Description |
|---|---|---|
adcc.monitor_inner_queries |
Send inner queries metrics to ADCC |
Whether inner query monitoring is required for all commands except those listed for |
adcc.monitor_utility_inner_queries |
Send utility inner queries metrics to ADCC |
Whether inner query monitoring is required for utility commands (such as |
adcc.explain_log_buffers |
Log buffers usage for EXPLAIN ANALYZE plan |
Whether to use log buffers for |
adcc.explain_log_timing |
Collect timing data, not just row counts for EXPLAIN ANALYZE plan |
Whether to collect timing data in addition to row counts for |
adcc.explain_log_analyze |
Send EXPLAIN ANALYZE at the end of the query |
Whether to send |
adcc.explain_log_verbose |
Use VERBOSE for EXPLAIN ANALYZE plan |
Whether to use the |
adcc.poll_waits |
GUC to enable/disable waits polling for the ADCC |
Whether the |
adcc.explain_log_min_duration |
Sets the minimum execution time above which EXPLAIN ANALYZE plans will be sent |
Minimum execution time above which plans for the |
Metric offload
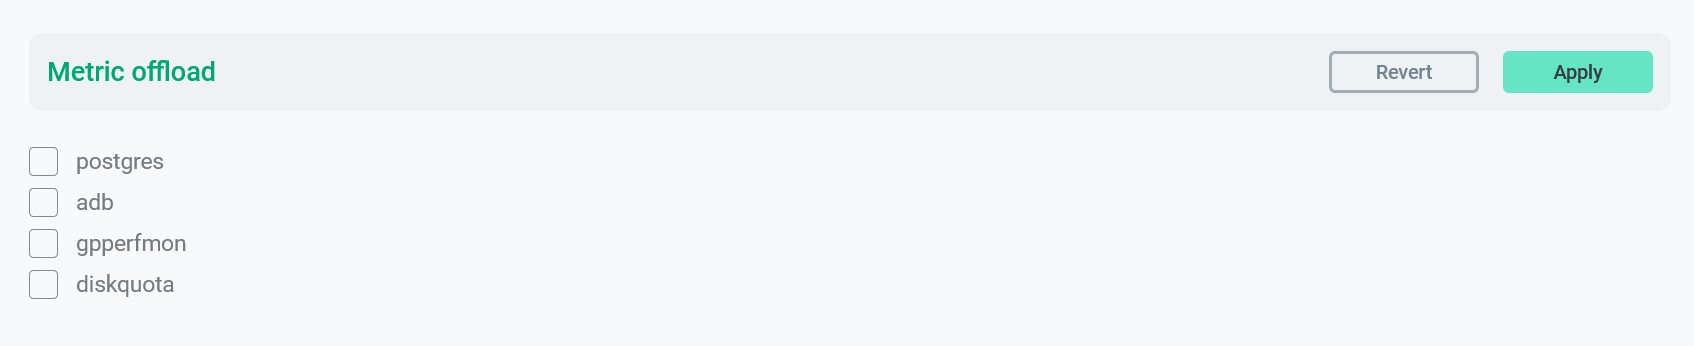
The Metric offload section of the cluster page allows you to select databases, whose metrics will be offloaded to the external analytical database (according to the schedule that is configured on the Configuration → Job policy → Metrics offload page). By default, no database is selected.