
Work with resource groups
The Monitoring → Resource groups page in the ADB Control web interface displays the resource groups that are used in ADB clusters connected to the monitoring system. This page includes two tabs: Statistic and Configuration described below.
Resource group metrics are collected from the connected clusters every minute and are stored in Metrics DB. This is performed by the Save resource group statistic job listed on the Jobs page.
Statistic
The Monitoring → Resource groups → Statistic tab displays the statistics of the resource group usage in the selected ADB cluster. The Last updated field contains date and time of the last data update on the page in the DD/MM/YYYY HH:mm:ss format.
To select an ADB cluster for which you want to display data in the table, use the Cluster filter above the table with a list of resource groups. The default cluster for all such filters is defined in the ADB Control settings.
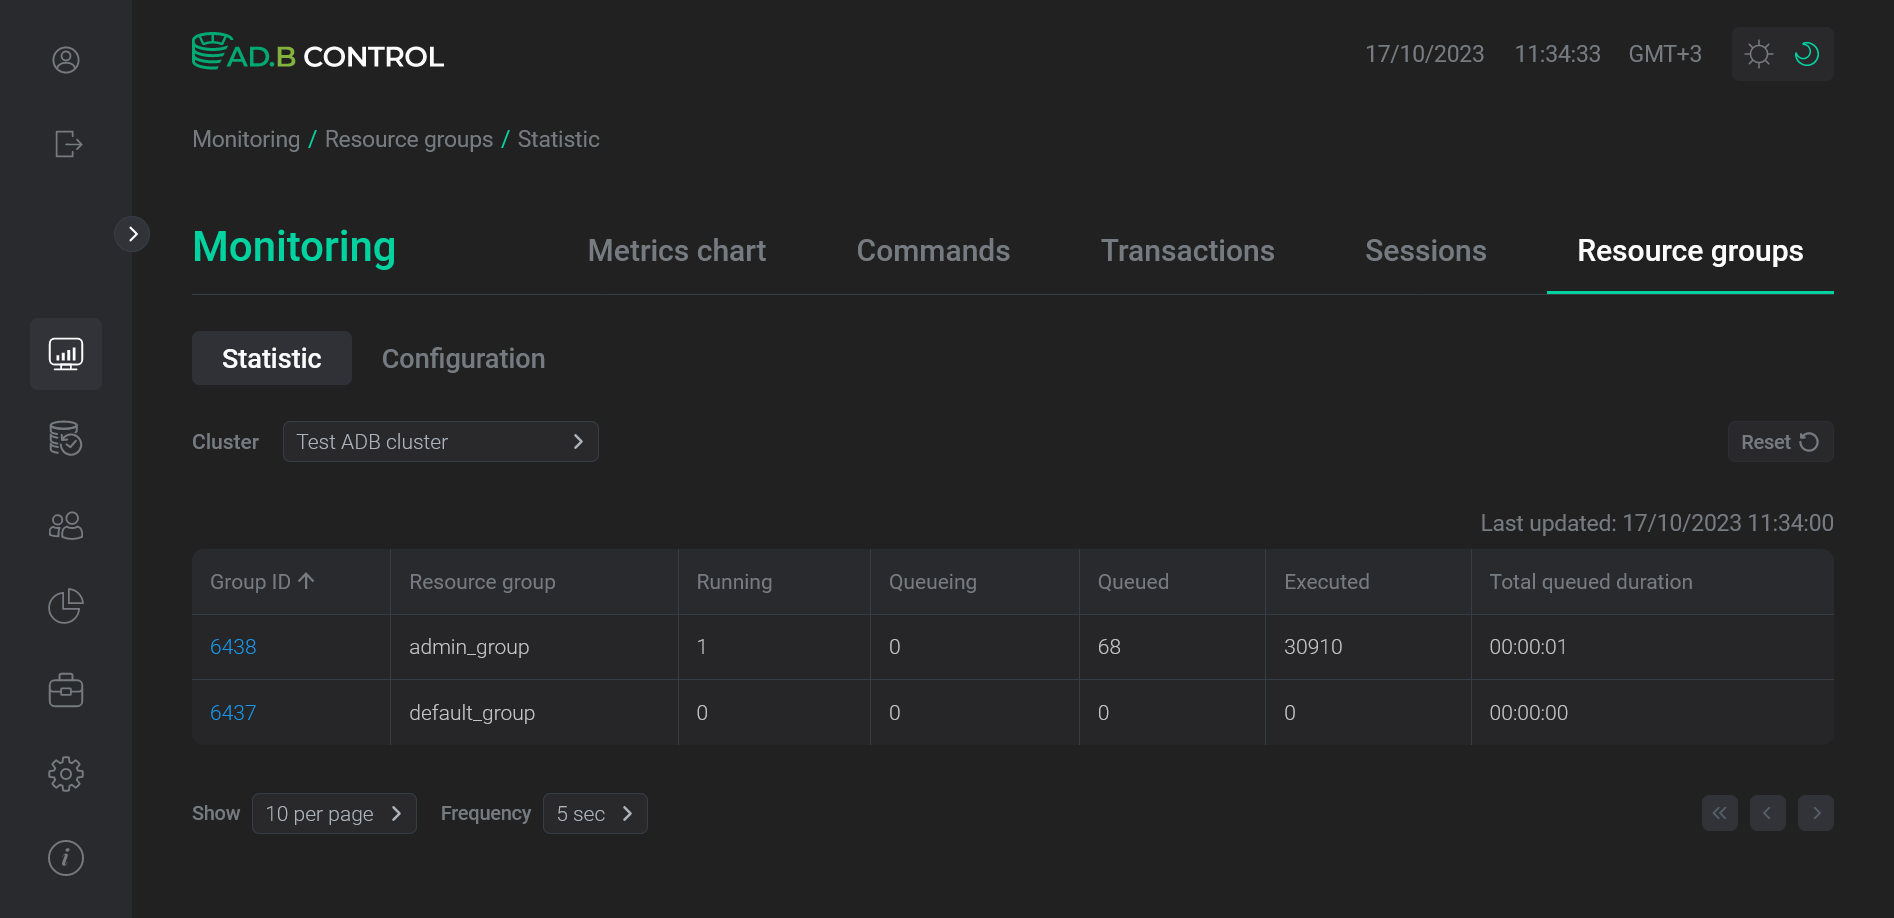
The tab shows a table with the following resource group information.
| Field | Description |
|---|---|
Group ID |
A unique resource group identifier |
Resource group |
A resource group name |
Running |
A number of transactions currently running within the current resource group |
Queueing |
A number of transactions currently queued within the current resource group |
Queued |
A total number of transactions queued within the current resource group over the entire observation period |
Executed |
A total number of transactions executed within the current resource group over the entire observation period |
Total queued duration |
The total time that all transactions were queued within the current resource group over the entire observation period (in hours, minutes, seconds) |
Configuration
List of resource groups
The Monitoring → Resource groups → Configuration tab displays the current configurations of existing resource groups.
To select an ADB cluster for which you want to display data in the table, use the Cluster filter above the table with a list of resource groups. The default cluster for all such filters is defined in the ADB Control settings.
The configuration parameters for resource groups differ between ADB 6 and ADB 7. The set of parameters available on this tab depends on the version of the selected ADB cluster.
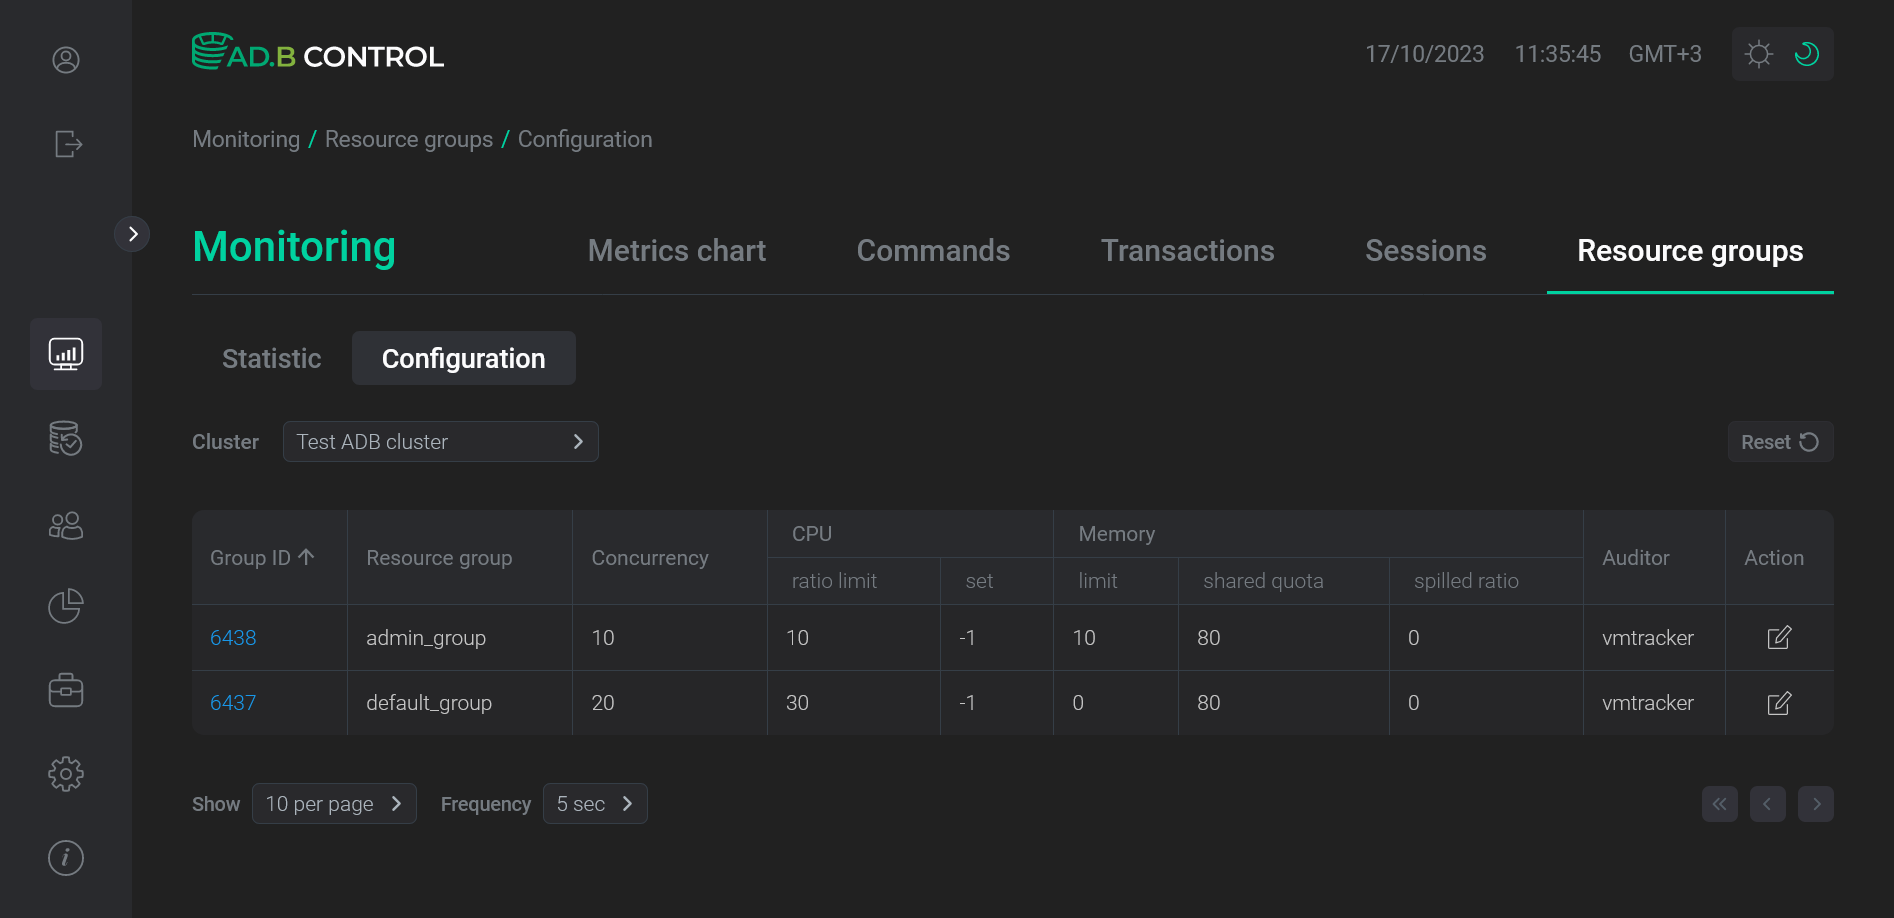
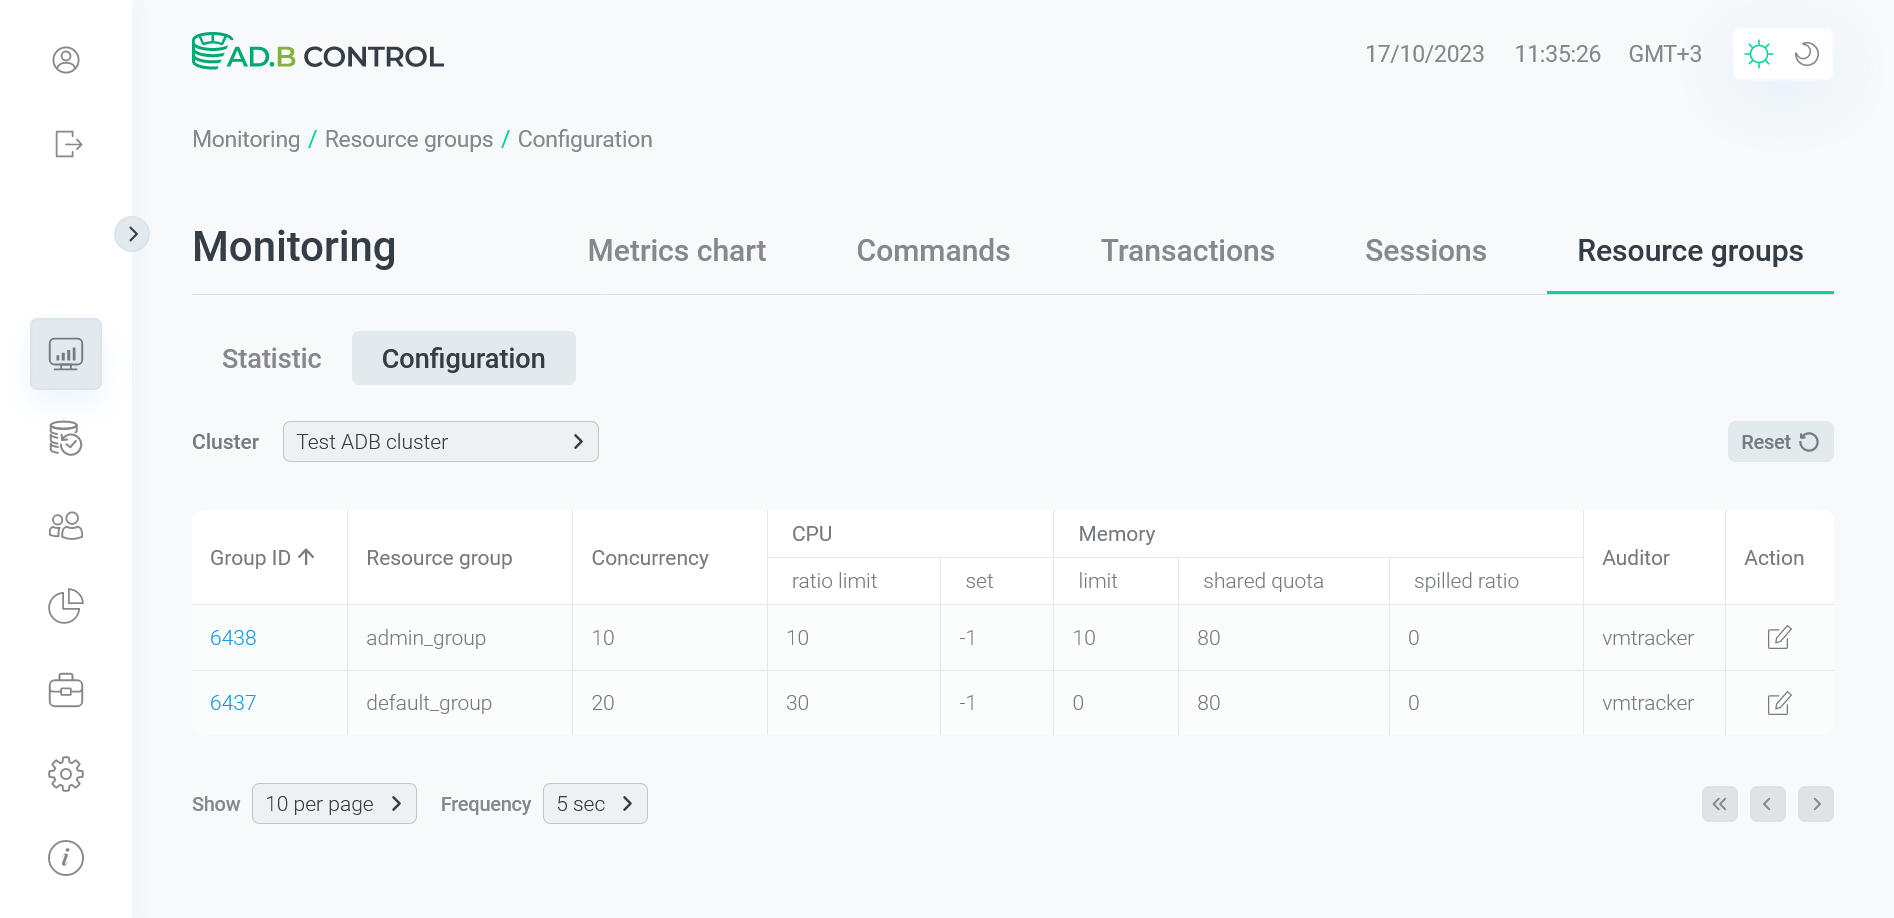
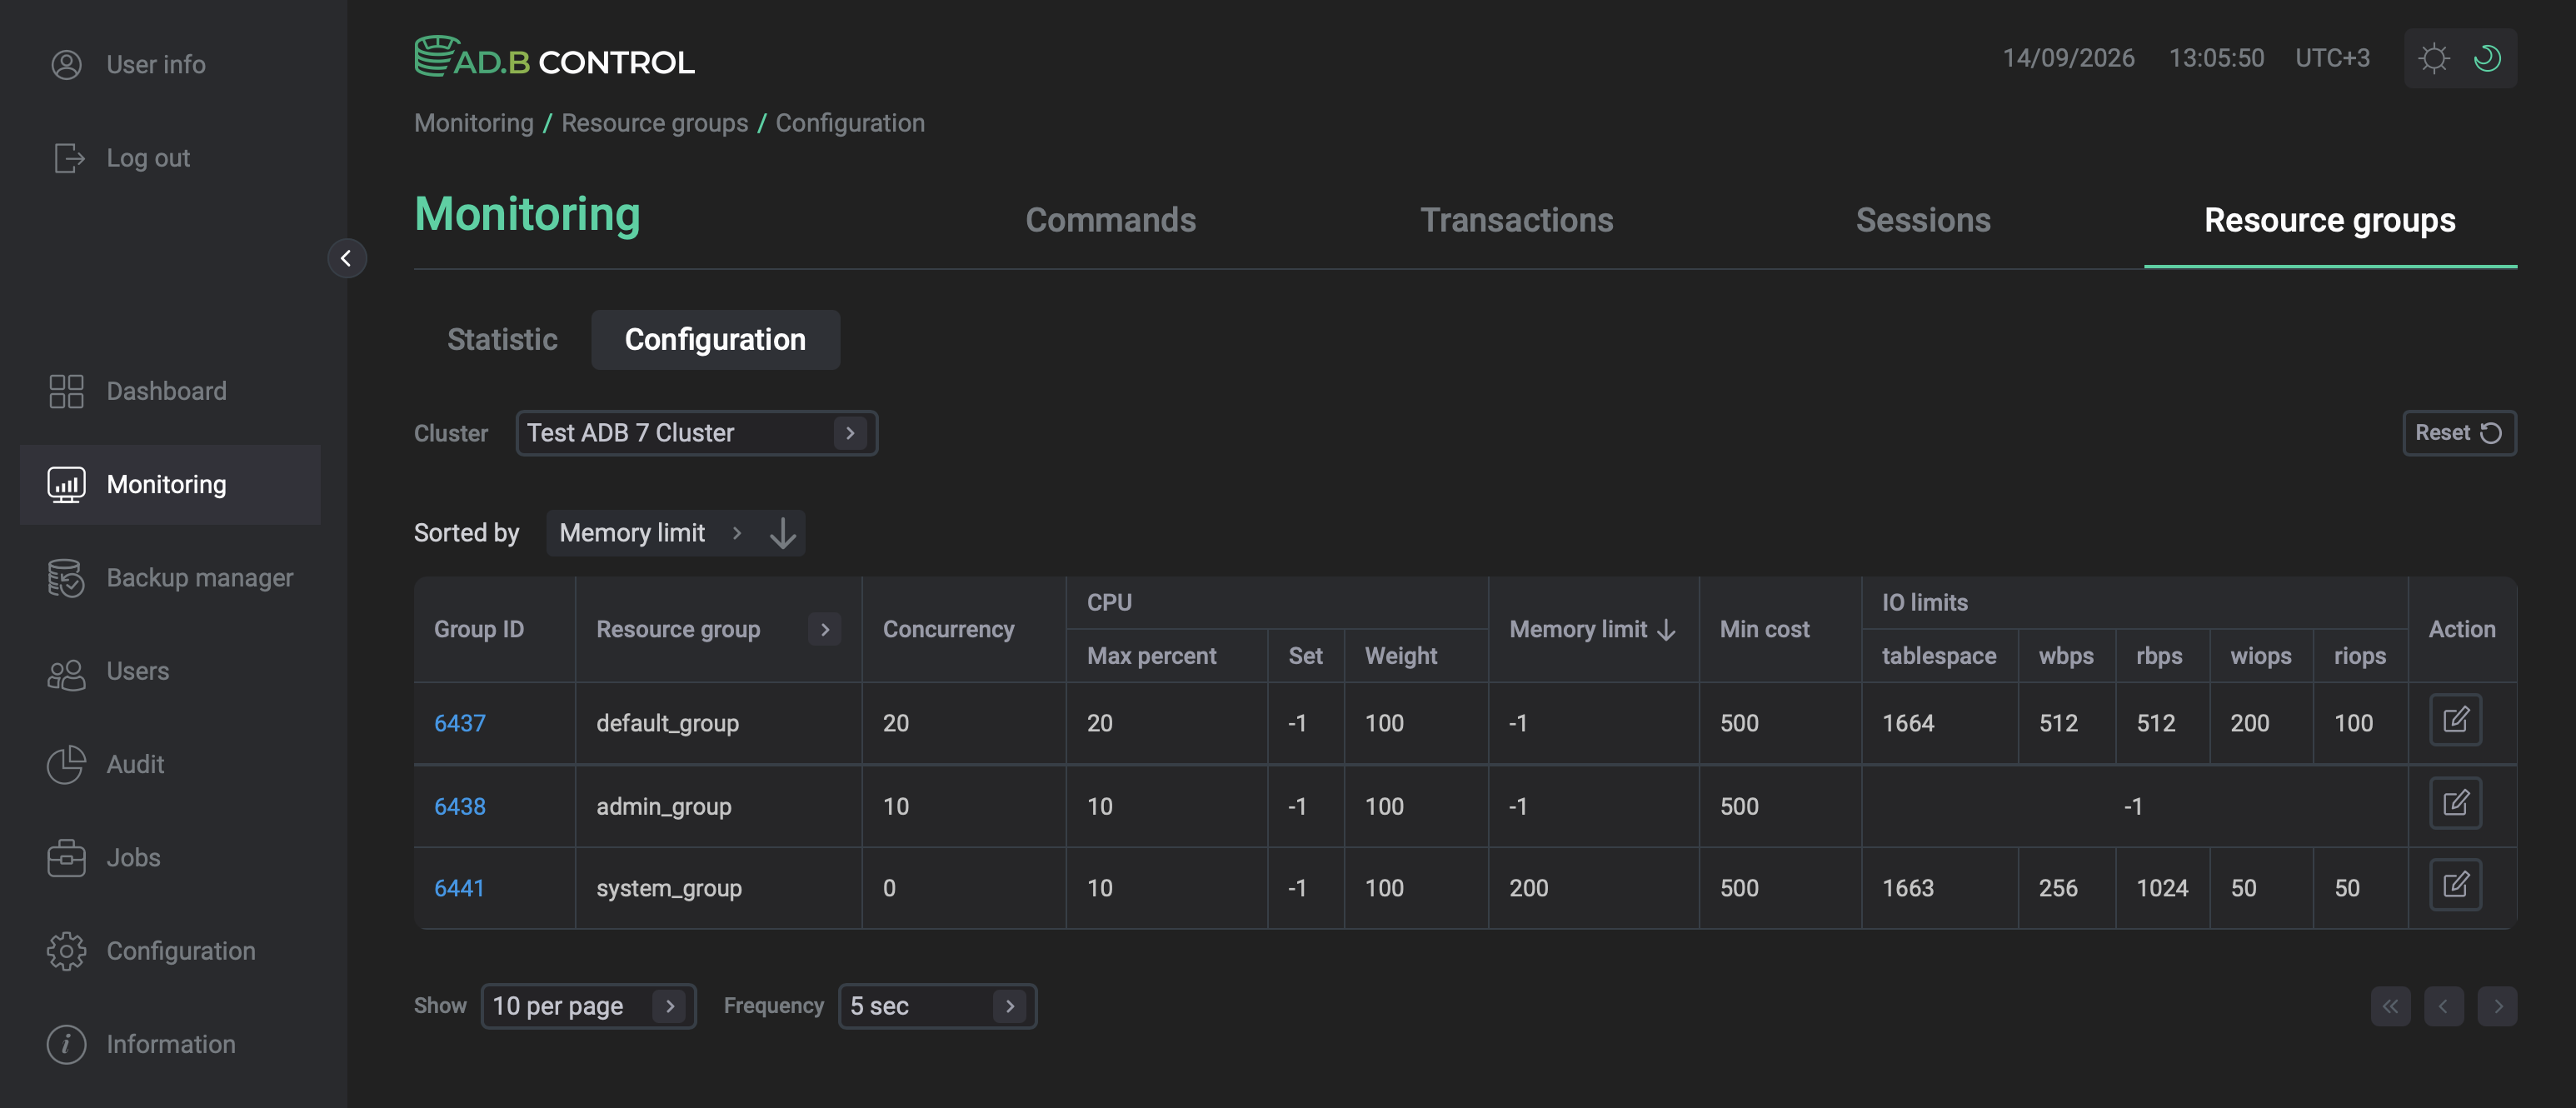
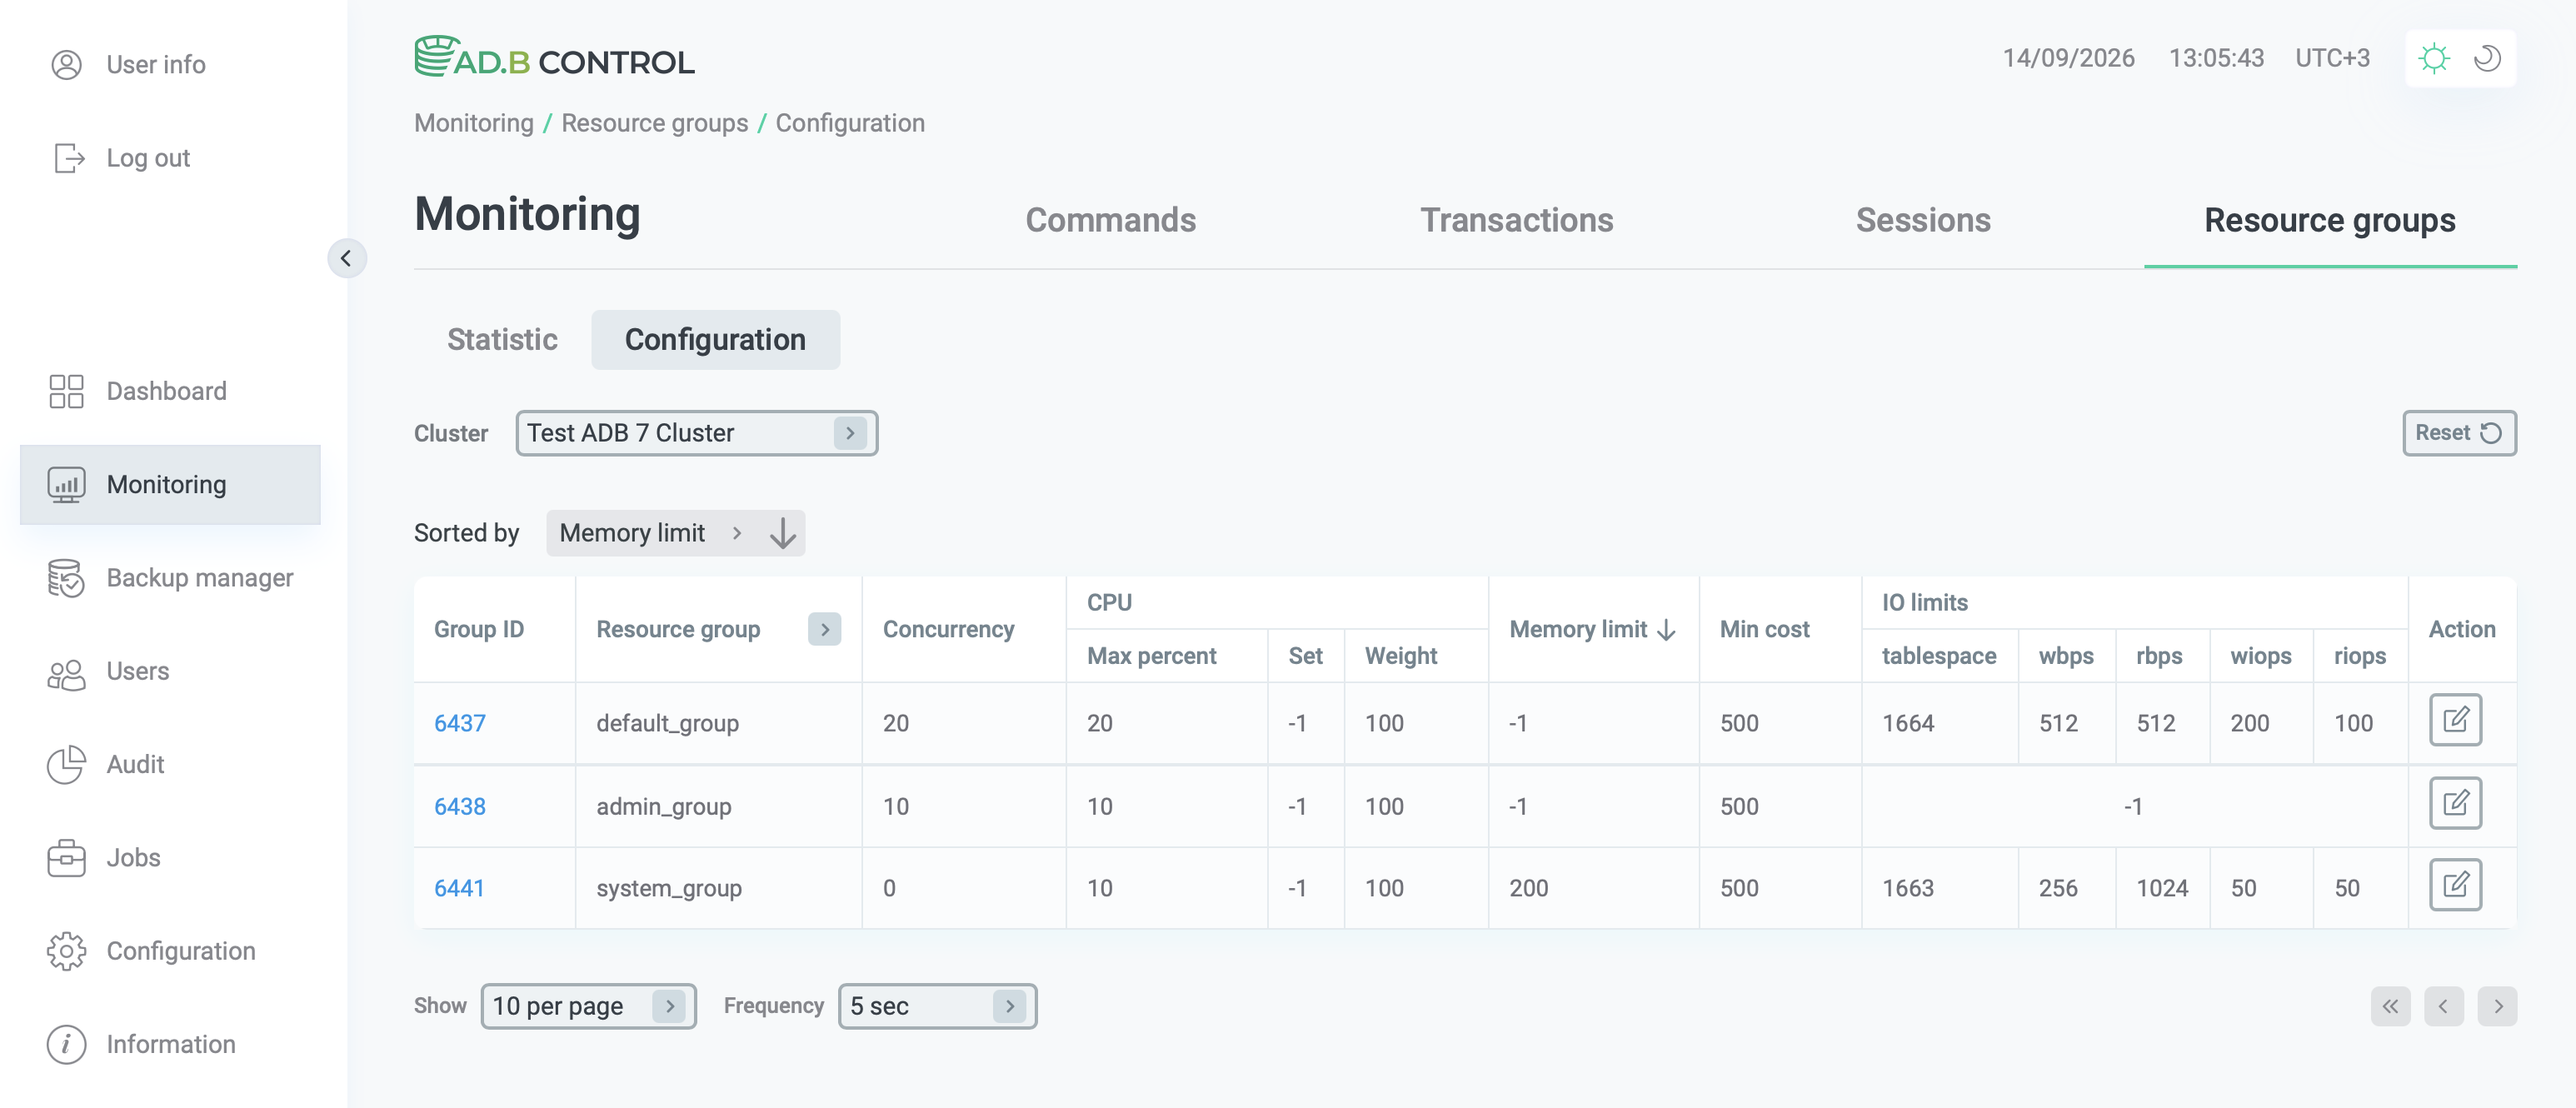
The table below describes the attributes available on this tab.
It indicates whether each parameter is available in ADB 6 and ADB 7 and shows its corresponding name in gp_toolkit.gp_resgroup_config.
| Field | Description | ADB 6 | ADB 7 |
|---|---|---|---|
Group ID |
A unique resource group identifier |
groupid |
|
Resource group |
A resource group name |
groupname |
|
Concurrency |
The maximum number of concurrent transactions that are permitted within the resource group. If the limit is reached, new commands will be queued |
concurrency |
|
CPU ratio limit |
The percentage of the reserved CPU resources of the entire cluster (specified in the |
cpu_rate_limit |
N/A |
CPU Max percent |
The maximum percentage of the server CPU resources available to the group. The parameter is not compatible with CPU set |
N/A |
cpu_max_percent |
CPU set |
The CPU cores that are reserved for the resource group on the master and segment hosts. If the parameter is set, all SQL commands within the resource group will only use the specified cores. If the resource group does not use cores, they will be idle |
cpuset The parameter is not compatible with CPU ratio limit — fill only one of two parameters.
The |
cpuset The parameter is not compatible with CPU Max percent — fill only one of two parameters.
The |
CPU Weight |
The priority of access to CPU resources for the group when CPU Max percent is used |
N/A |
cpu_weight |
Memory limit |
RAM limit assigned to the group |
memory_limit Relative value as the percentage of the RAM resources allocated to resource groups (specified in gp_resource_group_memory_limit parameter).
The sum of these limits for all resource groups should not exceed |
memory_limit Absolute value in megabytes |
Memory shared quota |
The percentage of the reserved RAM resources of the resource group to be shared between all transactions running within that group. The amount of memory equal to |
memory_shared_quota |
N/A |
Memory spilled ratio |
The memory usage threshold for memory-intensive transactions. When a transaction reaches the specified threshold, spill files are created |
memory_spill_ratio |
N/A |
Auditor |
The memory auditor that is used for the resource group.
The default value is |
memory_auditor |
N/A |
Min cost |
The estimated cost threshold for queries that are considered lightweight. Queries with a cost below this value are executed immediately, bypassing group limit checks |
N/A |
min_cost |
IO limits |
The maximum disk I/O throughput available to queries in the resource group. The column contains the following information:
If no limits are configured for a resource group, the column displays |
N/A |
io_limit |
|
NOTE
|
Edit a resource group configuration
To edit the resource group configuration, follow the steps:
-
In the ADB cluster for which you plan to modify the resource group settings, assign the super-user rights to the role that is used in the JDBC connection to that cluster. The user is defined on the Configuration → Clusters page (by default
adcc). To set super-user rights, run the following query:ALTER ROLE adcc SUPERUSER;Skipping the first step will cause the following error in step 4.
 The error that occurs for non super-users
 The error that occurs for non super-users
 -
Click the

 icon in the Action column on the Monitoring → Resource groups → Configuration tab.
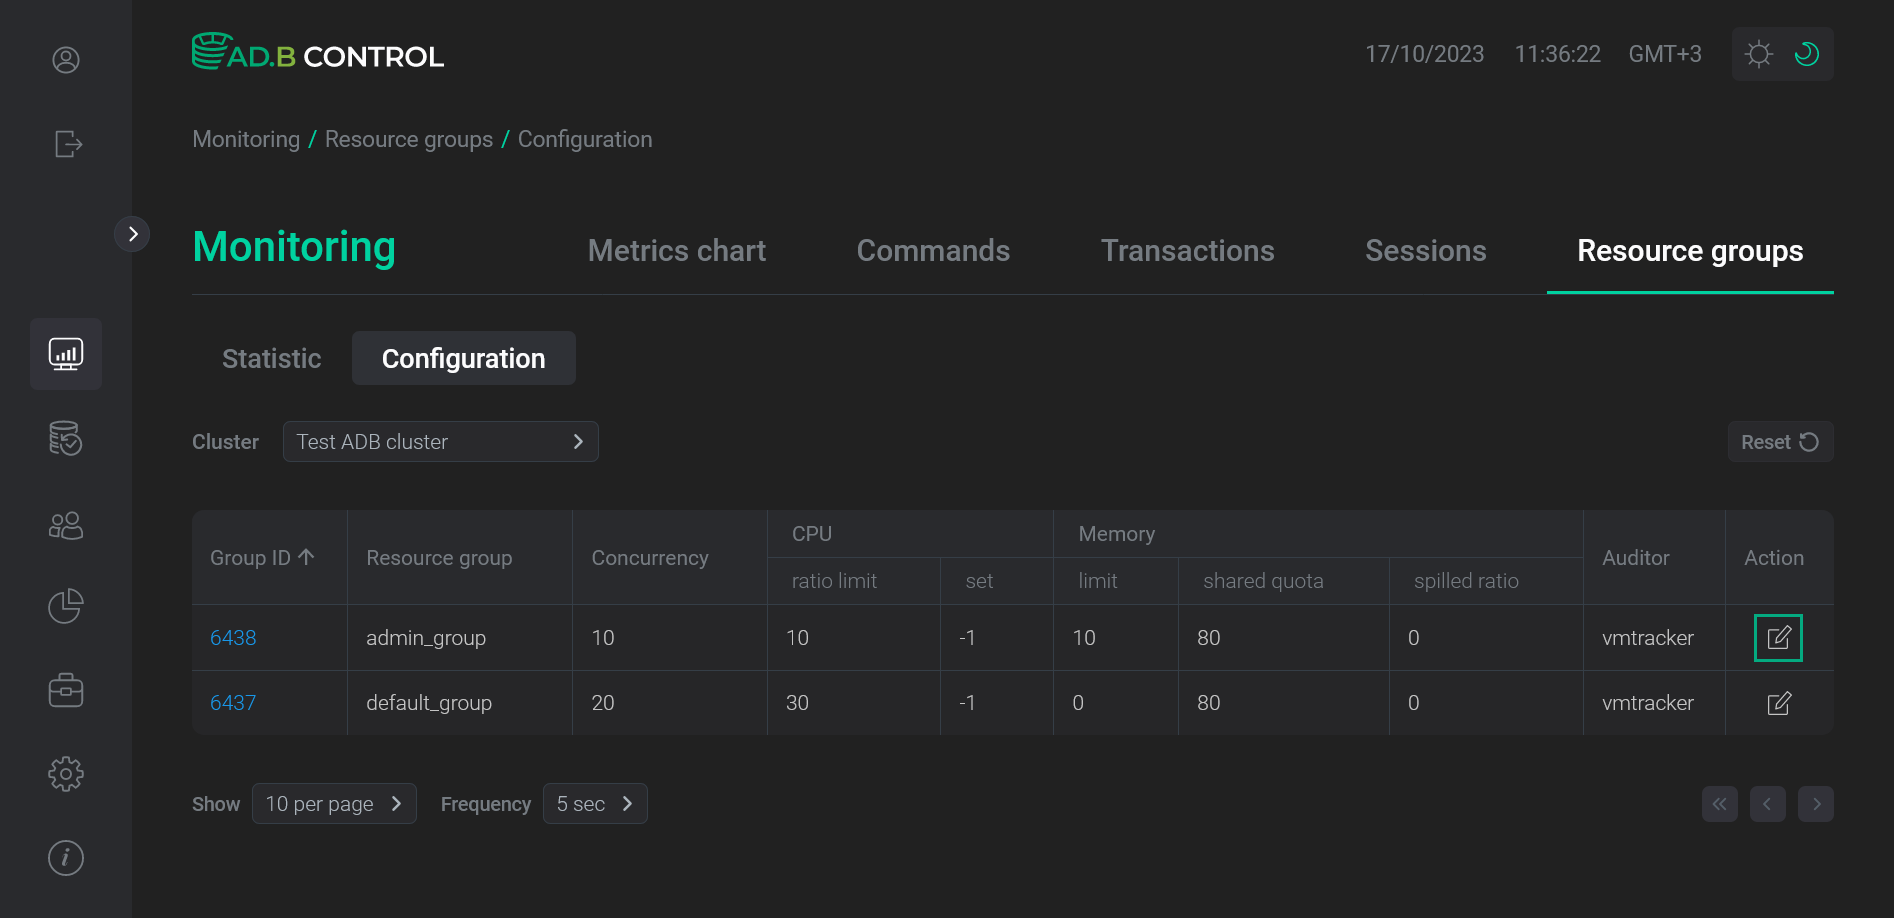 Switch to editing a resource group configuration
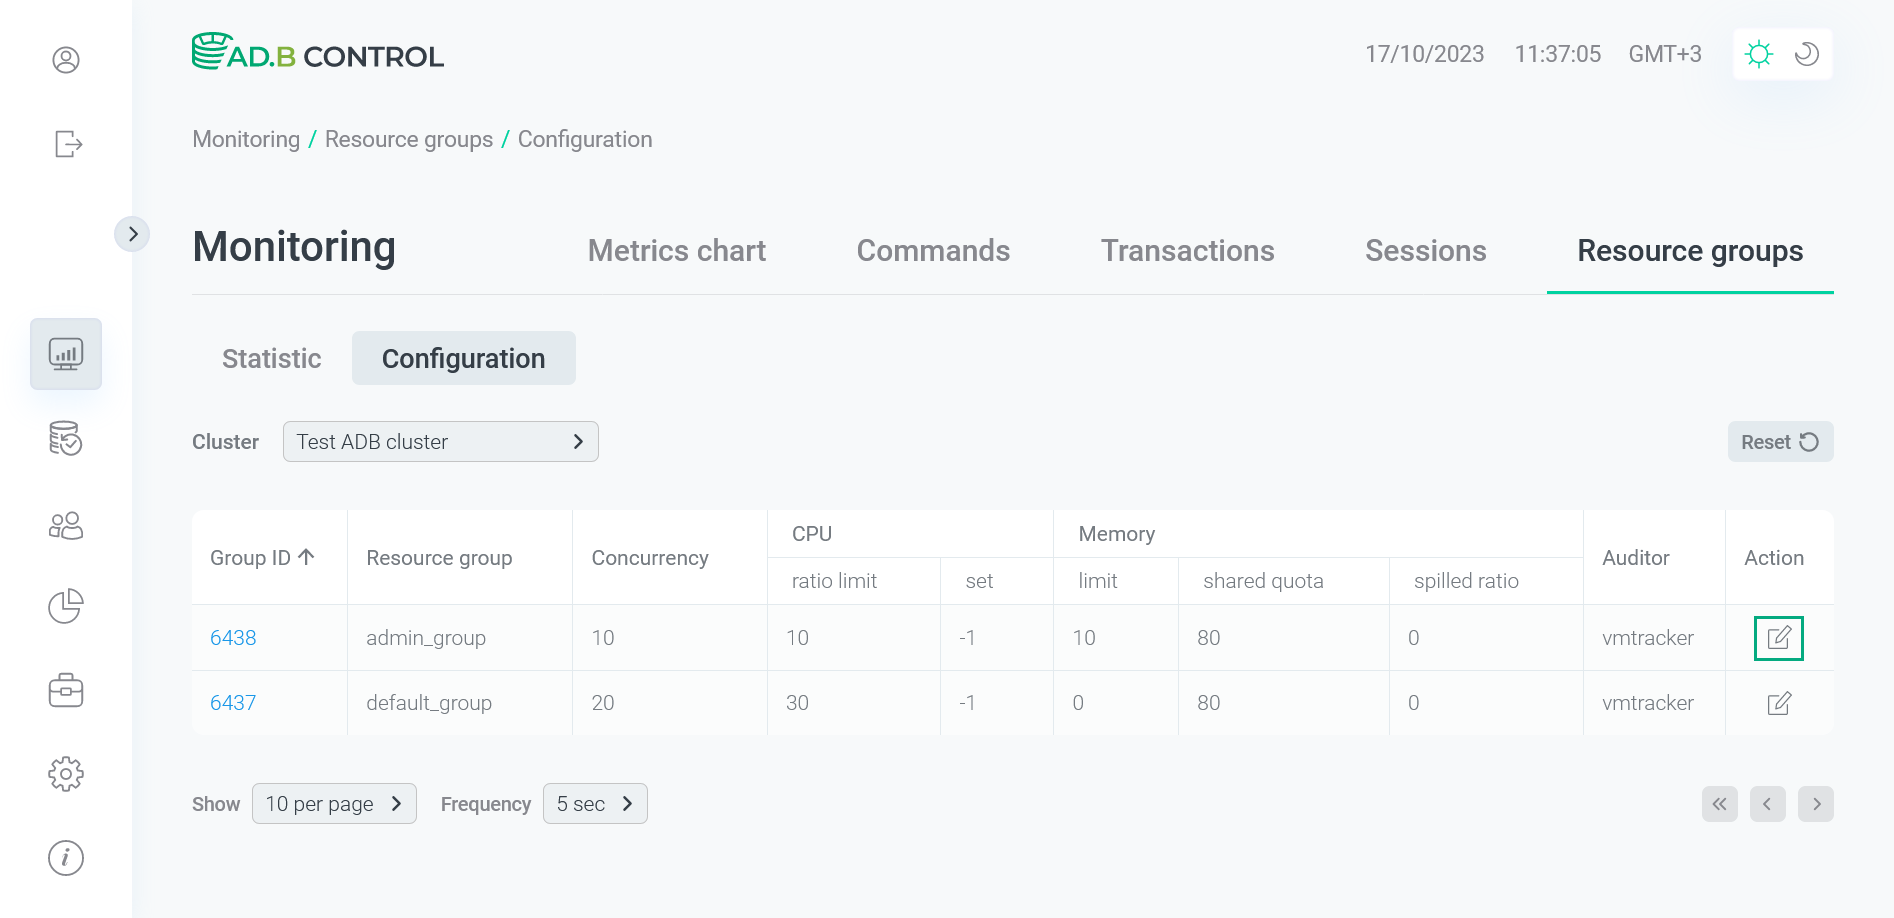 Switch to editing a resource group configuration
 -
In the window that opens, edit necessary data. Descriptions of all fields are available above. An auditor name in the Memory auditor field value cannot be changed.
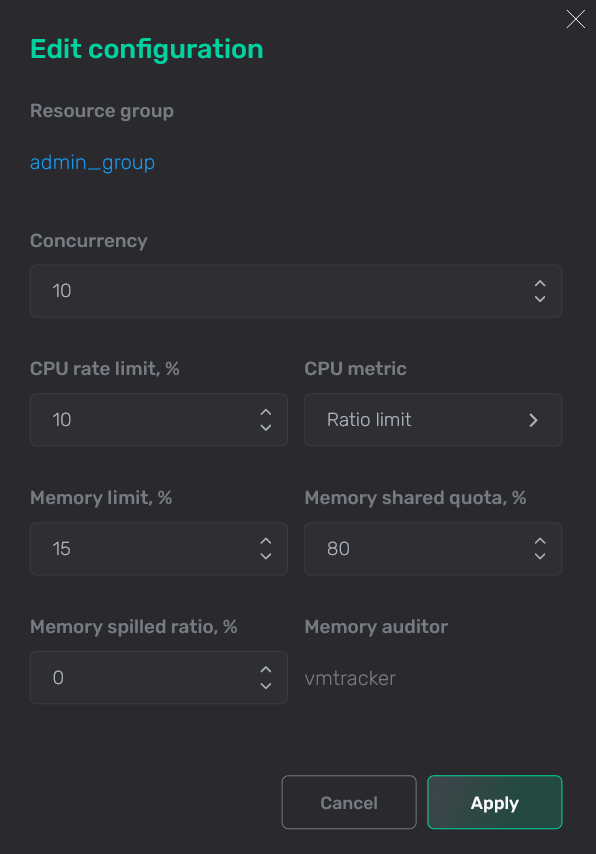 Edit the resource group in ADB 6
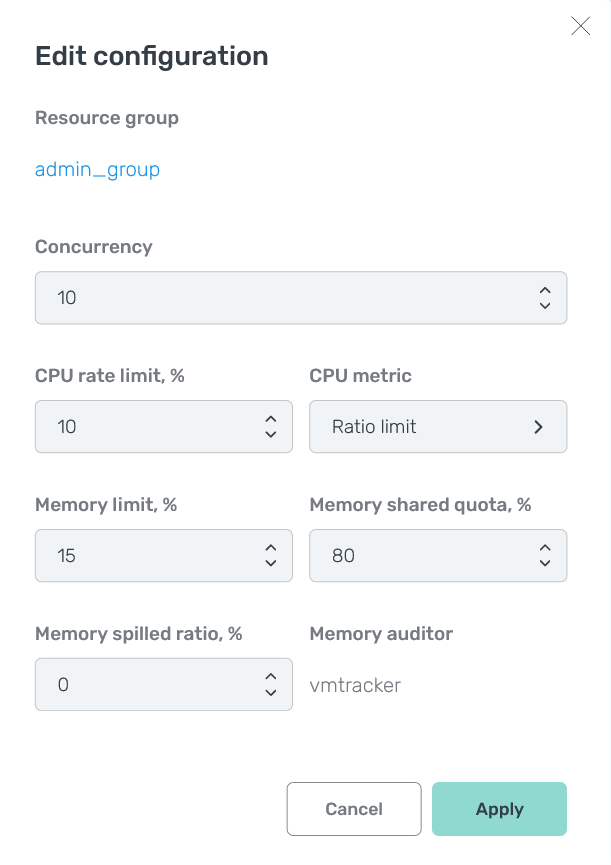 Edit the resource group in ADB 6
If the selected ADB cluster is version 7, the set of resource group parameters differs (see above). Additionally, in ADB 7 you can set limits for the disk I/O throughput and the number of read/write I/O operations. In the Tablespace field, specify the name or OID of a tablespace to which you want to apply the limits or enter
*to apply it to all tablespaces. If a limit value is not specified, it defaults tomaxmeaning no limit is enforced.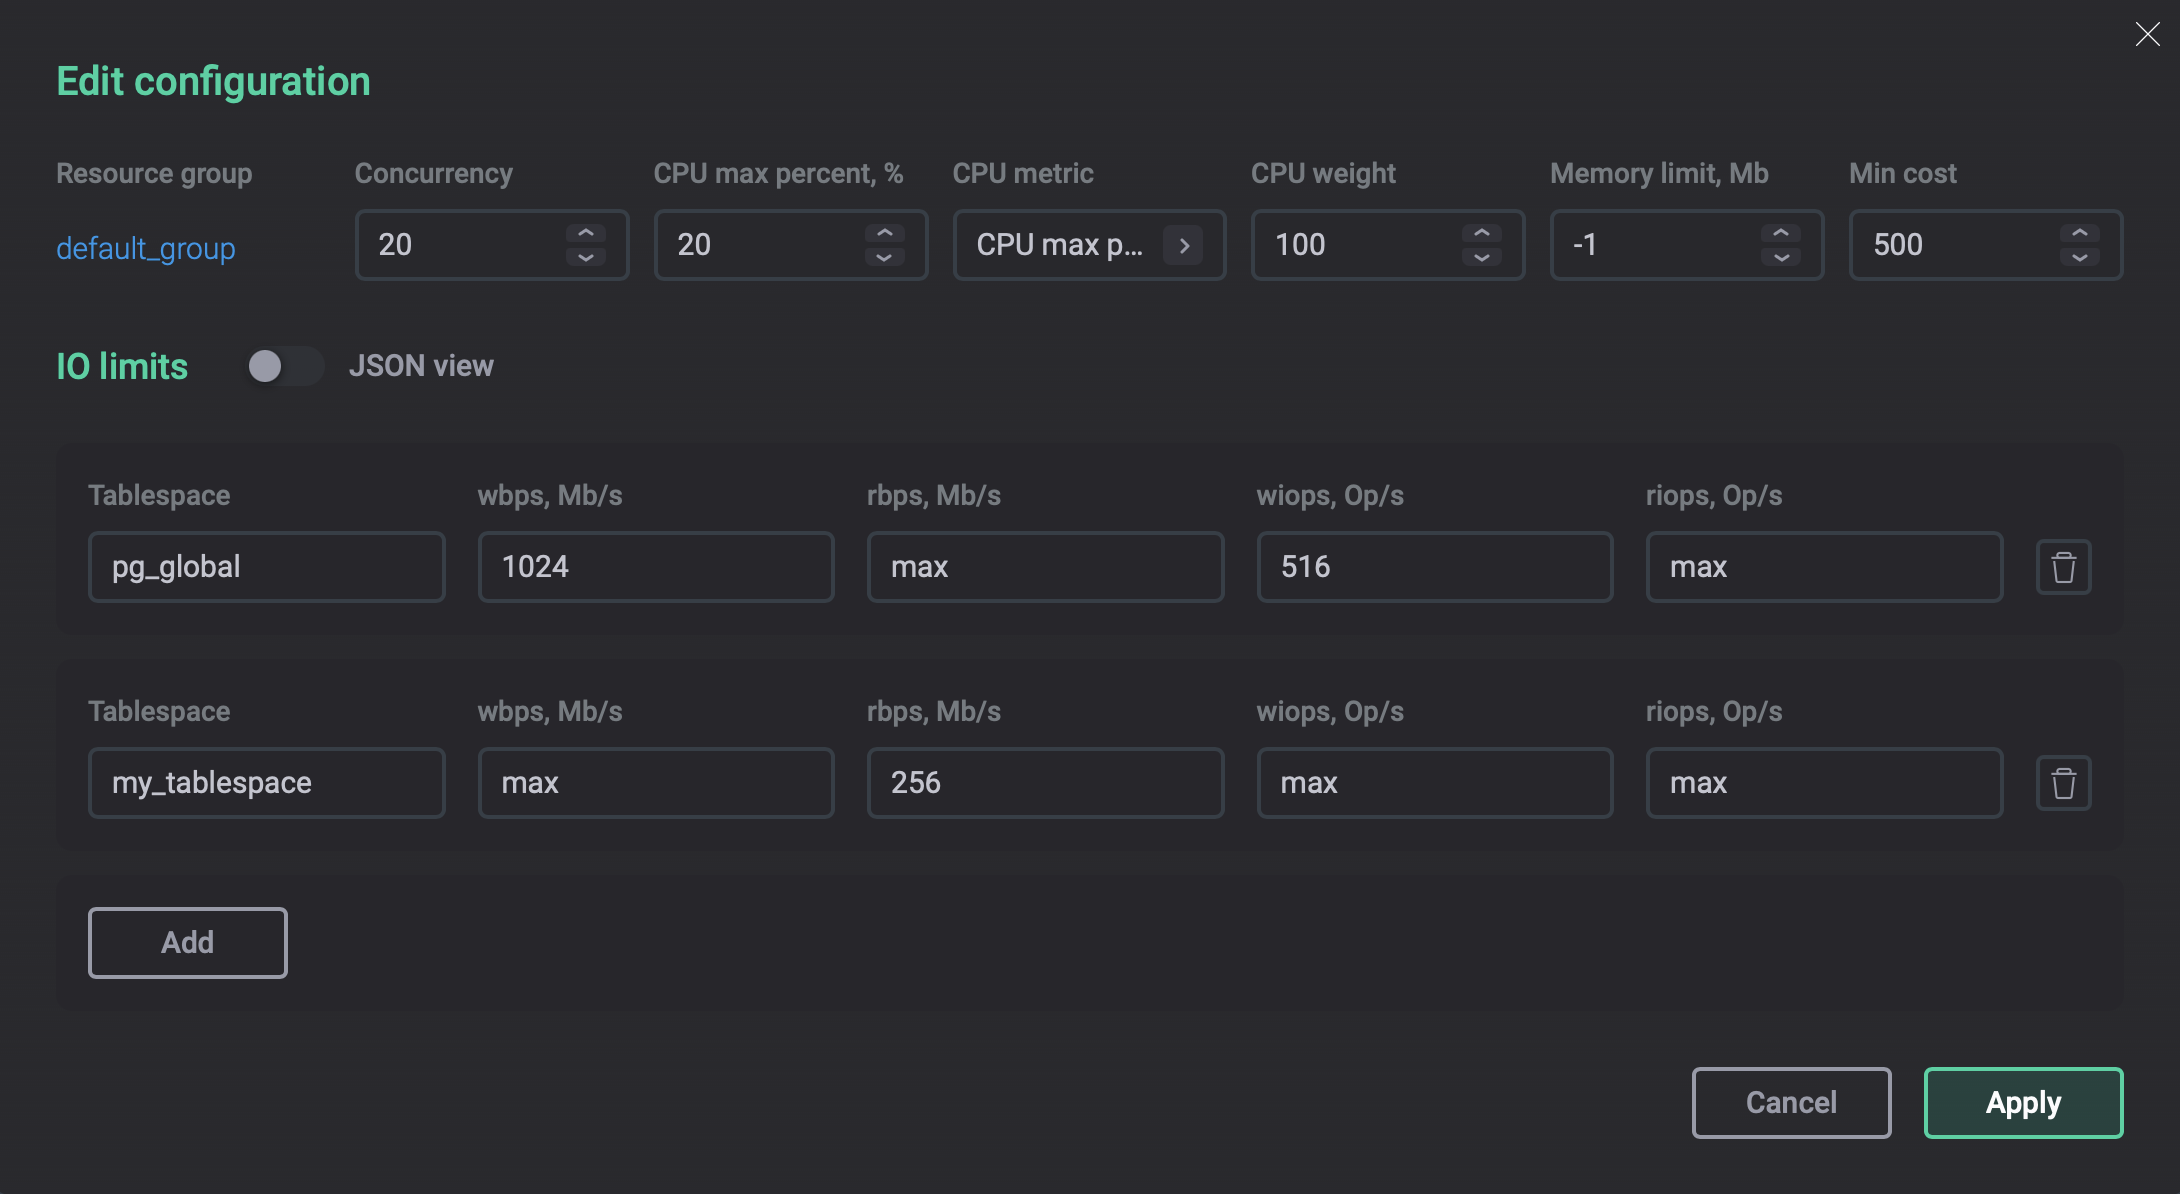 Edit the resource group in ADB 7
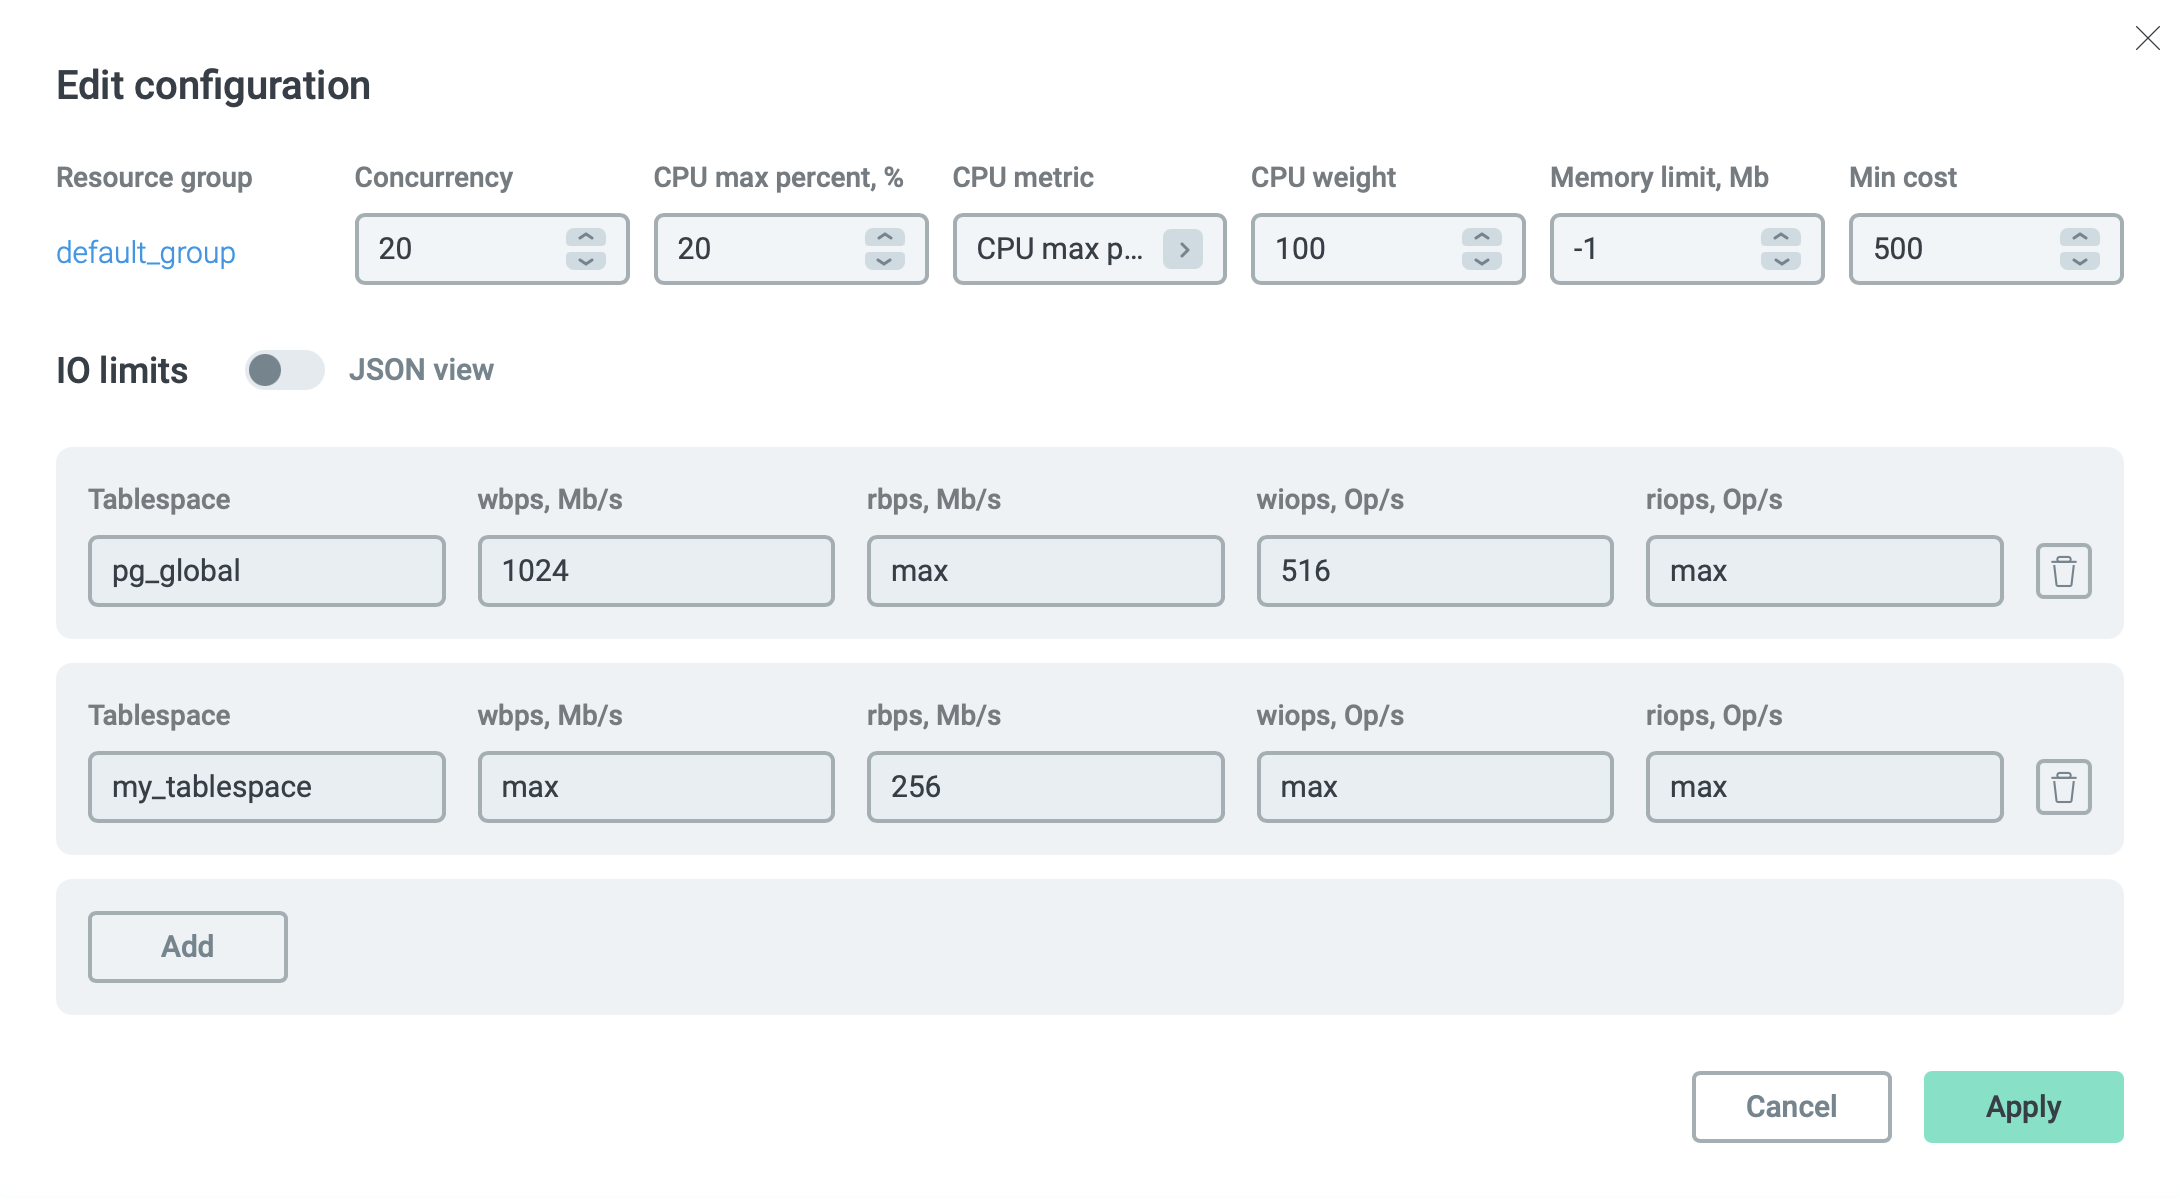 Edit the resource group in ADB 7
 -
Click Apply. As a result, the resource group data is updated on the Monitoring → Resource groups → Configuration tab.
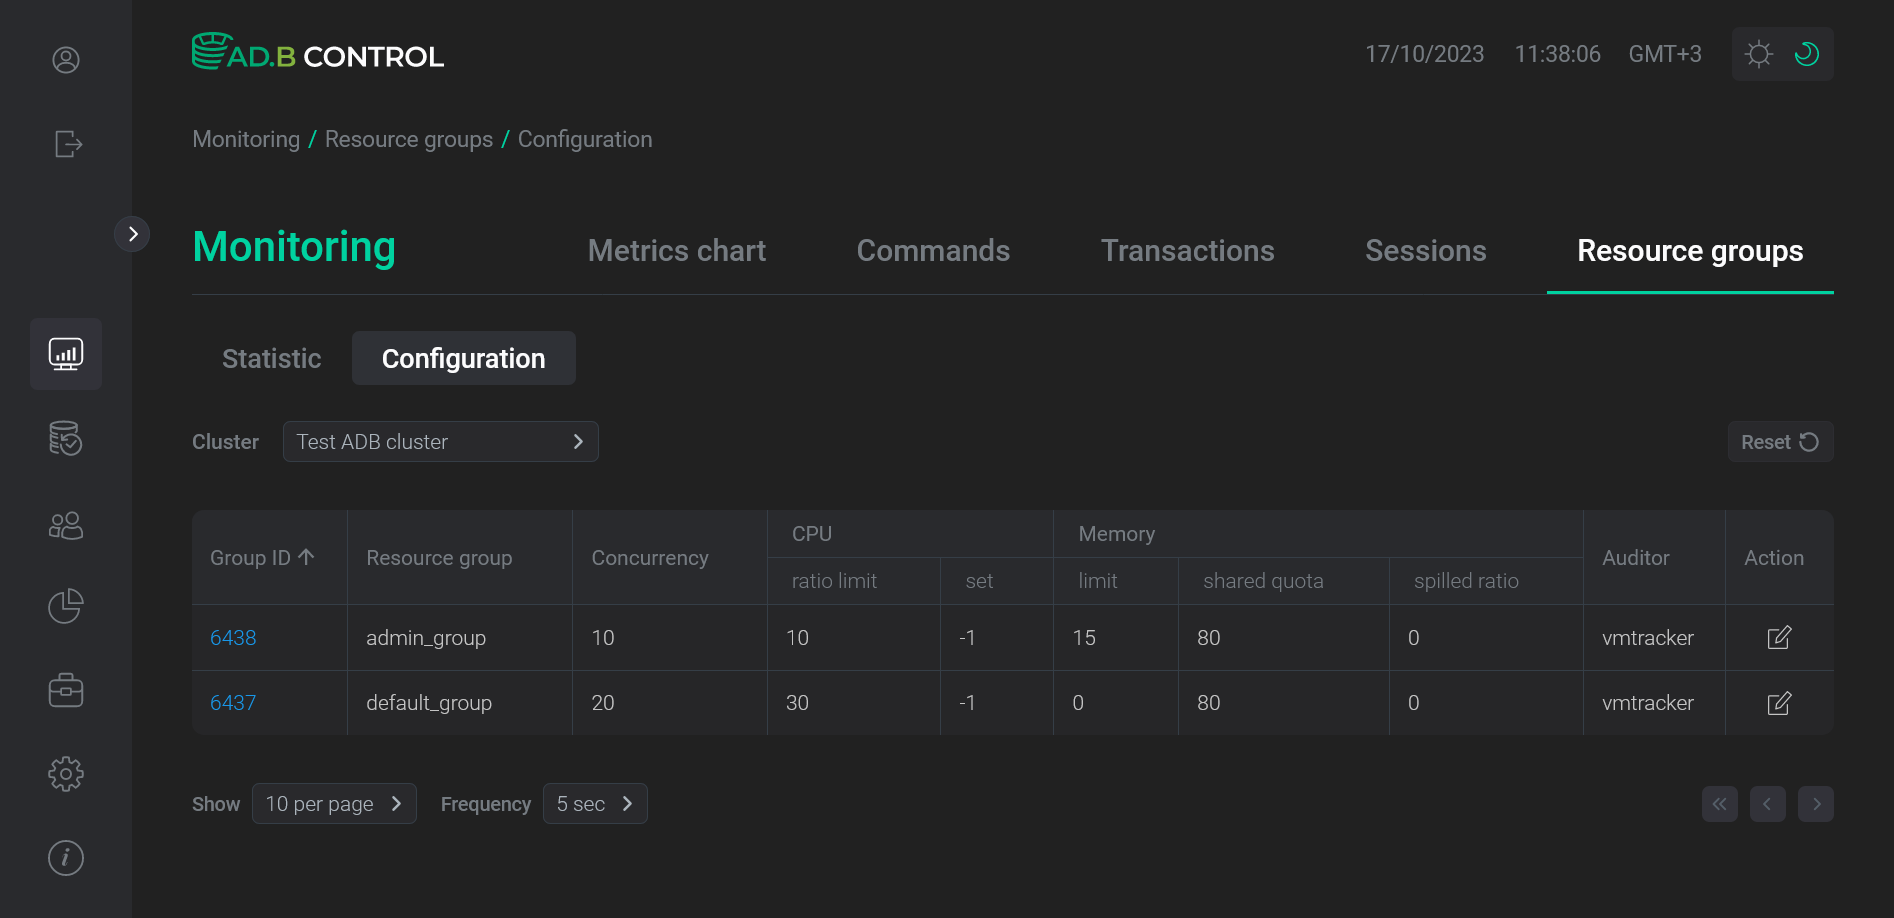 The resource group data is updated
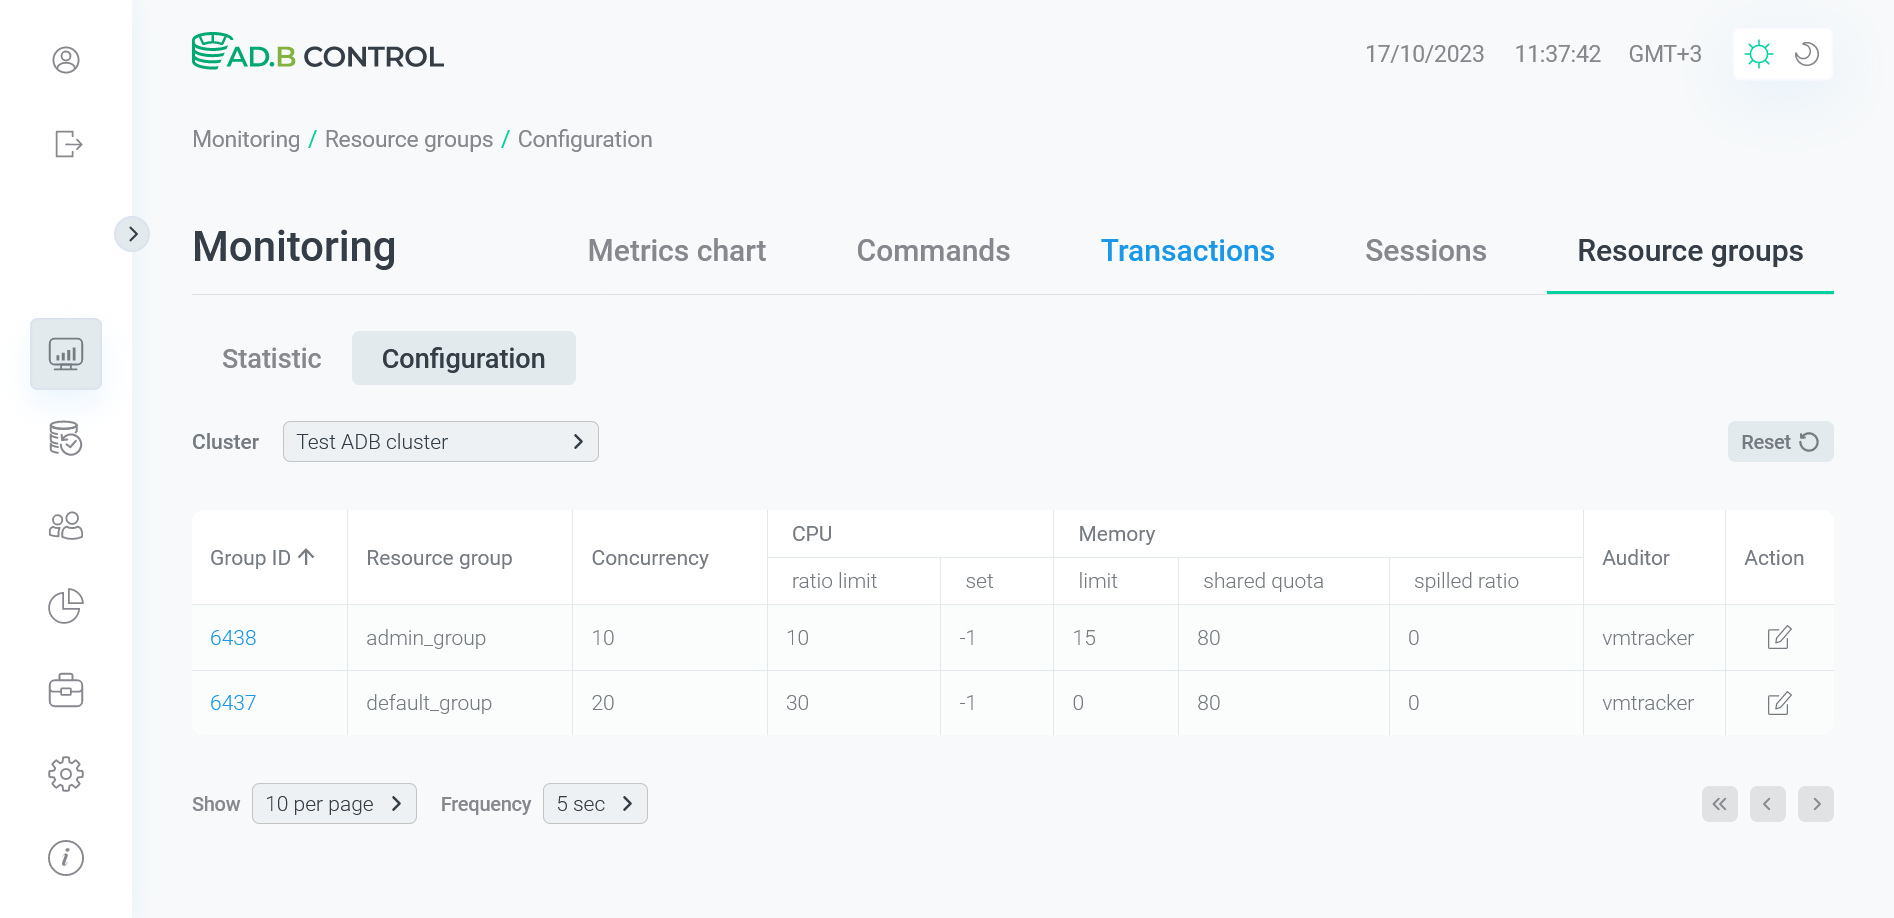 The resource group data is updated
|
IMPORTANT
|
Resource group details
To view the resource group details, click the group identifier (Group ID) in the table on the Monitoring → Resource groups → Statistic or Monitoring → Resource groups → Configuration tab.
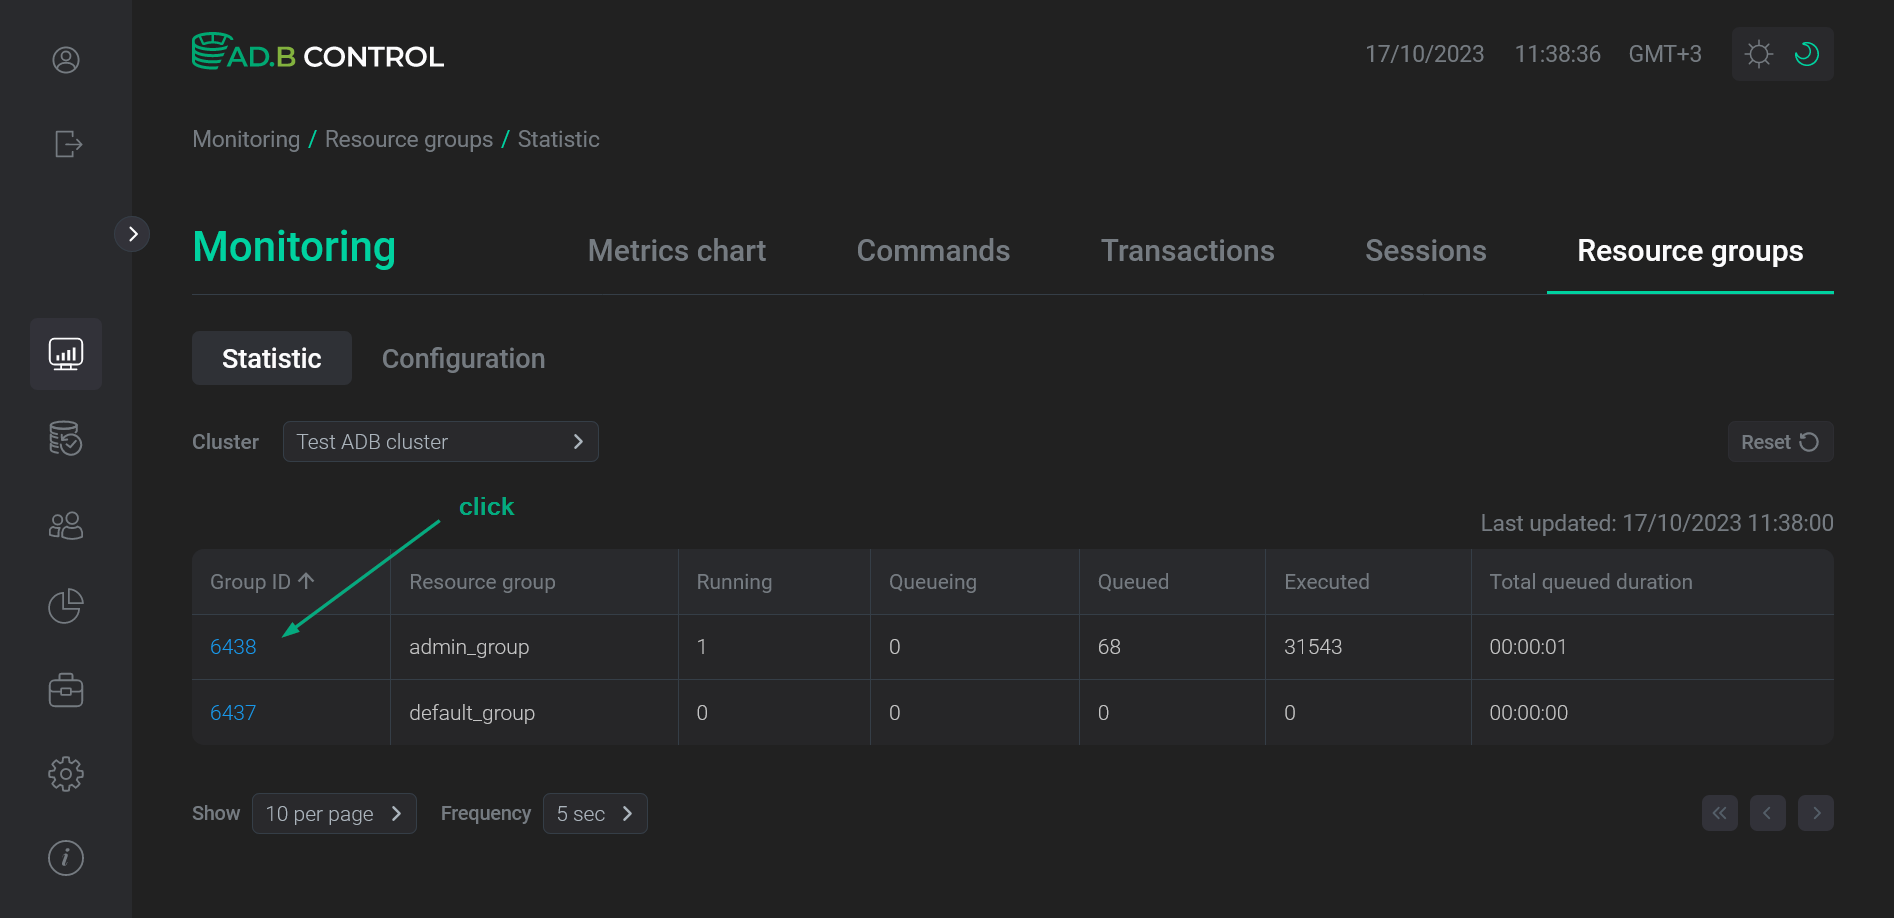
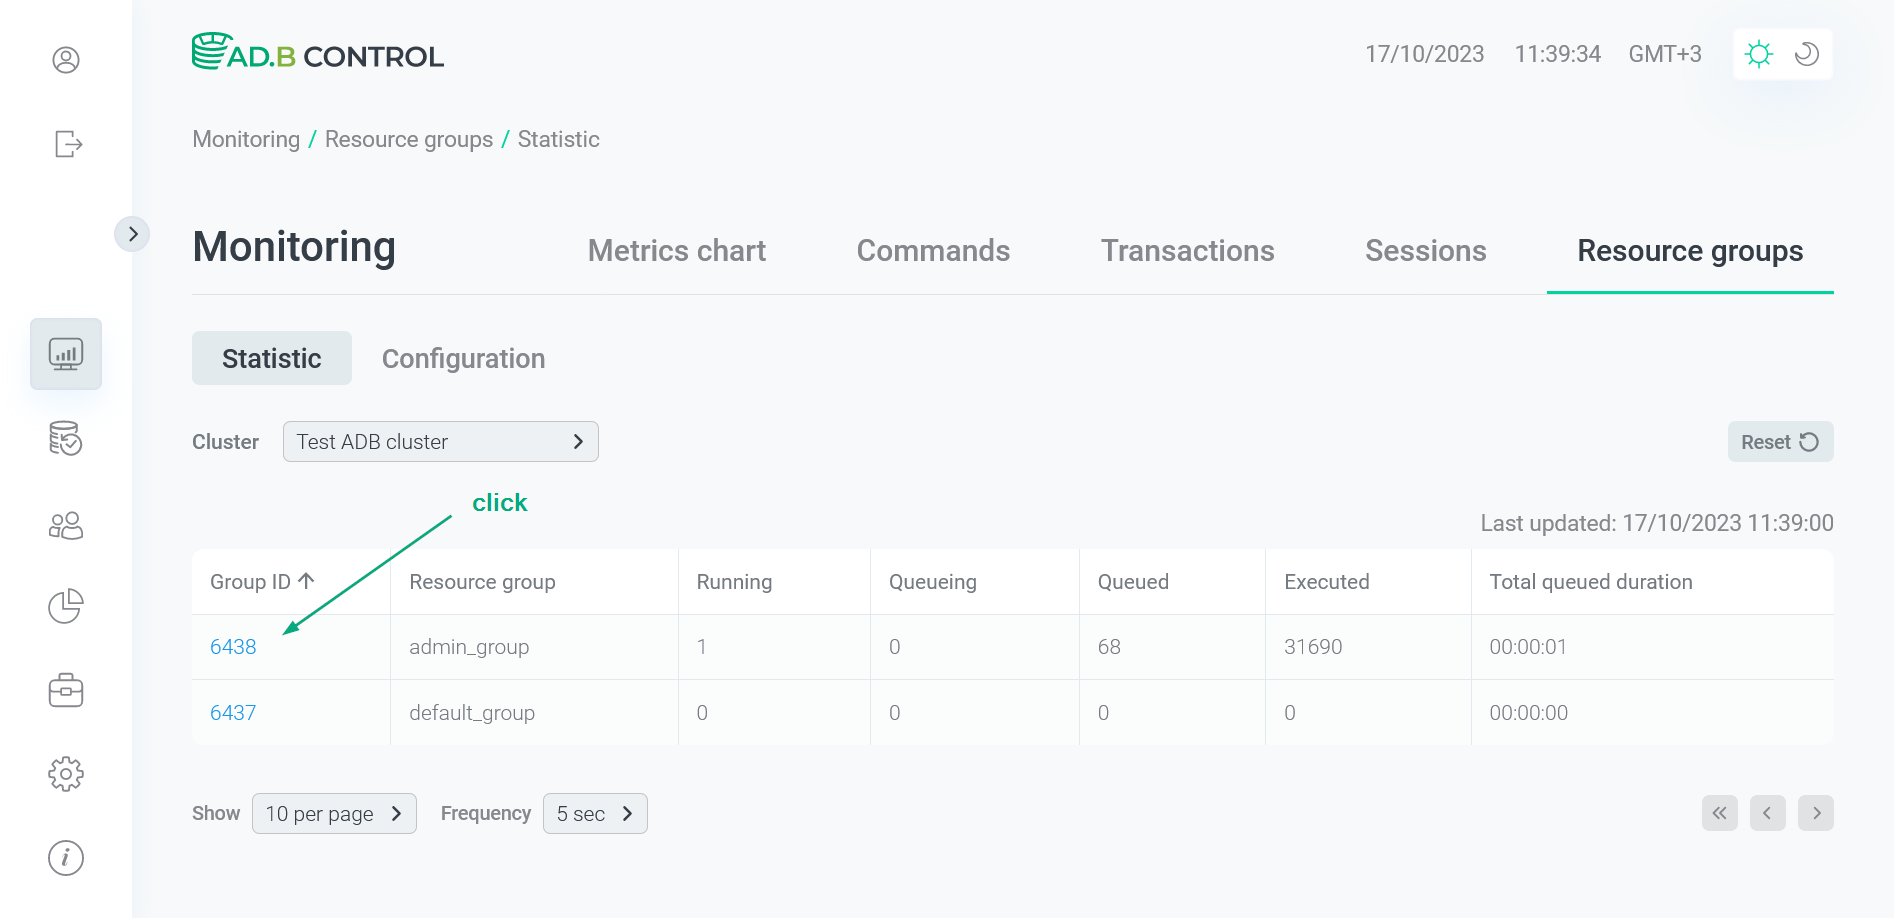
The following page contains multiple sections that are described below.
Header
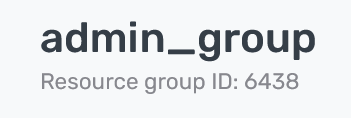
At the top of the page, the resource group identifier and name are displayed.

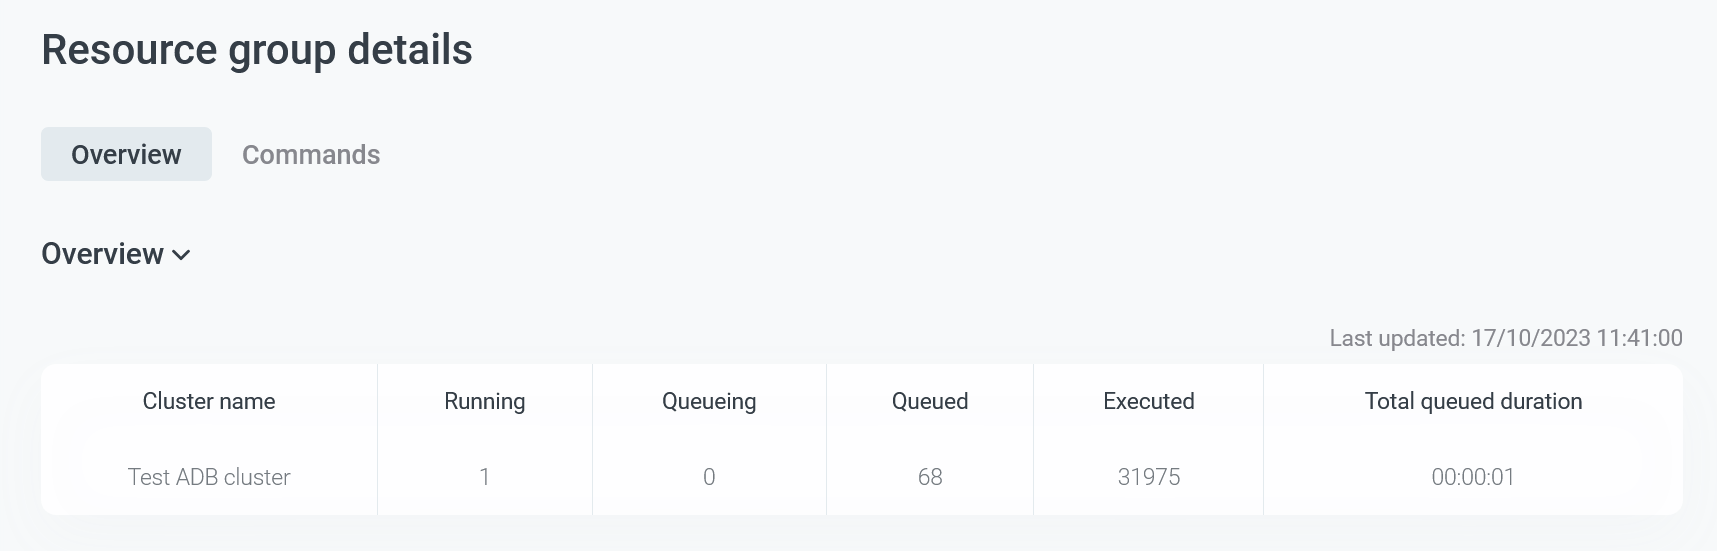
Overview
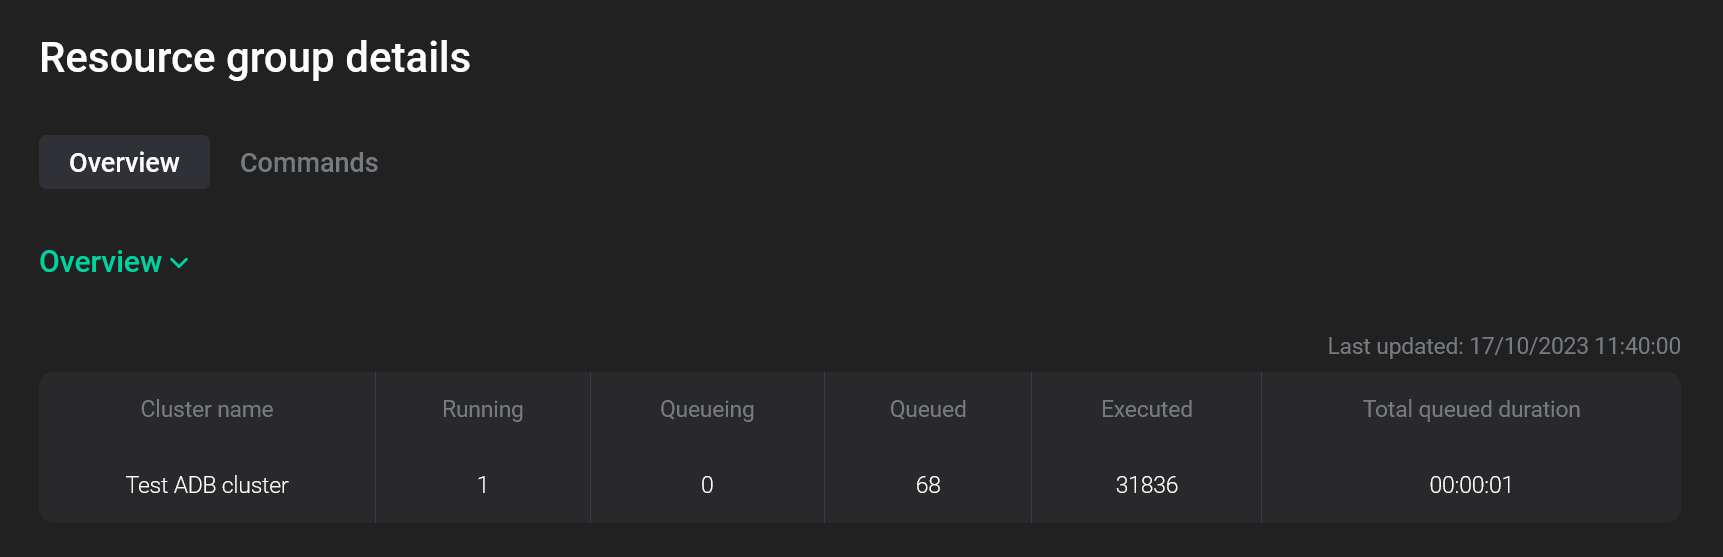
The Overview section displays the general resource group information. All fields are described in detail above.
Commands → Running
The Commands → Running section lists the commands that were started within the current resource group and currently have the following statuses:
-
Queued— the commands on which information about the actual start of execution has not yet received. -
Running— the commands that are currently running. -
Waiting— the commands whose transaction is in the Waiting state (for ADB 7). -
Cancelling— the commands that are currently cancelling (as a part of the transaction cancellation or termination).
| Field | Description |
|---|---|
Command ID |
A unique command identifier, which includes:
To open the page with command details, click the command identifier |
SQL ID |
A common identifier for SQL commands with the same structure |
Command text |
The first symbols of a command text. To view the full text (in case of long queries), hover the mouse over the field value |
Status |
A command status. Possible values are listed above |
Planner |
A name of the query optimizer that is used to produce the query execution plan. Possible values:
|
Submitted |
The timestamp when the user submitted the command (in the |
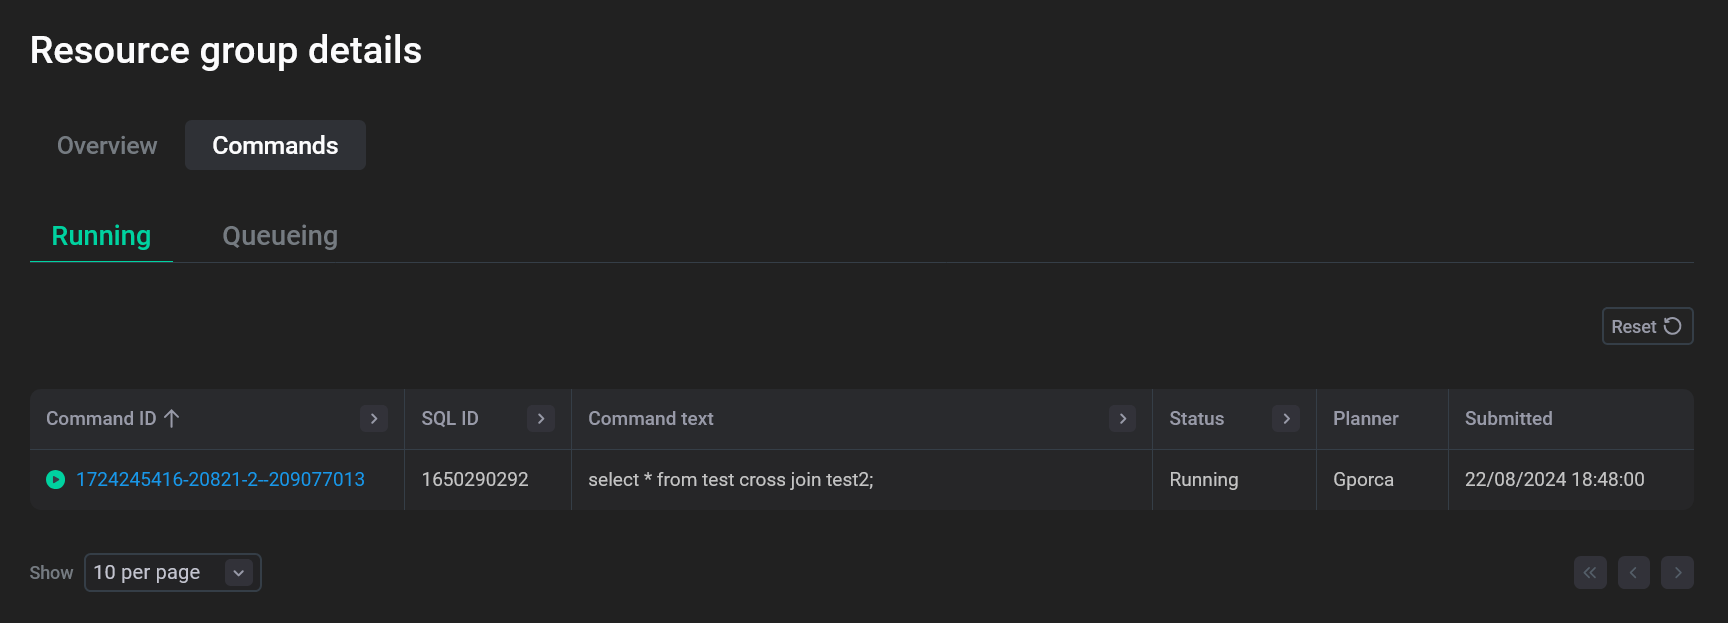
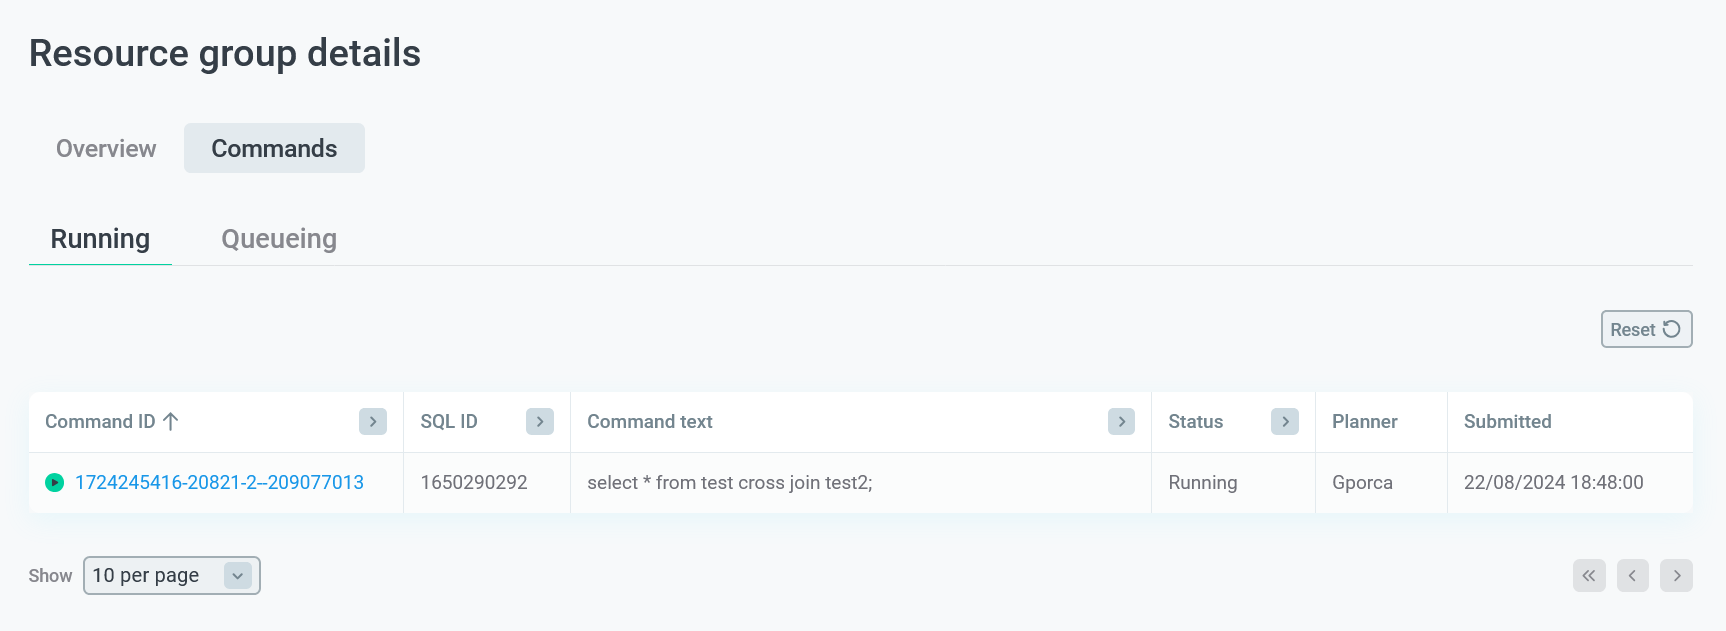
In the column headers of the table with a list of commands,
there are filters that you can use to select specific data. To open a filter, click the 
 icon. For those columns where the set of possible values is limited (e.g. Status), you can select a value from the drop-down list.
For some columns (e.g. Command ID), the search value should be entered.
icon. For those columns where the set of possible values is limited (e.g. Status), you can select a value from the drop-down list.
For some columns (e.g. Command ID), the search value should be entered.
The 
 icon means that a filter is defined for the column. To reset all filters, click Reset.
Commands → Queueing
The Commands → Queueing section displays information on the commands waiting to be queued within the current resource group due to exceeding the resource group limits.
In the section, there is a table with the following information on commands.
| Field | Description |
|---|---|
Database |
A database name |
Session ID |
A session identifier (see Session ID on the Monitoring → Sessions tab) |
Process ID |
A process identifier |
Username |
A name of the user who started the command |
Command text |
A command text |
Queueing duration |
Queueing duration in hours, minutes, seconds. Available for ADB 6 only |
Tags |
Command tags |
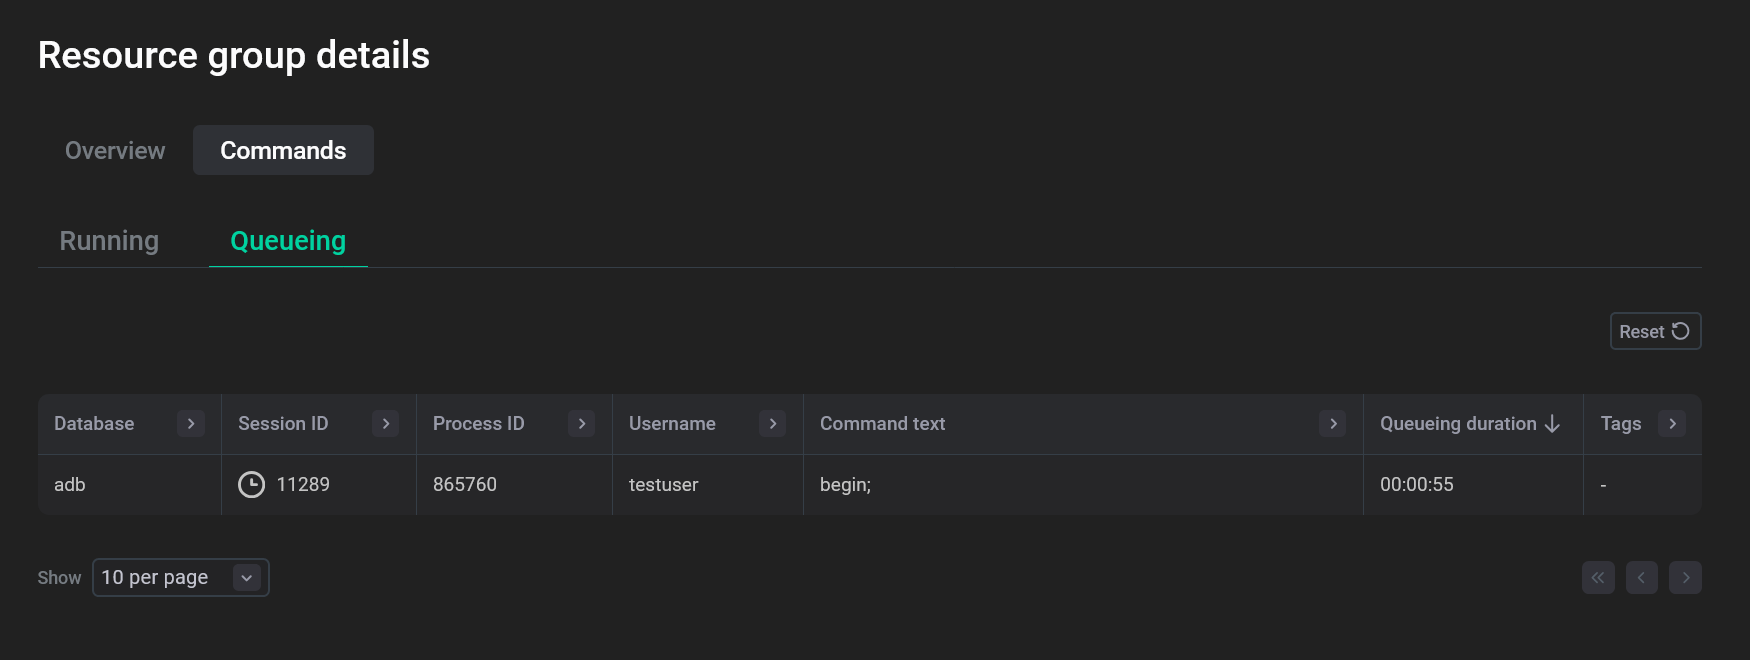
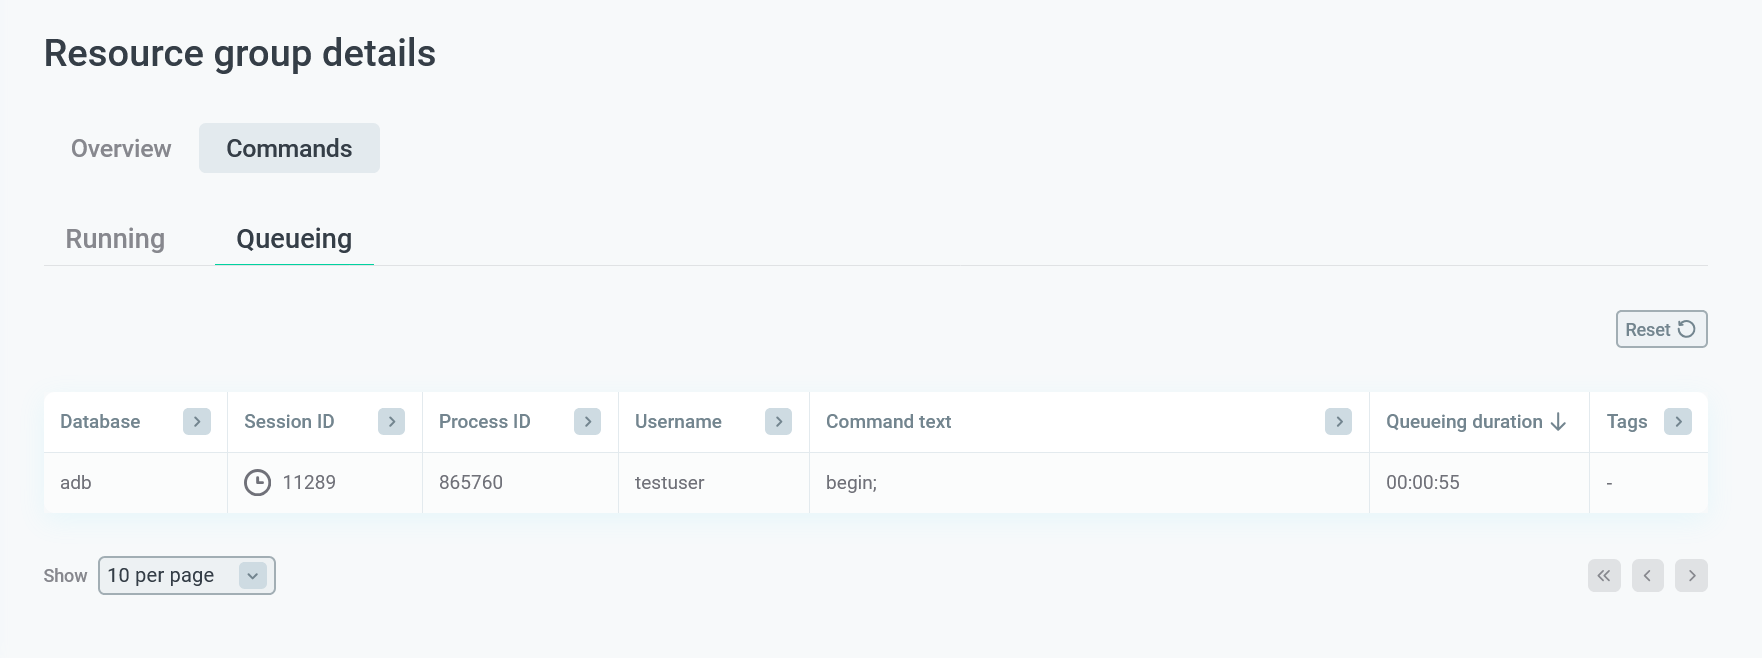
In the column headers of the table with a list of commands, there are filters that you can use to select specific data. To apply a filter, click the icon in the column header and enter the value to search. The icon means that the filter is defined for the column. To reset all filters, click Reset.
Usage
The Usage section displays the statistics of system resource consumption by the selected resource group. This section contains the following tabs:
-
IO usage (for ADB 7)
|
NOTE
|
Hosts & Segments usage
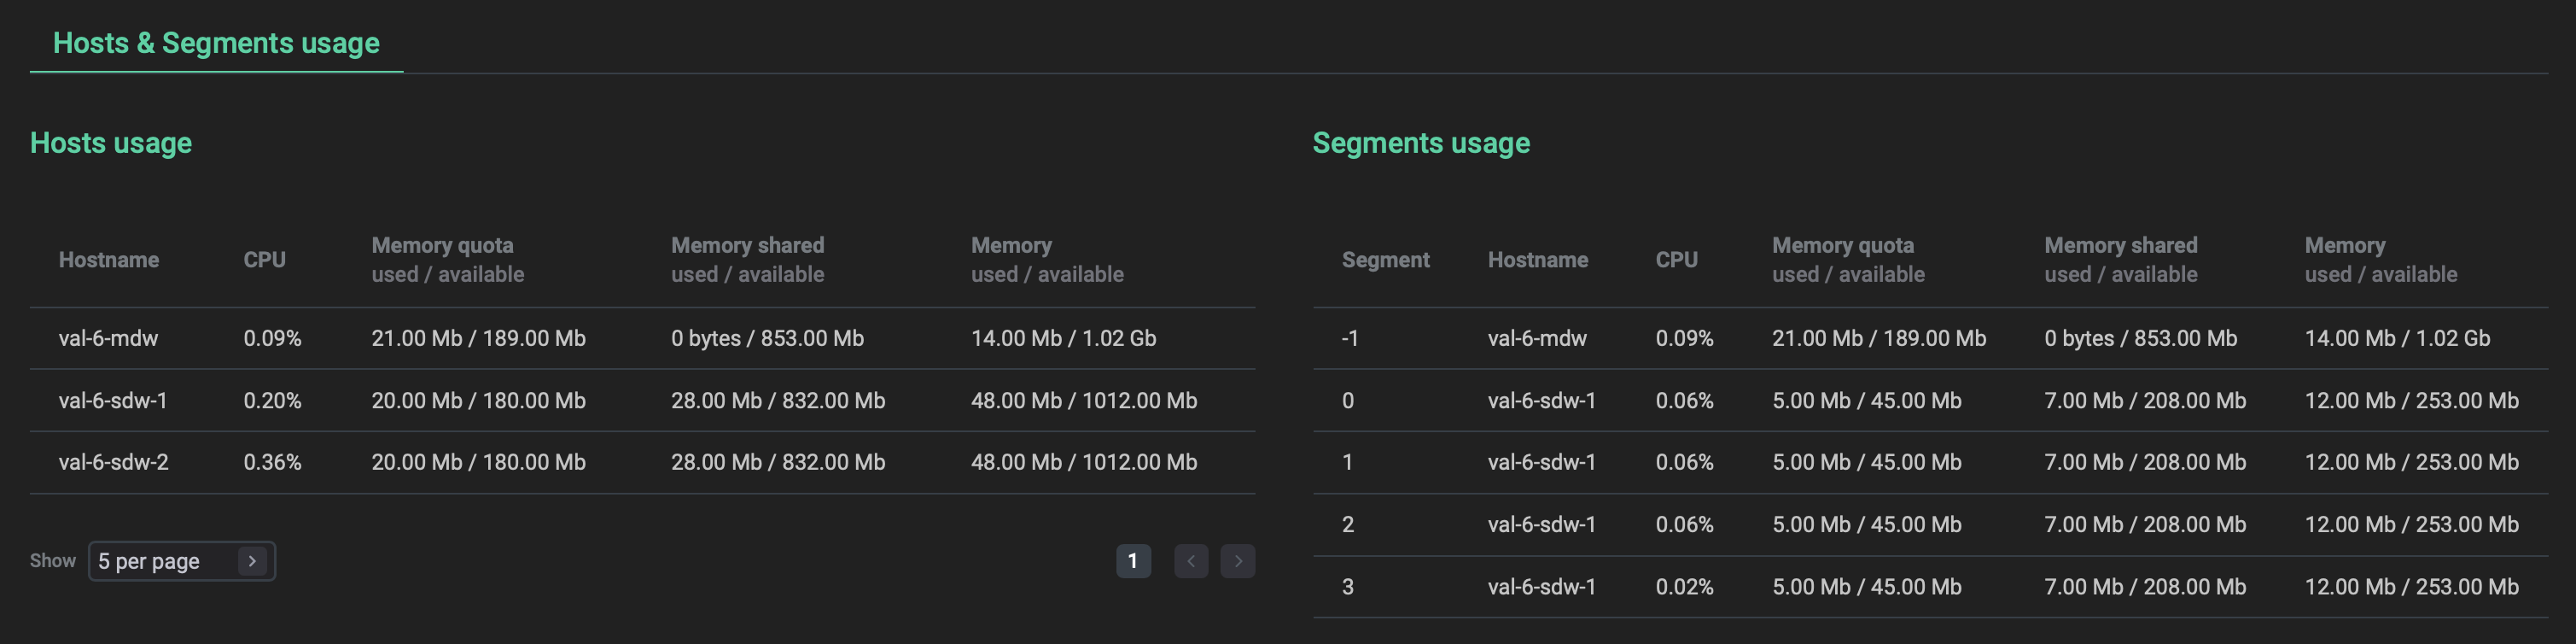
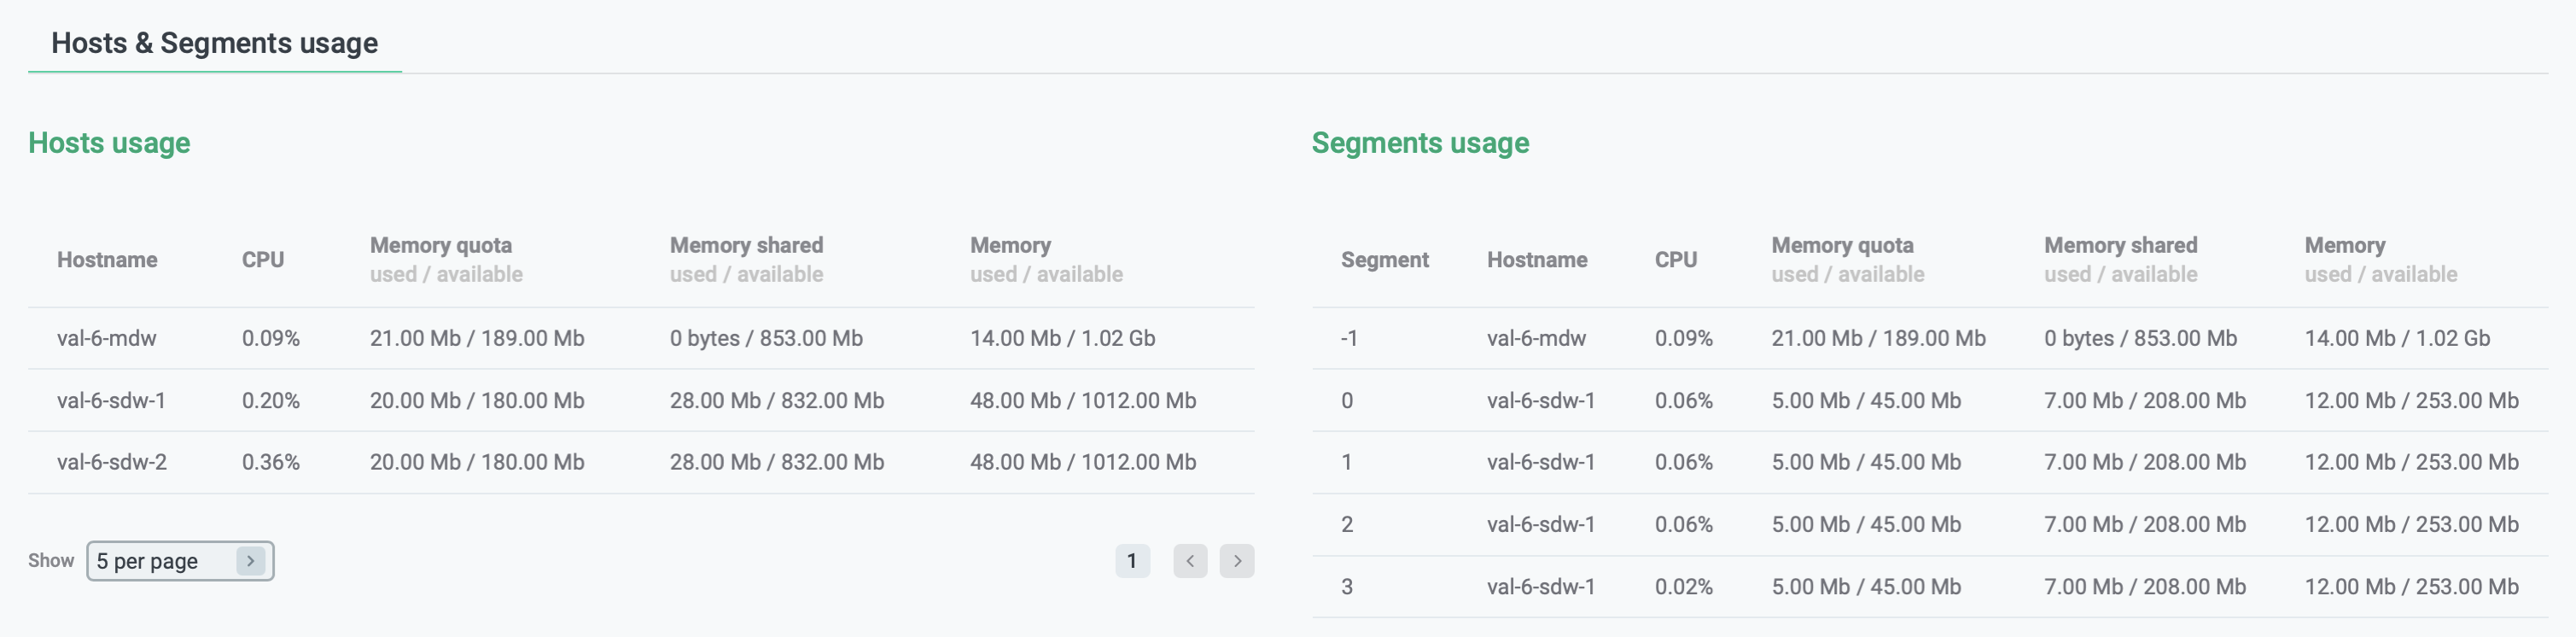
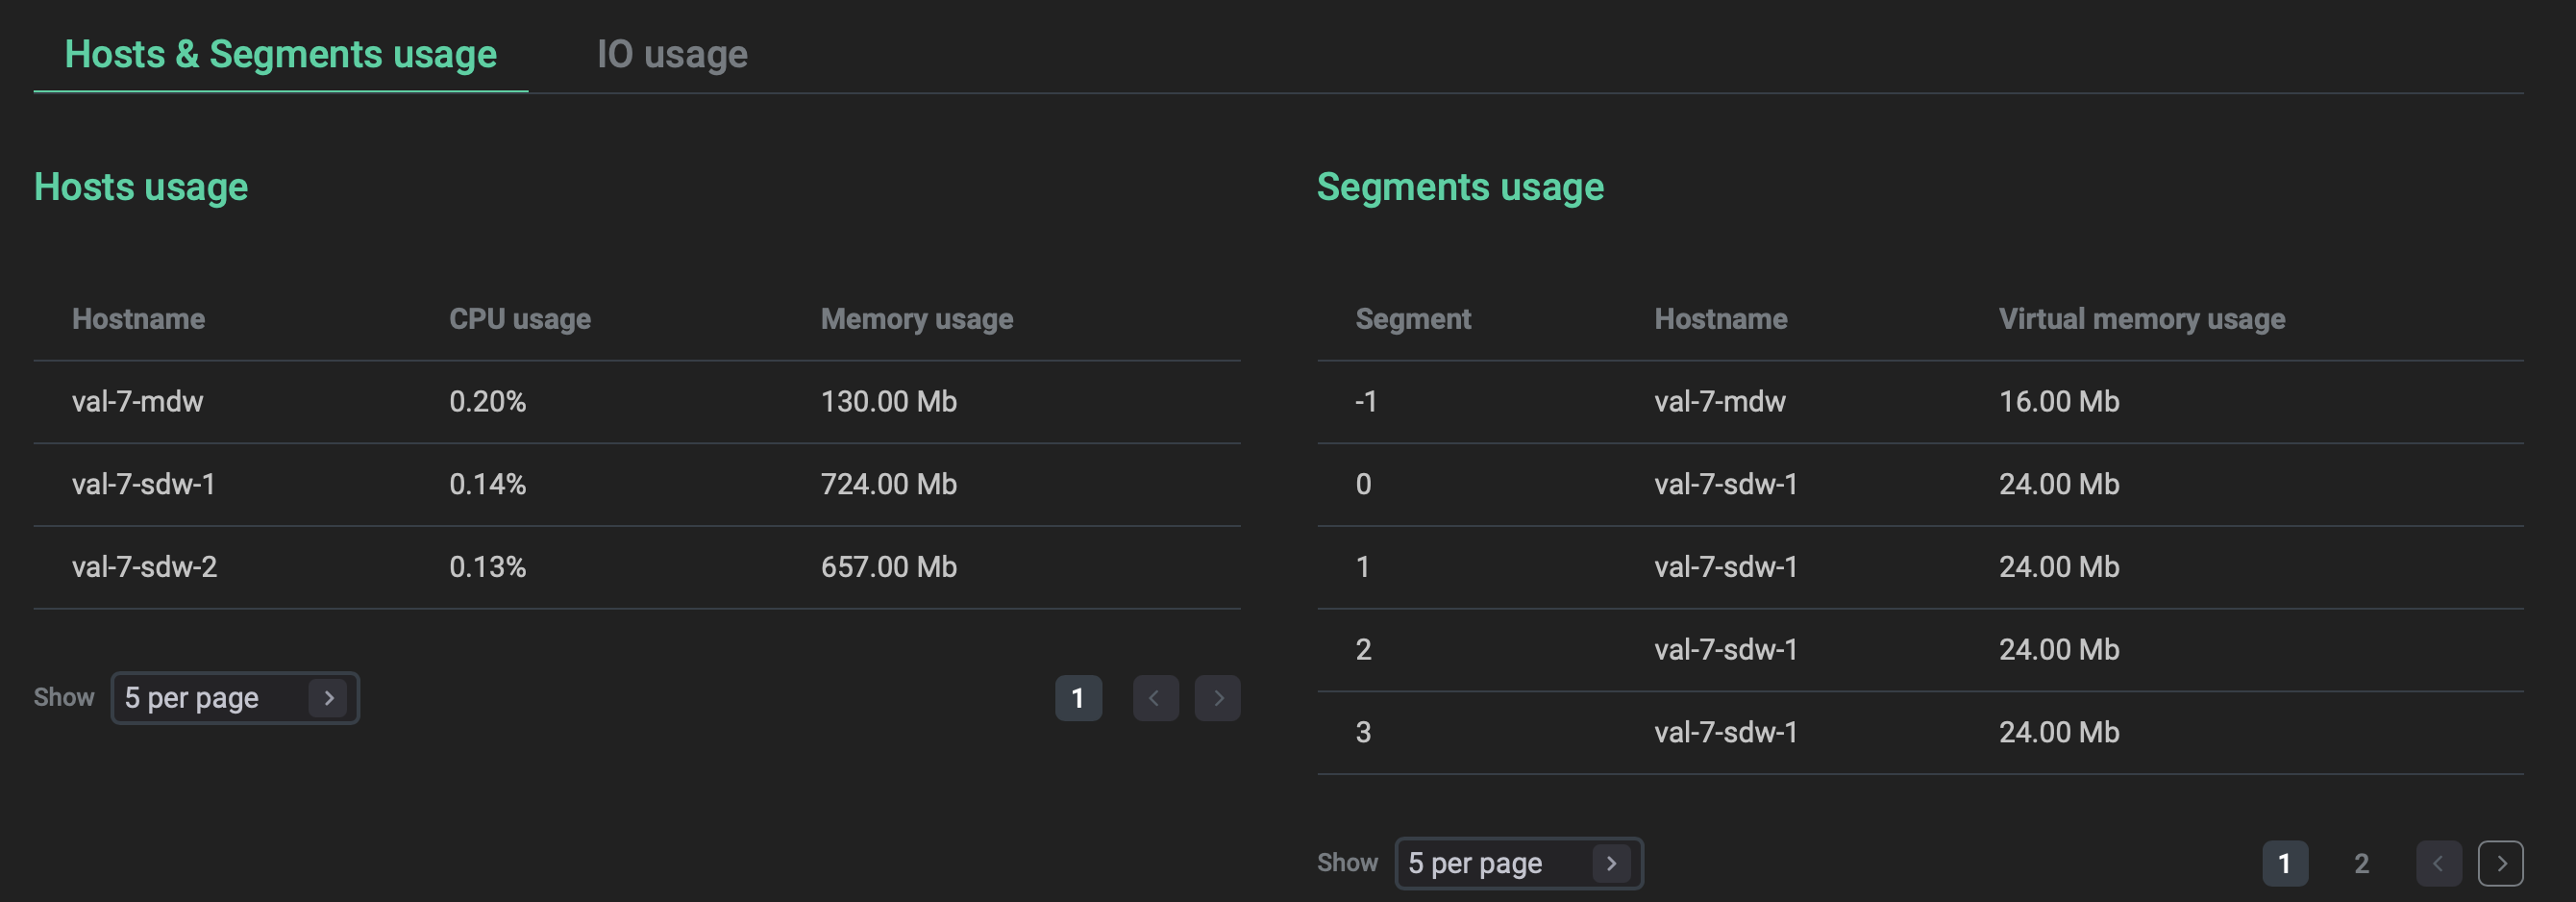
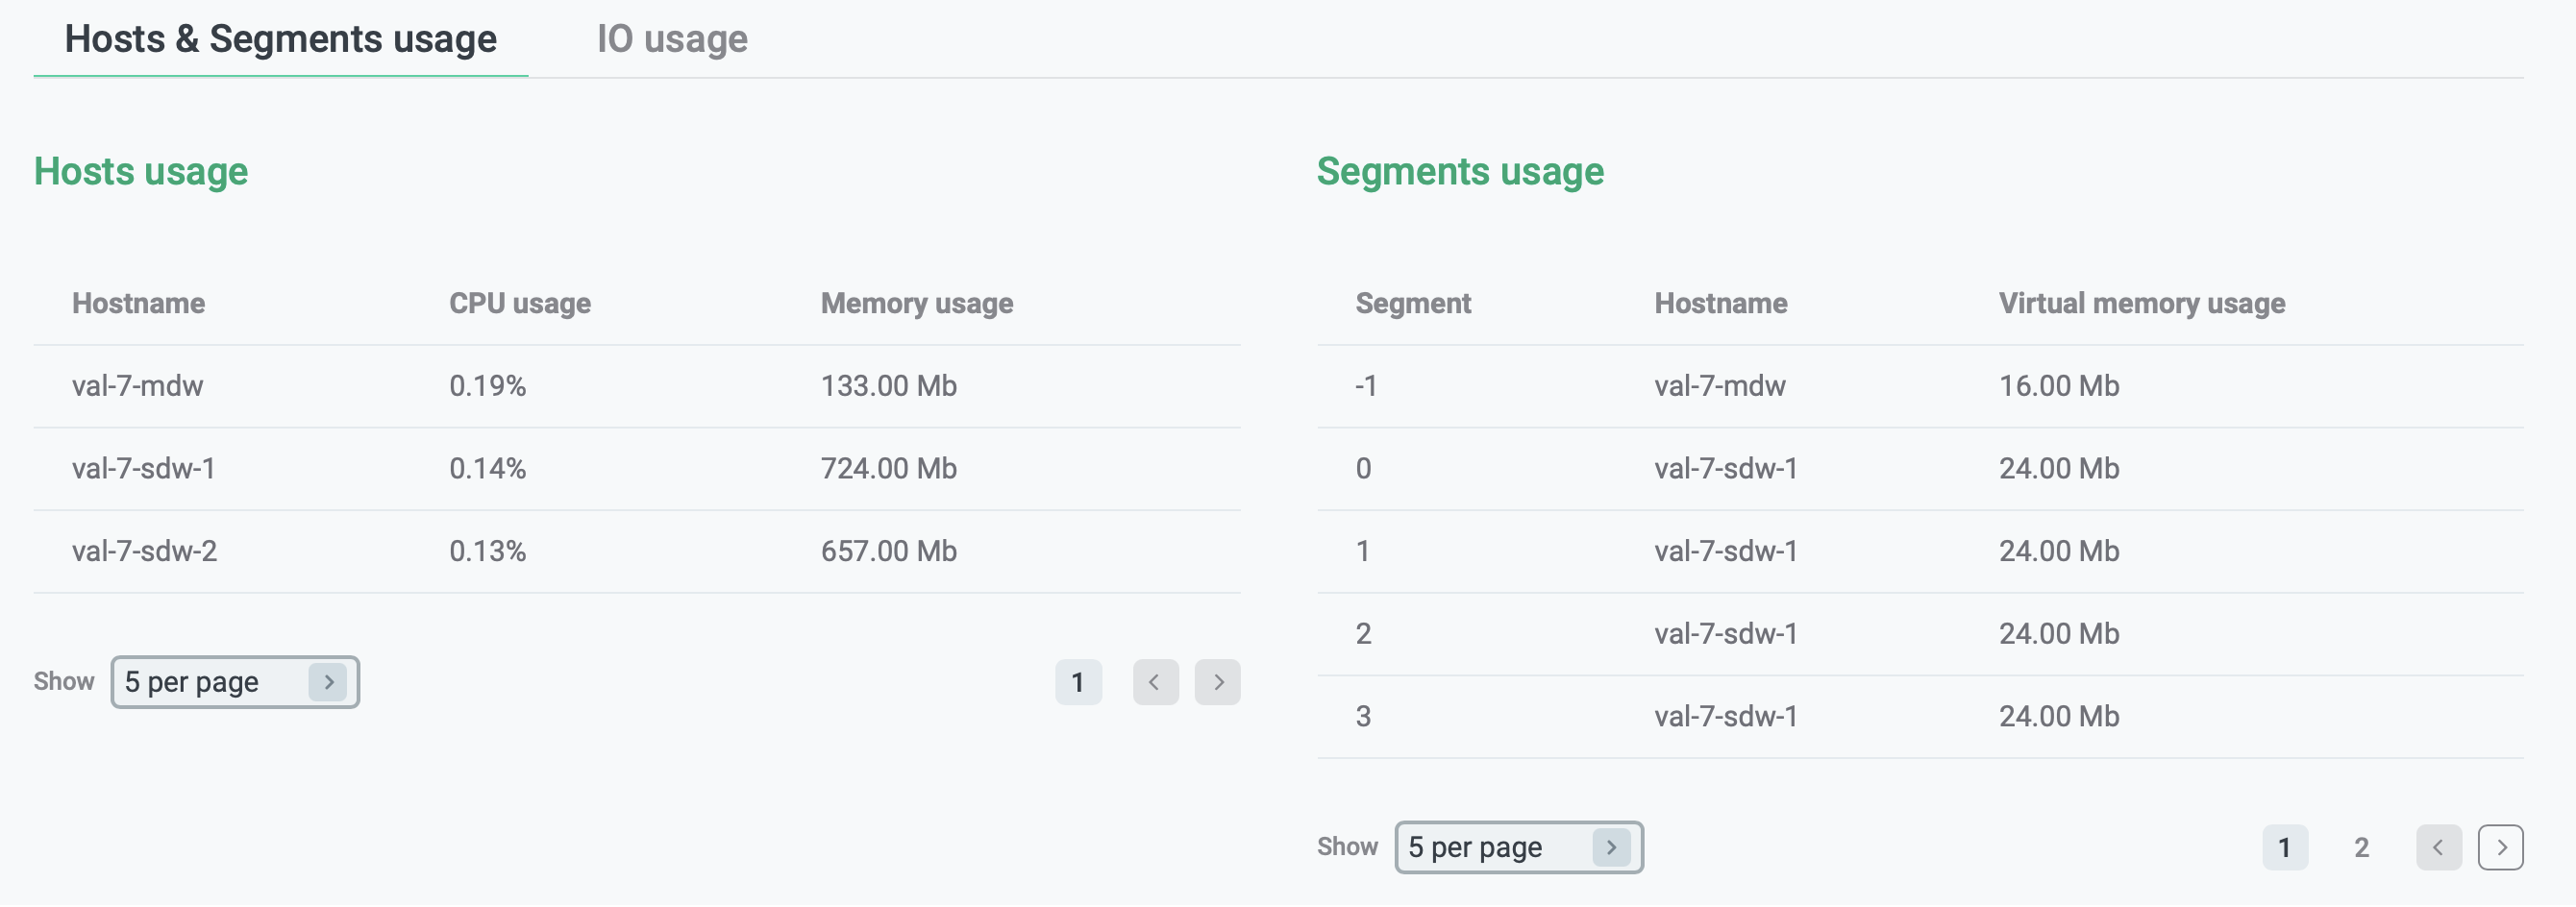
The Hosts & Segments usage tab consists of two sections: Hosts usage and Segments usage that show information on CPU and memory consumption.
Similarly to the Configuration tab, this tab reflects the difference in resource group management between ADB 6 and ADB 7. Parameters available on this tab depend on the version of the selected ADB cluster.
| Field | Description |
|---|---|
Hostname |
A host name |
Segment |
Segment identifier |
CPU |
The CPU usage by the resource group at the host and segment level |
Memory quota |
The fixed memory (used and available) at the host and segment level. The used quota is the memory quota reserved for all currently running queries of the resource group. The available quota is the granted quota (calculated based on Memory limit and Memory shared quota) minus the used quota |
Memory shared |
The group shared memory (used and available) at the host and segment level |
Memory |
The actual memory usage at the host and segment level |
| Field | Description |
|---|---|
Hostname |
A host name |
CPU usage |
The average CPU usage across the segment instances on the host |
Memory usage |
The average RAM usage across the segment instances on the host |
Segment |
Segment identifier |
Virtual memory usage |
The virtual memory usage on the segment instance |
IO usage
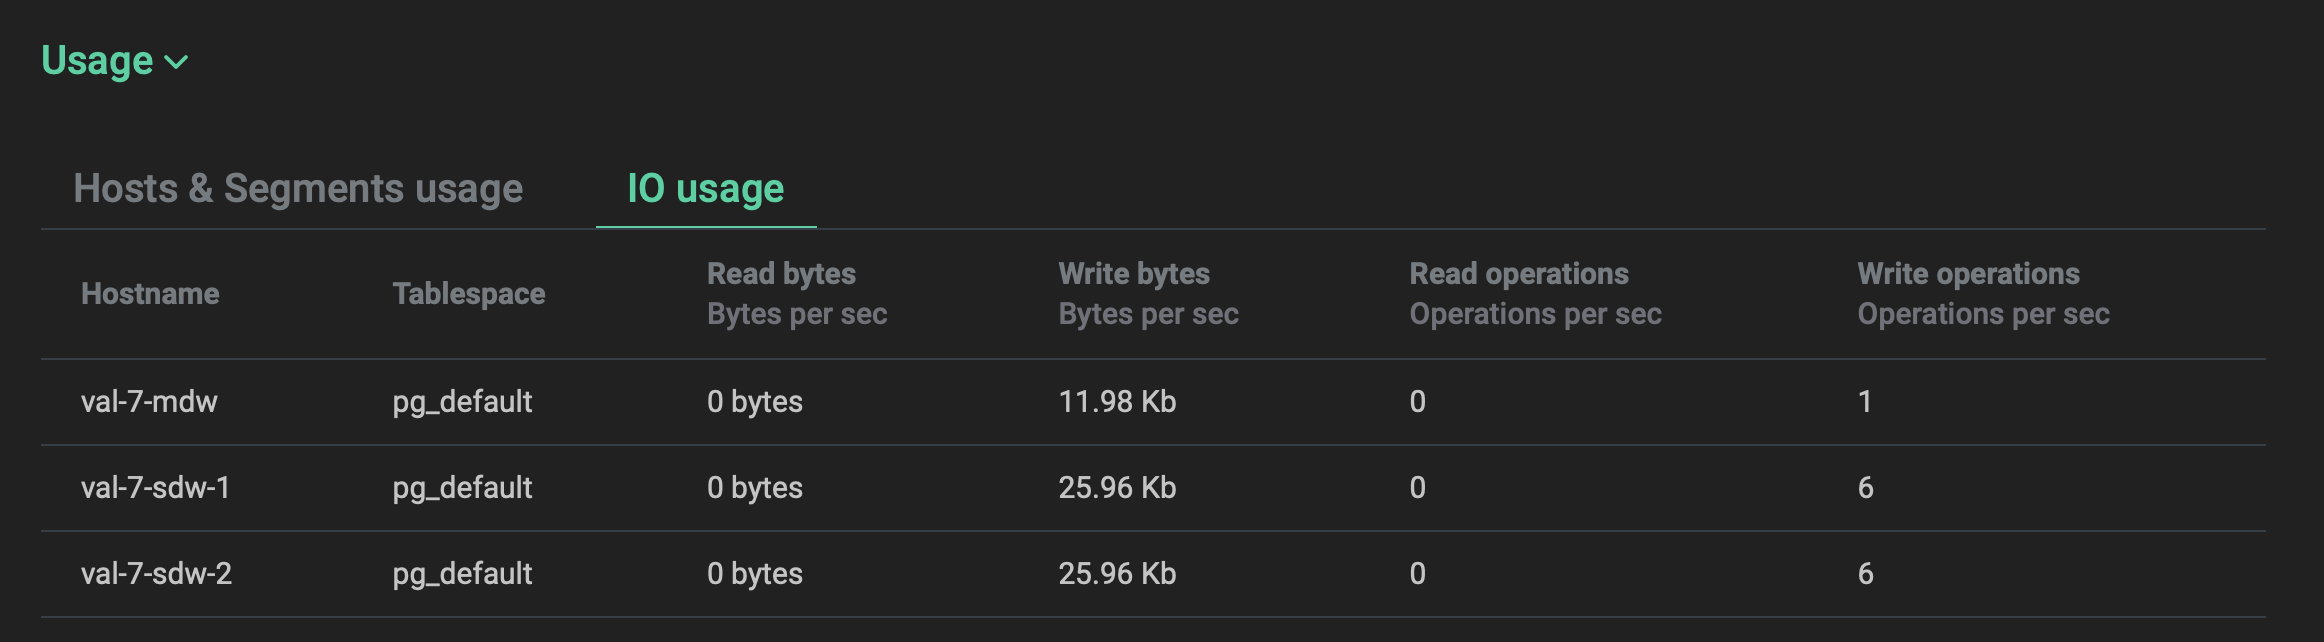
The IO usage tab is available for ADB 7 clusters only.
For each host and tablespace, it shows information about the disk I/O throughput and the number of disk read and write operations per second.
These metrics are based on the gp_toolkit.gp_resgroup_iostats_per_host view.