

Dashboard
The Dashboard page in the ADB Control web interface allows you to display charts for tracking the dynamic changes of various metrics over the selected time period in the ADB clusters connected for monitoring.
Overview
The following charts are available on the page, depending on the ADB cluster version.
| Chart | Description | ADB 6 | ADB 7 |
|---|---|---|---|
Commands |
The number of SQL commands |
In the |
In the |
Transactions |
The number of transactions |
In the |
In the |
Nodes |
The number of active instances of plan nodes ( |
+ |
+ |
Waits |
The number of active wait events in the cluster. To start collecting wait events, enable the GUC to enable/disable waits polling for the ADCC option for the connected ADB cluster |
— |
+ |
Cluster |
A section with the following charts:
|
+ |
+ |
Resource groups |
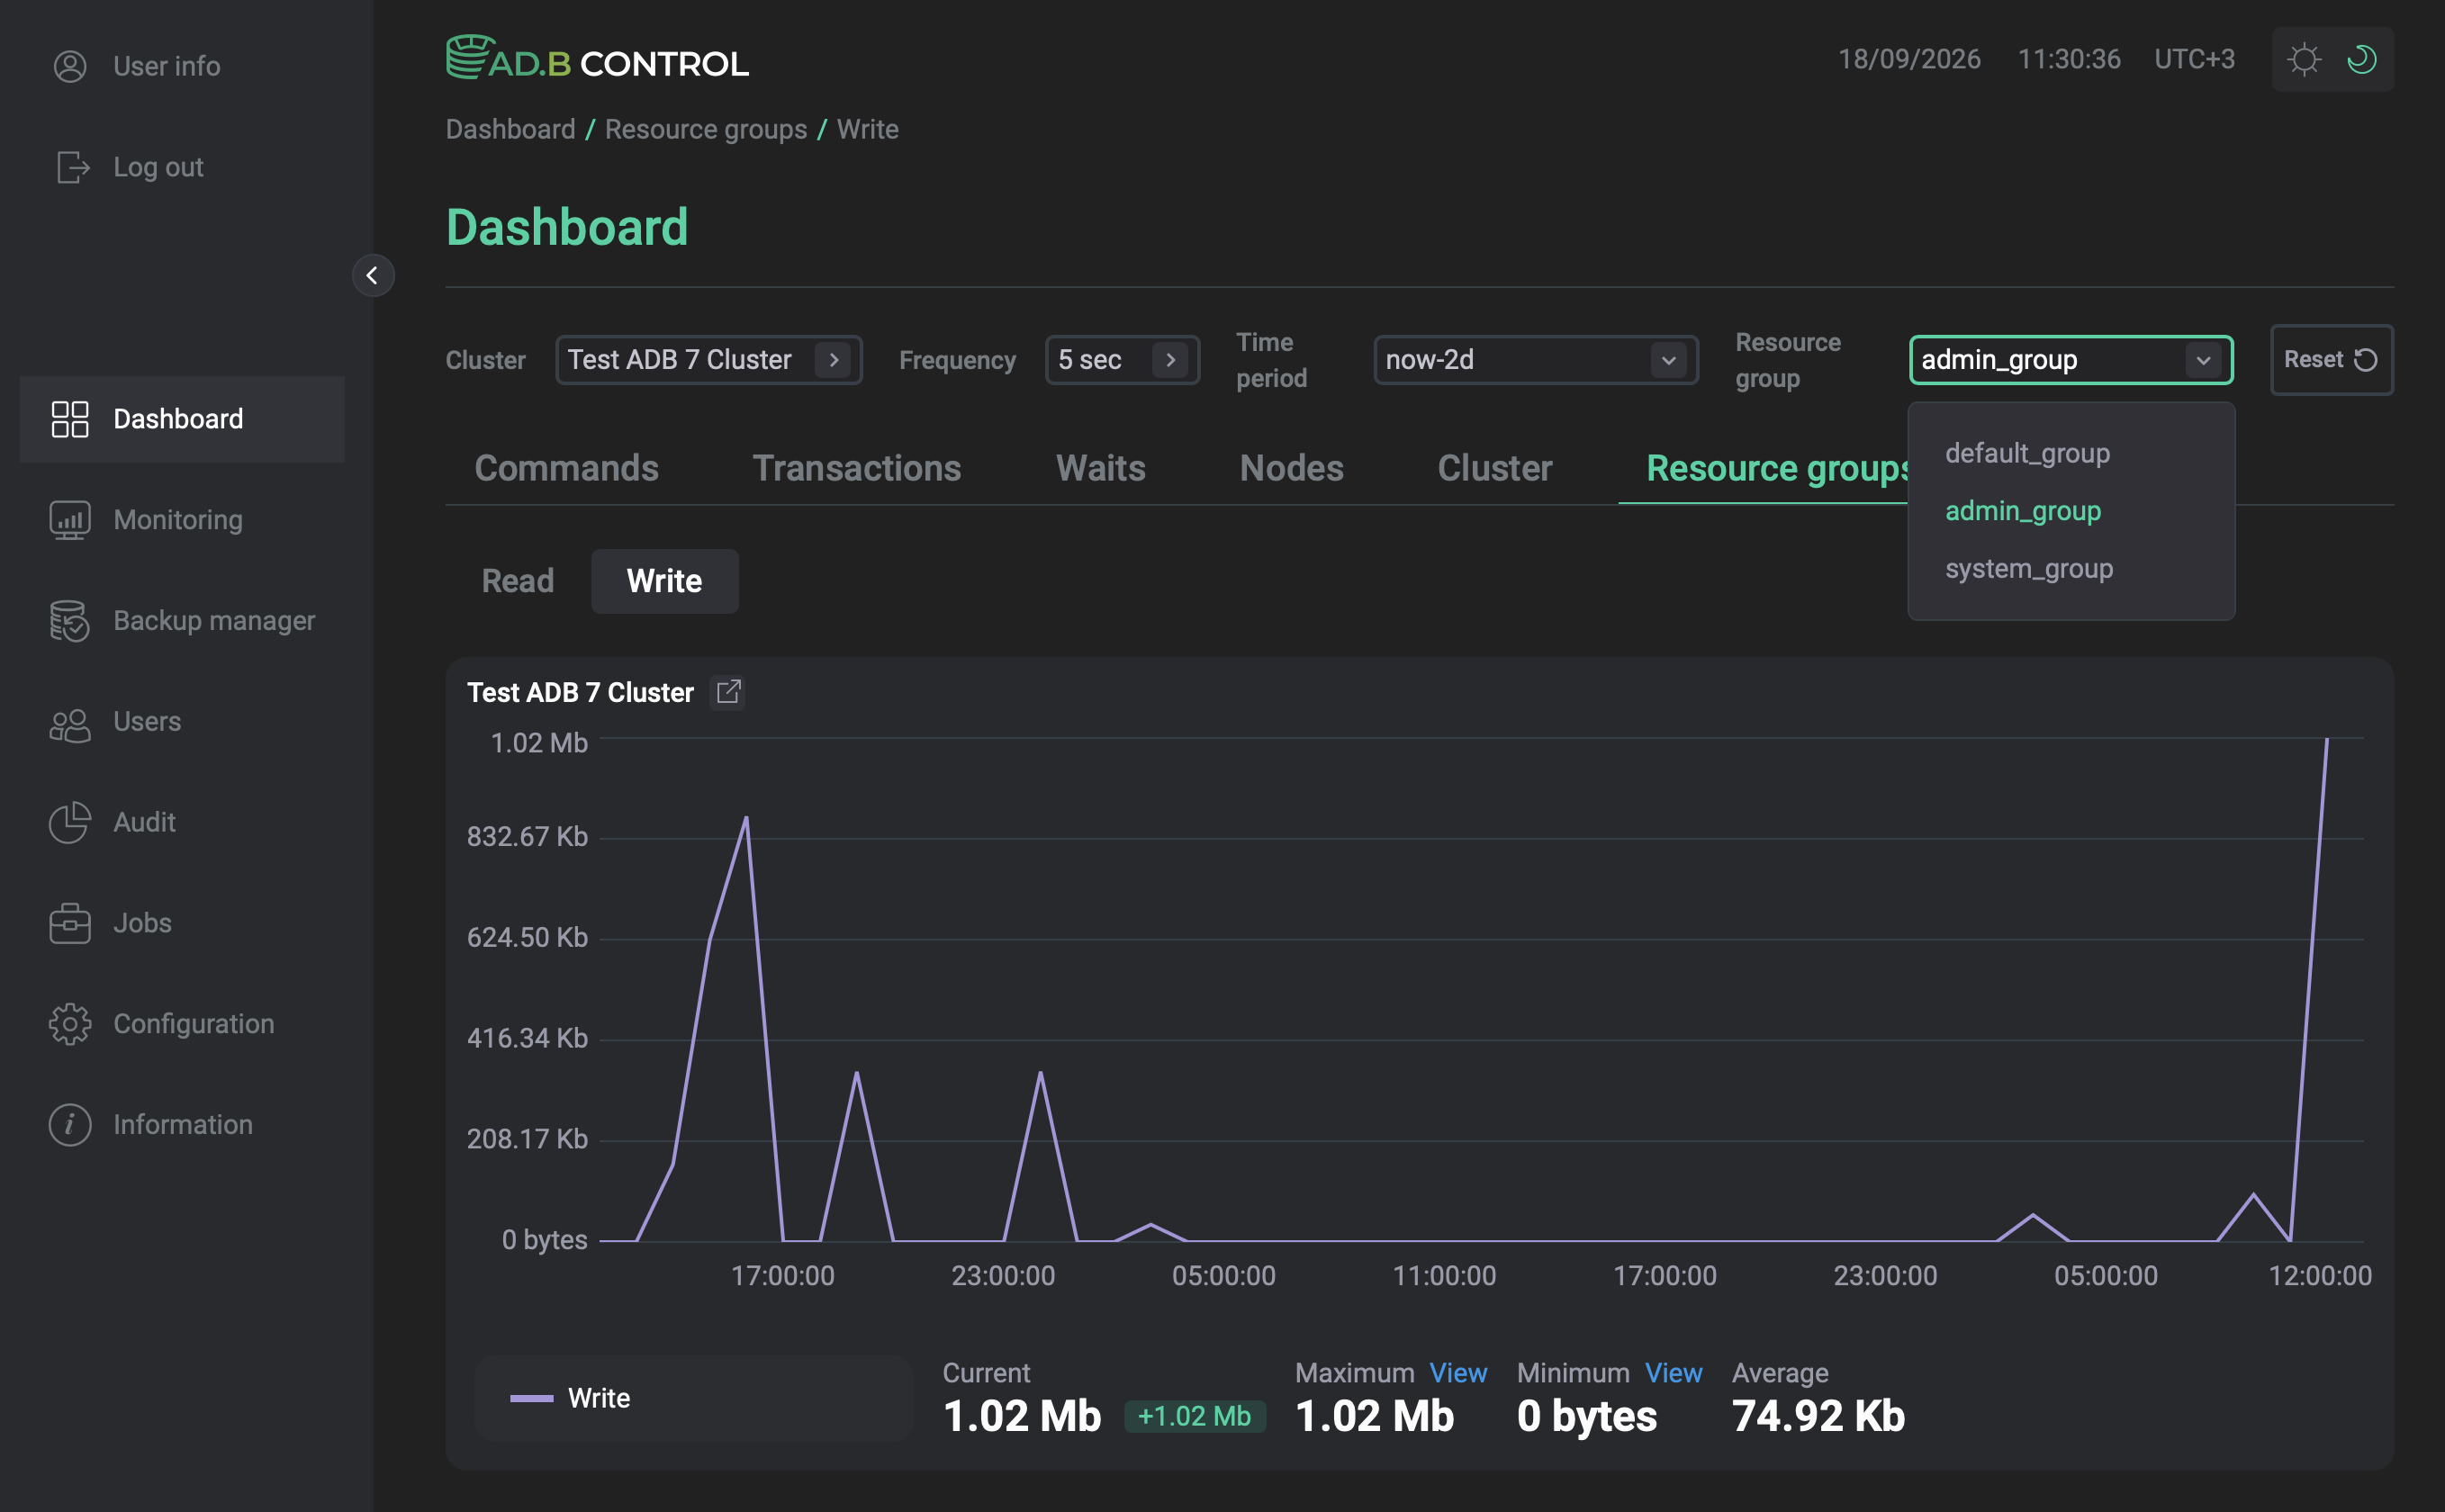
A section with Read and Write charts that show the read and write throughput in the ADB cluster per resource group |
— |
+ |
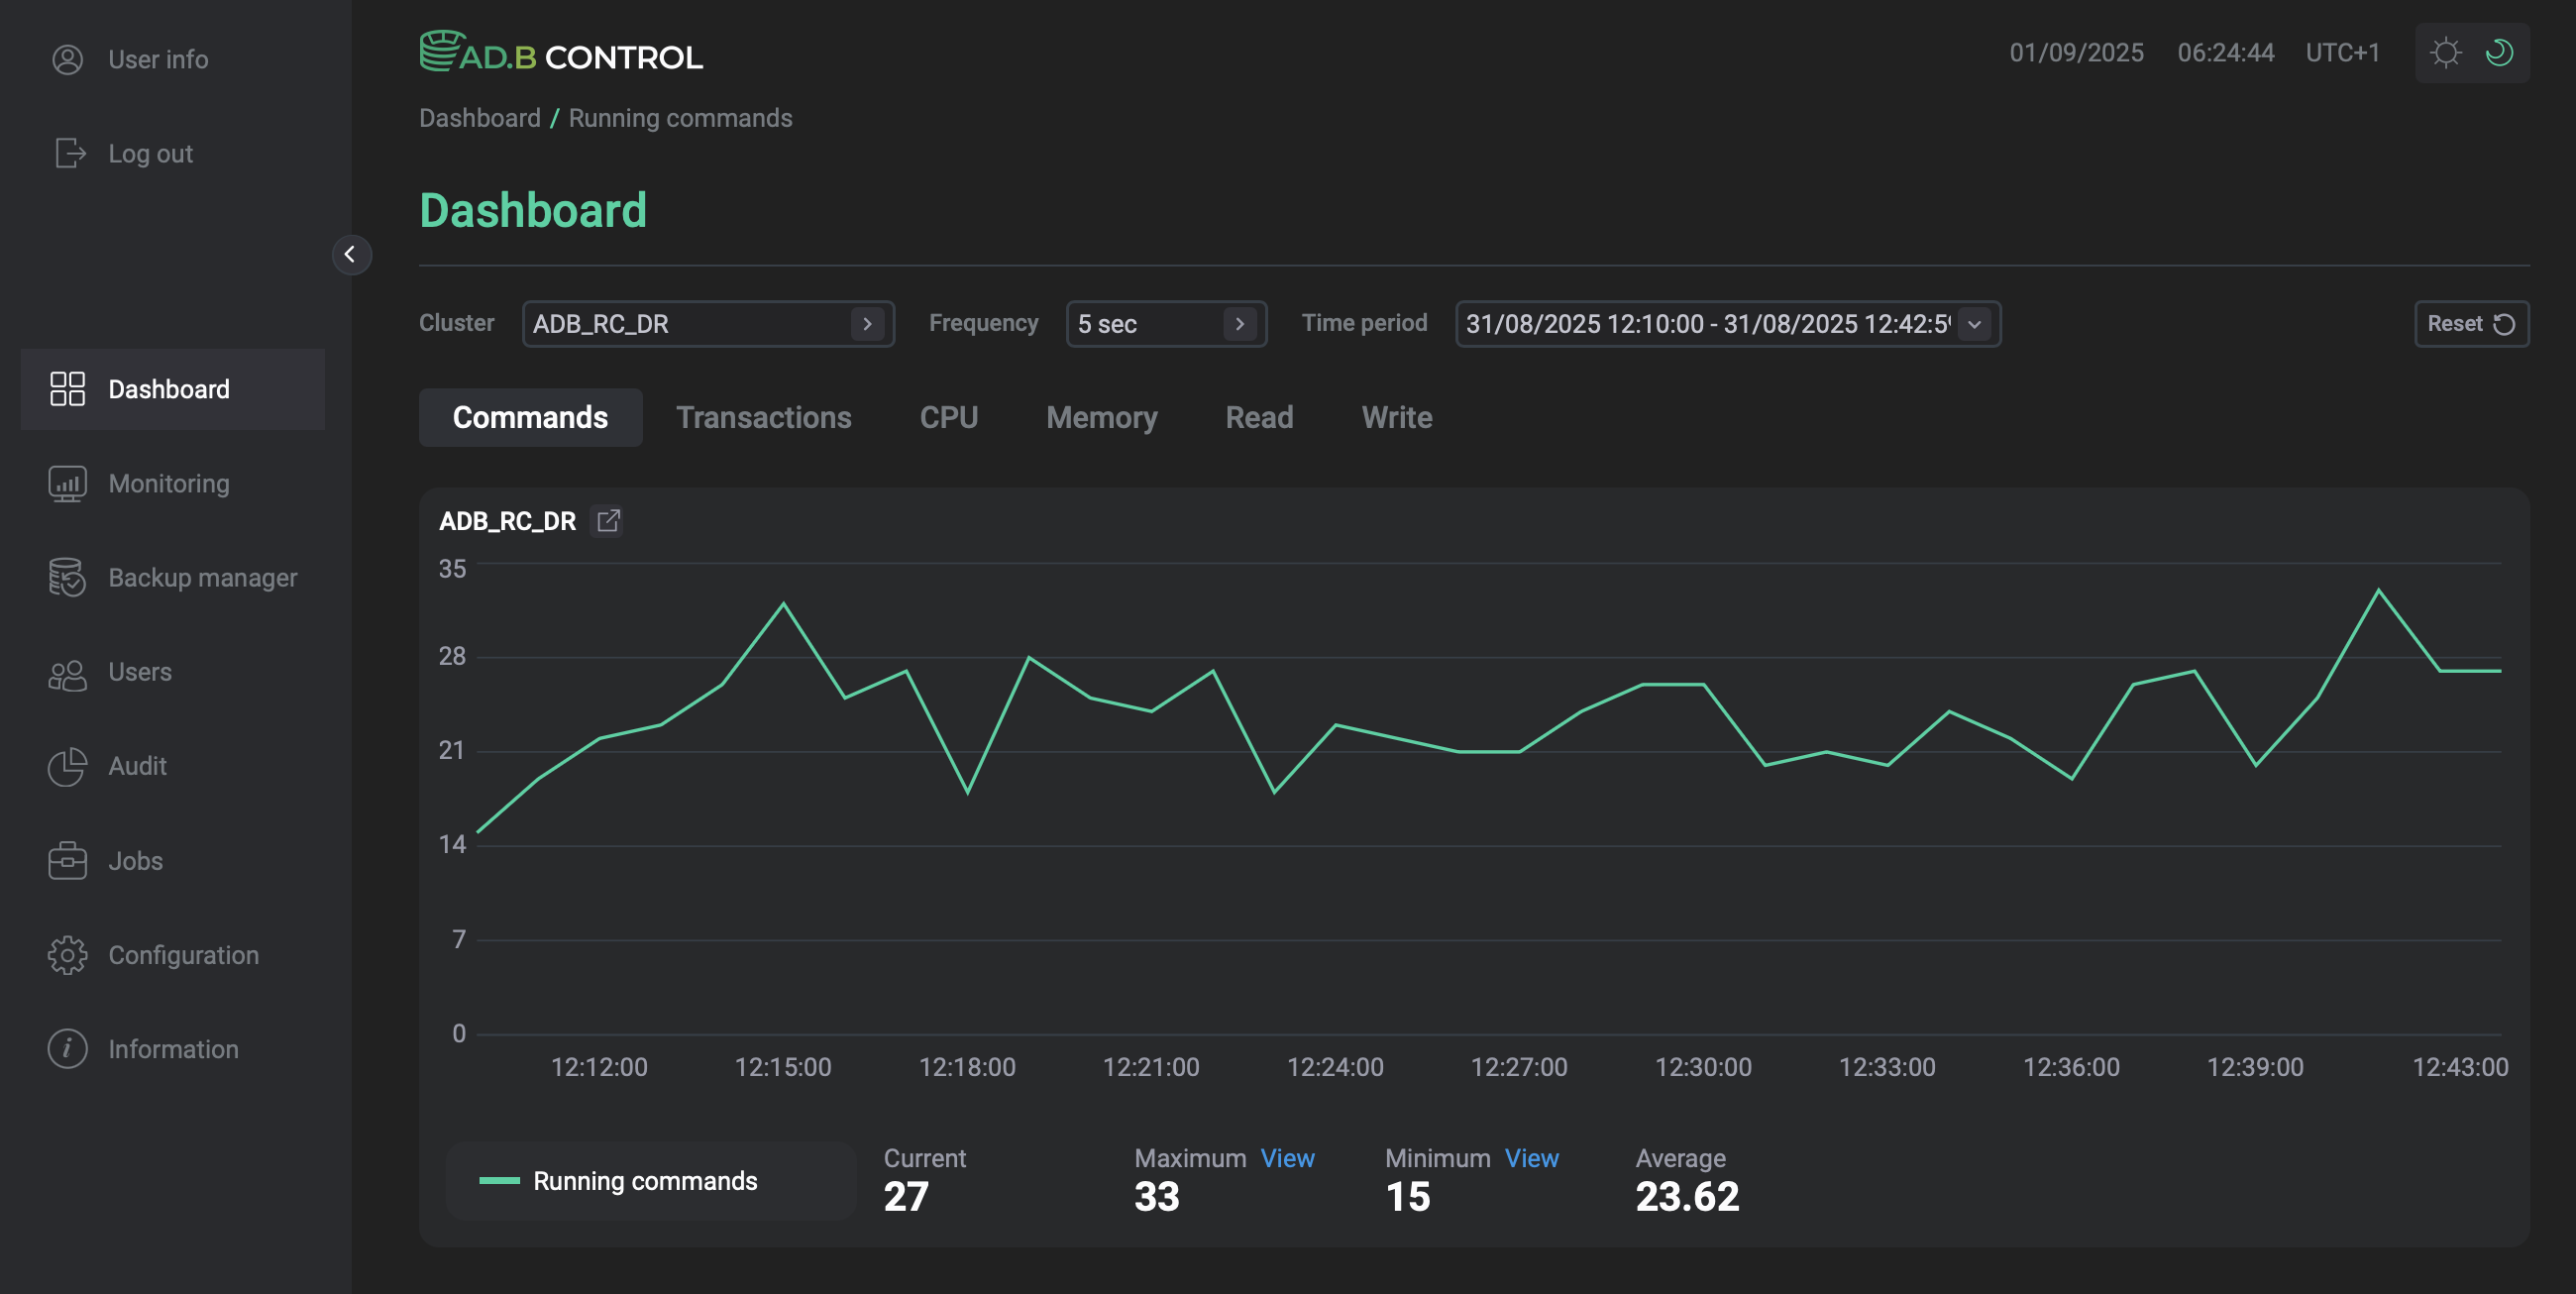
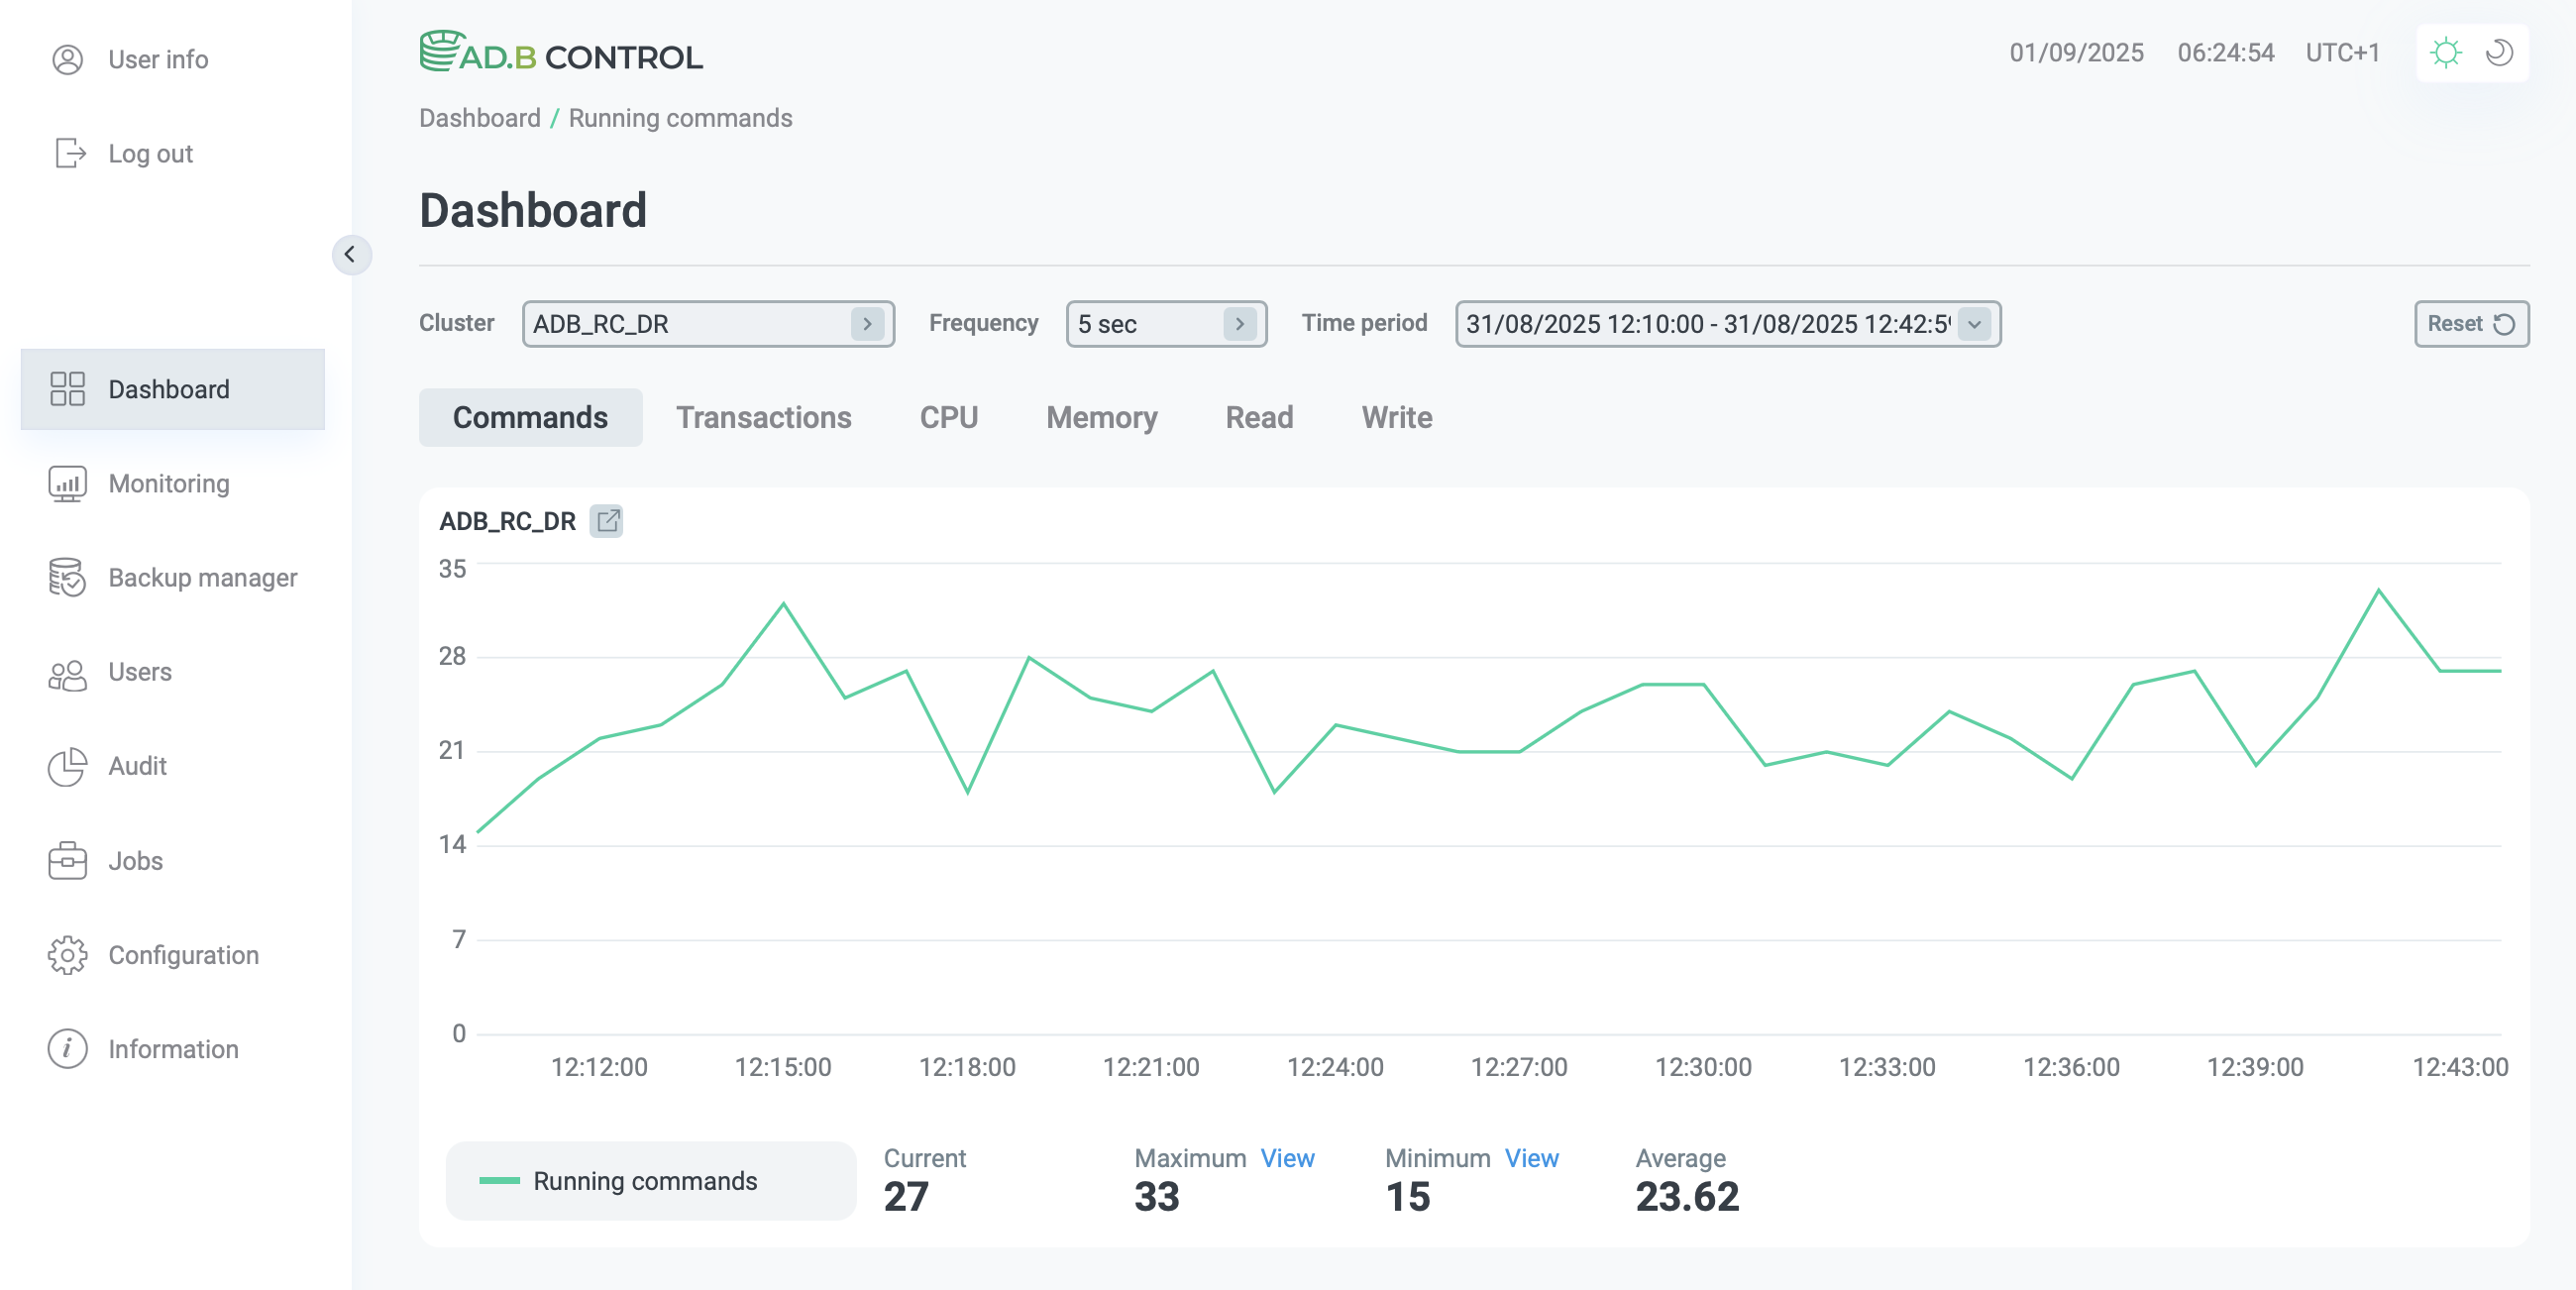
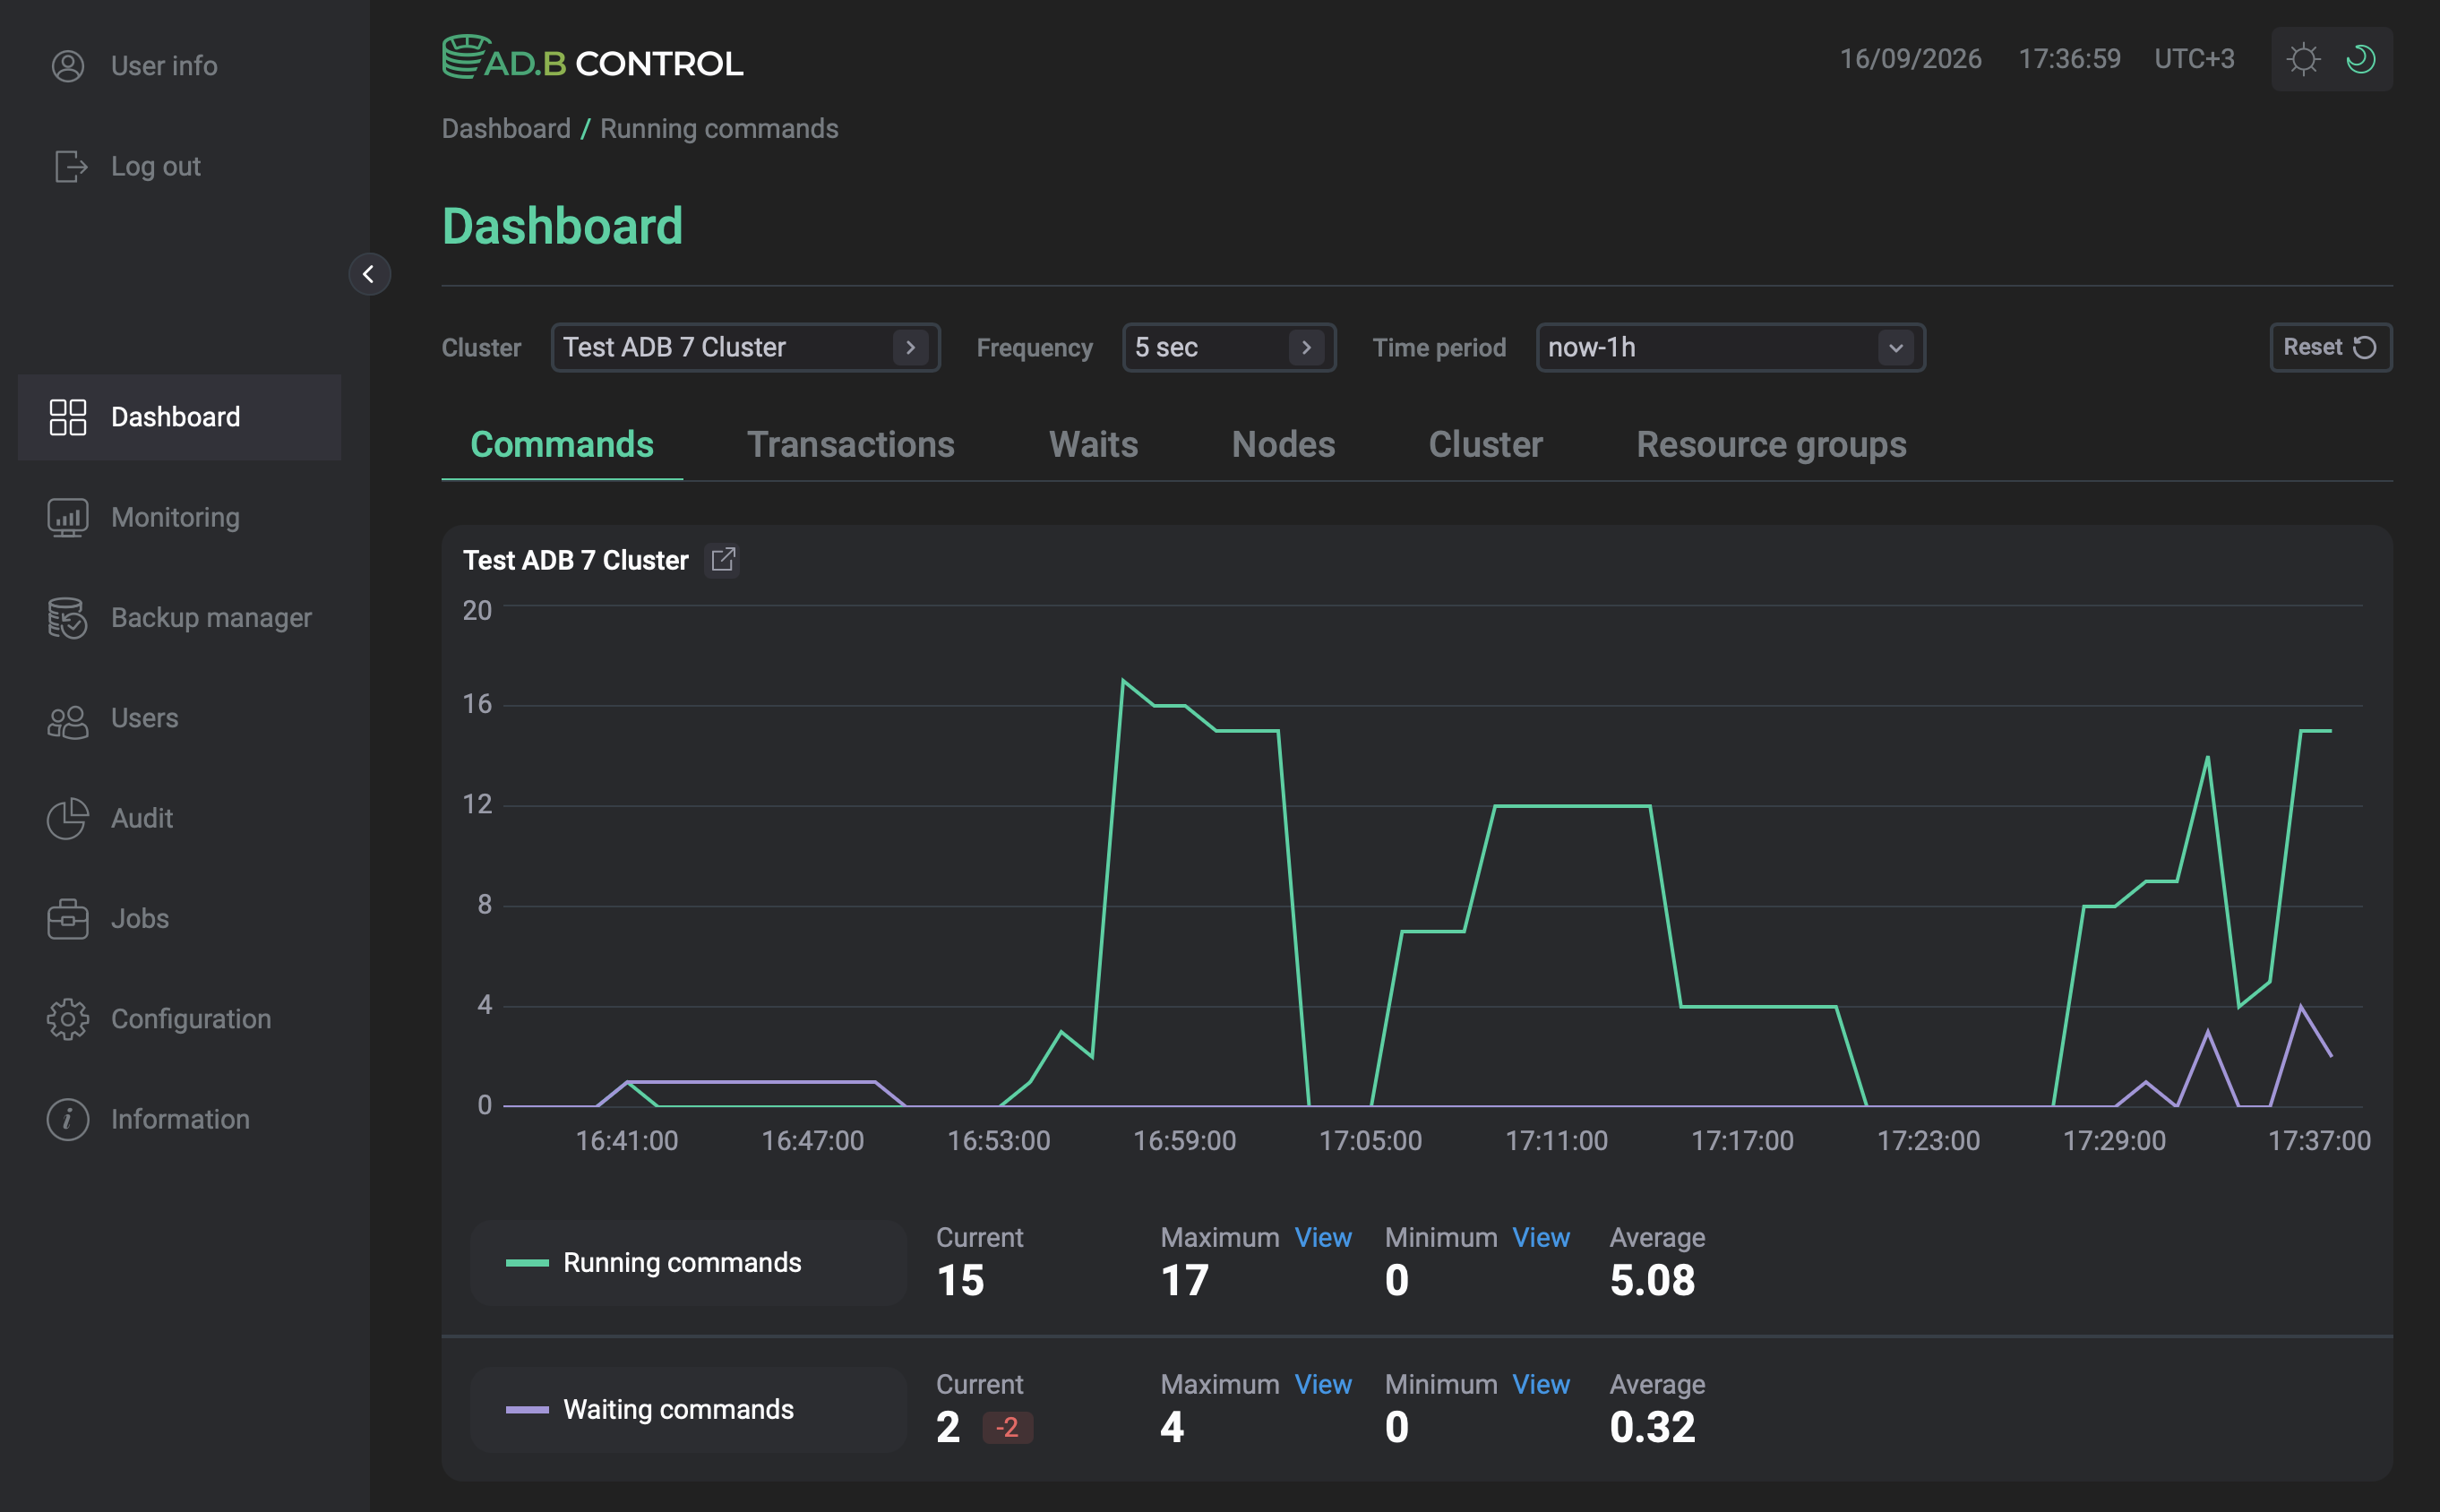
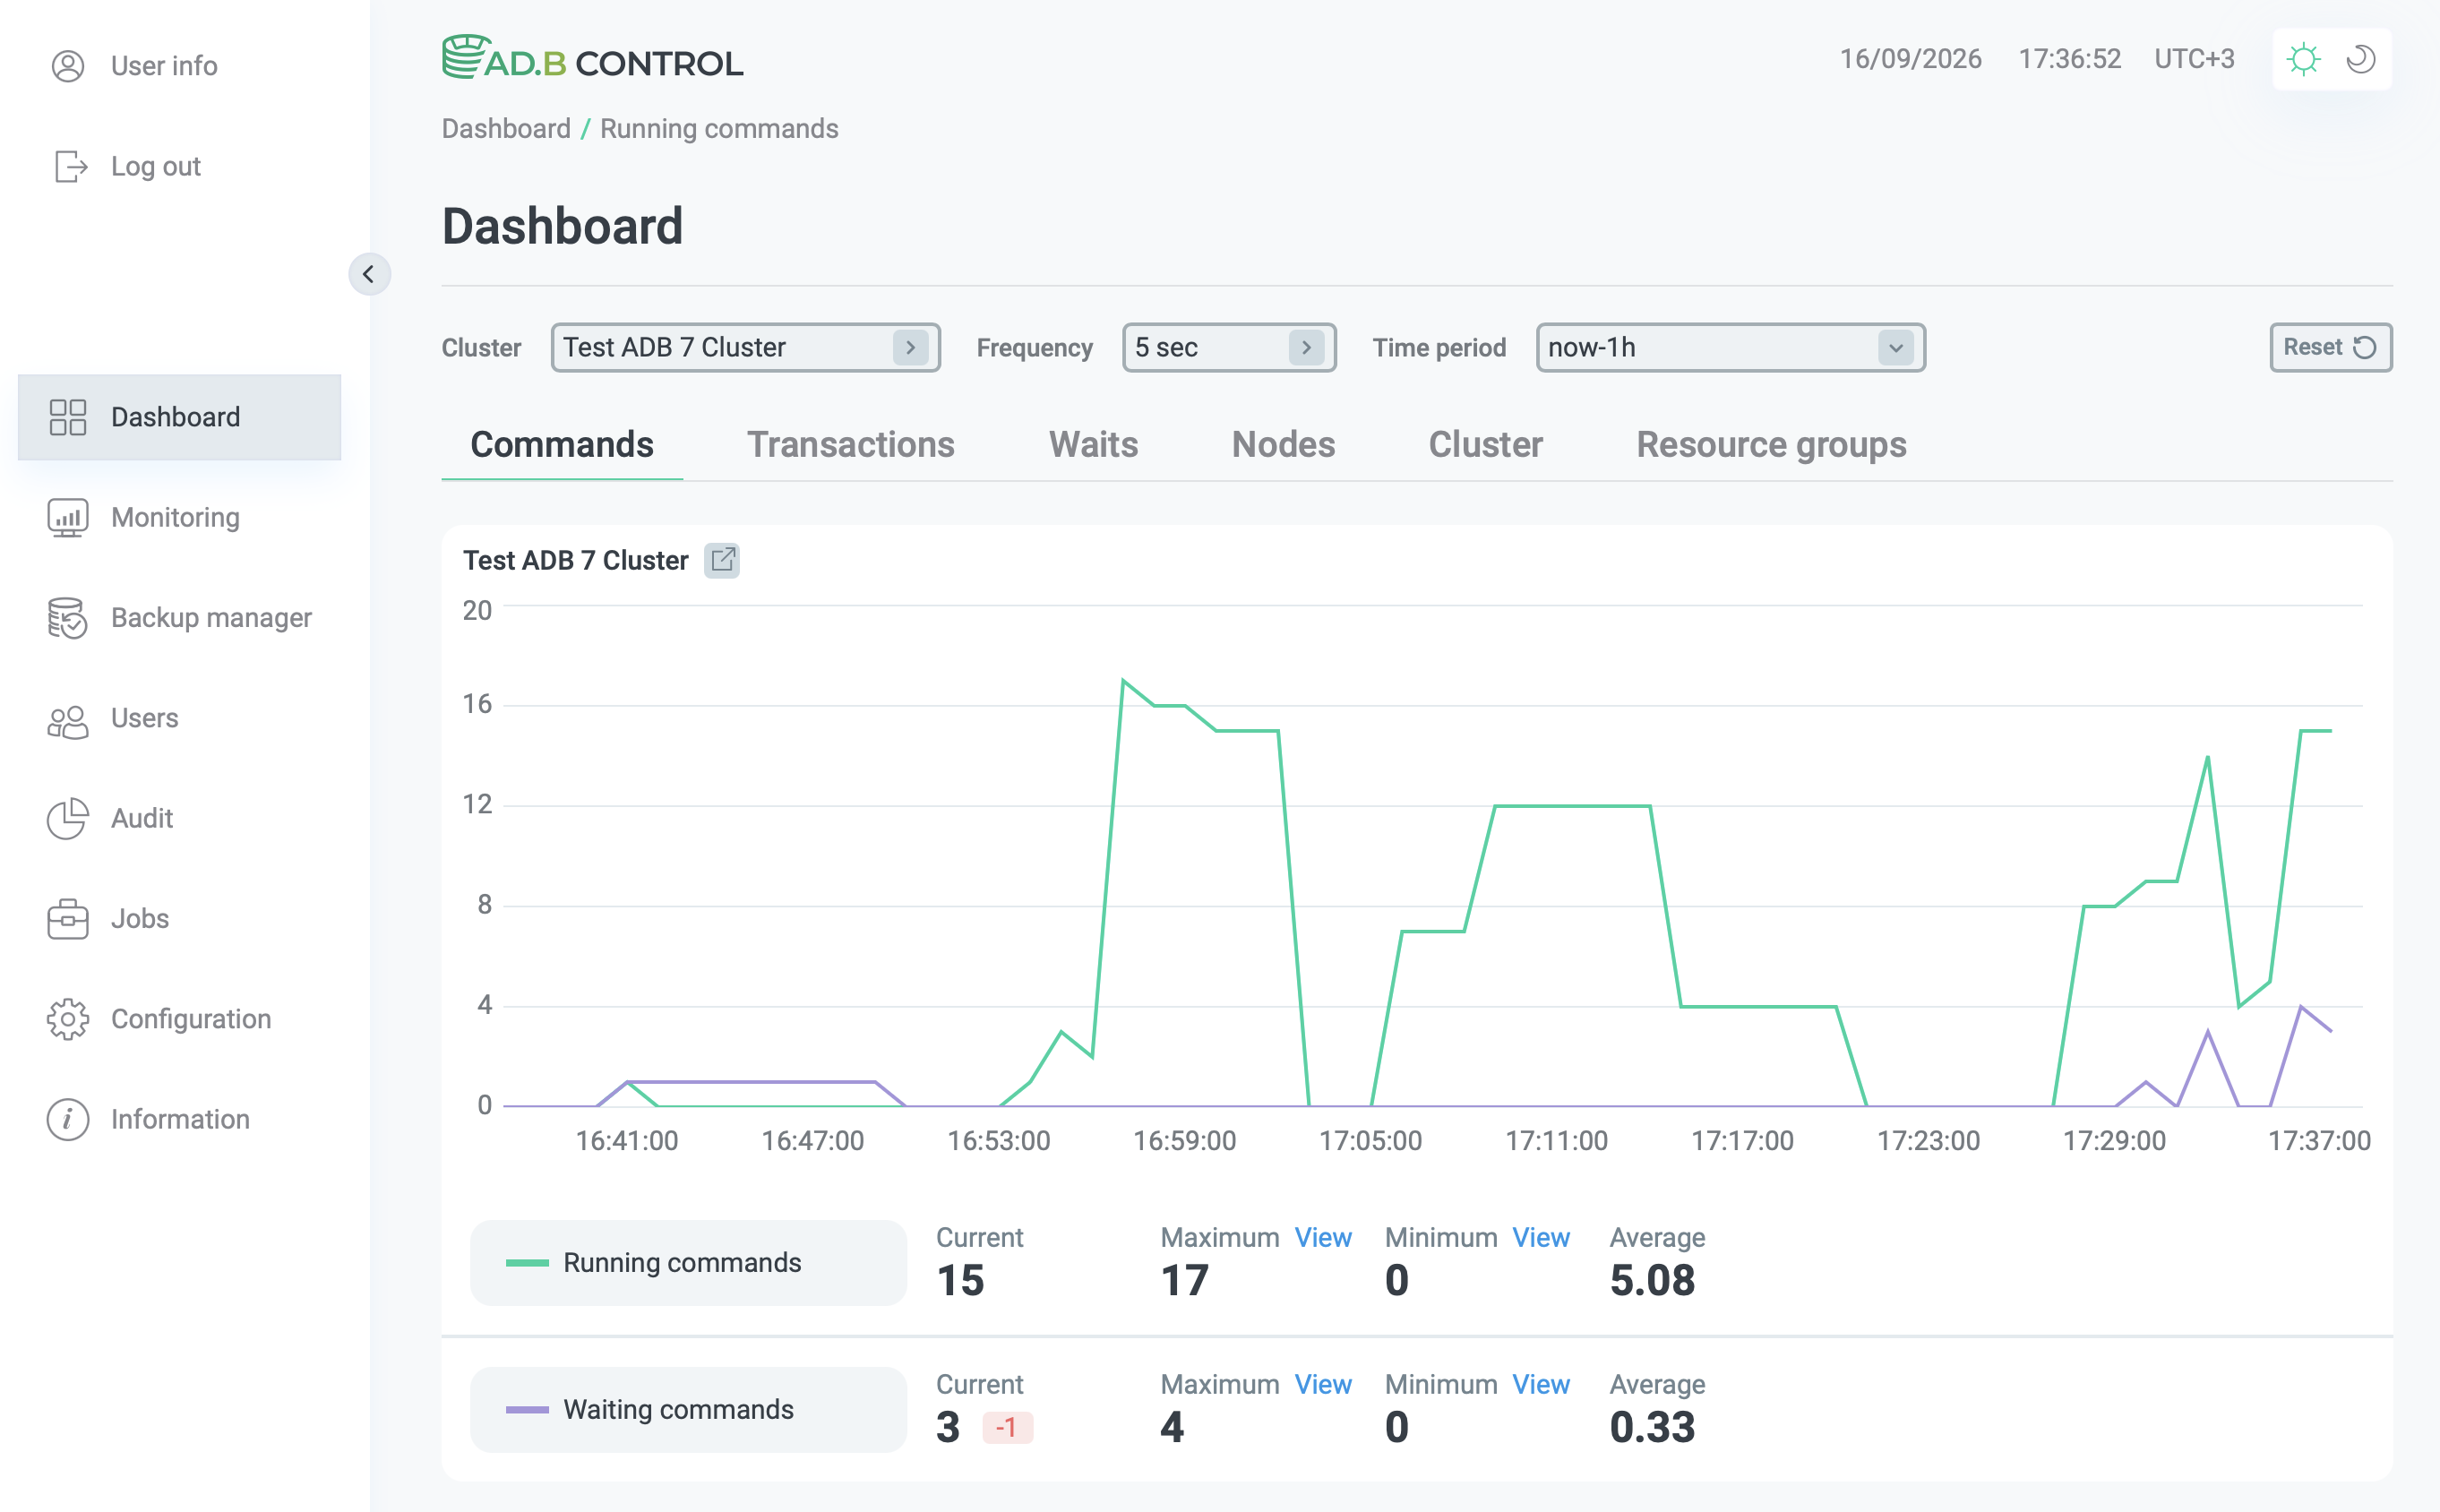
For most of the charts, metrics are collected every 5 seconds, and the smallest time interval shown is 5 seconds. For the Nodes and the Resource groups chart, the metrics are collected once per minute. Data appears on the Nodes chart only if the corresponding execution node is active at the moment of metric collection. Similarly, a resource group activity appears on the Resource groups chart only if it had read or write operations at the moment of metric collection.
To view any chart in full-screen mode, click the 
 icon to the right of the cluster name at the top of the chart.
Configure charts
To configure charts, you can use the following fields at the top of the page:
-
Cluster — the ADB cluster for which all charts should be drawn. Initially, the default cluster is selected.
-
Frequency — defines how often to update charts.
-
Time period — the time range to display on the chart. In the window that opens after clicking the field, you can select an interval from the available options or set a custom time range.
-
Type — defines execution nodes to display on the Nodes chart:
Broadcast motion,Redistribute motion, orDynamic seq scan. SelectAll typesto show all three node types. -
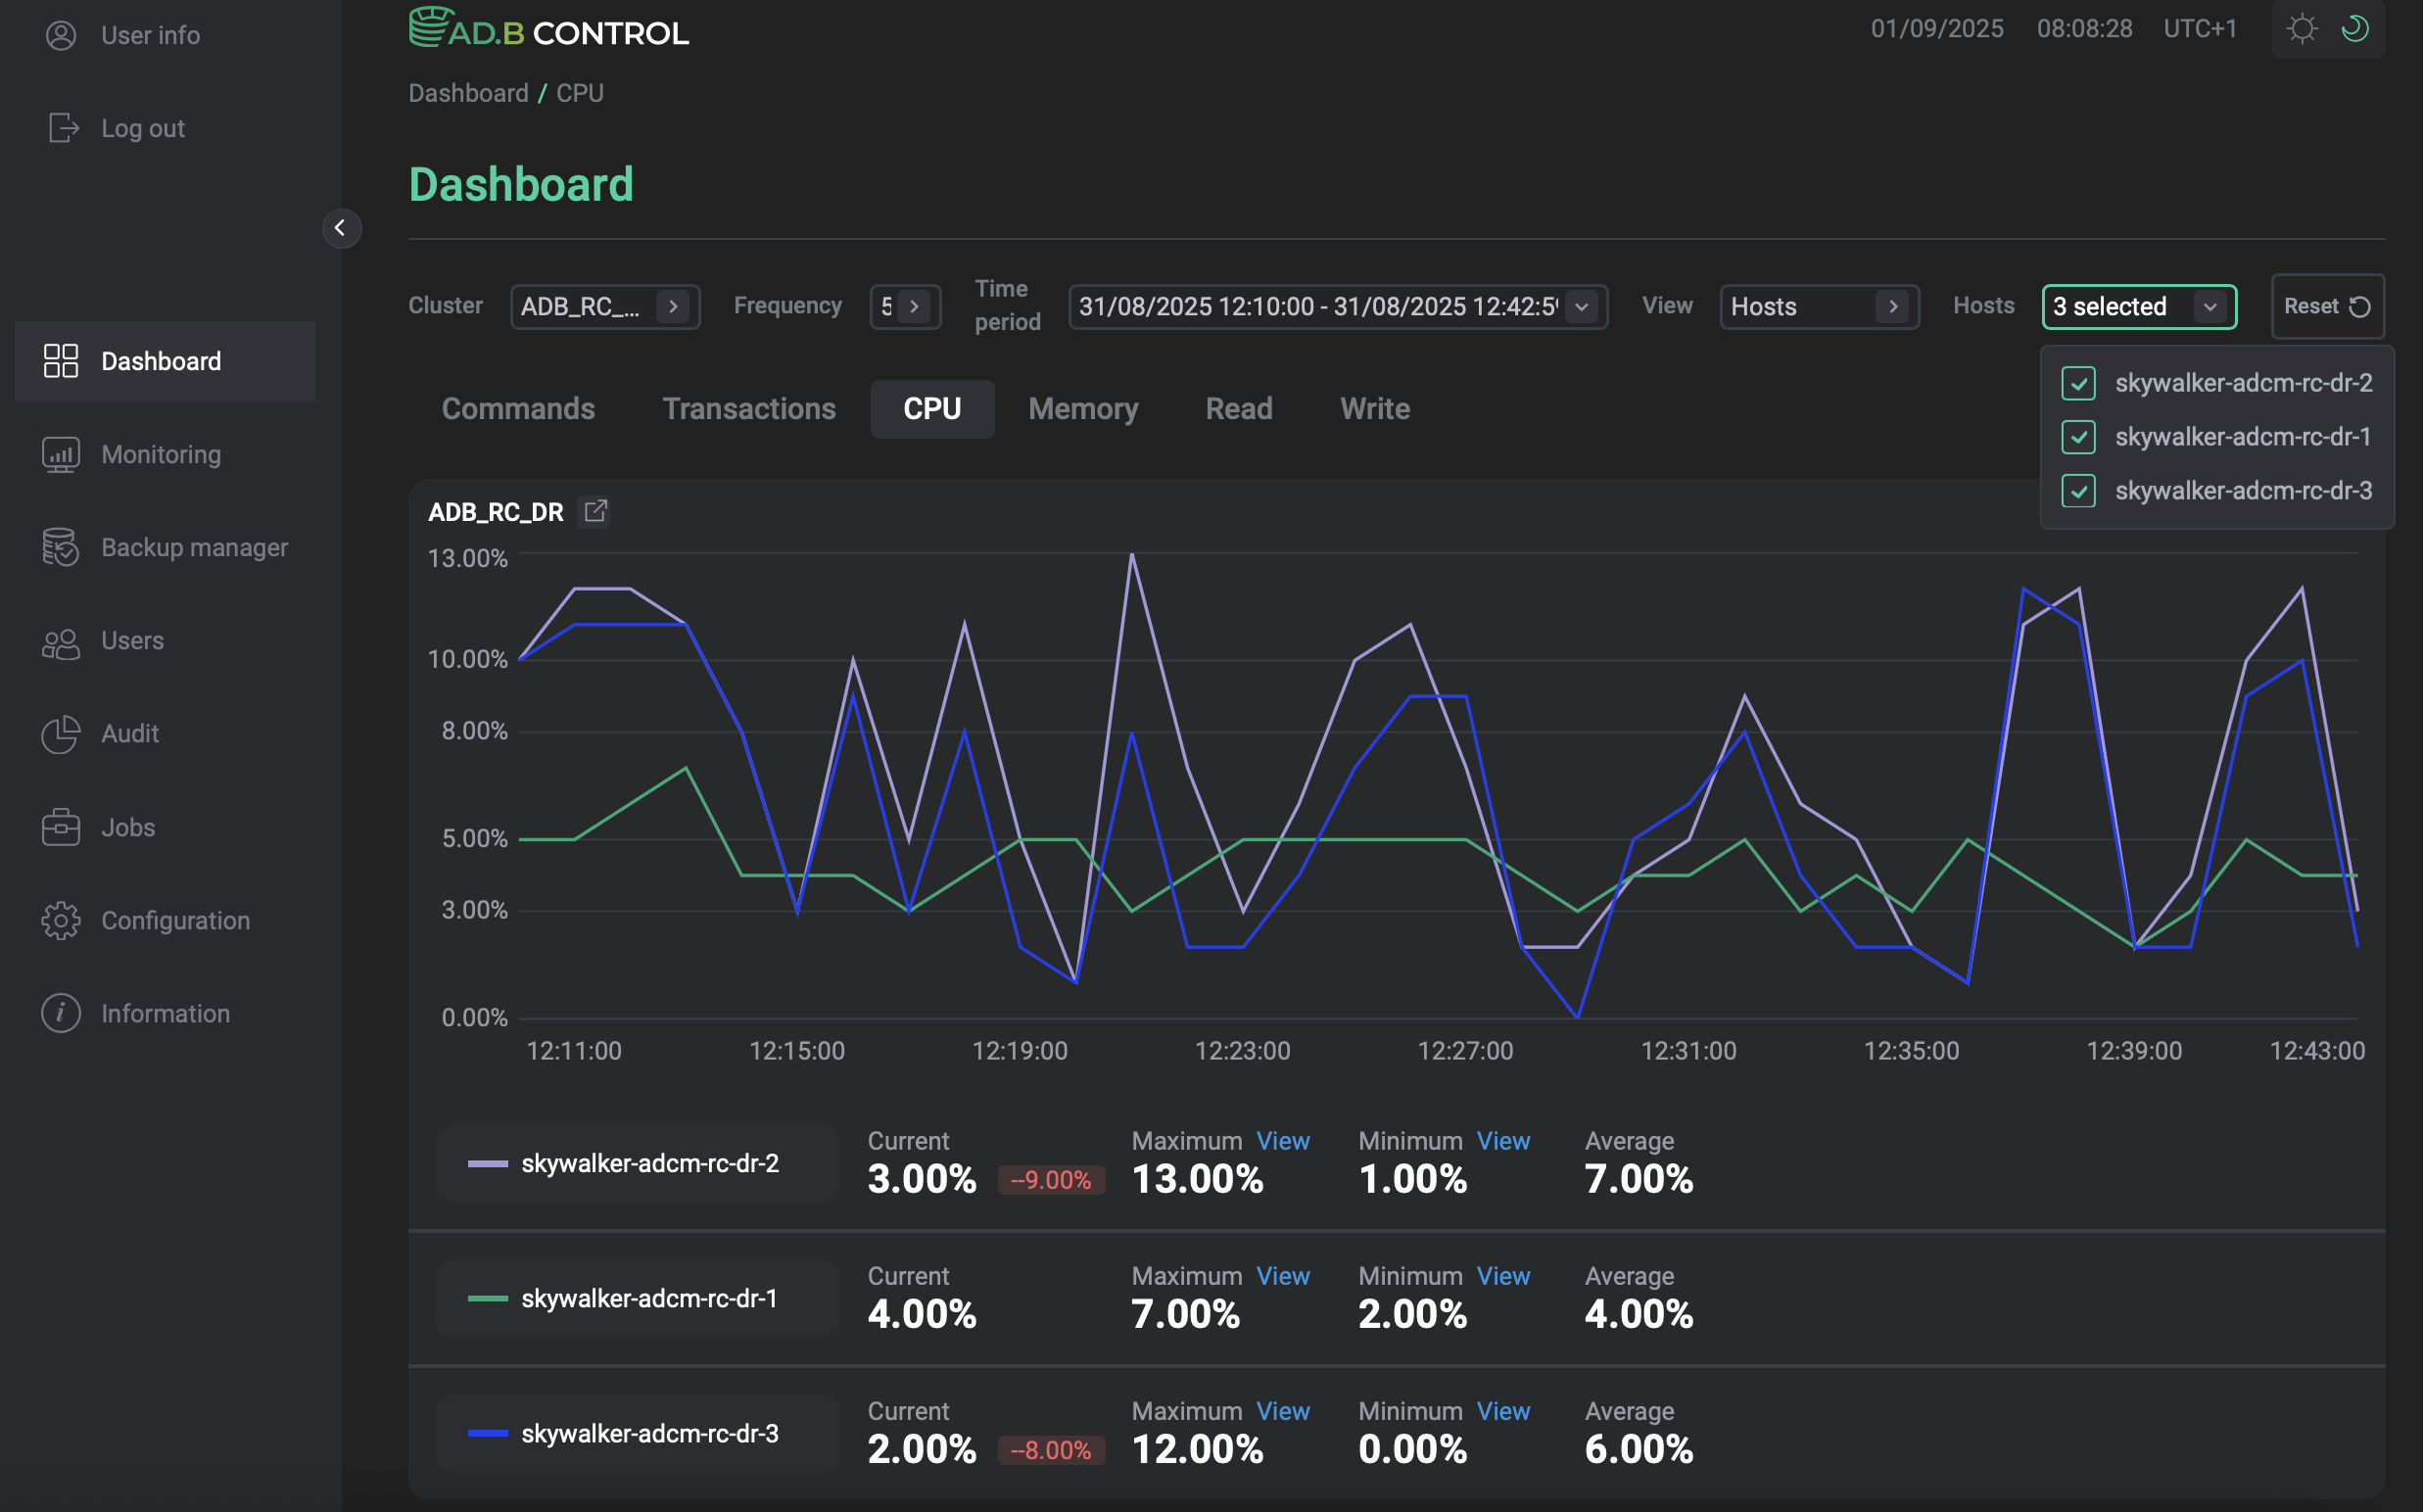
View — defines how to display charts. The field is available on the CPU, Memory, Read, and Write charts. Possible values:
-
Summary— display a summary chart for the whole ADB cluster. -
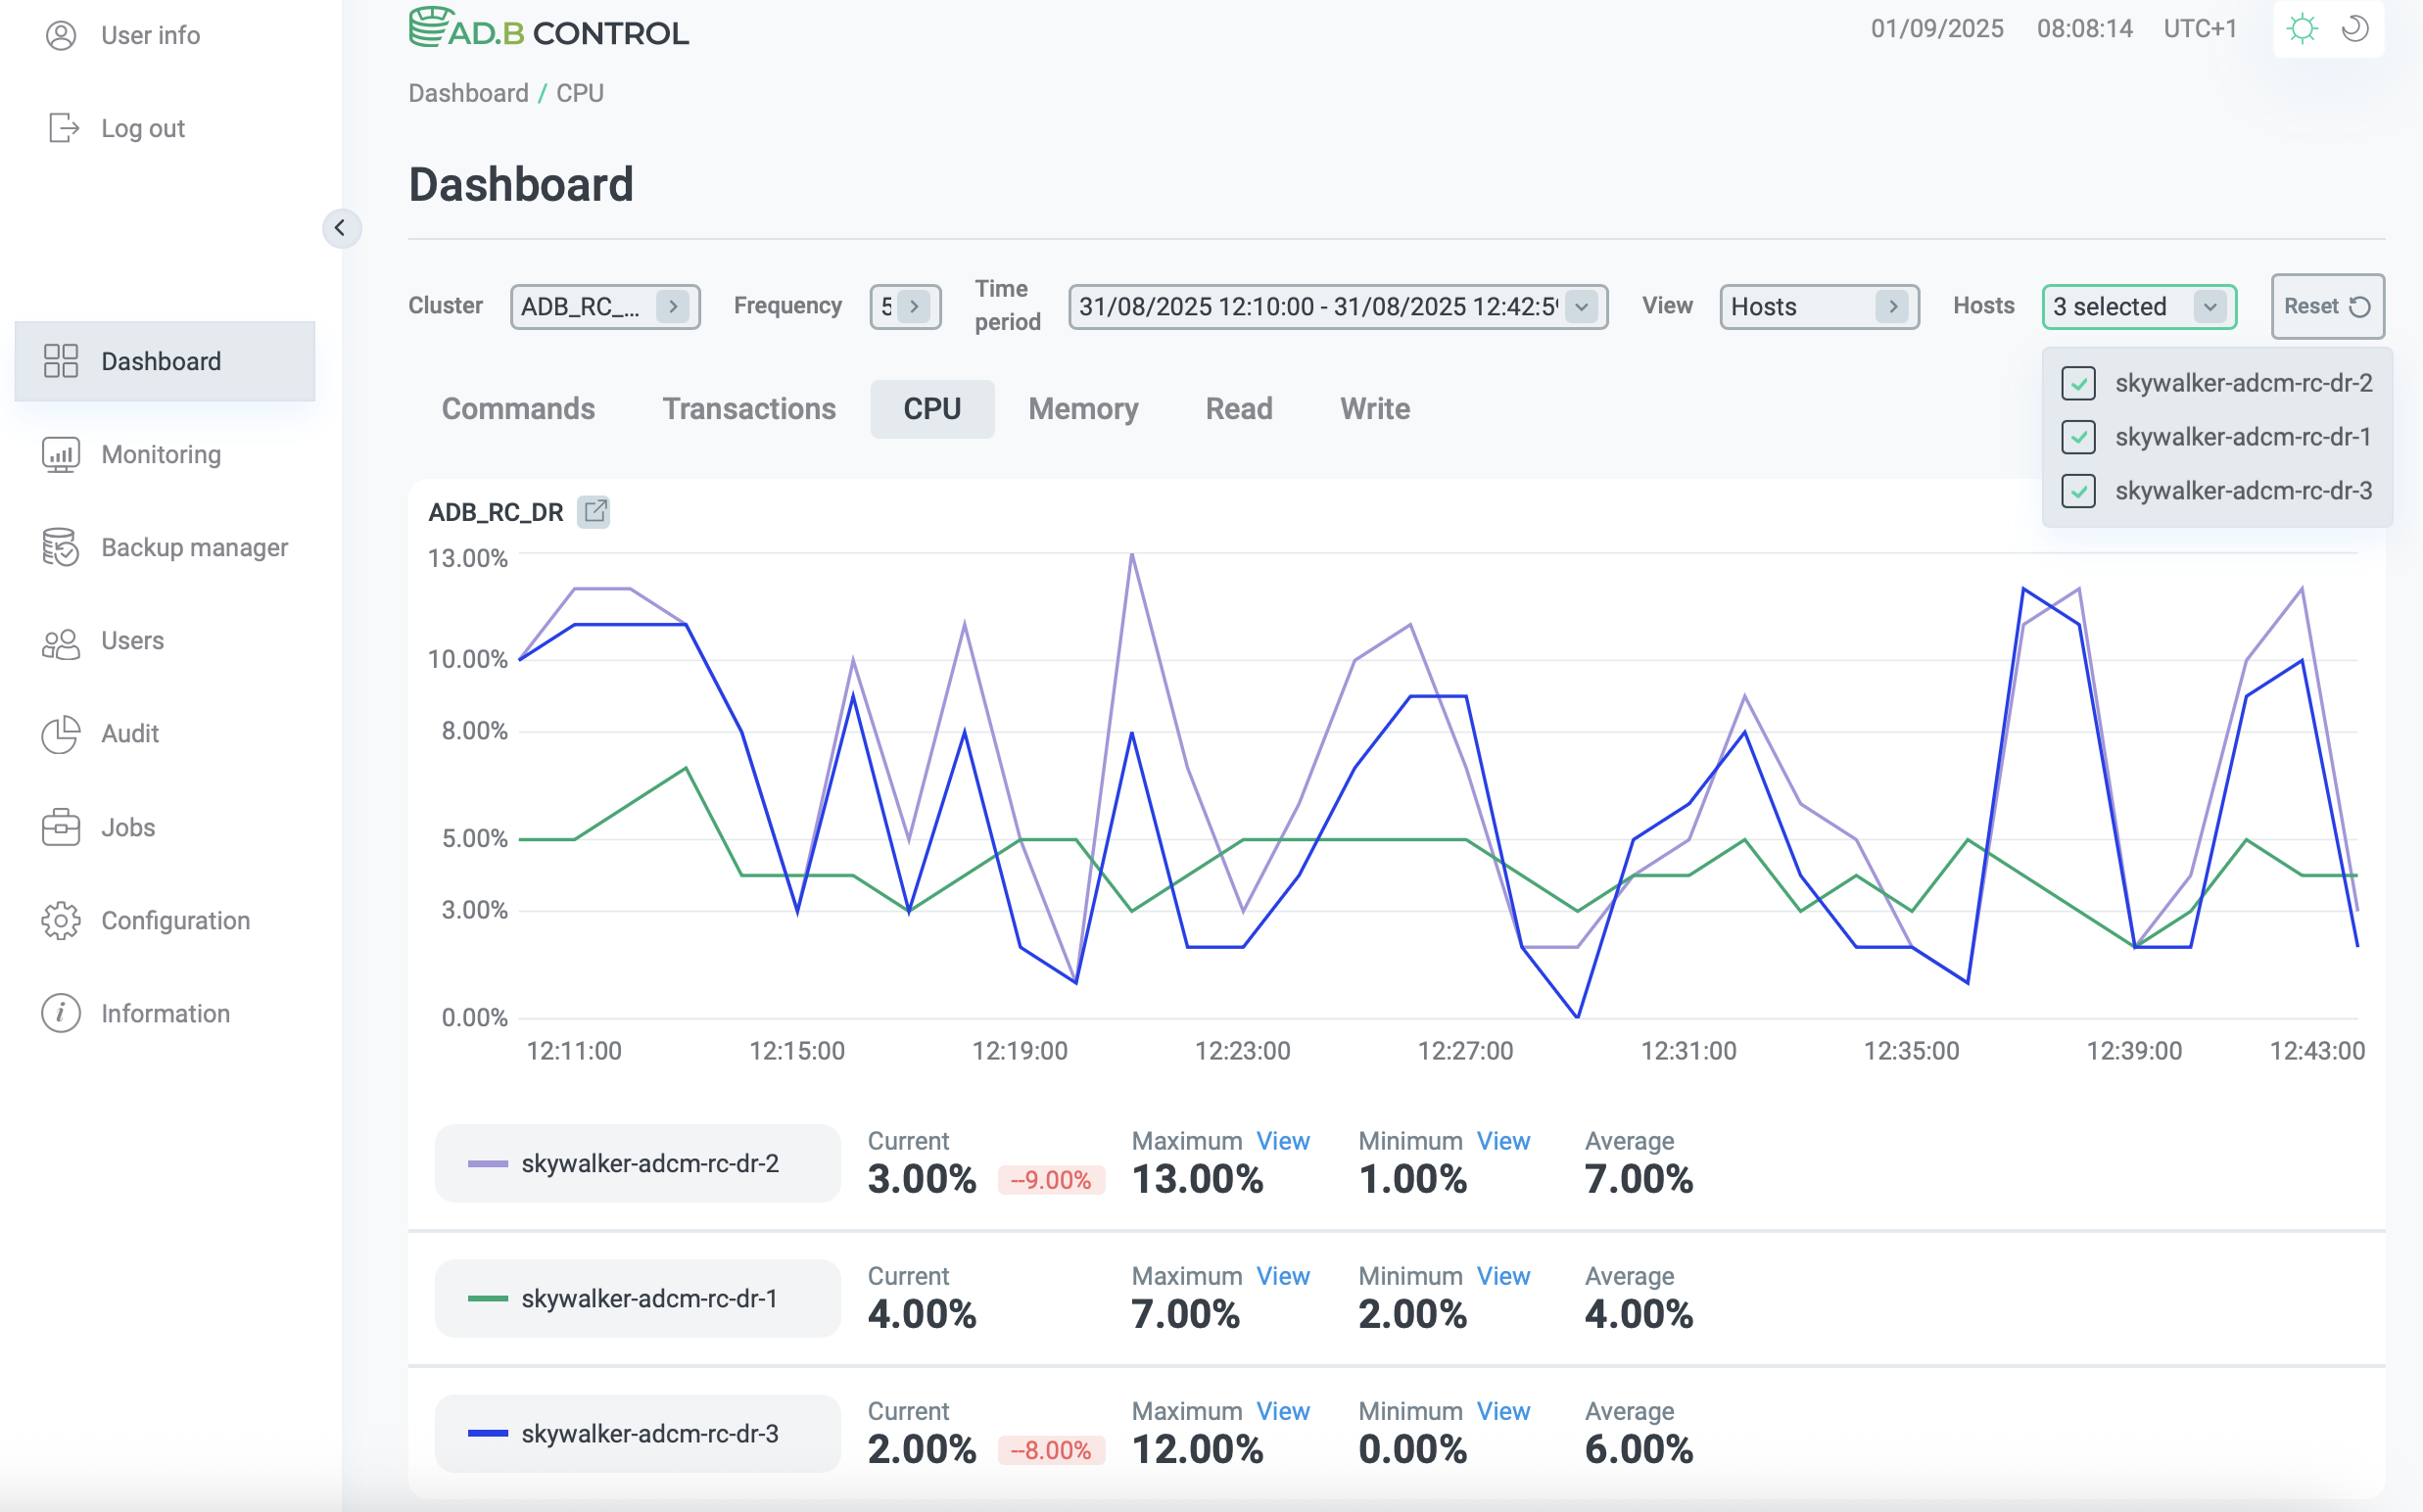
Hosts— display information for each cluster host as a separate chart.
-
-
Hosts — the drop-down list that is used to select cluster hosts. Becomes enabled if the
Hostsvalue is selected in the View field. -
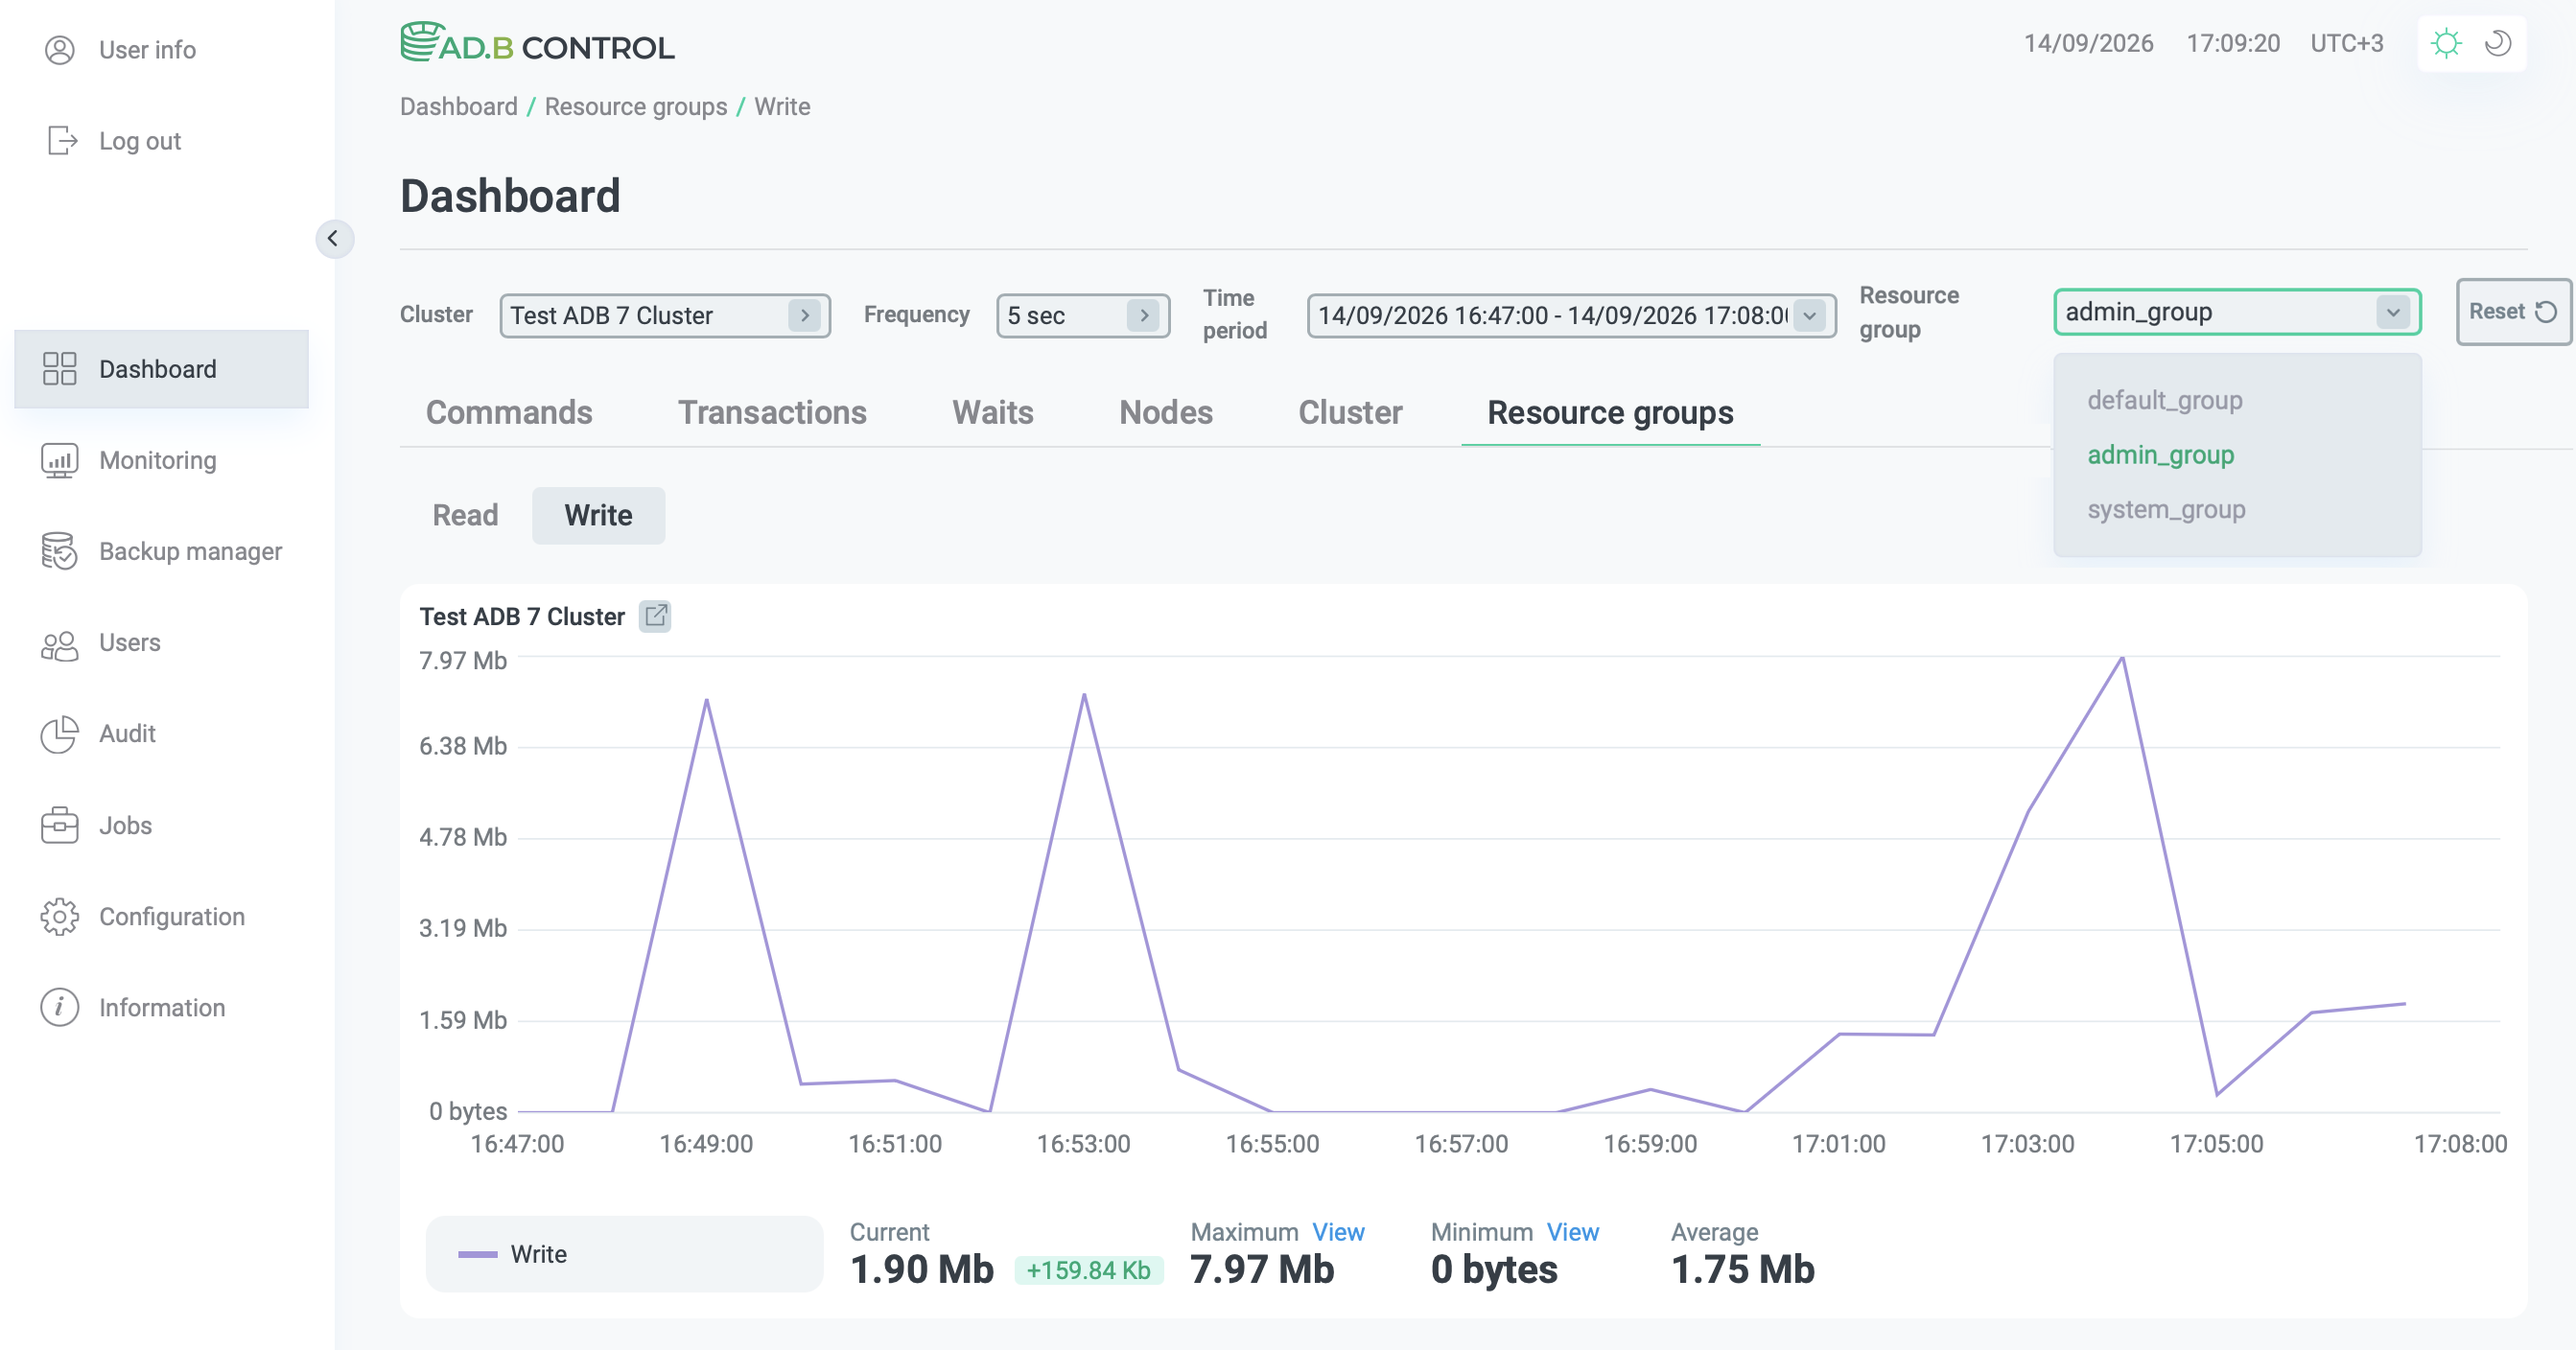
Resource group — defines for which resource group to show read and write throughput.
The figure below shows an example of separate charts displayed for individual cluster hosts.
For ADB 7, read and write throughput charts can be shown for the entire cluster (using the Cluster tab) or for a selected resource group (using the Resource groups tab, as shown in the figure below).
View metrics
On each tab, you can see the following information under charts:
-
Current — the last metric value received over the selected time period. If there is a difference in the metric value between the last two points on the time axis, this difference is shown to the right of the Current value.
-
Maximum — the maximum metric value received over the selected time period. By clicking View, you can navigate to the maximum value on the chart.
-
Minimum — the minimum metric value received over the selected time period. By clicking View, you can navigate to the minimum value on the chart.
-
Average — the average value, which is calculated based on all metric values received over the selected time period.


The figure below shows how to highlight the maximum or minimum metric value on the chart by clicking View.
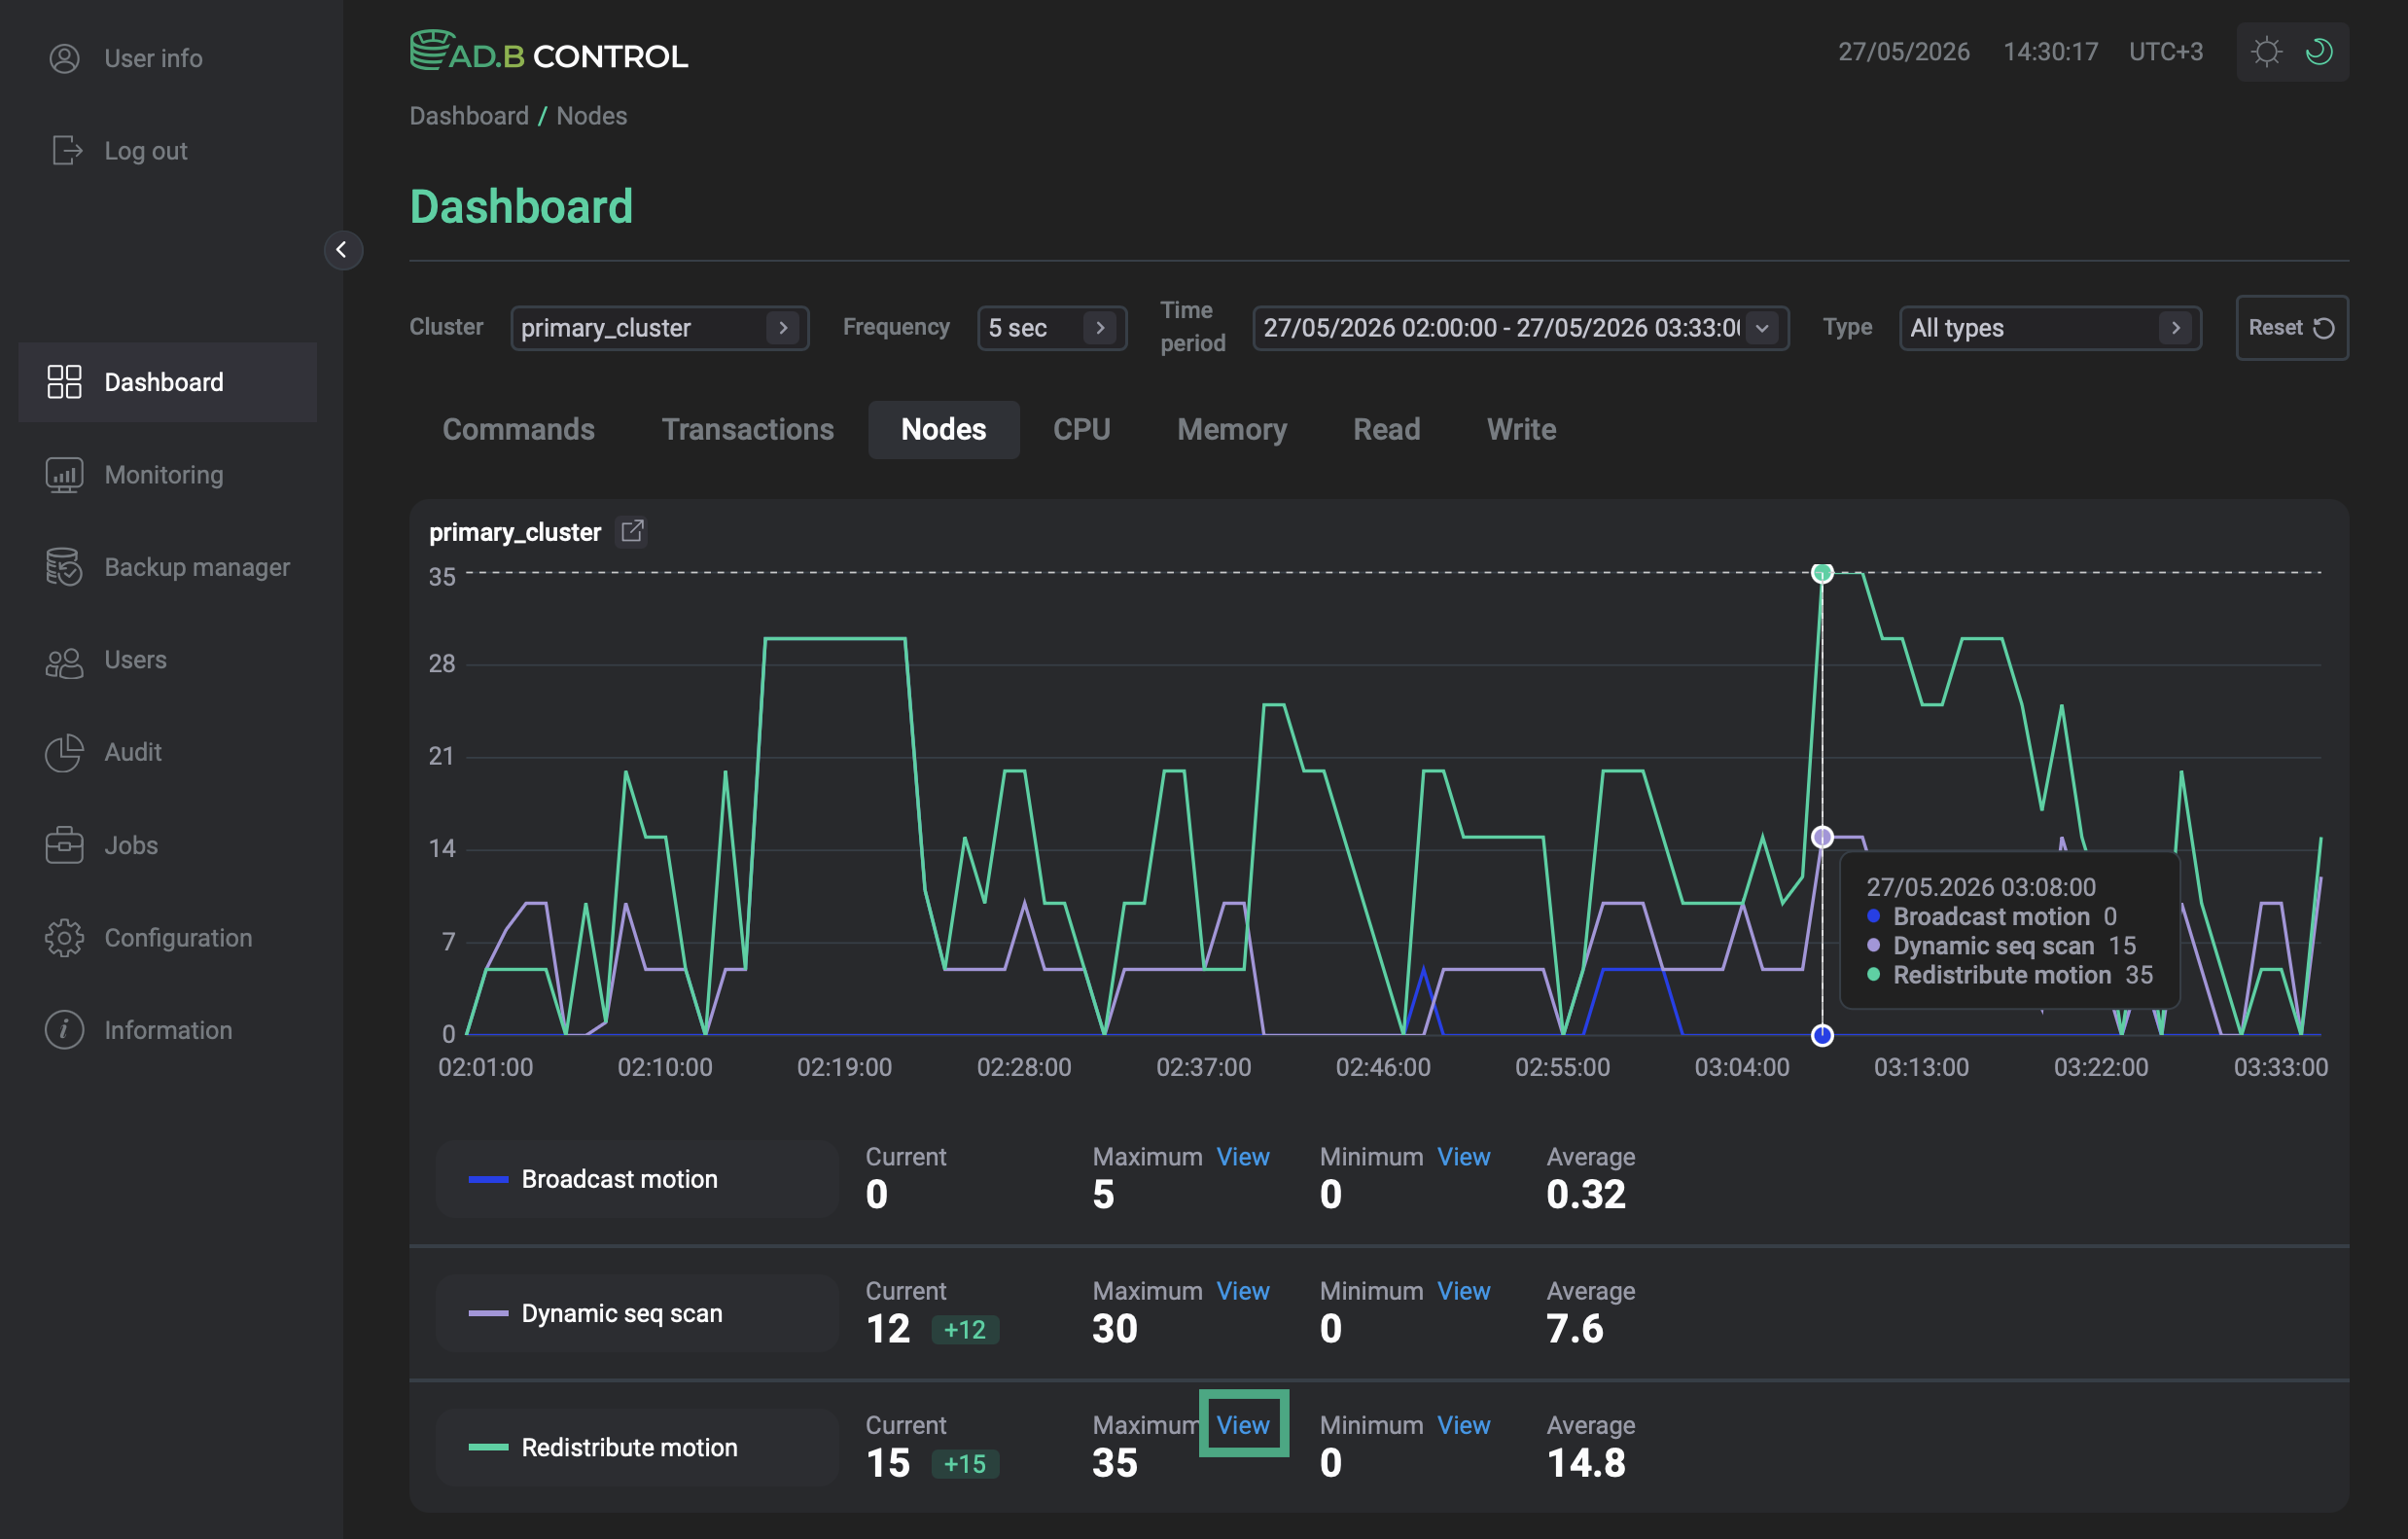
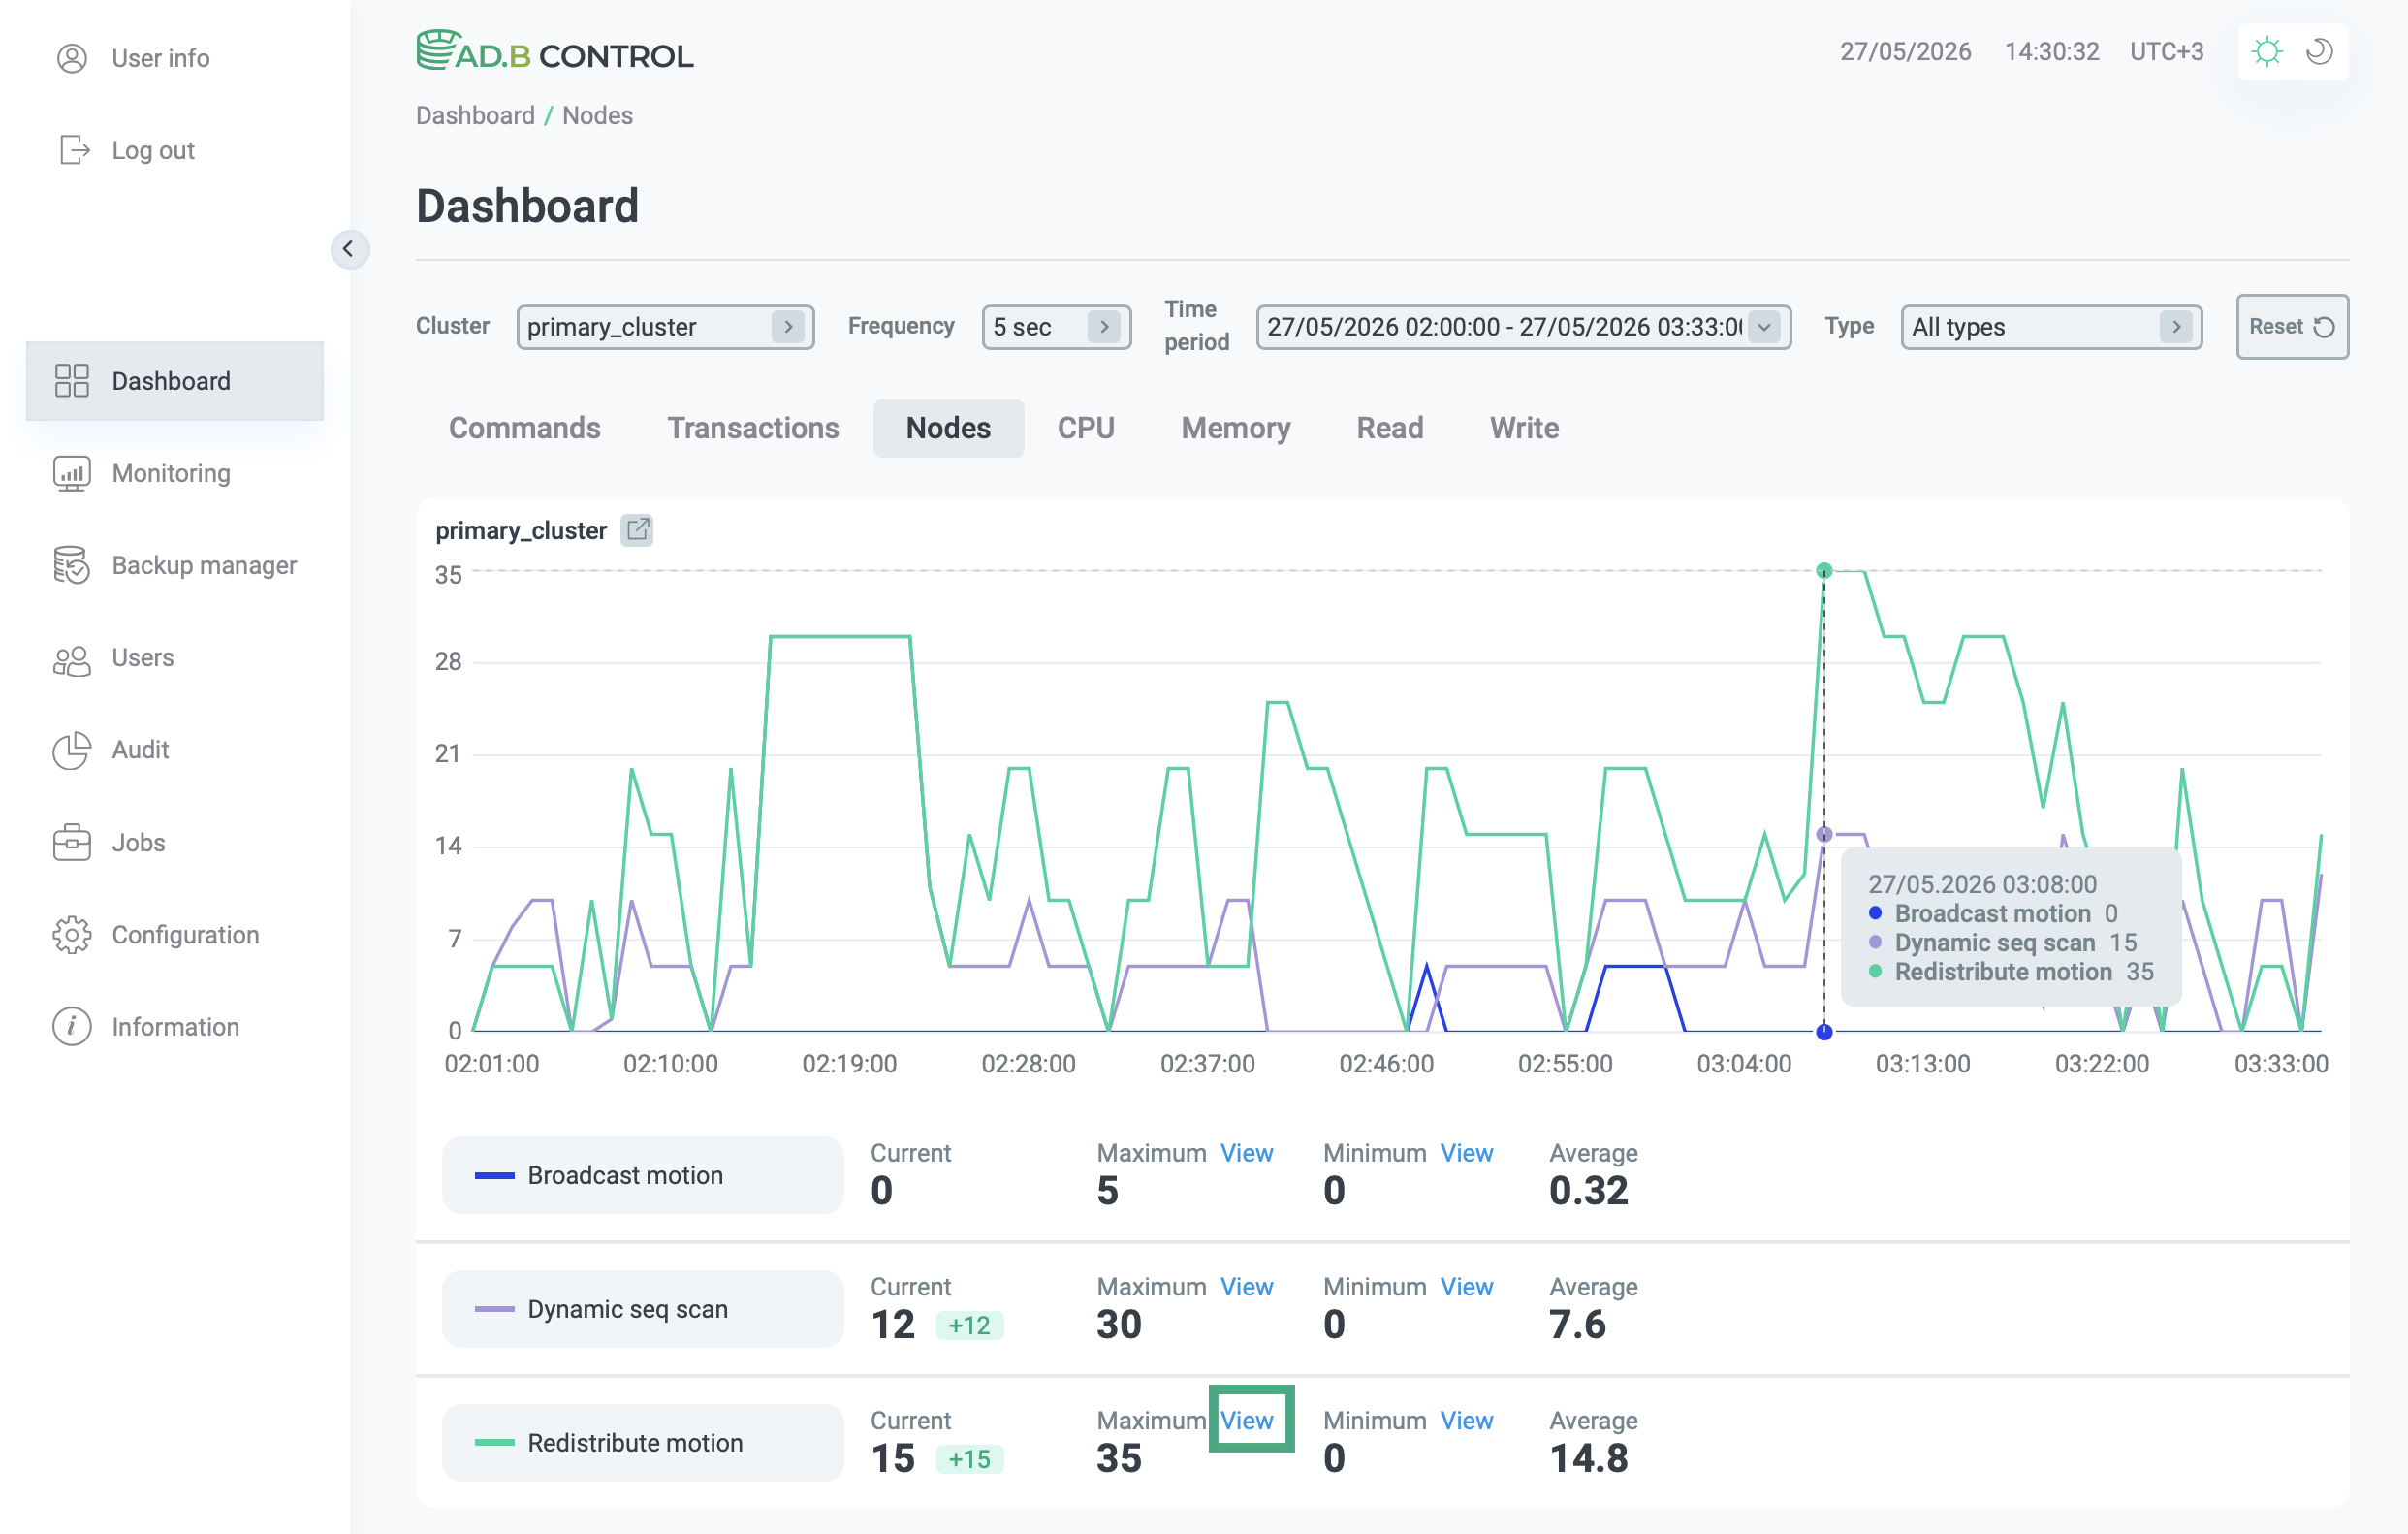
You can also see a metric value for any specific time point by hovering over the chart.