

ADB ES monitoring metrics
This article describes metrics for monitoring an ADB ES cluster. For information on how to install monitoring, refer to Install monitoring.
Overview
The Monitoring service consists of the following components:
-
Node Exporter — exposes hardware- and OS-related metrics, such as memory and CPU usage or filesystem space. These metrics are available on the port and endpoint specified in the Node Exporter settings section of the Monitoring service configuration (
11203/metricsby default). -
Process Exporter — collects metrics for the specified processes. In ADB ES, these are processes related to ADBM and ADB Control. Note that processes related to ADBM and ADB Control agents are monitored by the Monitoring service deployed in ADB. The Process Exporter metrics are available on the port specified in the Process exporter settings section of the Monitoring service configuration (
9256by default). -
Prometheus — scrapes and stores metrics from the configured data sources: Node Exporter and Process Exporter. These metrics are available in the Prometheus web interface on the port specified in the Prometheus settings section of the Monitoring service configuration (
11200by default). -
Grafana — uses Prometheus as a data source and visualizes its metrics as graphs and charts organized into dashboards. These dashboards are available in the Grafana web interface on the port specified in the Grafana settings section of the Monitoring service configuration (
11210by default).
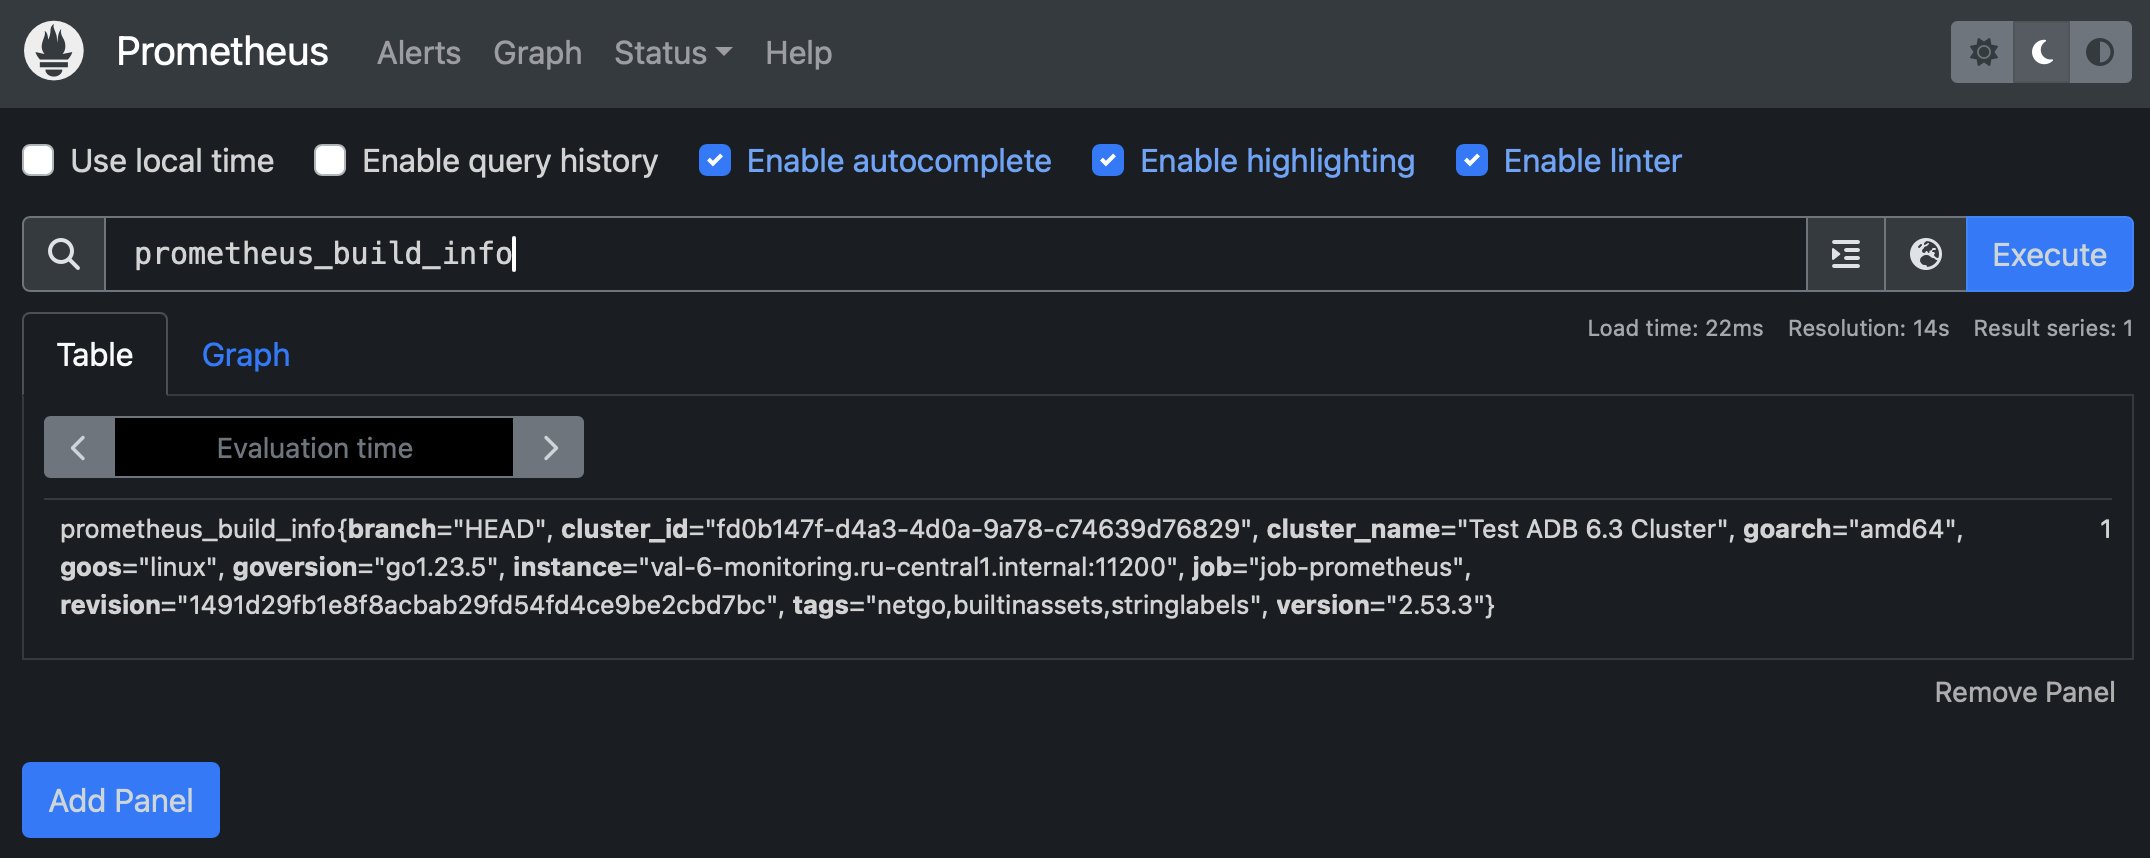
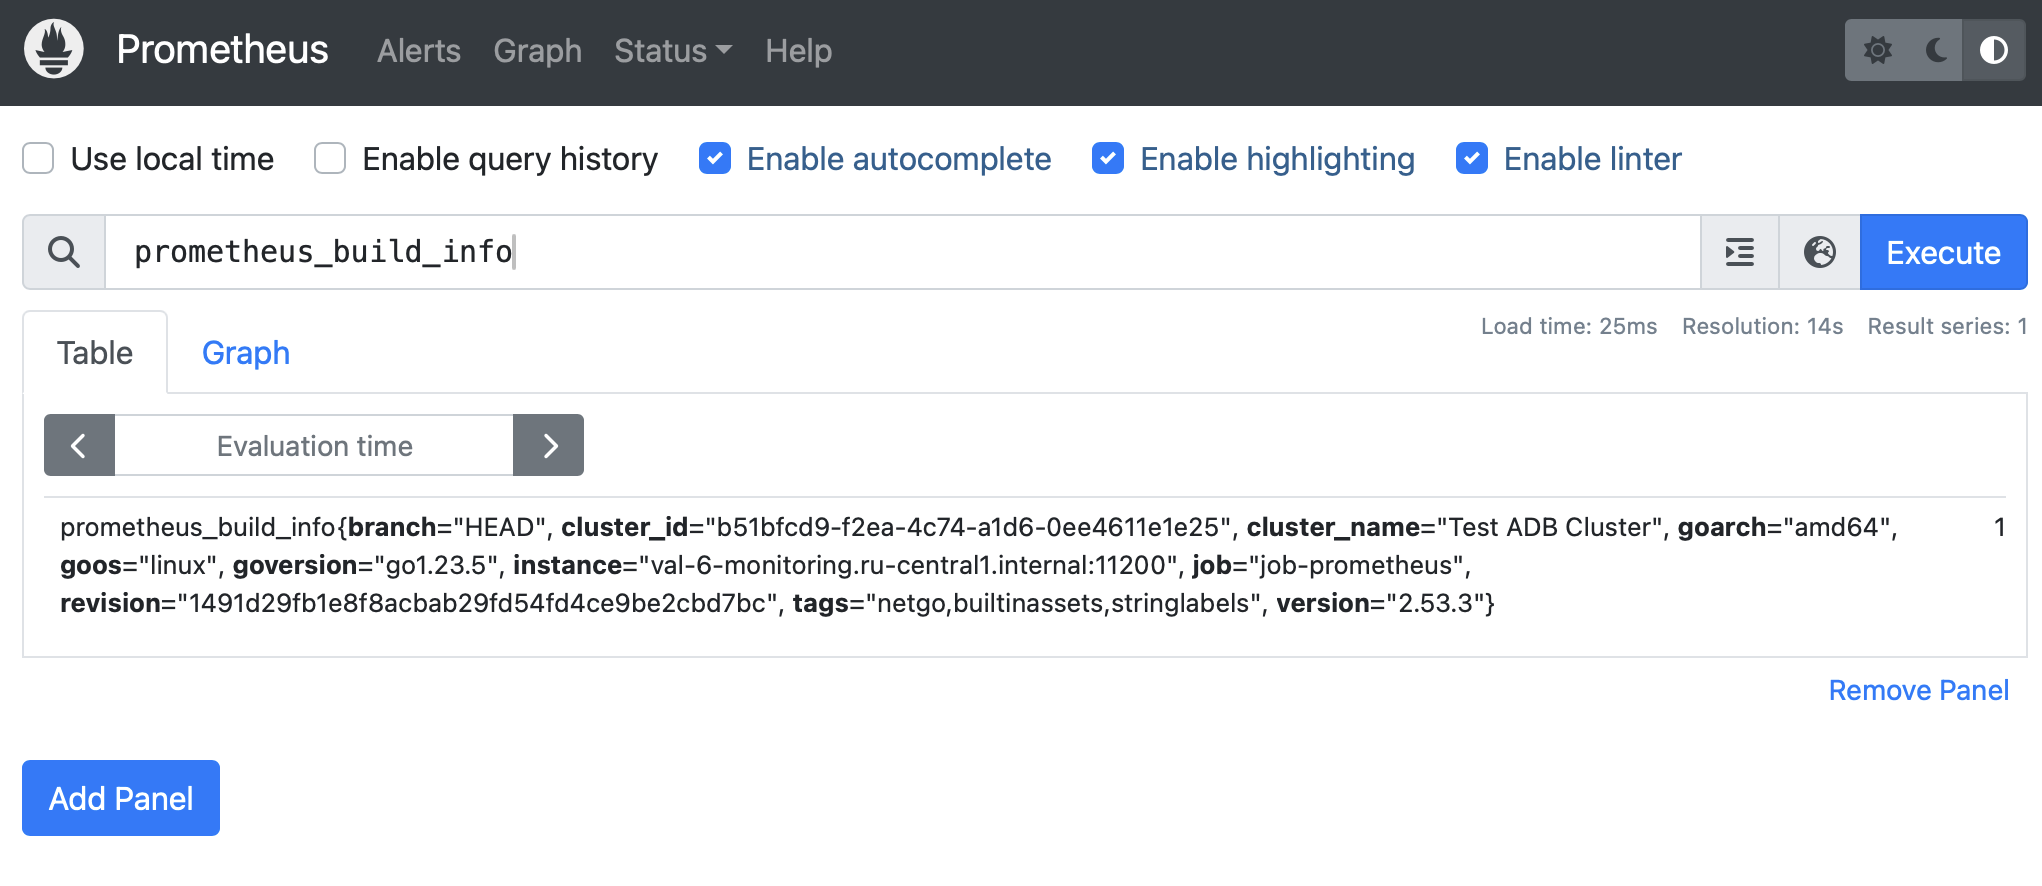
View metrics in Prometheus
Prometheus is a monitoring and alerting toolkit. Prometheus collects metrics from exporters, and Grafana sends requests to Prometheus to collect data for its dashboards. If Grafana dashboards show empty panels or unexpected values, checking Prometheus helps determine whether the issue is related to metric collection or dashboard configuration:
-
In your browser, enter
<IP address of monitoring server>:<port>. The default port is11200, and it can be changed in the Prometheus settings section in the Monitoring service configuration.The IP address, port, and hostname of Prometheus are also available on the Info tab of the Monitoring service.
-
In the window that opens, enter the user name and the password that you have configured in the Prometheus users to login/logout to Prometheus field in the Monitoring service configuration.
In the Prometheus web interface, you can check its configuration and the state of the exporters (on the Targets page). You can also use the Prometheus Query Language (PromQL) to check specific metrics.
Grafana dashboards
Grafana allows you to visualize metrics stored in Prometheus, create your own dashboards, or modify existing ones.
Open Grafana
-
In your browser, enter
<IP address of monitoring server>:<port>. The default port is11210, and it can be changed in the Grafana settings section in the Monitoring service configuration.The IP address, port, and hostname of Grafana are also available on the Info tab of the Monitoring service.
-
In the window that opens, in the Email or username field, enter
adminand in the Password field enter the password that you have configured in the Grafana administrator’s password field in the Monitoring service configuration.
By default, the following dashboards are available in Grafana:
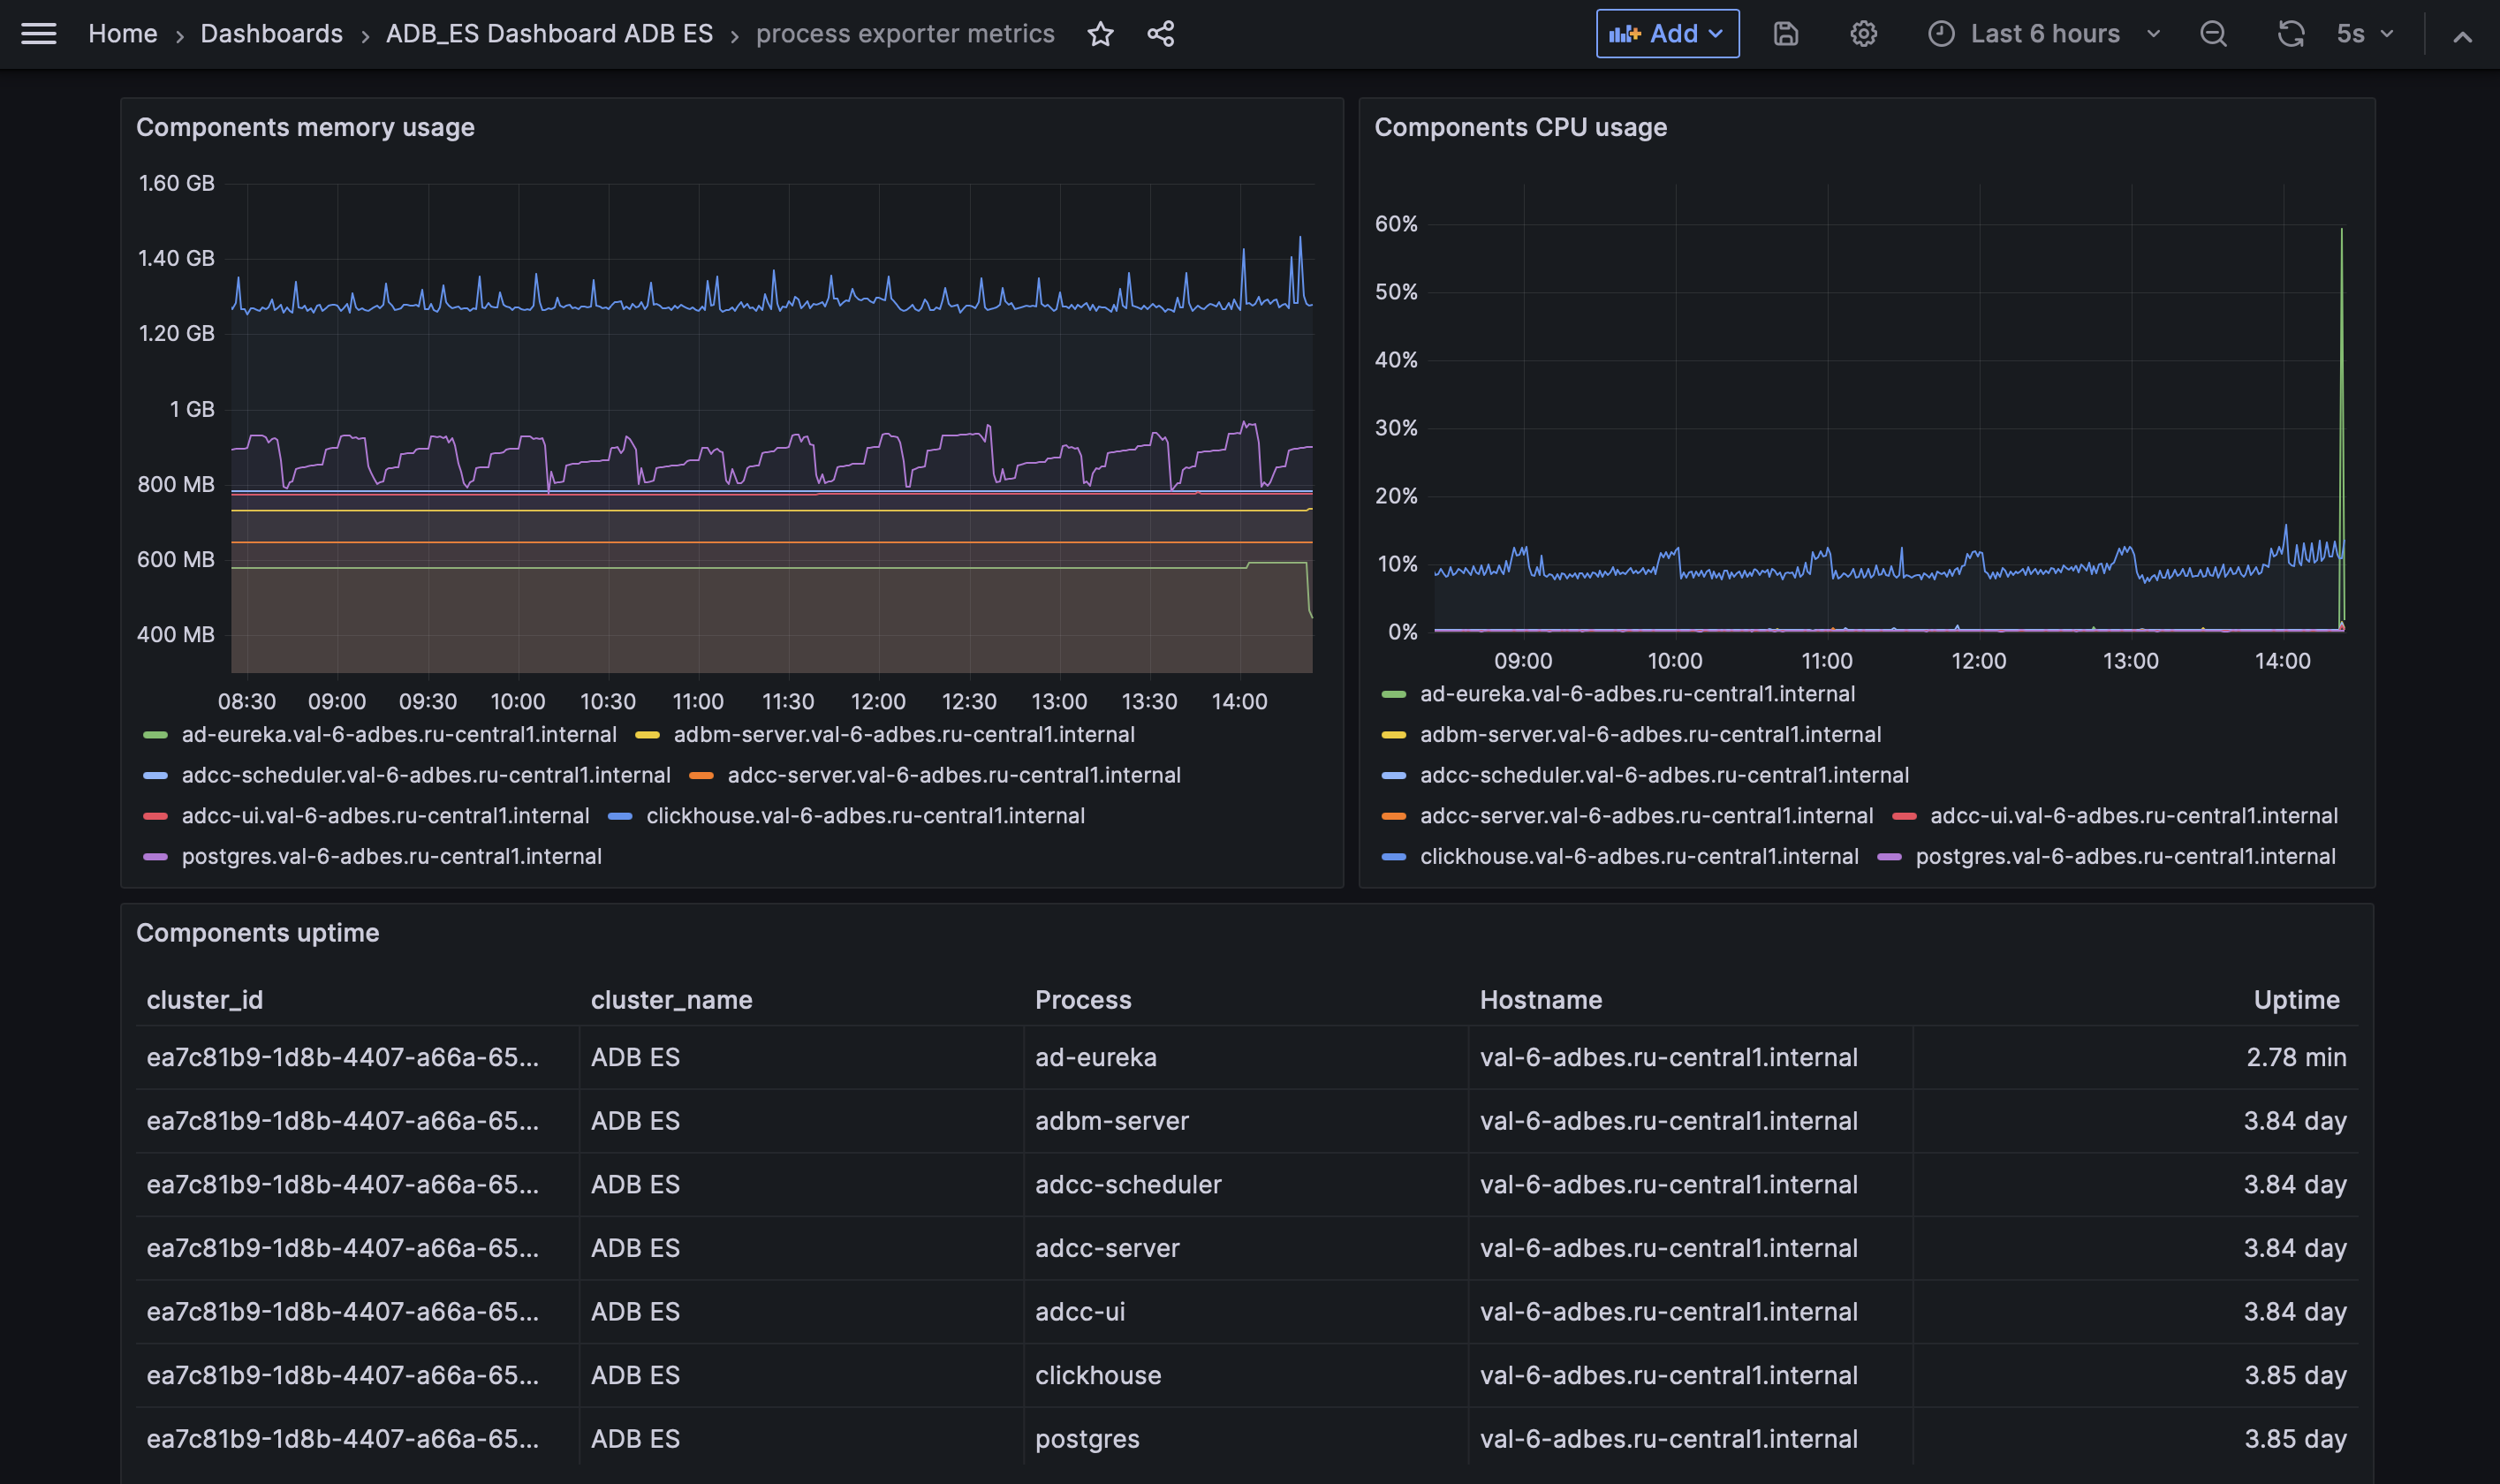
Process exporter metrics
This dashboard provides monitoring for essential ADBM and ADB Control components and database processes using metric provided by Process Exporter. The tracked processes are:
-
adbm-server— ADBM Backend Server; -
adcc-server— ADB Control Backend Server; -
adcc-scheduler— ADB Control Scheduler; -
adcc-ui— ADB Control UI Server; -
clickhouse— ClickHouse DBMS used in ADB Control (tracked only if you use the internal Arenadata QuickMarts (ADQM) instance provided by the ADB ES bundle); -
postgres— PostgreSQL used by ADB Control and ADBM (tracked only if you use the internal Arenadata Postgres (ADPG) instance provided by the ADB ES bundle); -
ad-eureka— Arenadata Service Registry.
| Panel name | Description |
|---|---|
Components uptime |
Current uptime for each tracked process |
Components memory usage |
Memory usage of each process over time |
Components CPU usage |
CPU usage of each process over time |
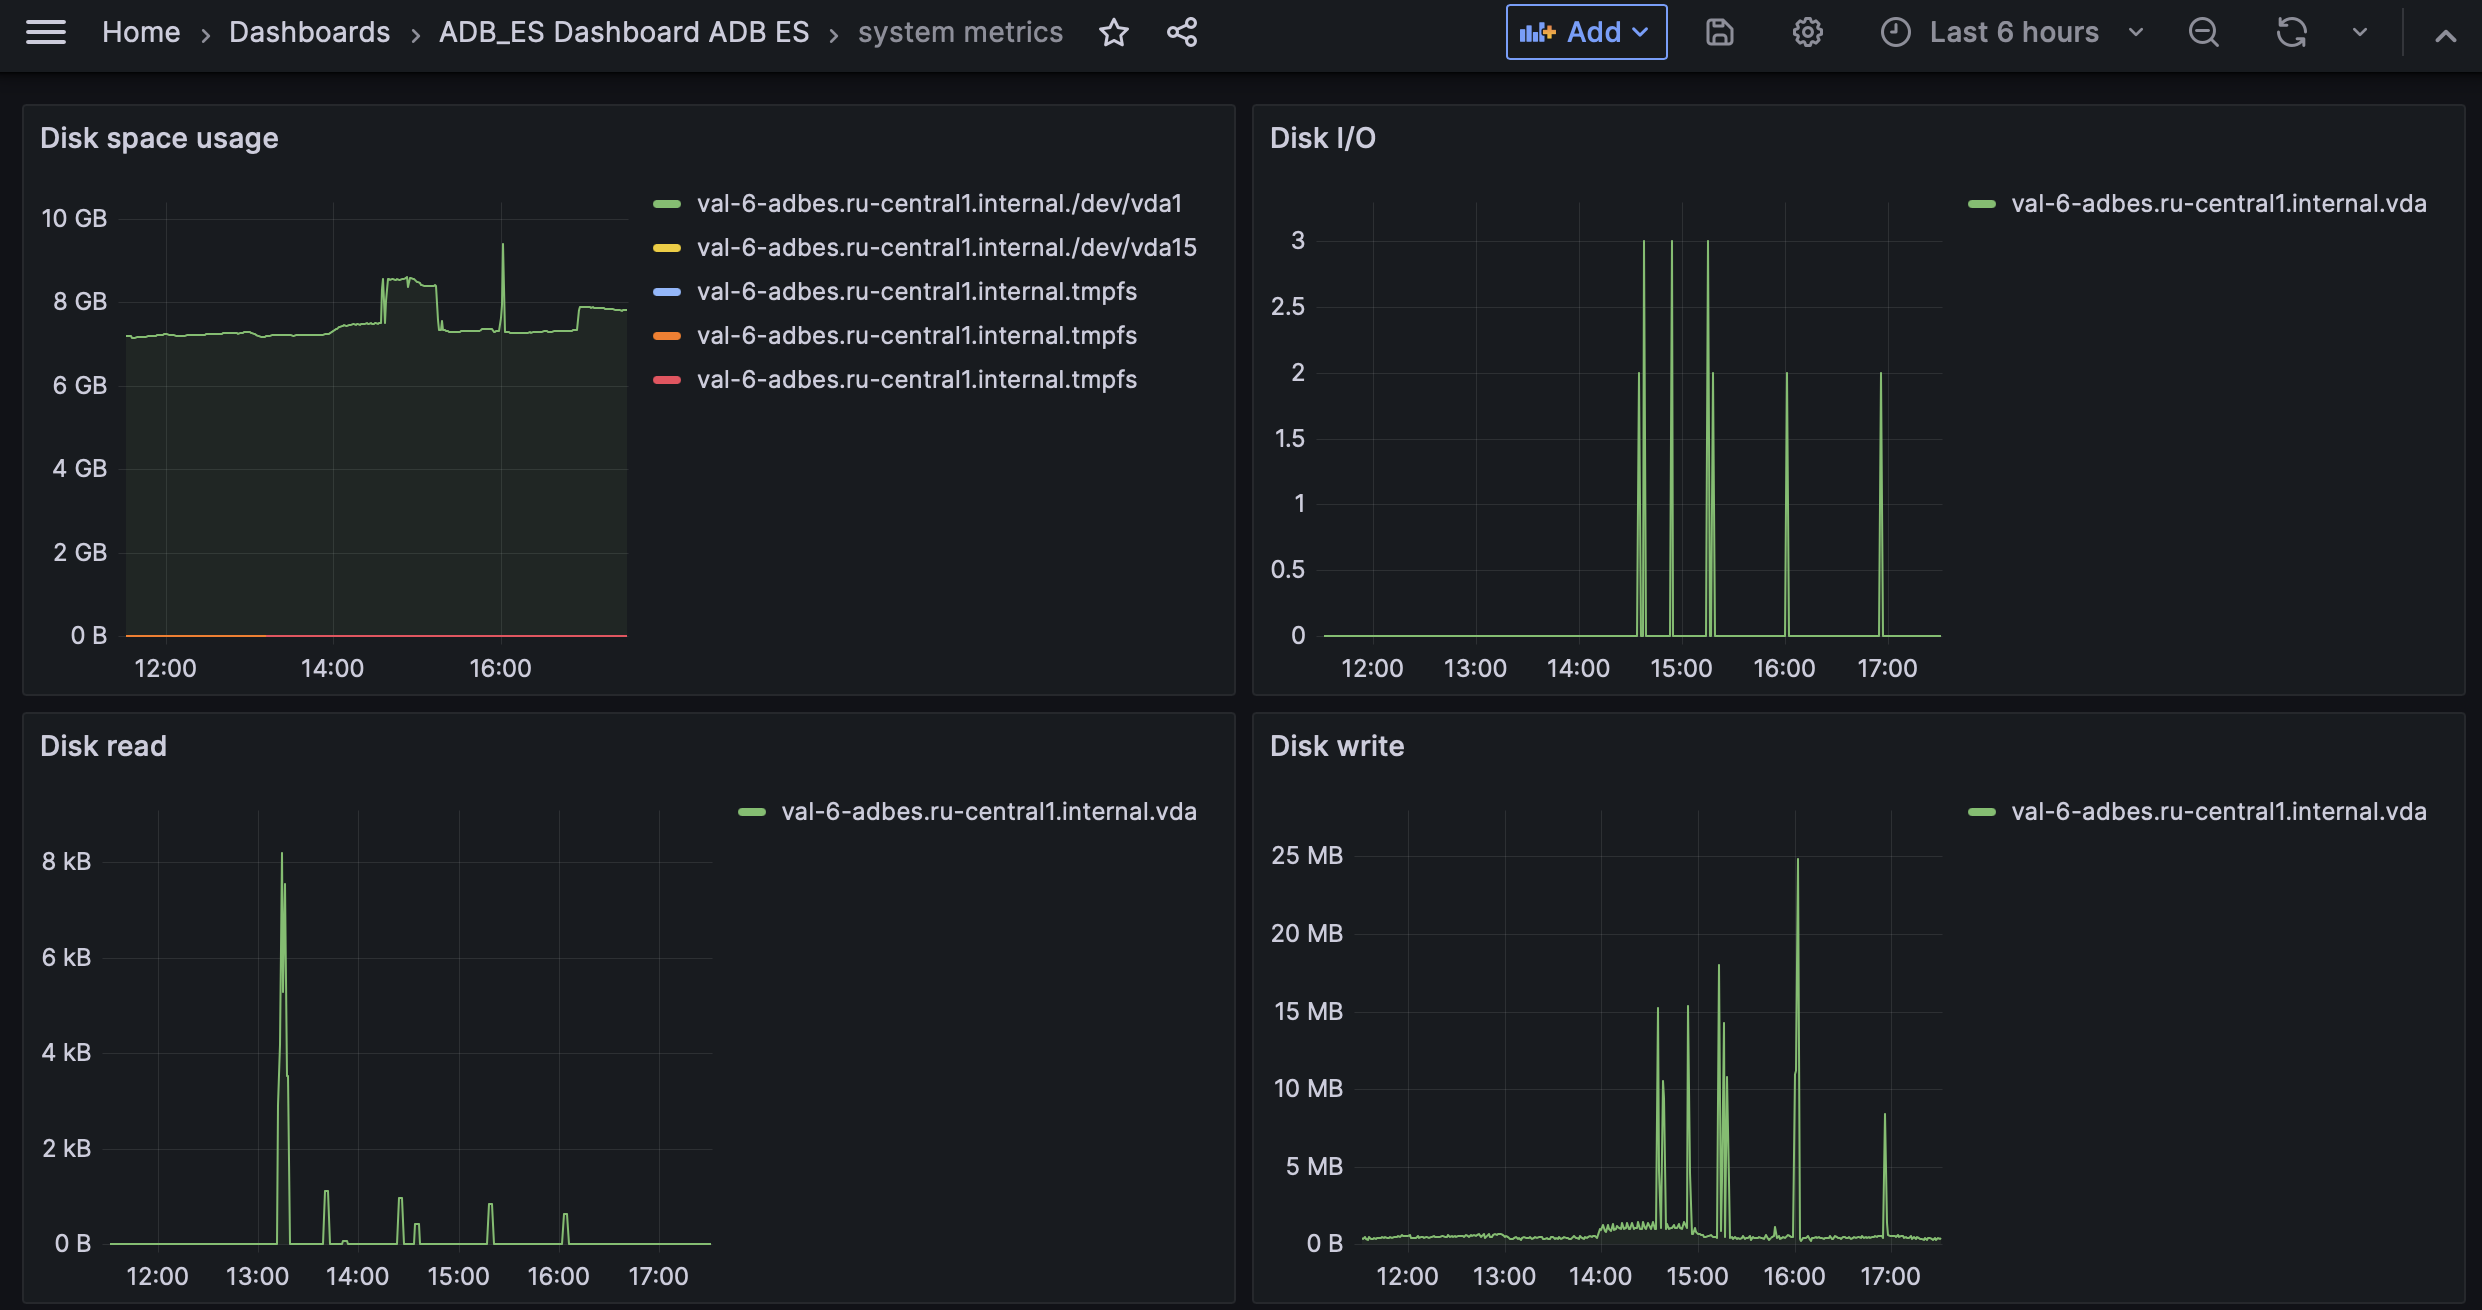
System metrics
This dashboard provides monitoring for host-level system metrics provided by Node Exporter.
| Panel name | Description |
|---|---|
Disk space usage |
Used disk space on each mounted filesystem |
Disk I/O |
Number of disk I/O operations |
Disk read |
Rate of data read from disk |
Disk write |
Rate of data written to disk |
Host CPU usage |
CPU utilization percentage across all cores |
Host memory usage |
Memory used by processes on hosts |
Network receive bytes |
Inbound network traffic rate by interface and host |
Network transmit bytes |
Outbound network traffic rate by interface and host |