

Ranger audit
Overview
Ranger allows you to collect access audit history. It uses Solr to store audit logs and to implement a user interface for searching through them. The default configuration for Ranger audit in Solr uses a shared Solr instance provided by the ADPS bundle. Make sure that the Solr host has enough memory, CPU, and disk capacity.
|
NOTE
Solr must be installed and configured before installing Ranger Admin.
|
-
To authorize as Ranger admin, enter the administrative credentials and click Sign In.
 Log in to Ranger
 -
To manage audit policies in Ranger, open the Ranger console. Then, click Audits and choose a relevant option.
The Audits section includes the following tabs:
Each tab allows you to filter displayed data based on some parameters.
|
NOTE
Wildcards (for example, * or ?) are not currently supported in search queries.
|
Access
The Access tab provides the service activity data for all policies that have audit enabled. The default service policy is configured to log all user activity. This default policy does not contain the user and group access rules.
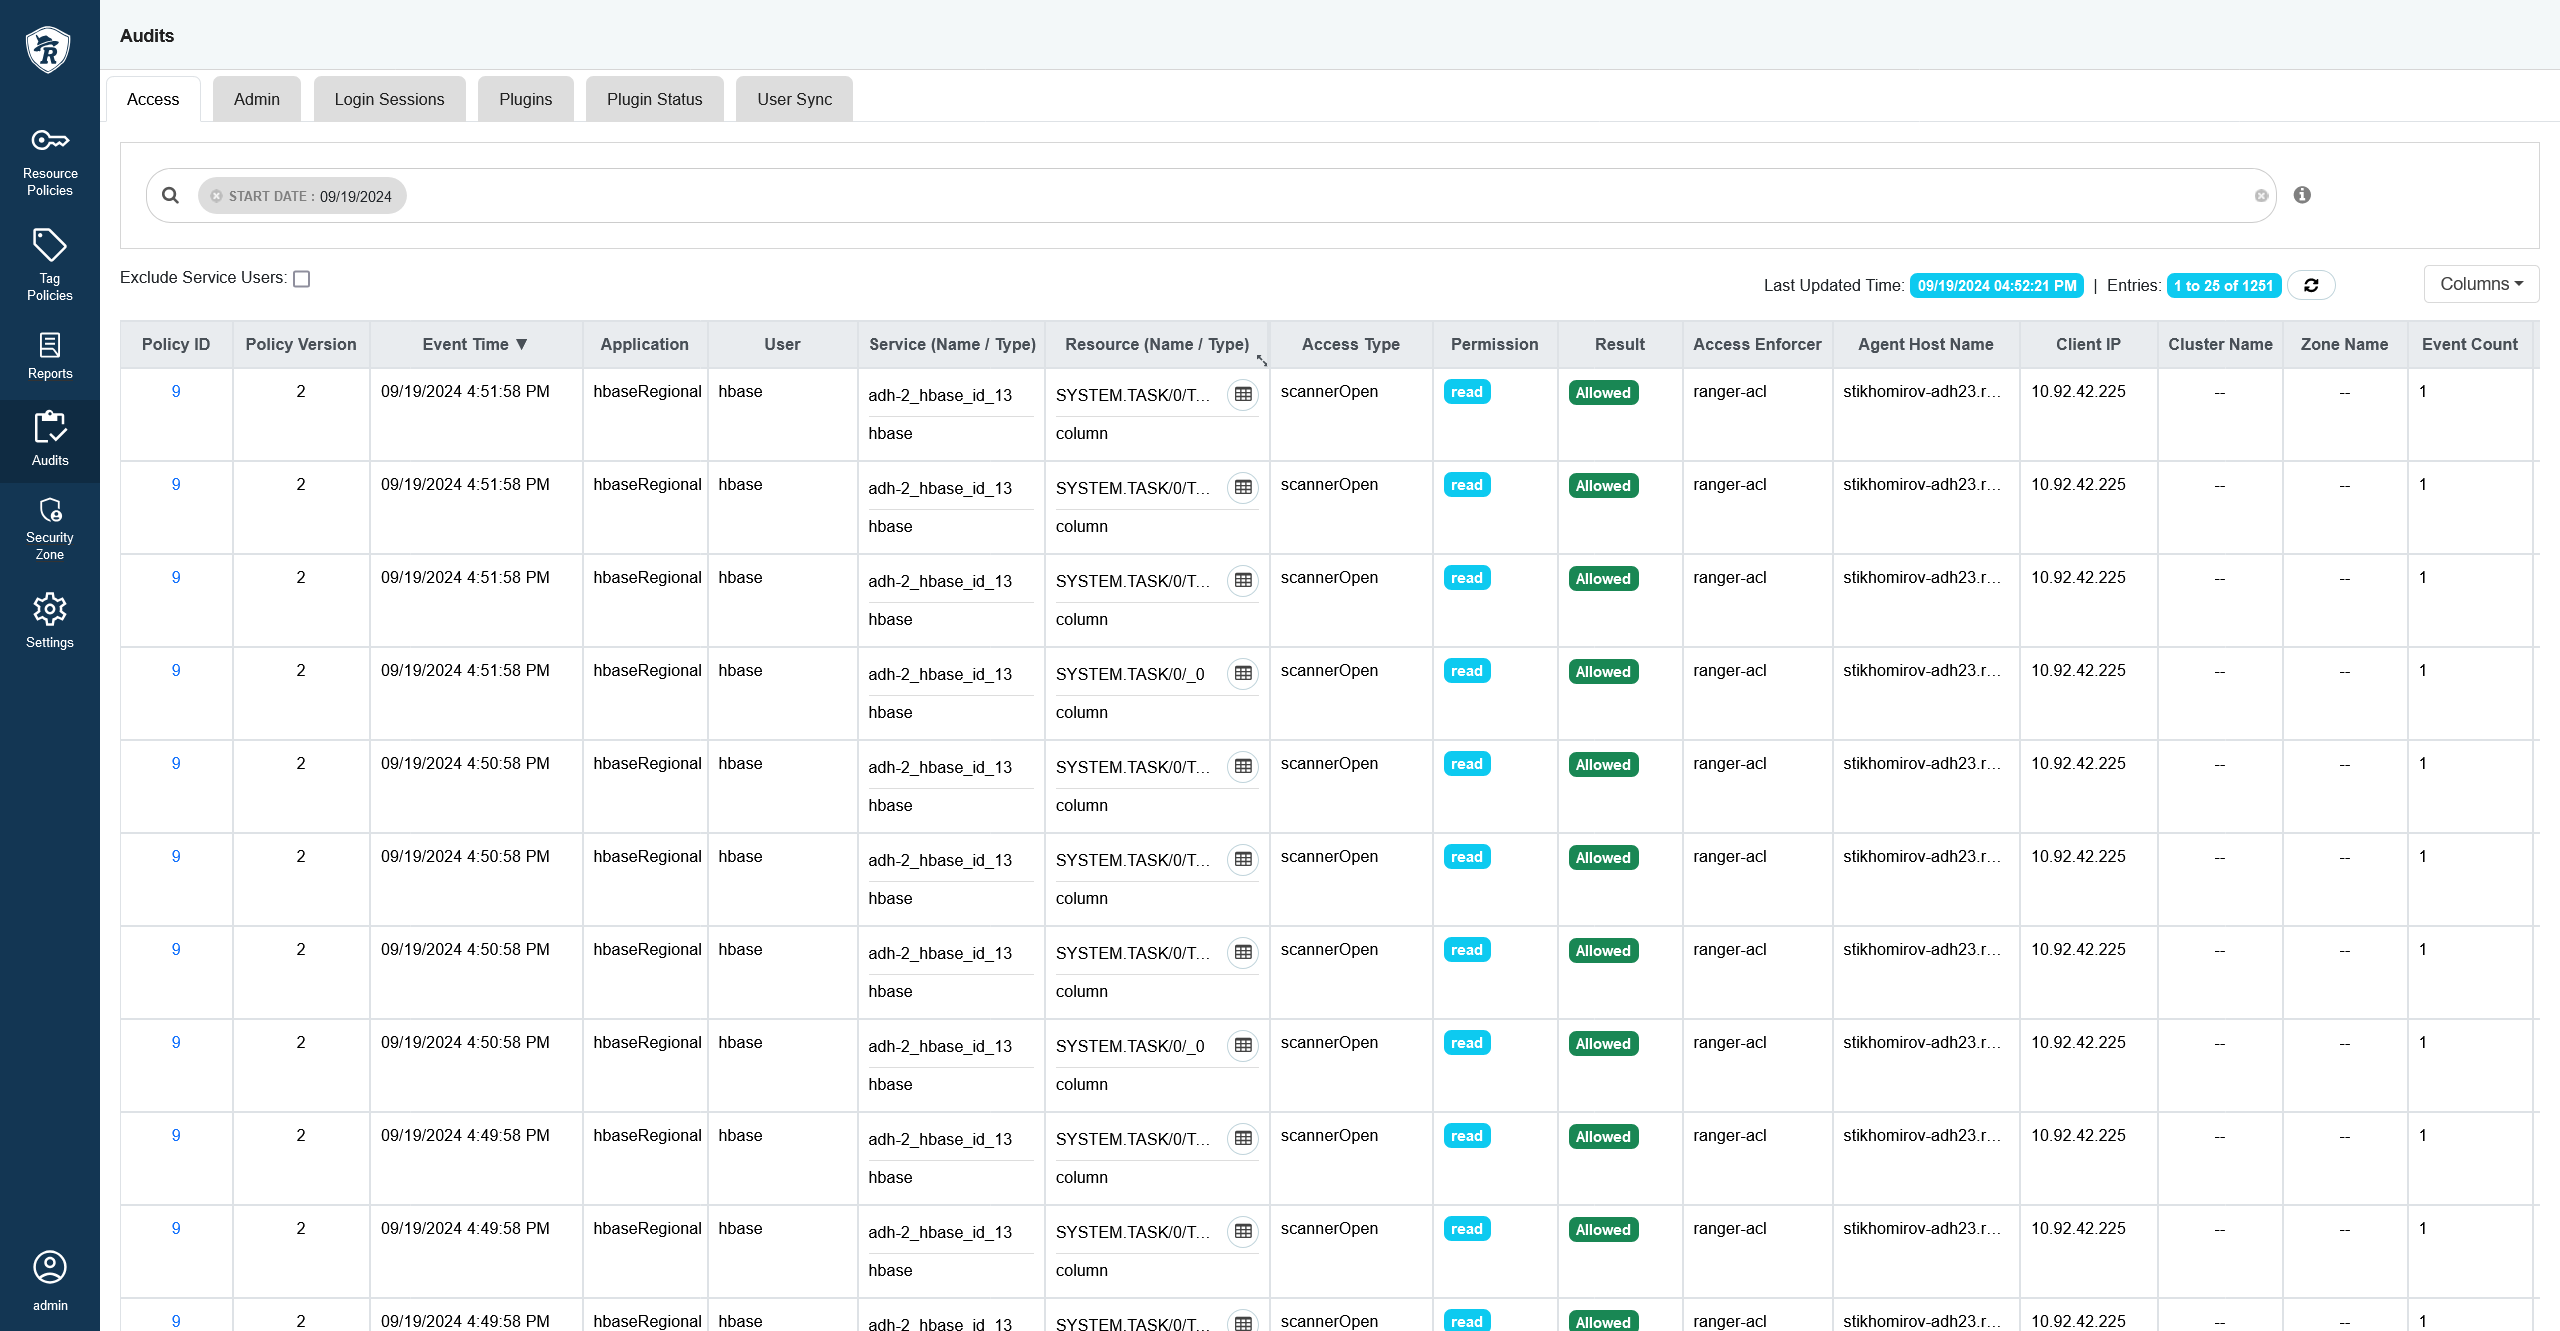
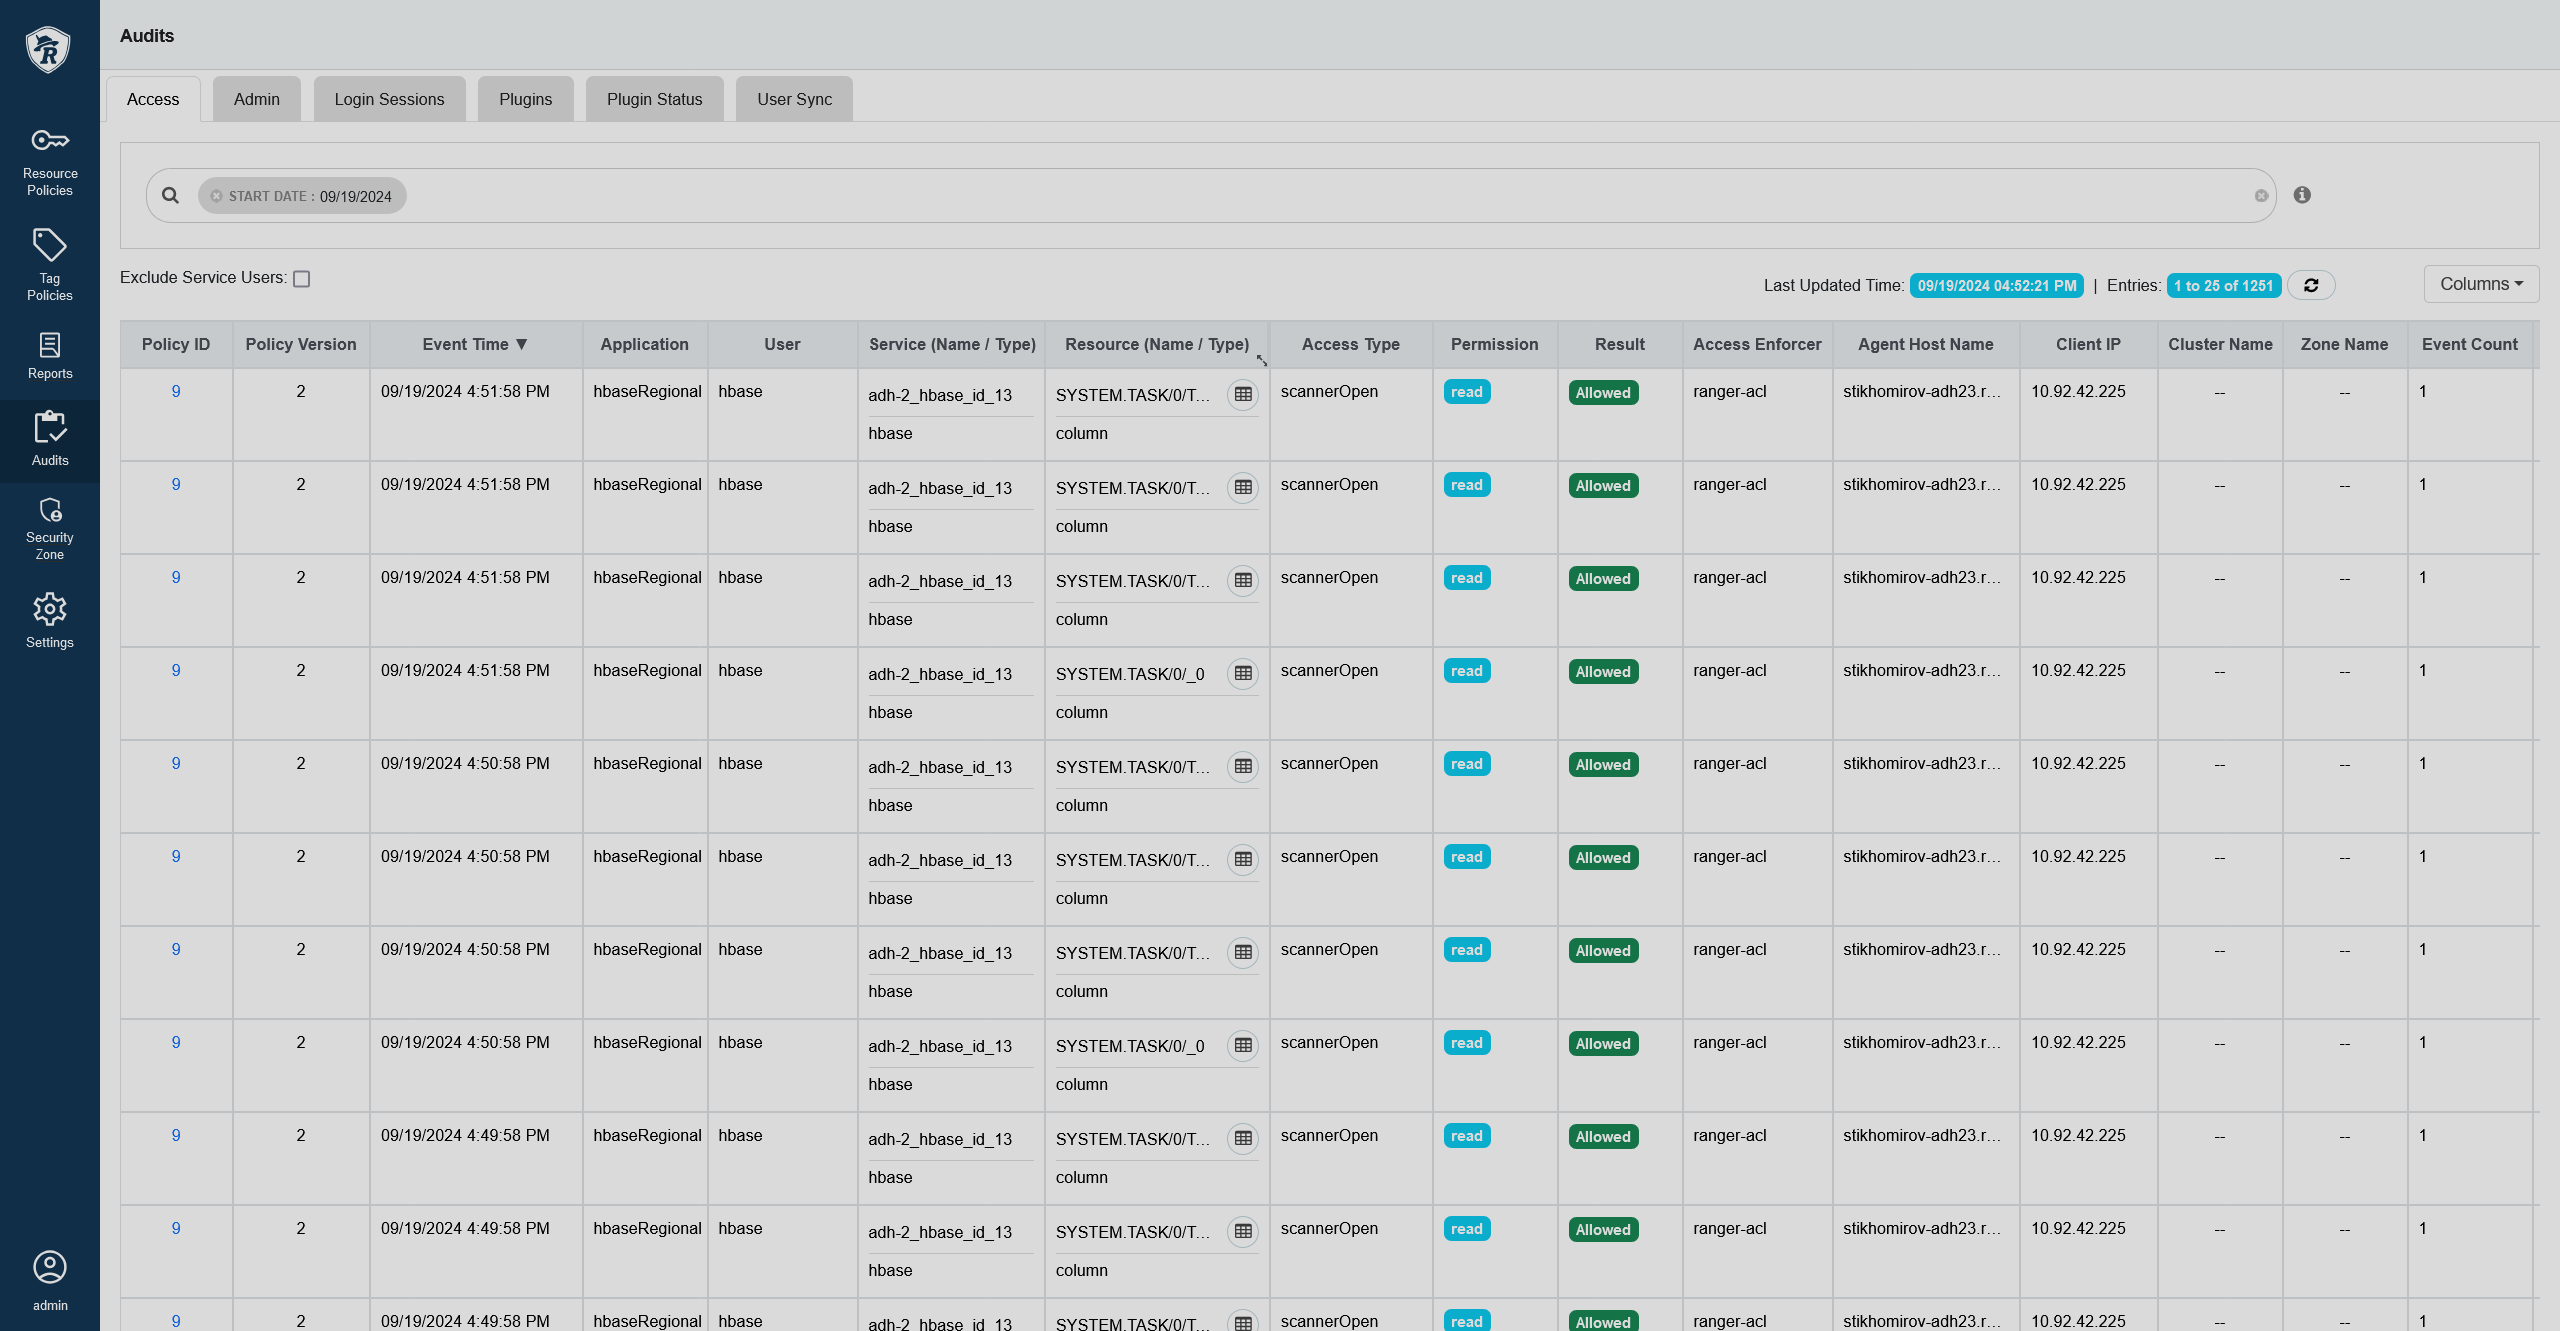
You can filter the data based on the criteria listed in the table below.
| Search criteria | Description |
|---|---|
Access Enforcer |
Access enforcer name |
Access Type |
Access type like |
Agent Host Name |
Hostname of the agent |
Application |
Application name |
Audit ID |
Audit identifier |
Client IP |
IP address that was used to access the resources |
Cluster Name |
Name of the cluster |
Start Date |
Start date for a date range filter |
End Date |
End date for a date range filter |
Exclude User |
Name of the user to exclude |
Policy ID |
Policy identifier |
Resource Name |
Resource name |
Resource Type |
Resource type based on component (for example, path in HDFS, database, table in Hive) |
Result |
Access result (Allowed/Denied logs) |
Service Name |
Name of the service that the user tries to access |
Service Type |
Type of the service that the user tries to access |
Tags |
Tag name |
User |
Name of the user who tries to access the resource |
Zone Name |
Name of the security zone |
Admin
The Admin tab contains all events for security audit. The events include service, service manager, login events, and actions such as creating, updating, deleting, changing a password.
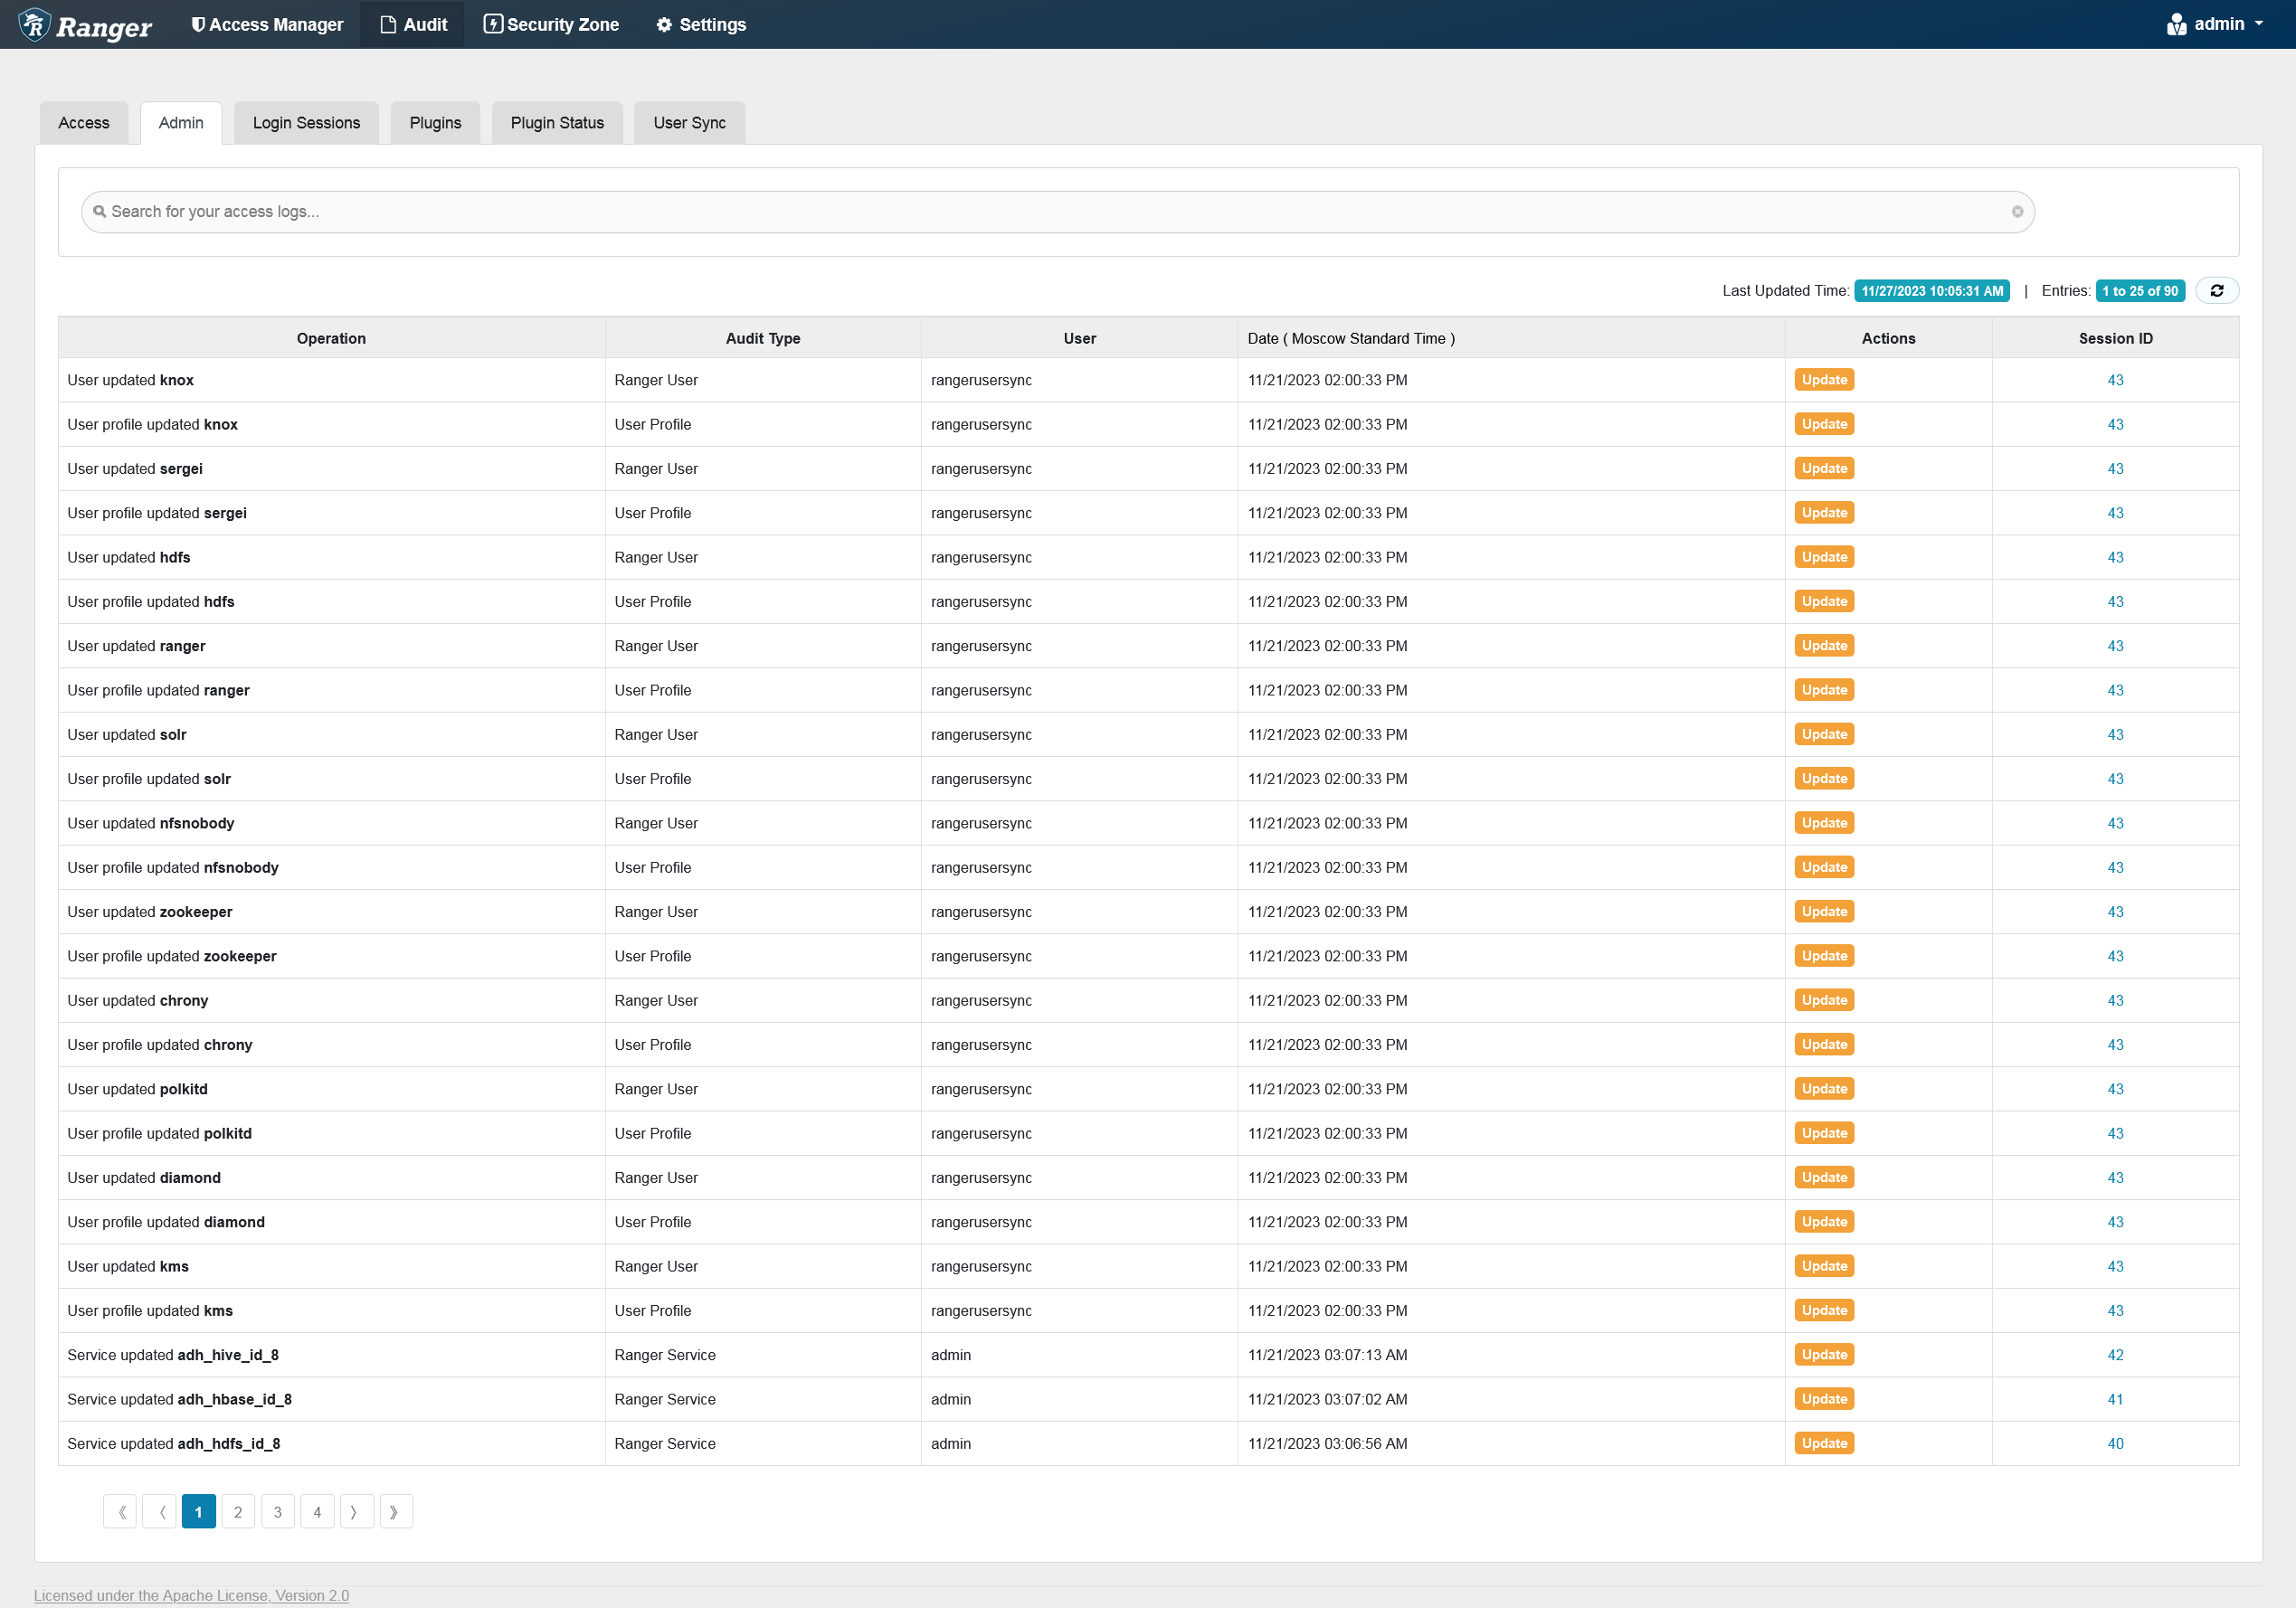
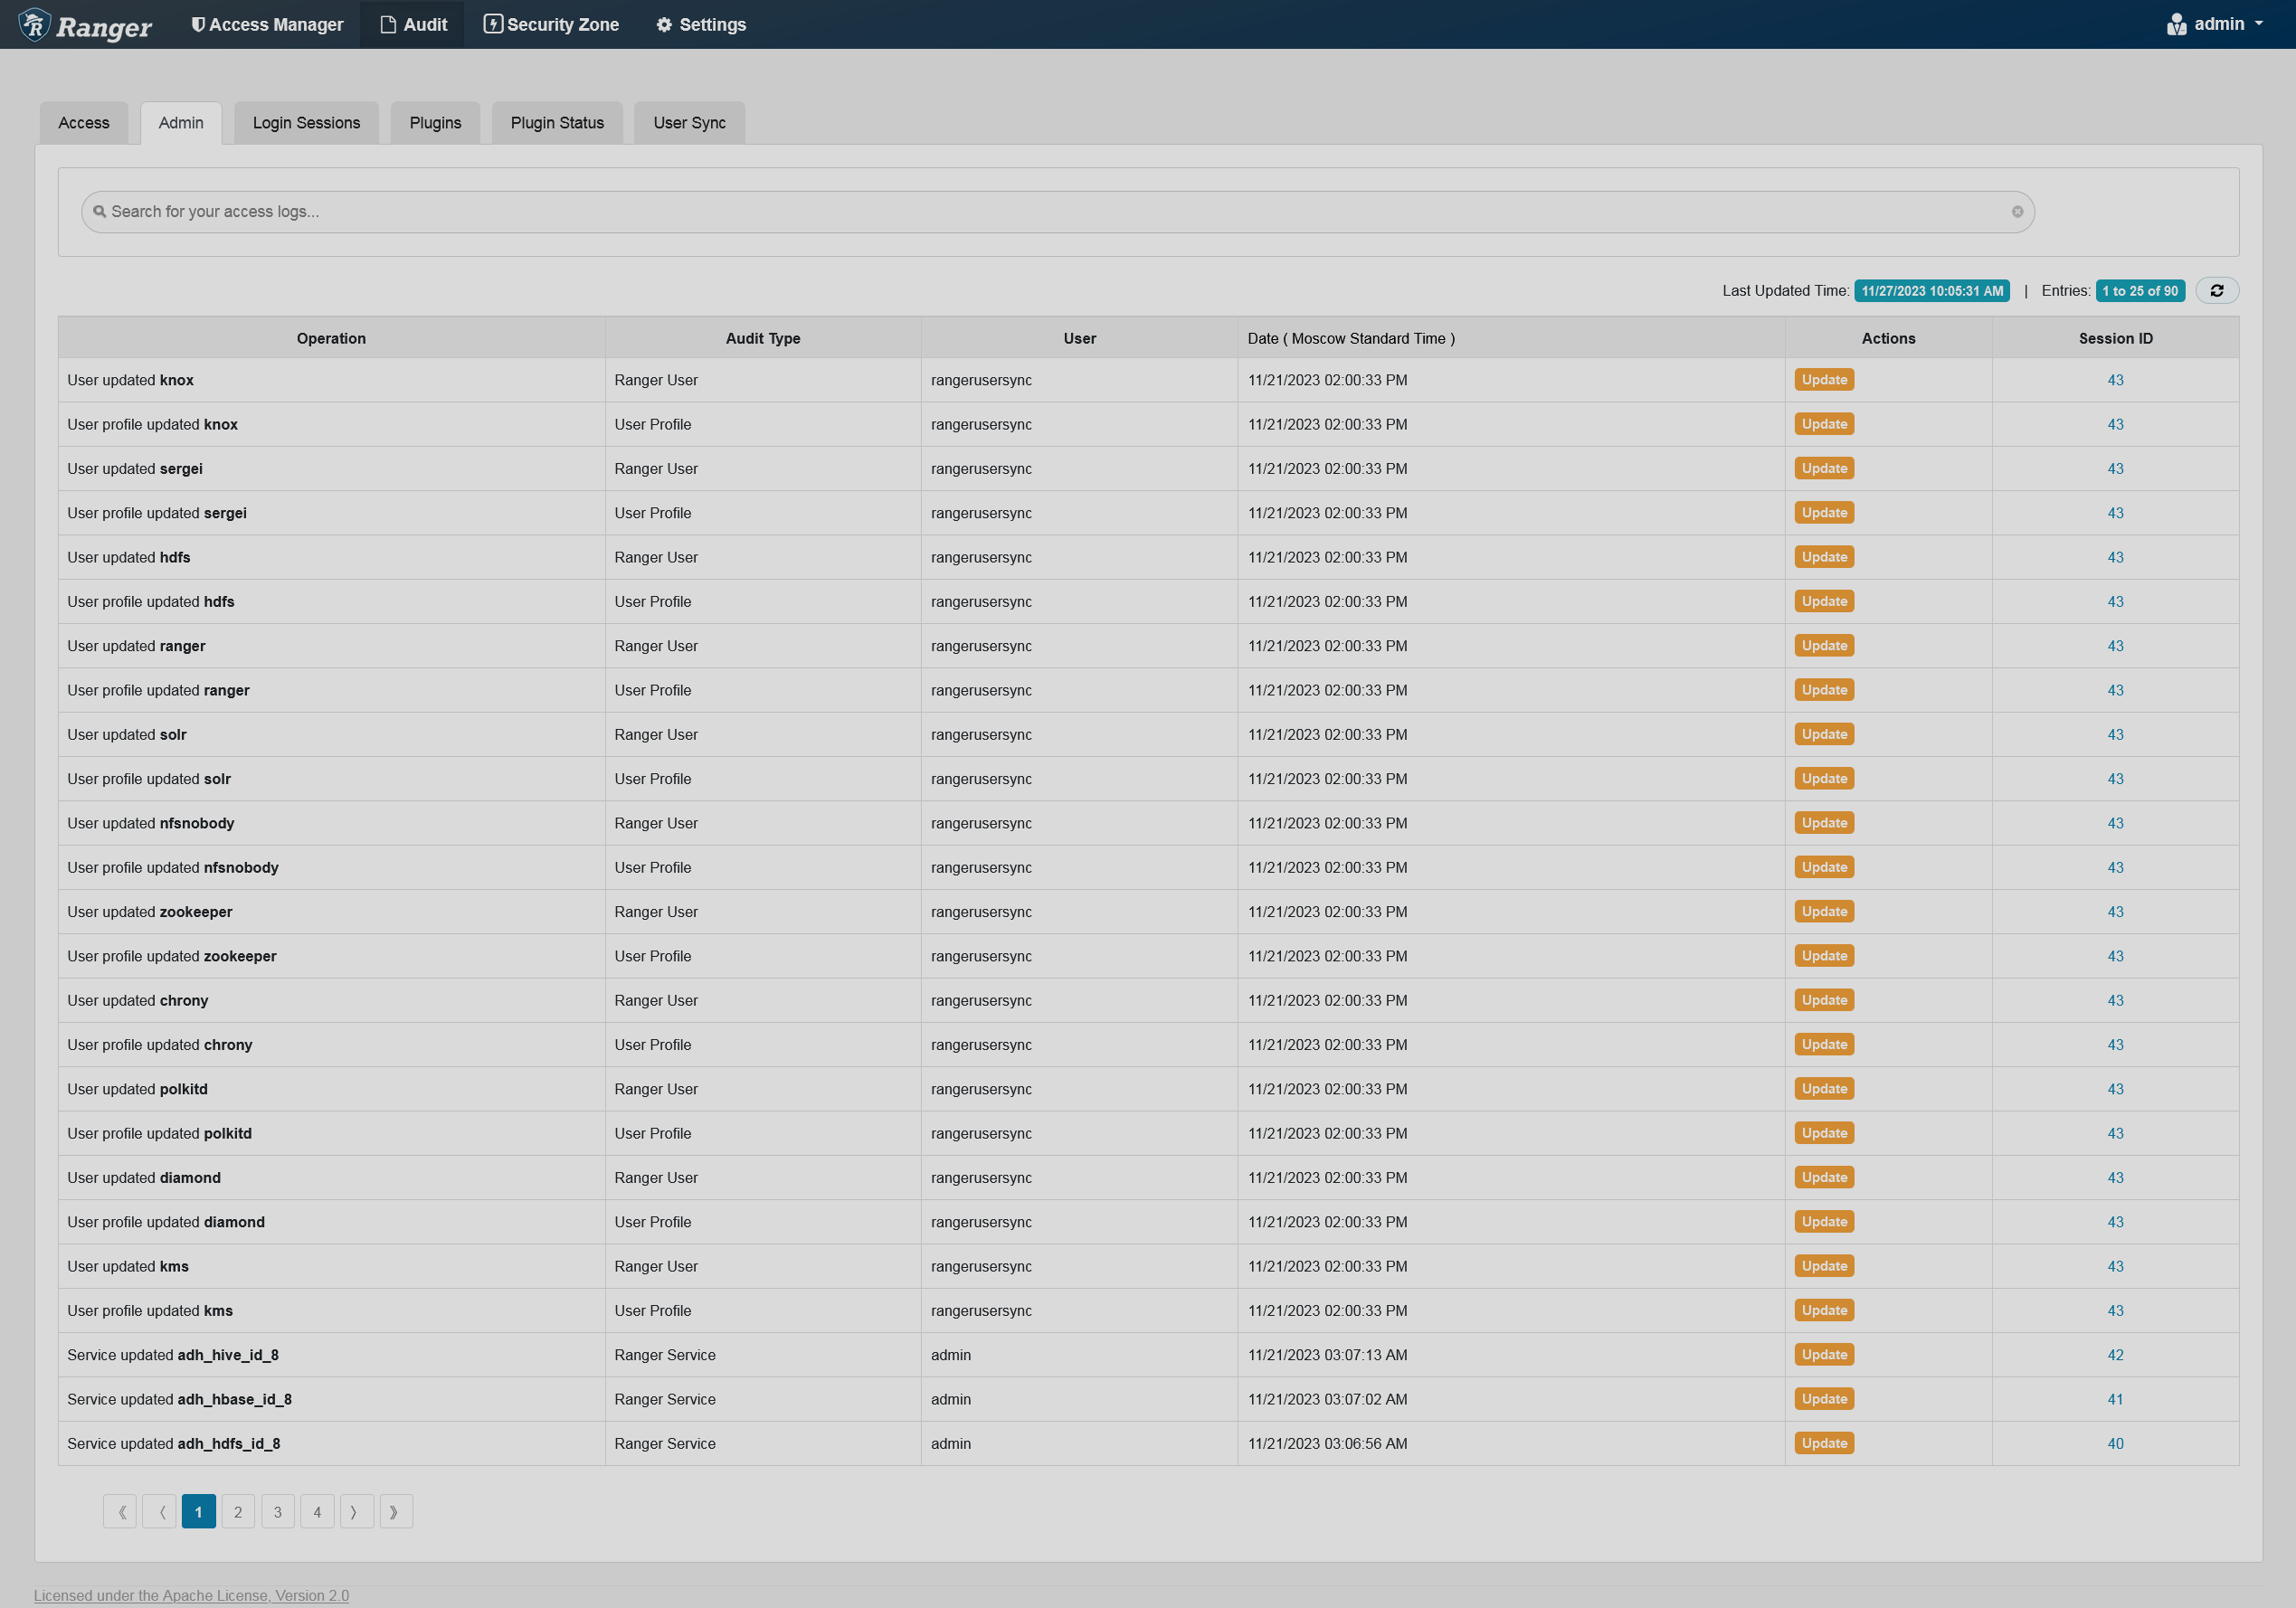
You can filter the data based on the criteria listed in the table below.
| Search criteria | Description |
|---|---|
Actions |
Action names. Can be |
Audit Type |
Type of audit. Can be |
Start Date |
Start date for a date range filter |
End Date |
End date for a date range filter |
Session ID |
The session count. Increments each time a log in to the system is attempted |
User |
Name of the user who has performed either |
Login Sessions
The Login Sessions tab displays information related to user sessions for each login.
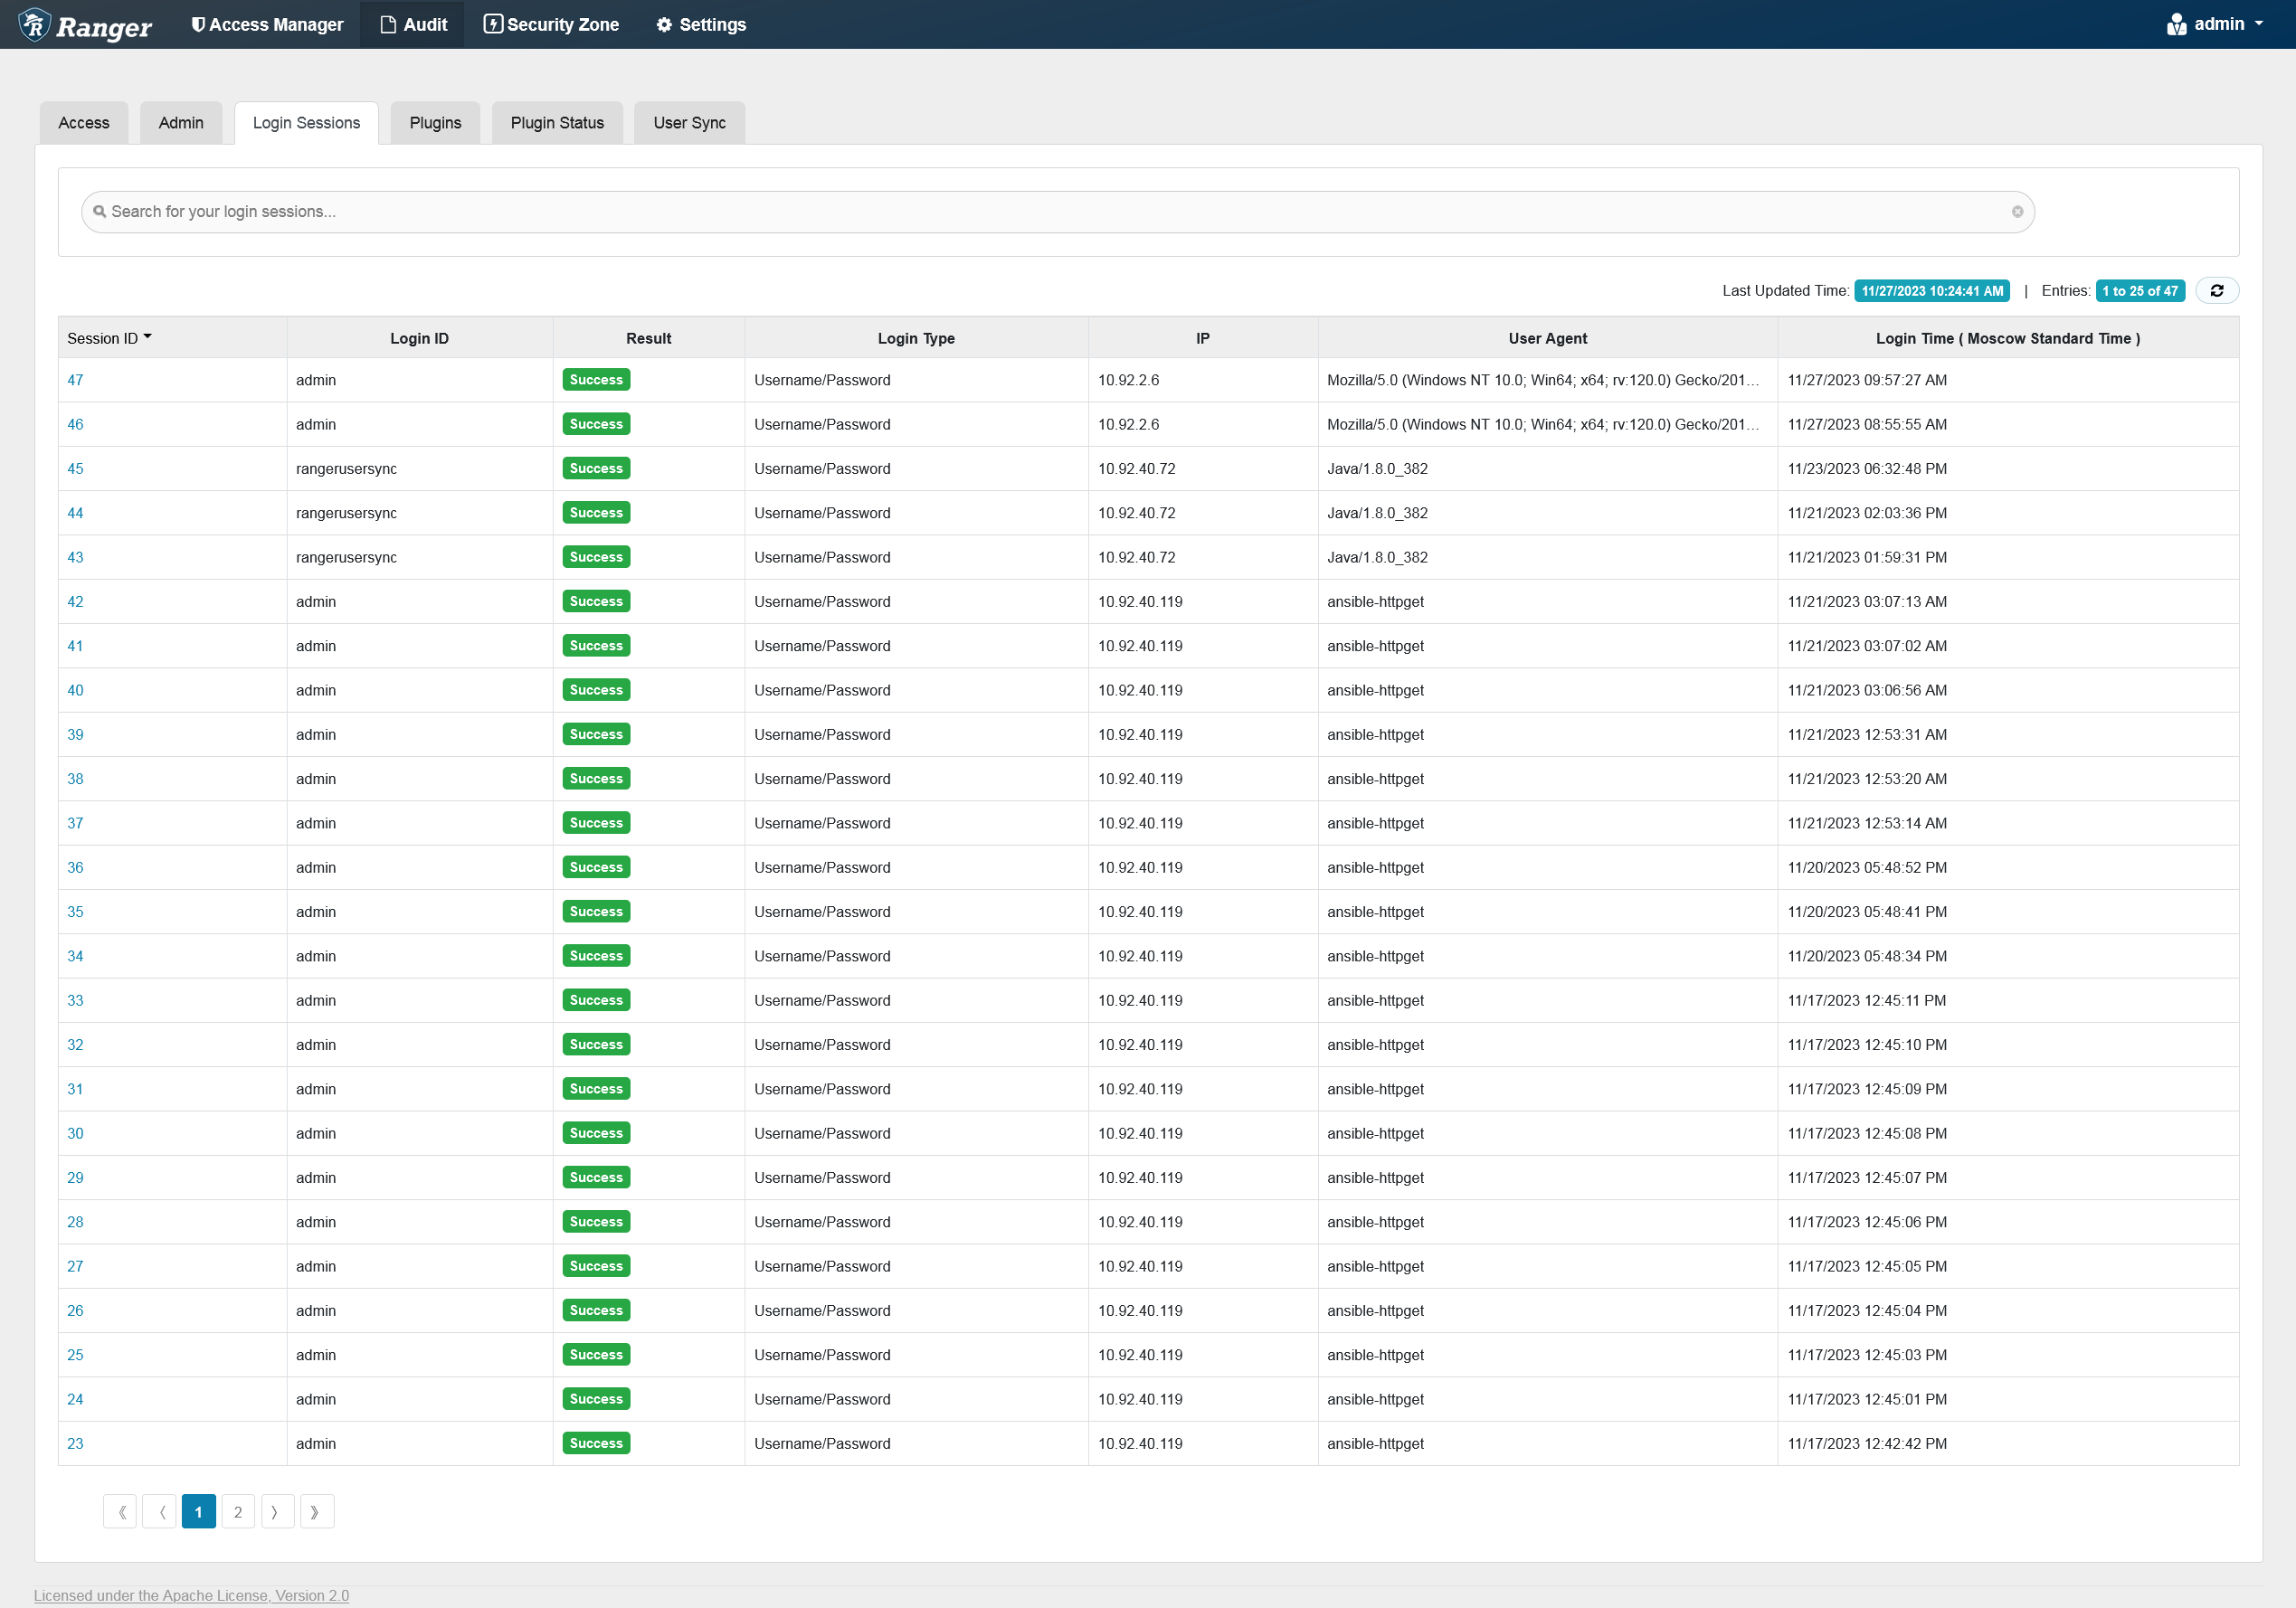
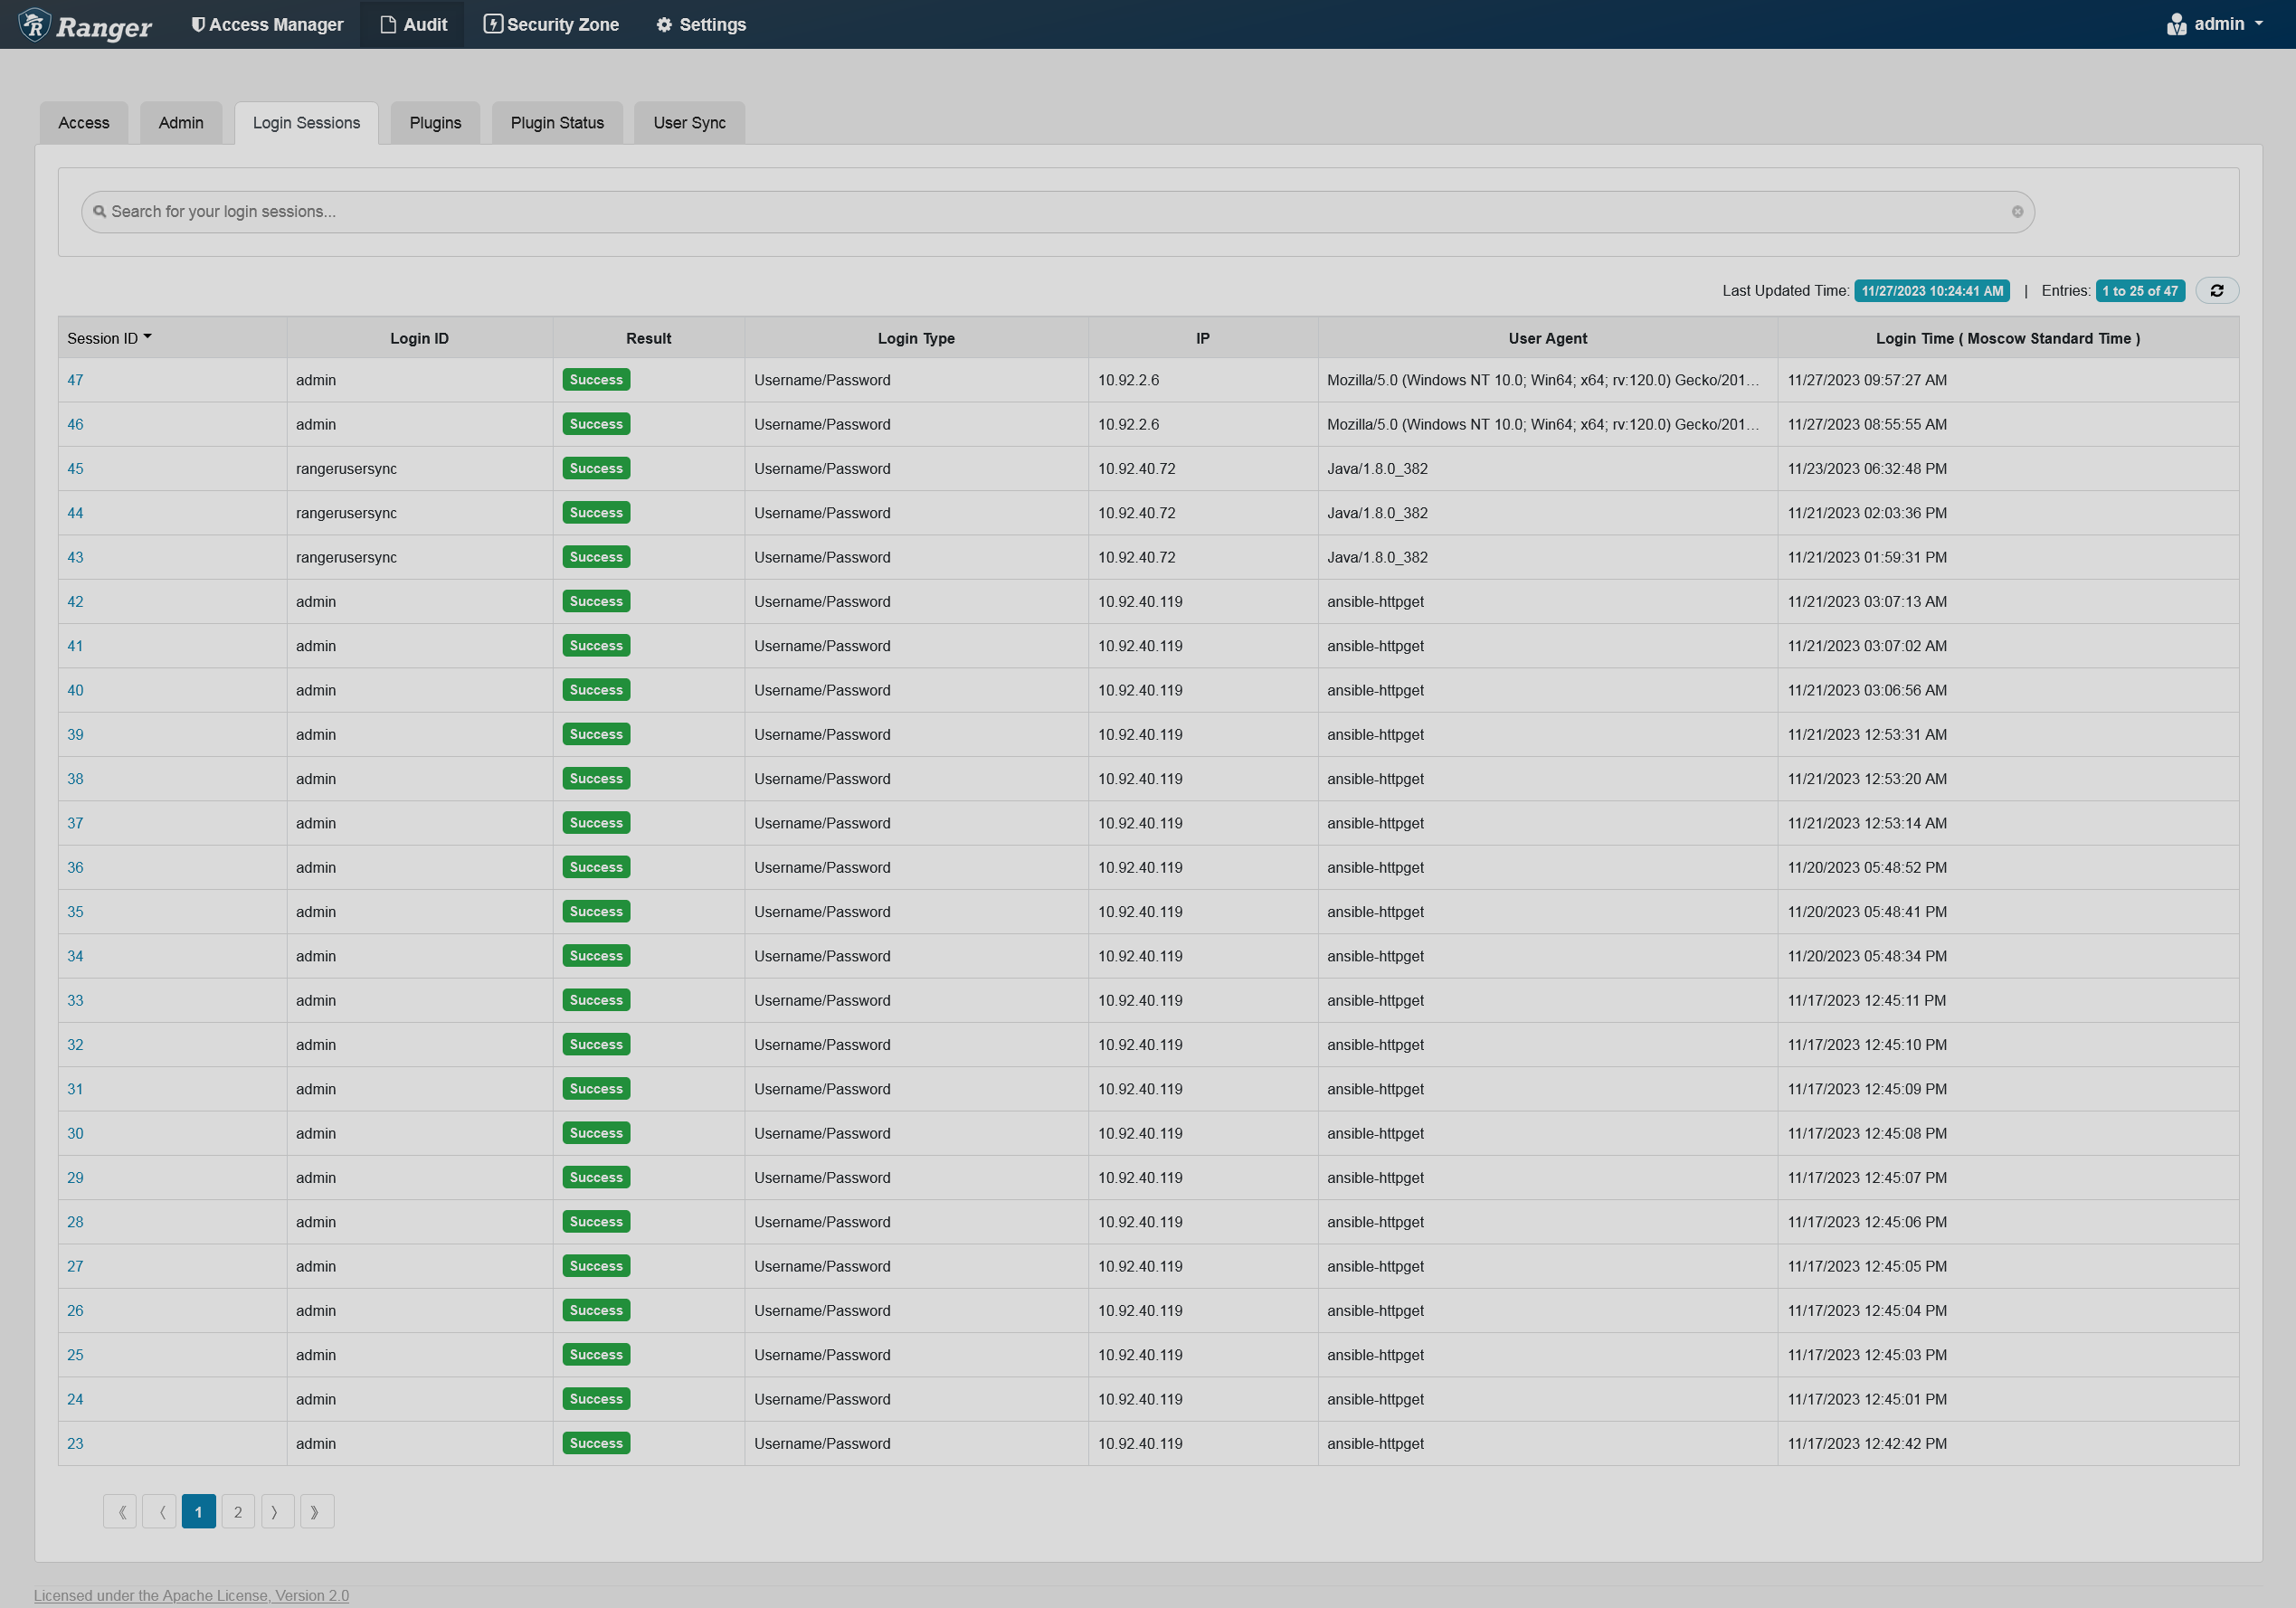
You can filter the data based on the criteria listed in the table below.
| Search criteria | Description |
|---|---|
IP |
The IP address that the user utilized for login |
Login ID |
Name of the user who tried to access to the system |
Login Type |
The mode through which the user tries to login (by entering username and password) |
Result |
The result of the login attempt. Possible results are: |
Session ID |
The session count. Increments every time a log in to the system is attempted |
Start Date |
Start date for a date range filter |
End Date |
End date for a date range filter |
User Agent |
The browser or library version used to login for the specific event (e.g. Mozilla, Java, Python) |
Plugins
The Plugins tab shows the upload history and the Security Agents status. This tab displays all the services exported from the system.
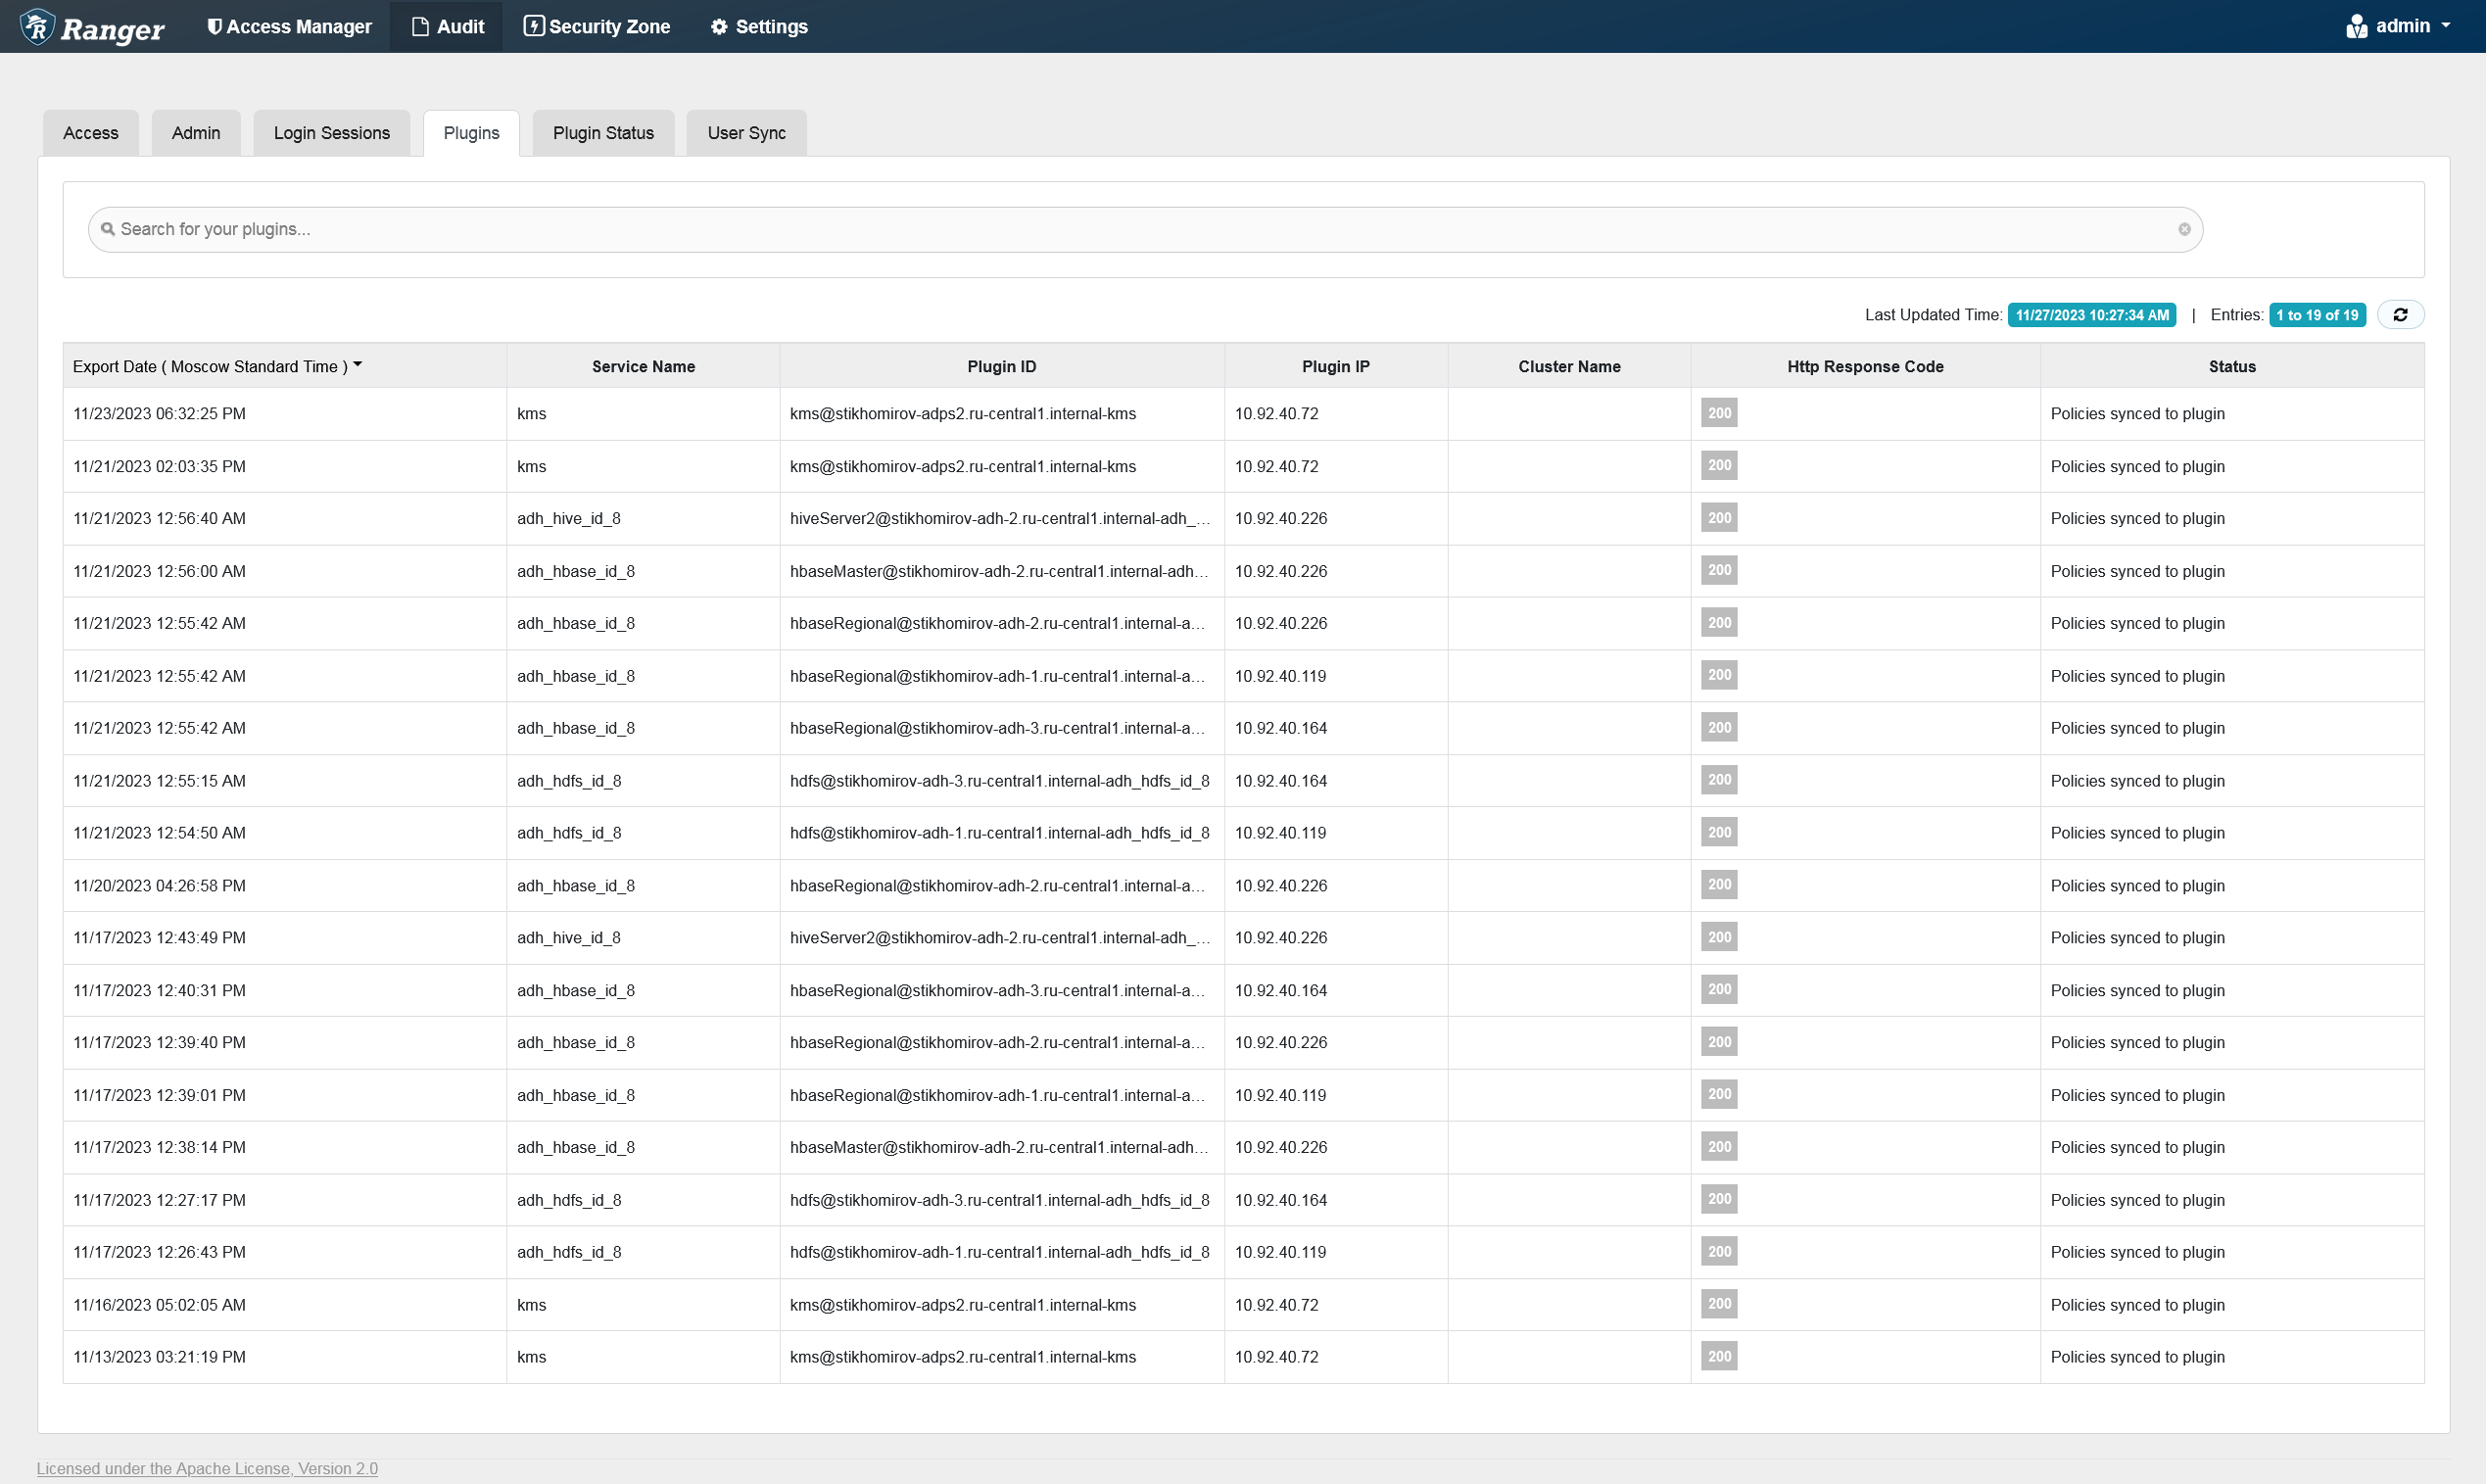
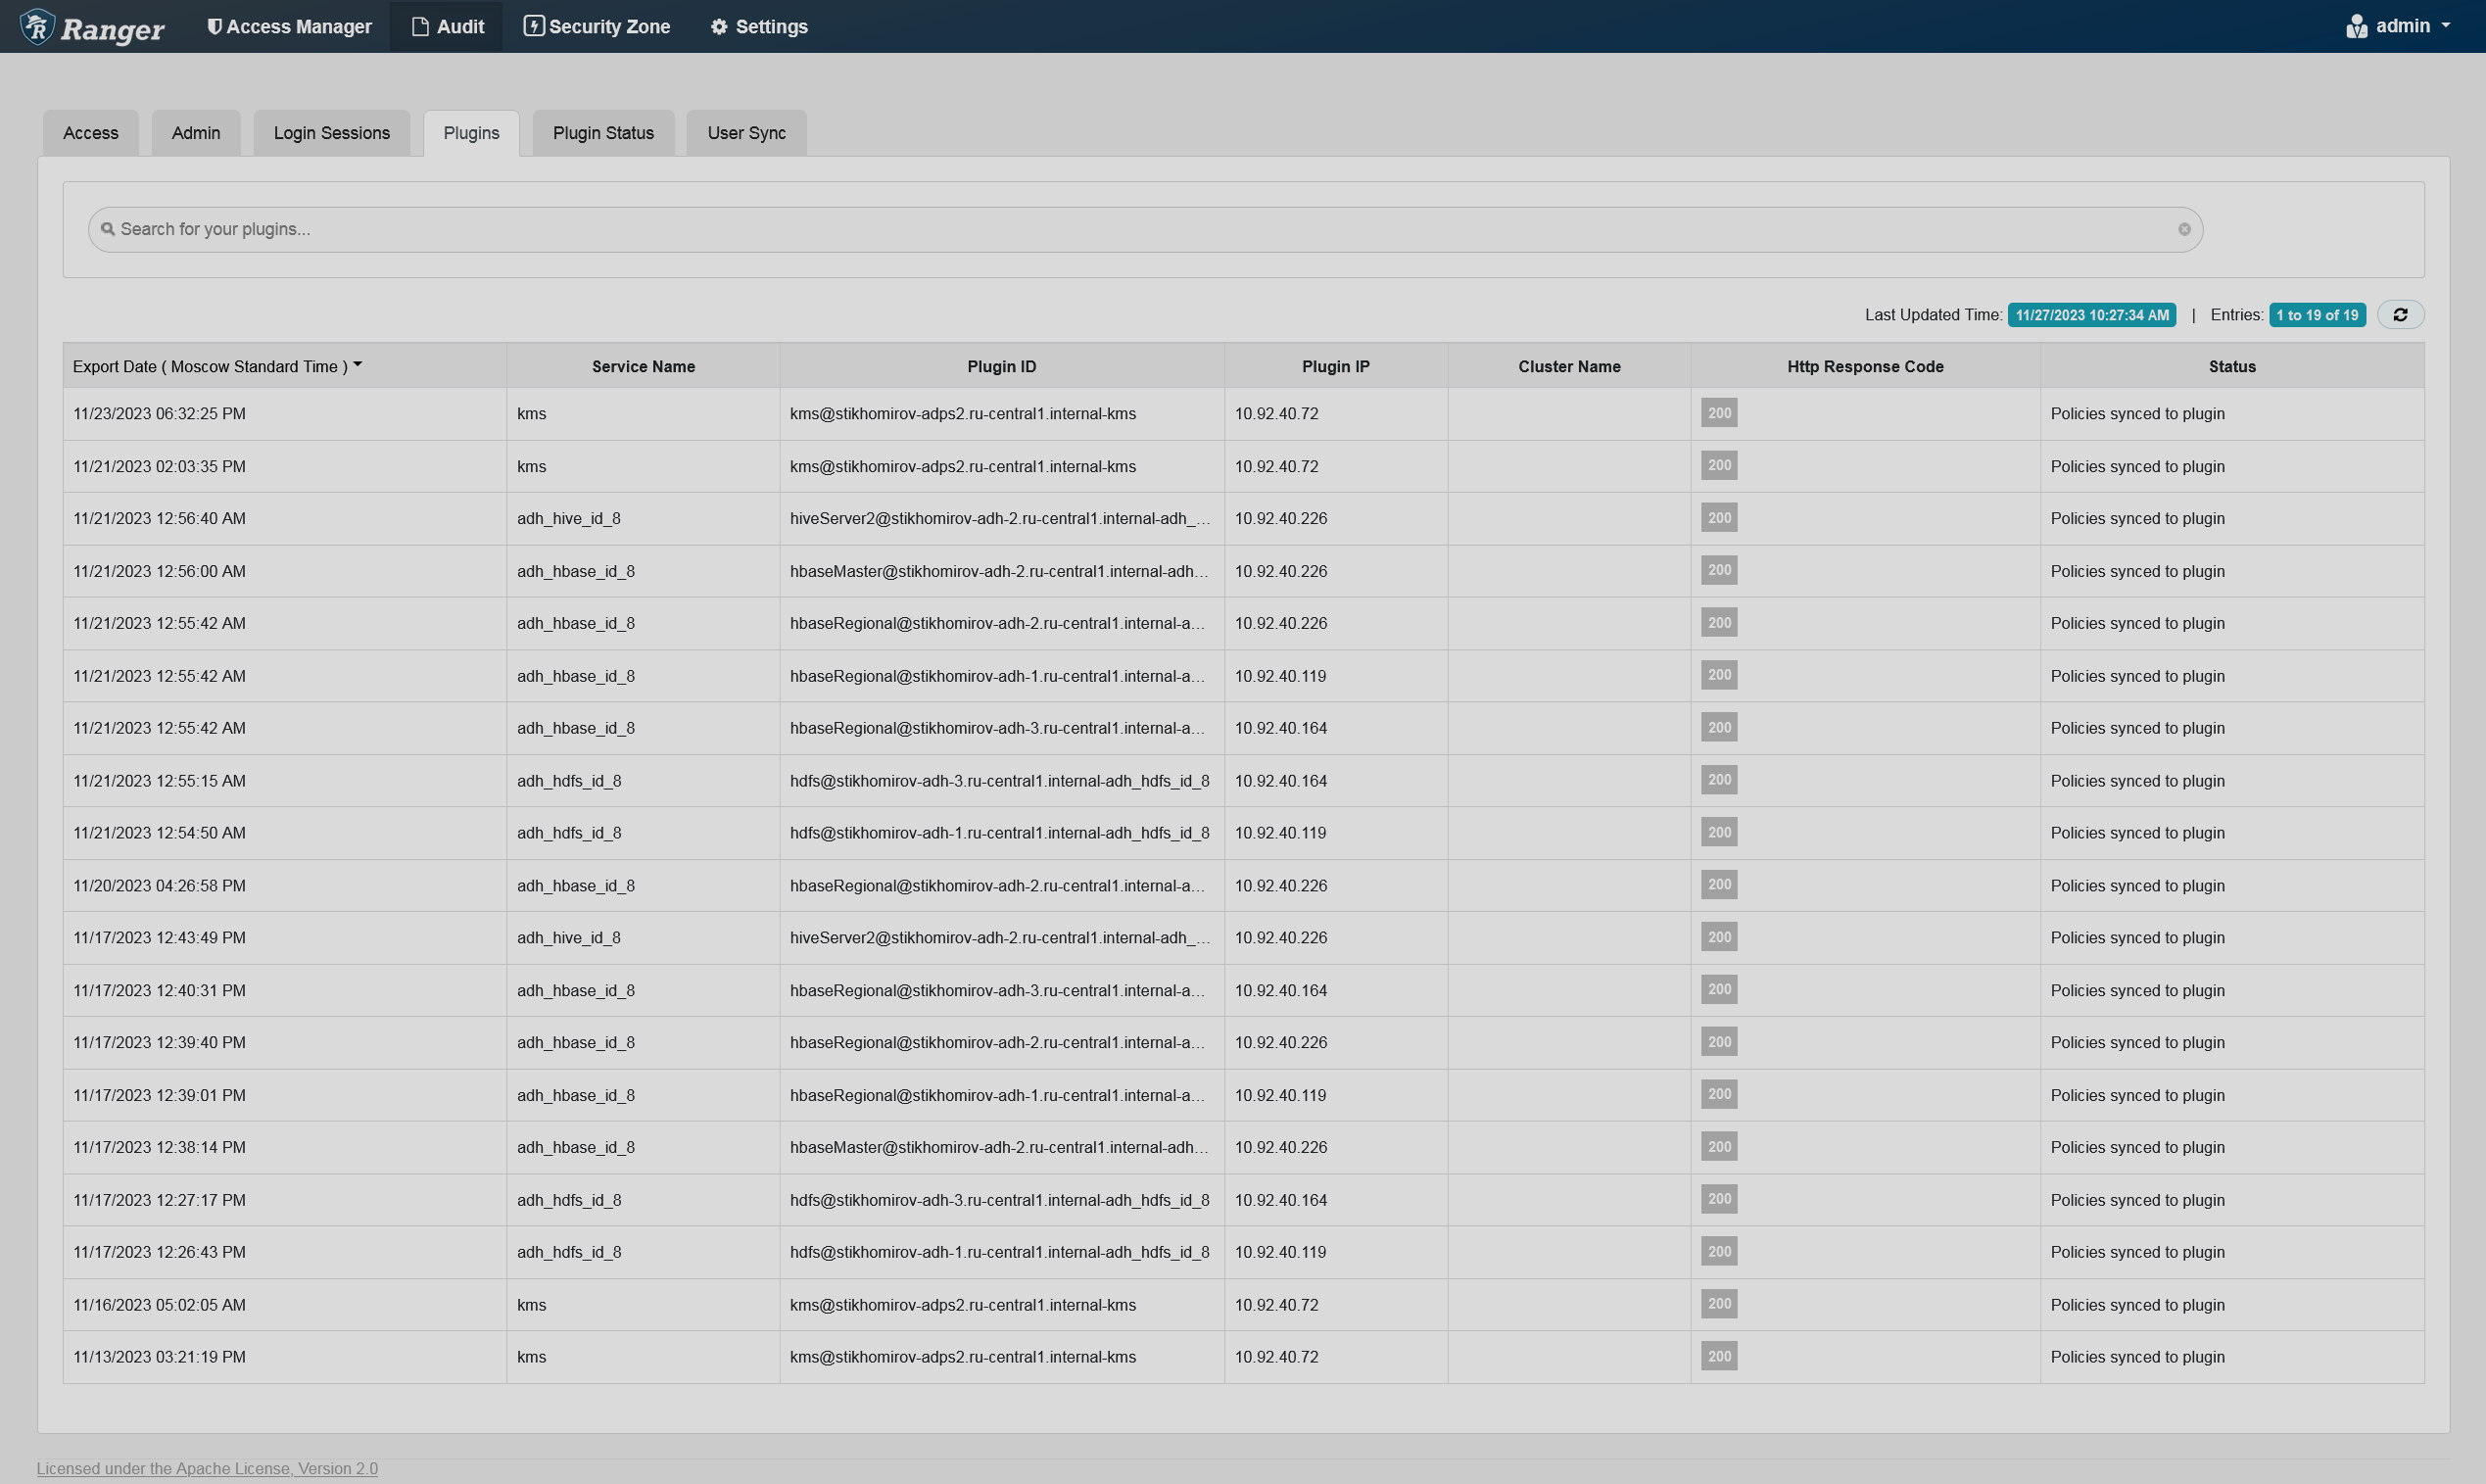
You can filter the data based on the criteria listed in the table below.
| Search criteria | Description |
|---|---|
Cluster Name |
Name of a cluster |
HTTP Response Code |
HTTP code returned when trying to export the service |
Plugin ID |
Name of the agent that tried to export the service |
Plugin IP |
IP address of the agent that tried to export the service |
Service Name |
The name of the service that was exported |
Start Date |
Start date for a date range filter |
End Date |
End date for a date range filter |
Plugin Status
The Plugin Status tab shows policies effective for each plugin. The tab includes relevant host information and the time when the plugin was downloaded and started enforcing the policies.
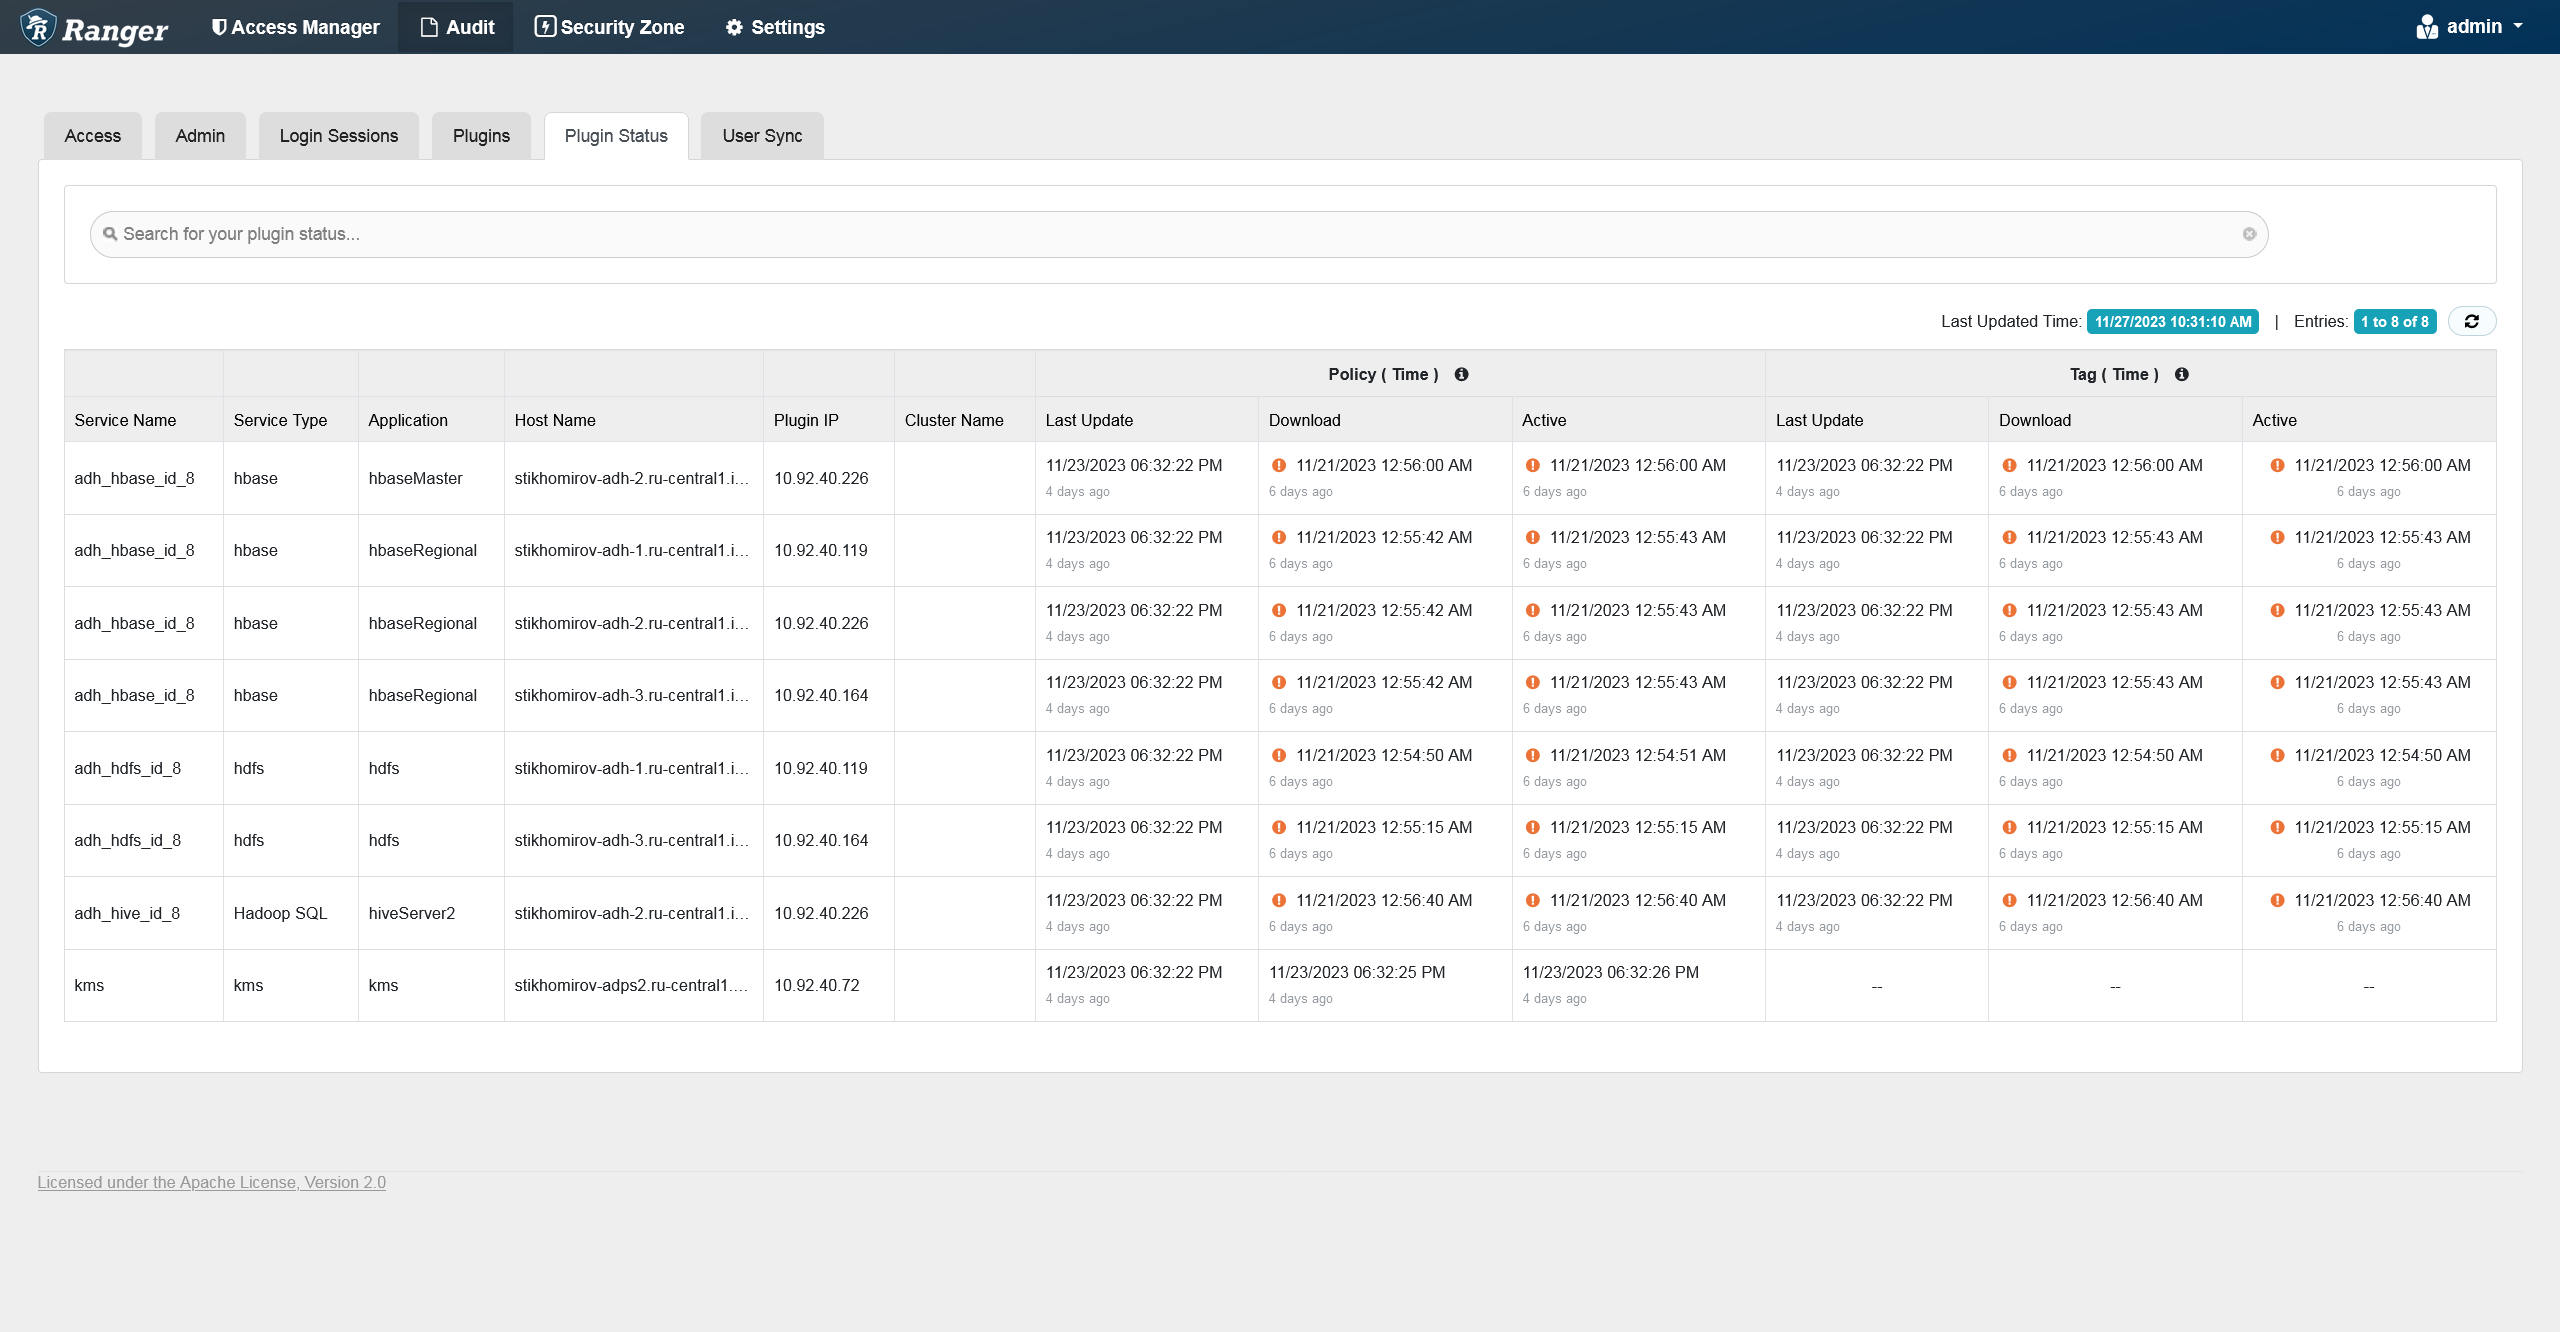
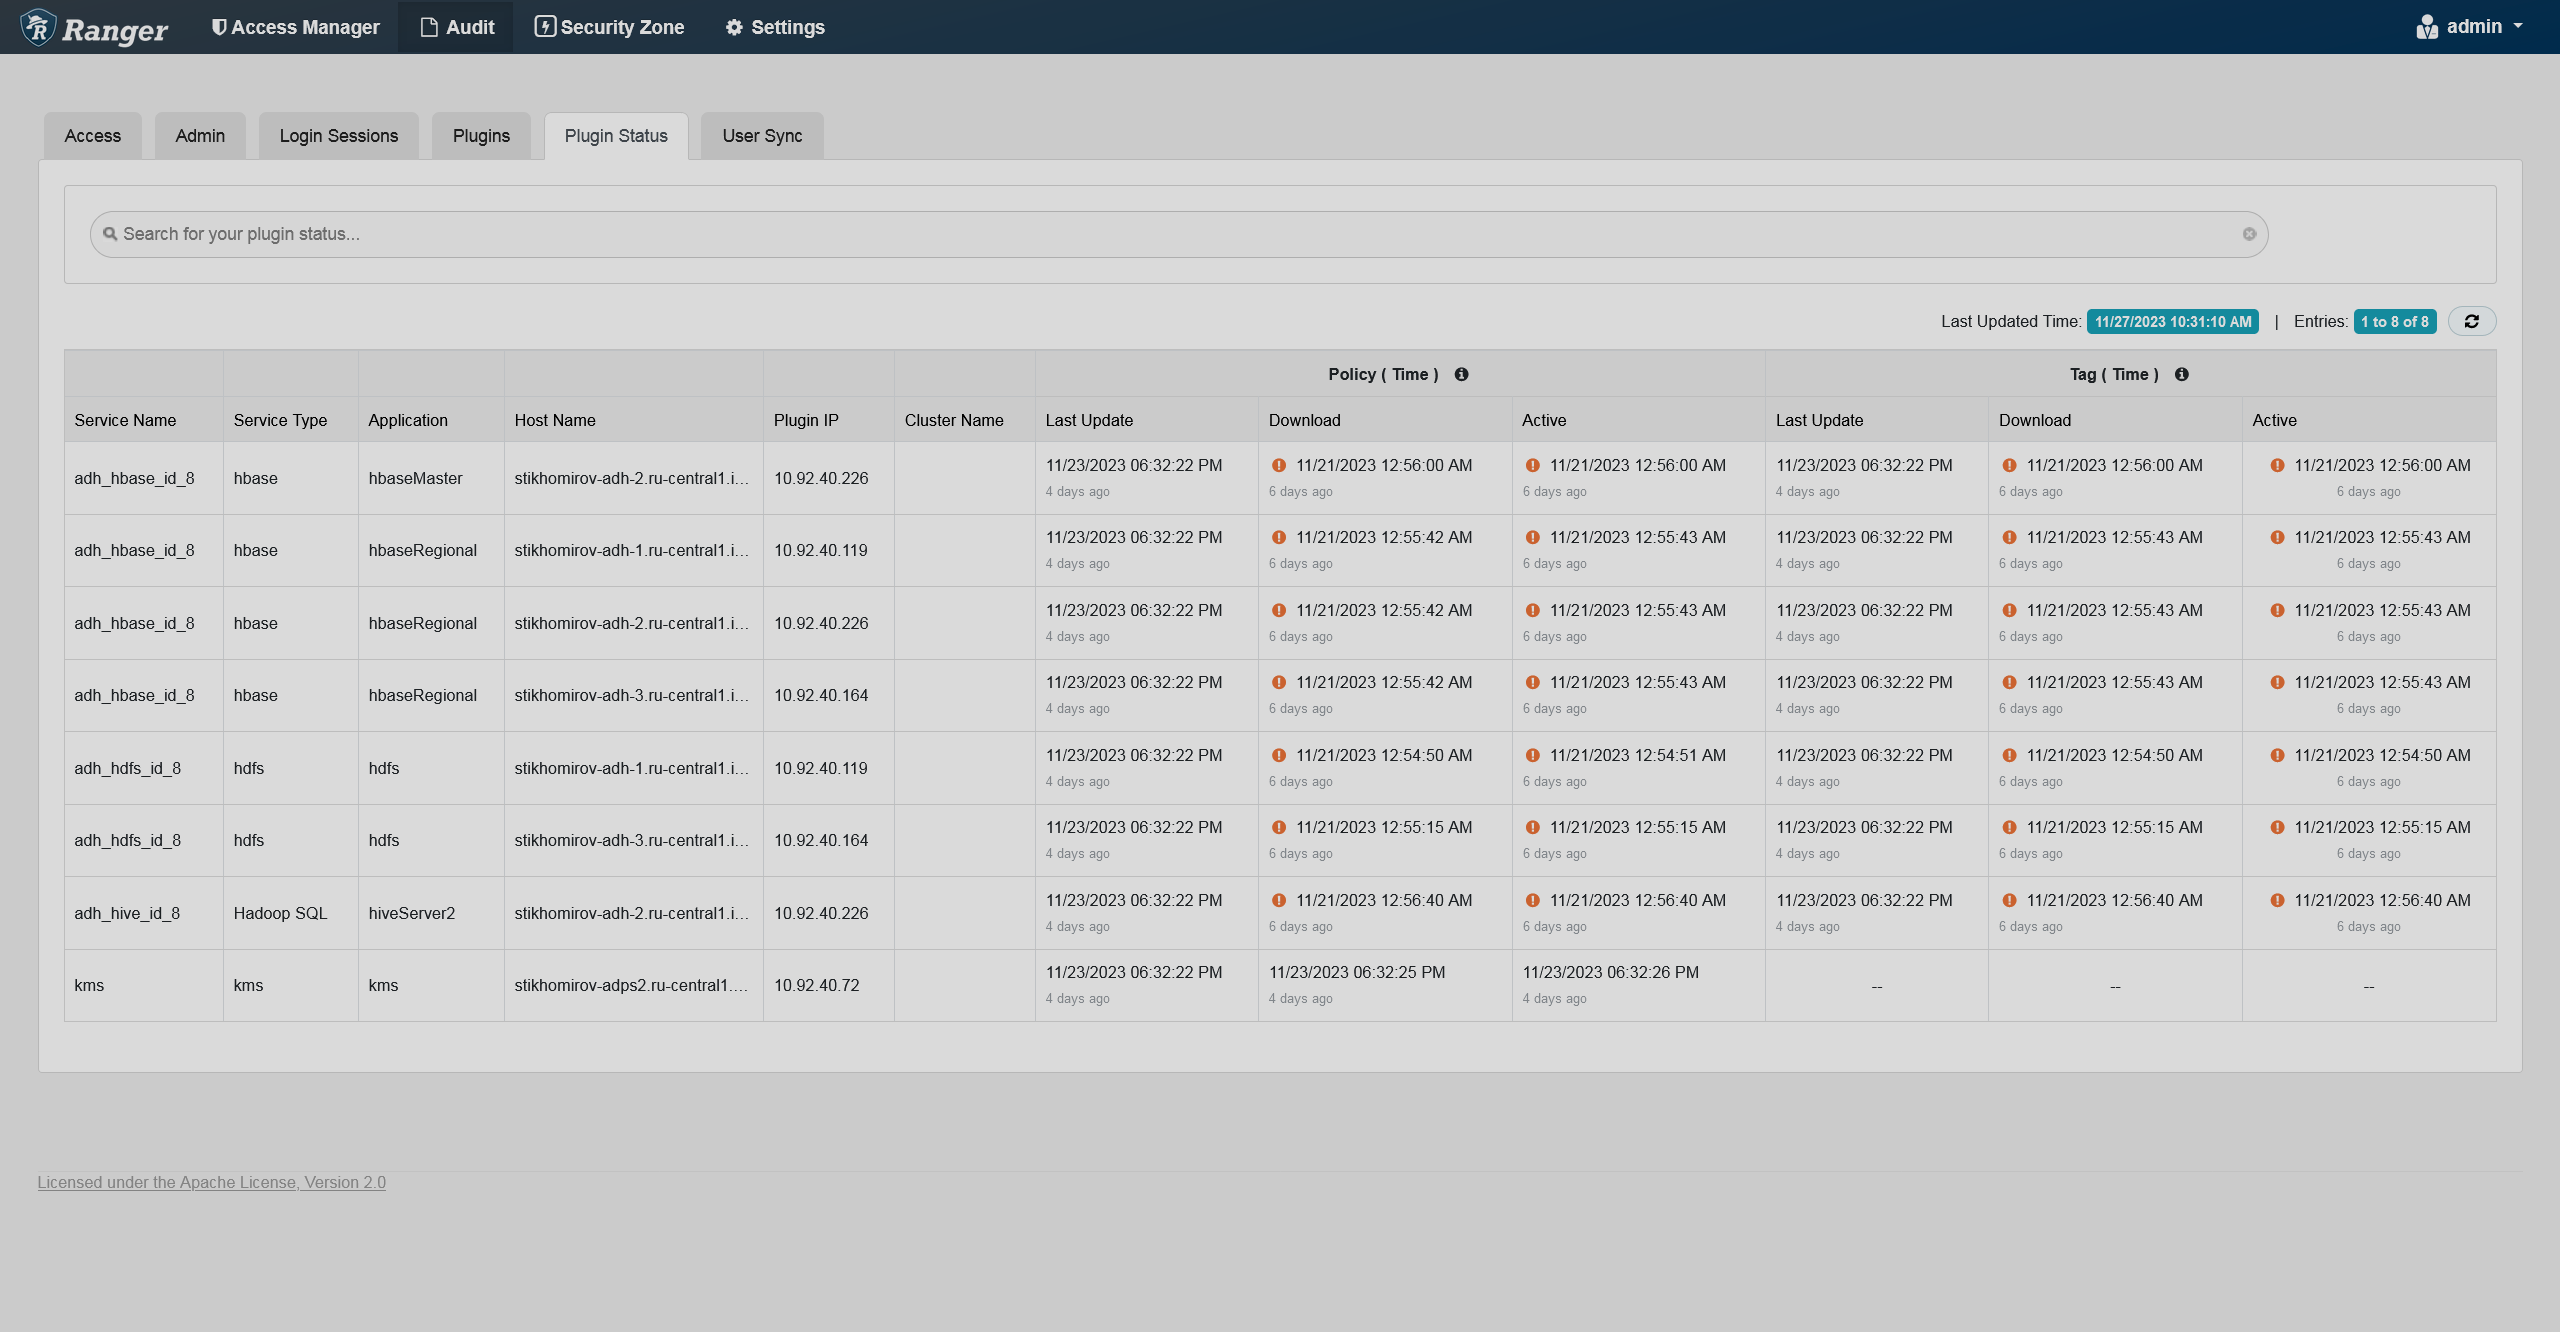
You can filter the data based on the criteria listed in the table below.
| Search criteria | Description |
|---|---|
Application |
Application name |
Cluster Name |
Name of a cluster |
Host Name |
Name of a host; can be FQDN |
Plugin IP |
IP Address of the agent that uses the plugin |
Service Name |
Name of the service that contains the policies |
Service Type |
Type of a service |
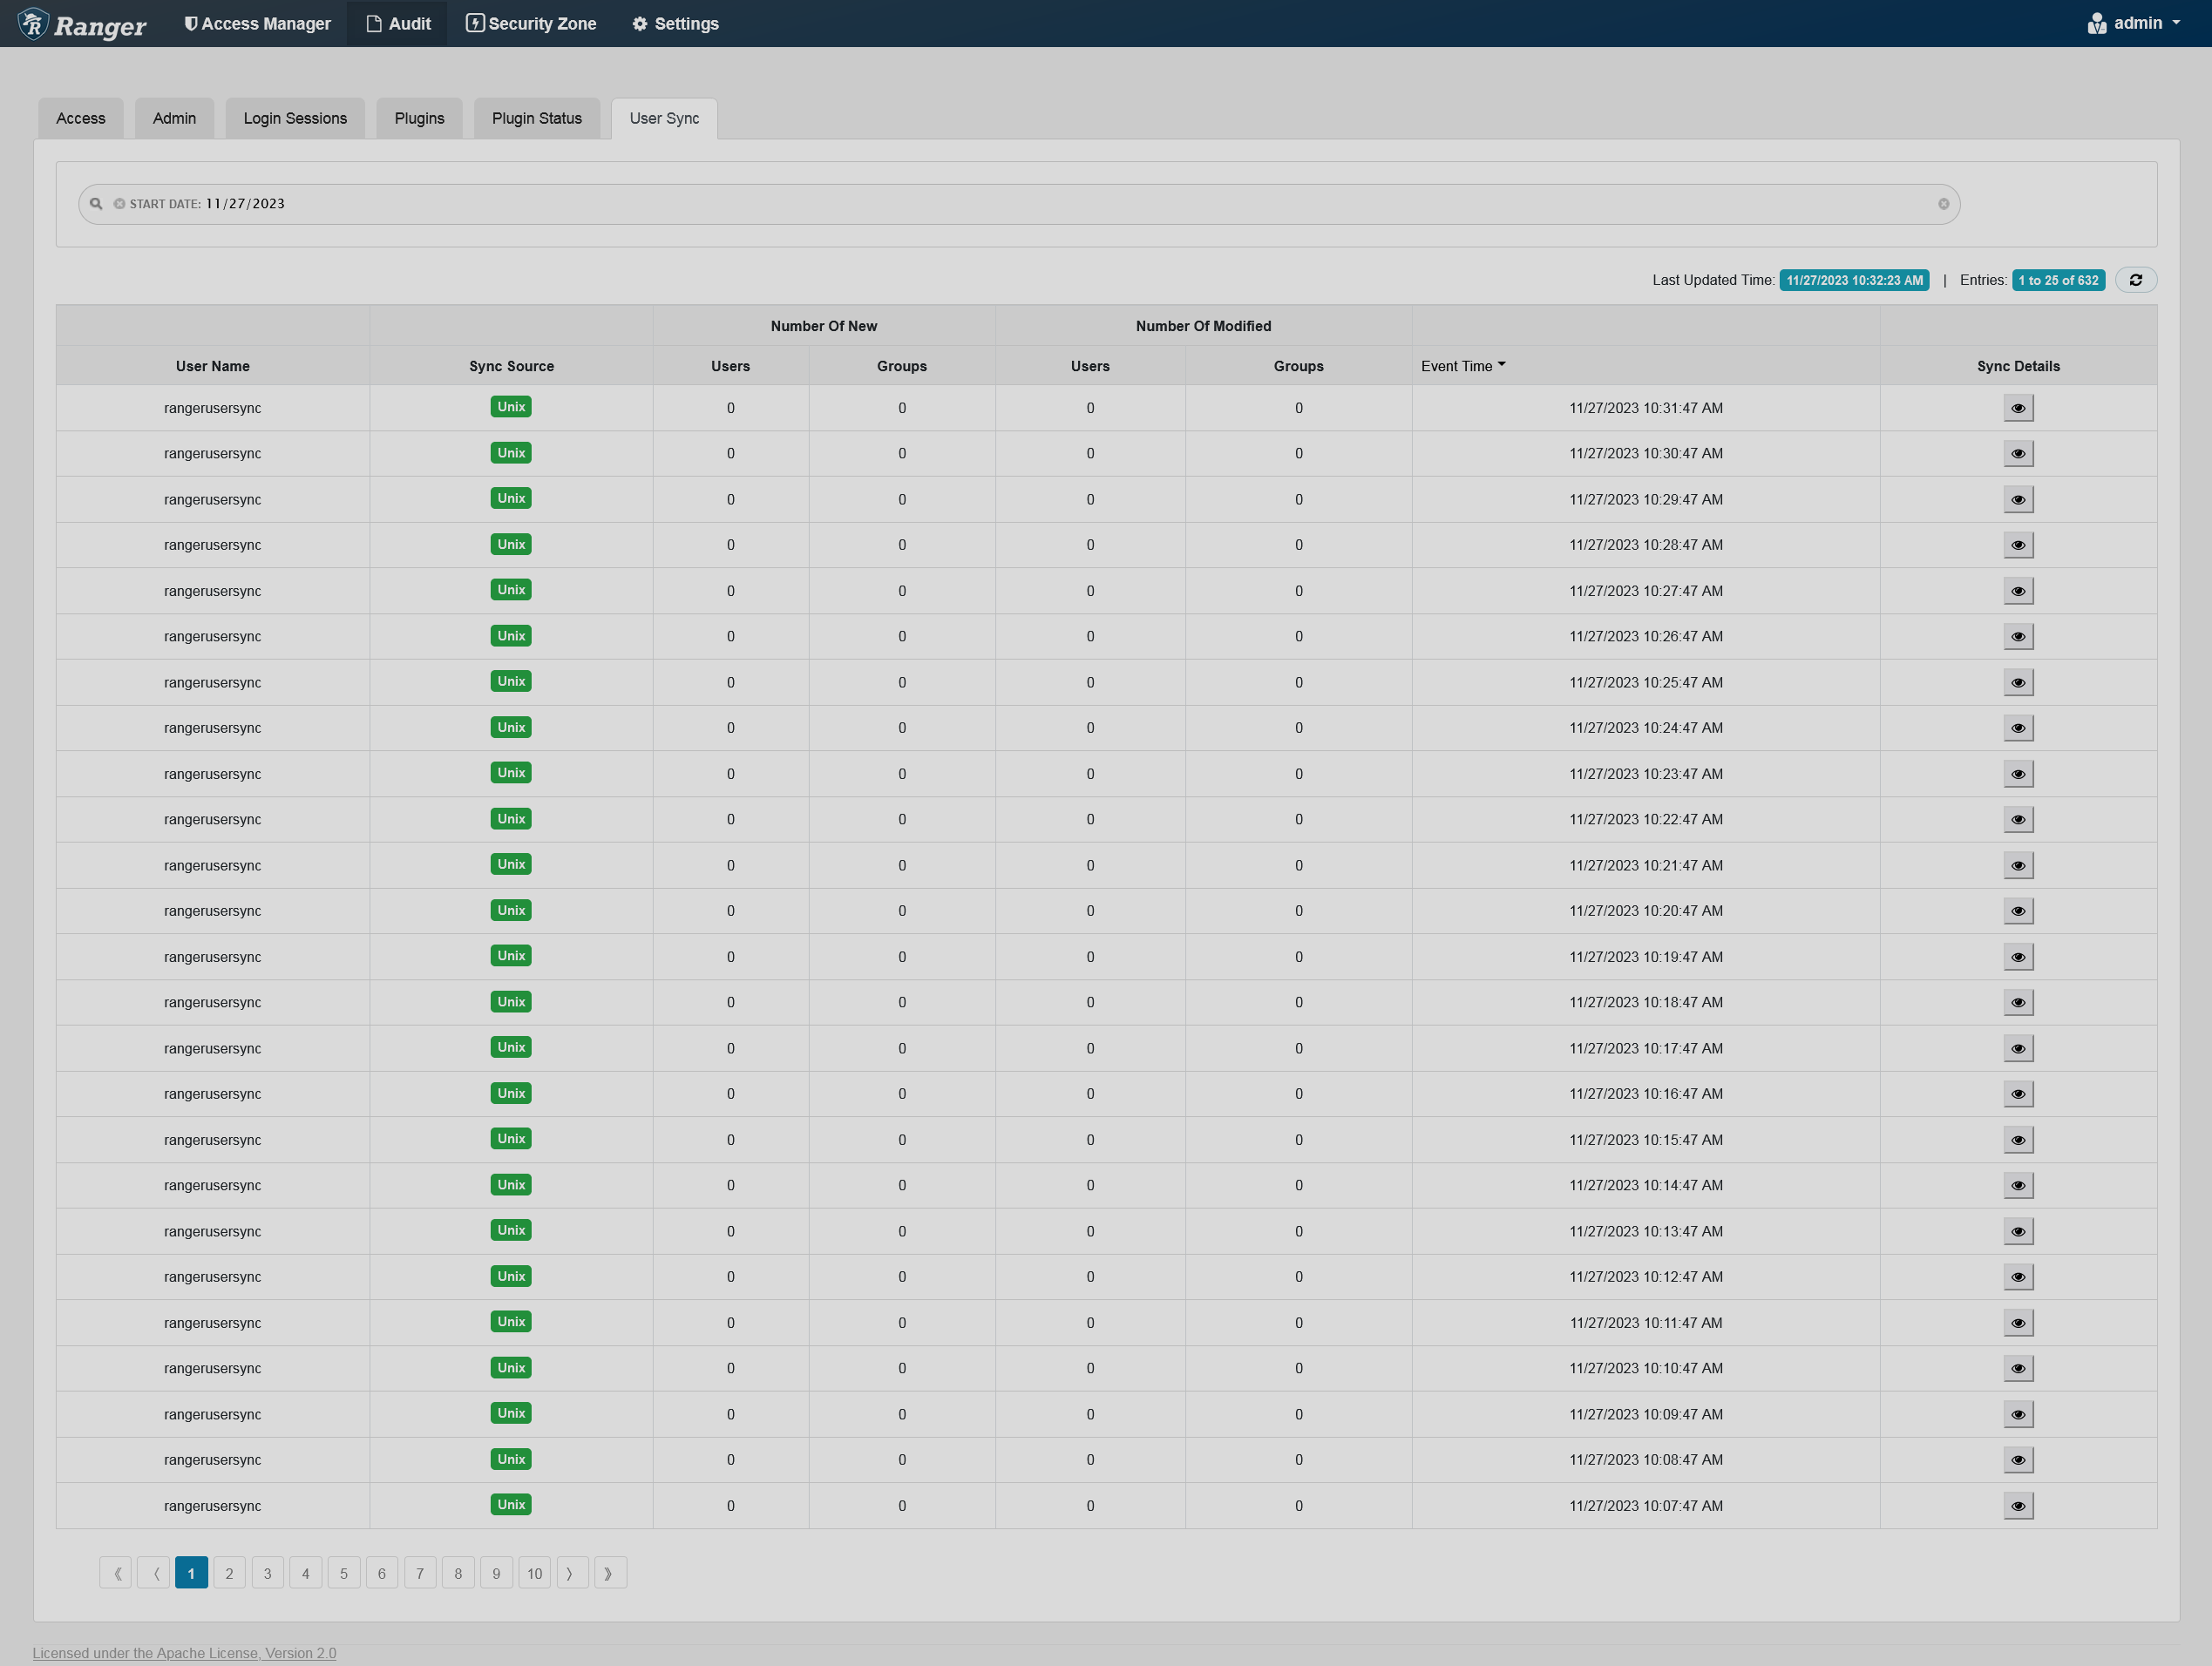
User Sync
The User Sync tab provides service activity data for all usersync processes in Ranger. This data represents an audit trail for users and groups synchronized with each run of usersync.
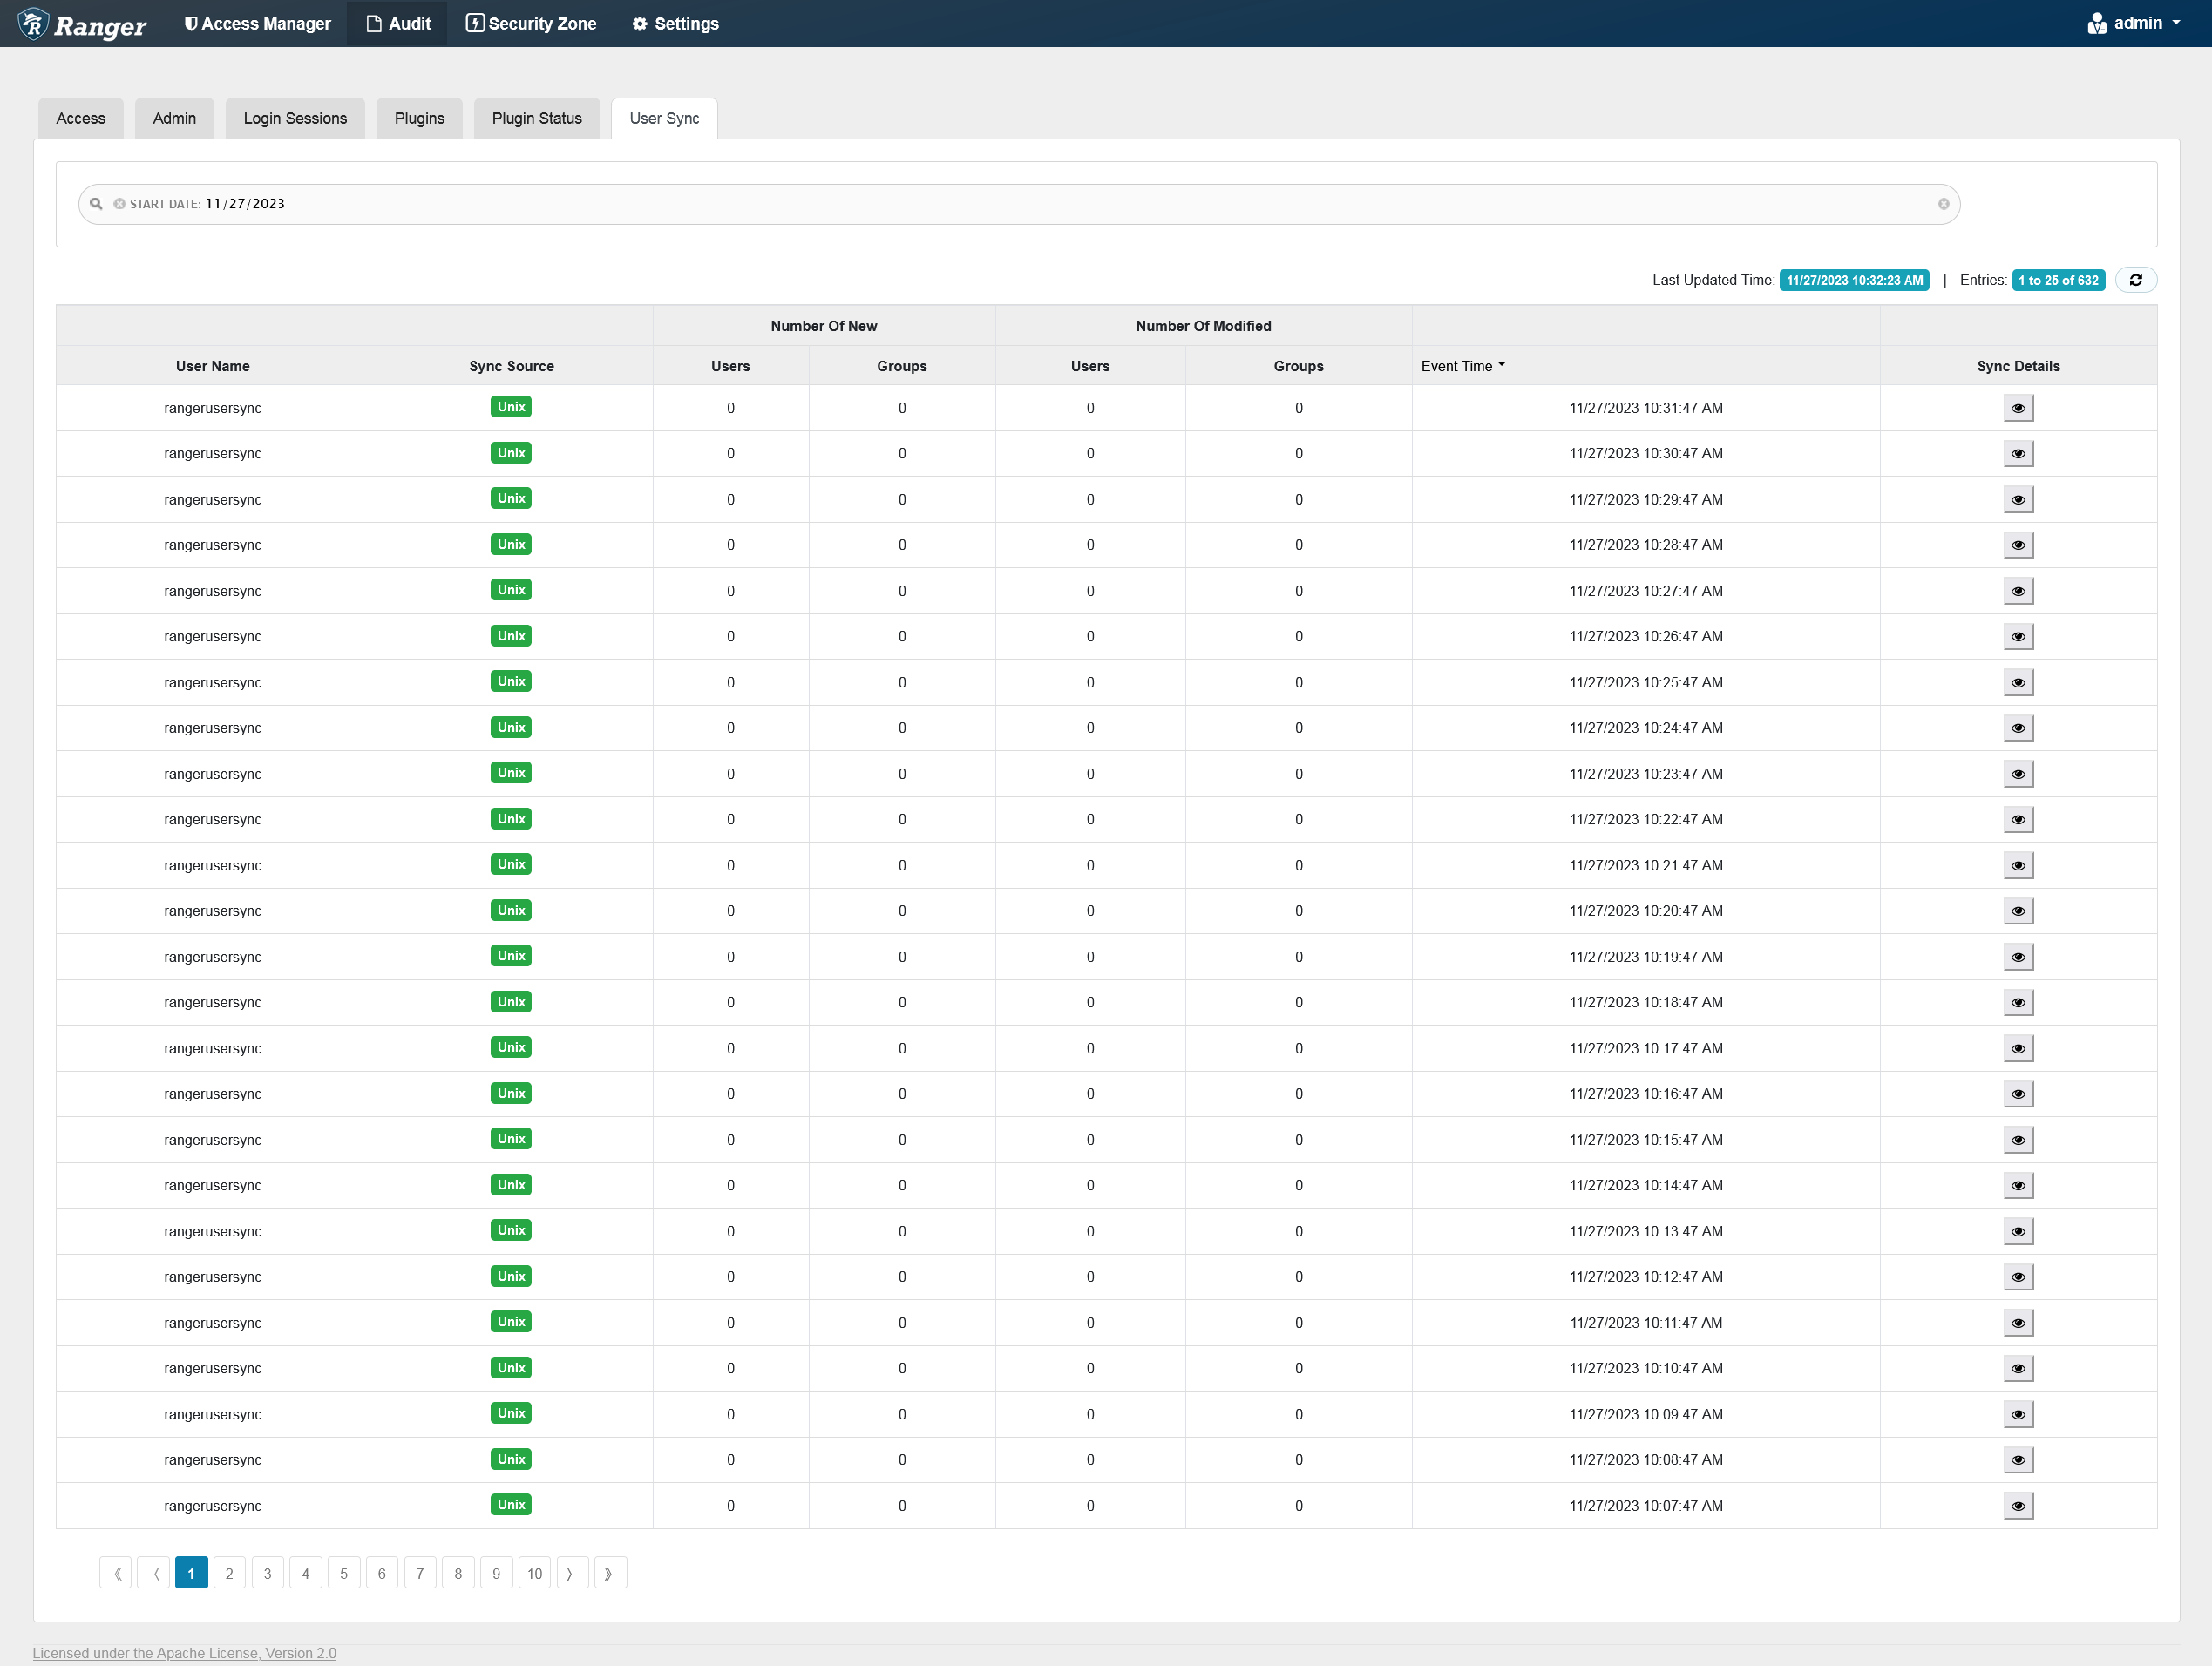
You can filter the data based on the criteria listed in the table below.
| Search criteria | Description |
|---|---|
Sync Source |
Source type (e.g. file, LDAP/AD, or Unix) |
User Name |
Name of the user who tried to access the resource |
Start Date |
Start date for a date range filter |
End Date |
End date for a date range filter |