
Use Session manager
Session manager provides real-time monitoring of active sessions in the ADP/PostgreSQL cluster. It allows you to review session information and terminate an active query or session for each backend process ID (PID).
To use Session manager, open the Session manager page of the ADP Control web interface. You can select the cluster for which the sessions should be displayed from the Cluster drop-down list at the top of the page.
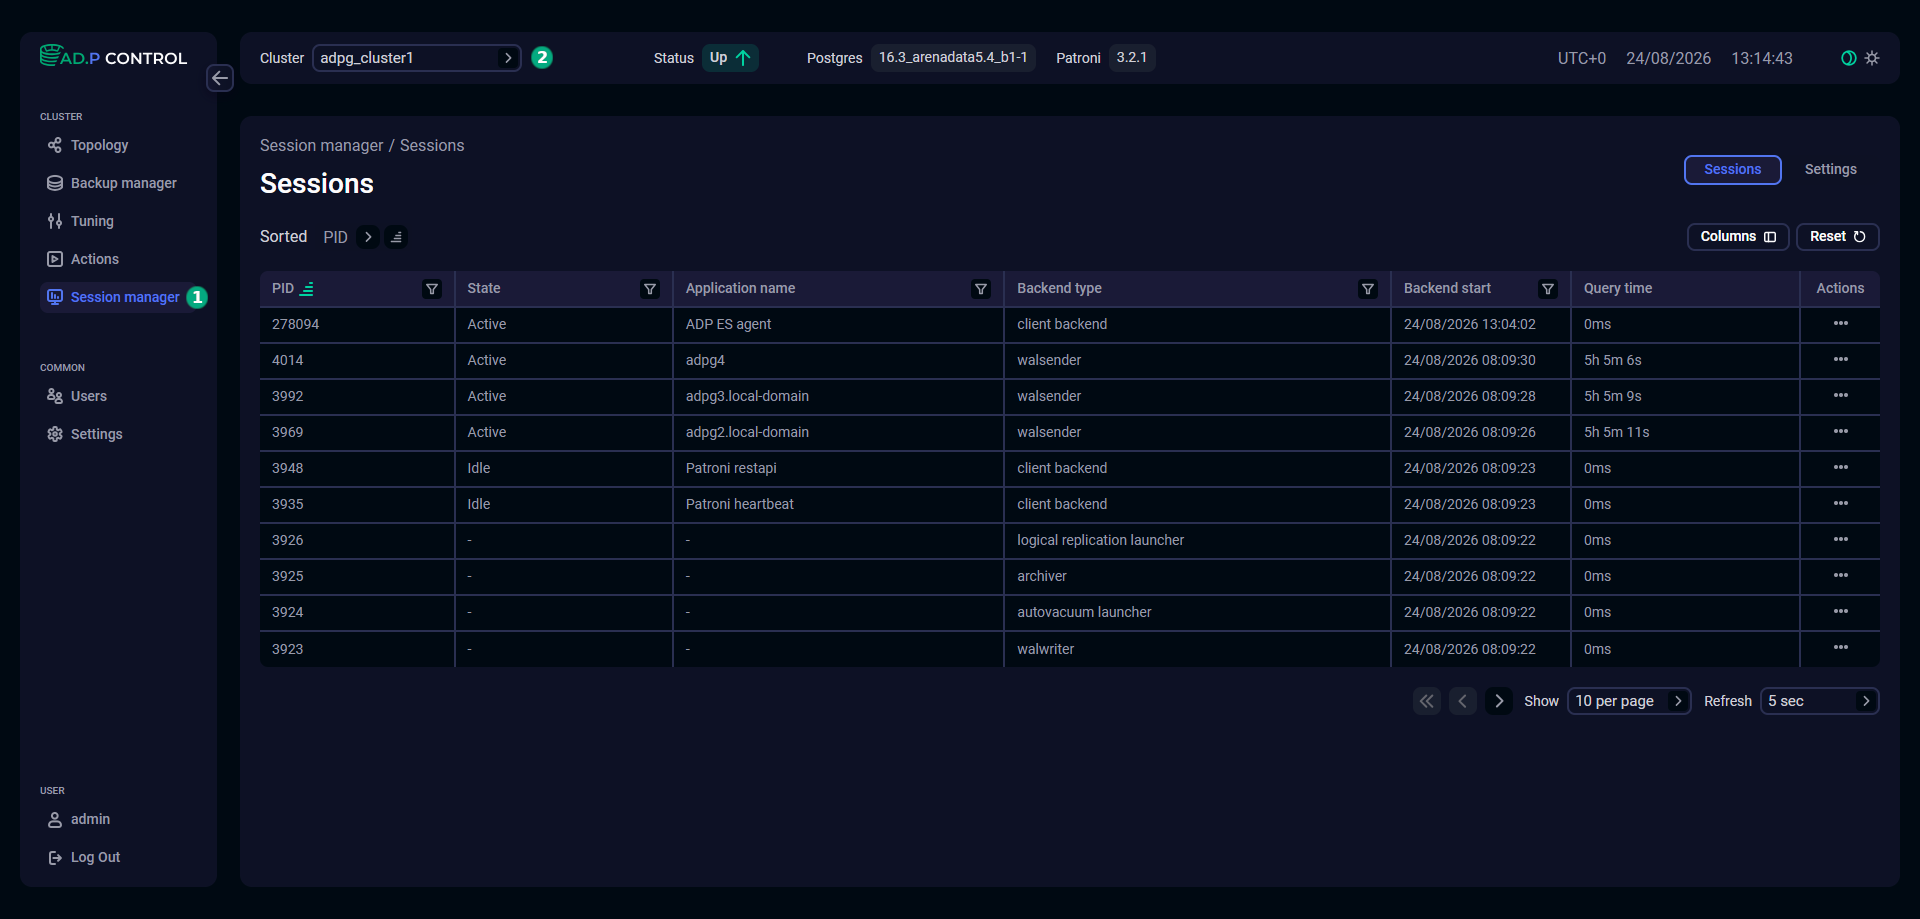
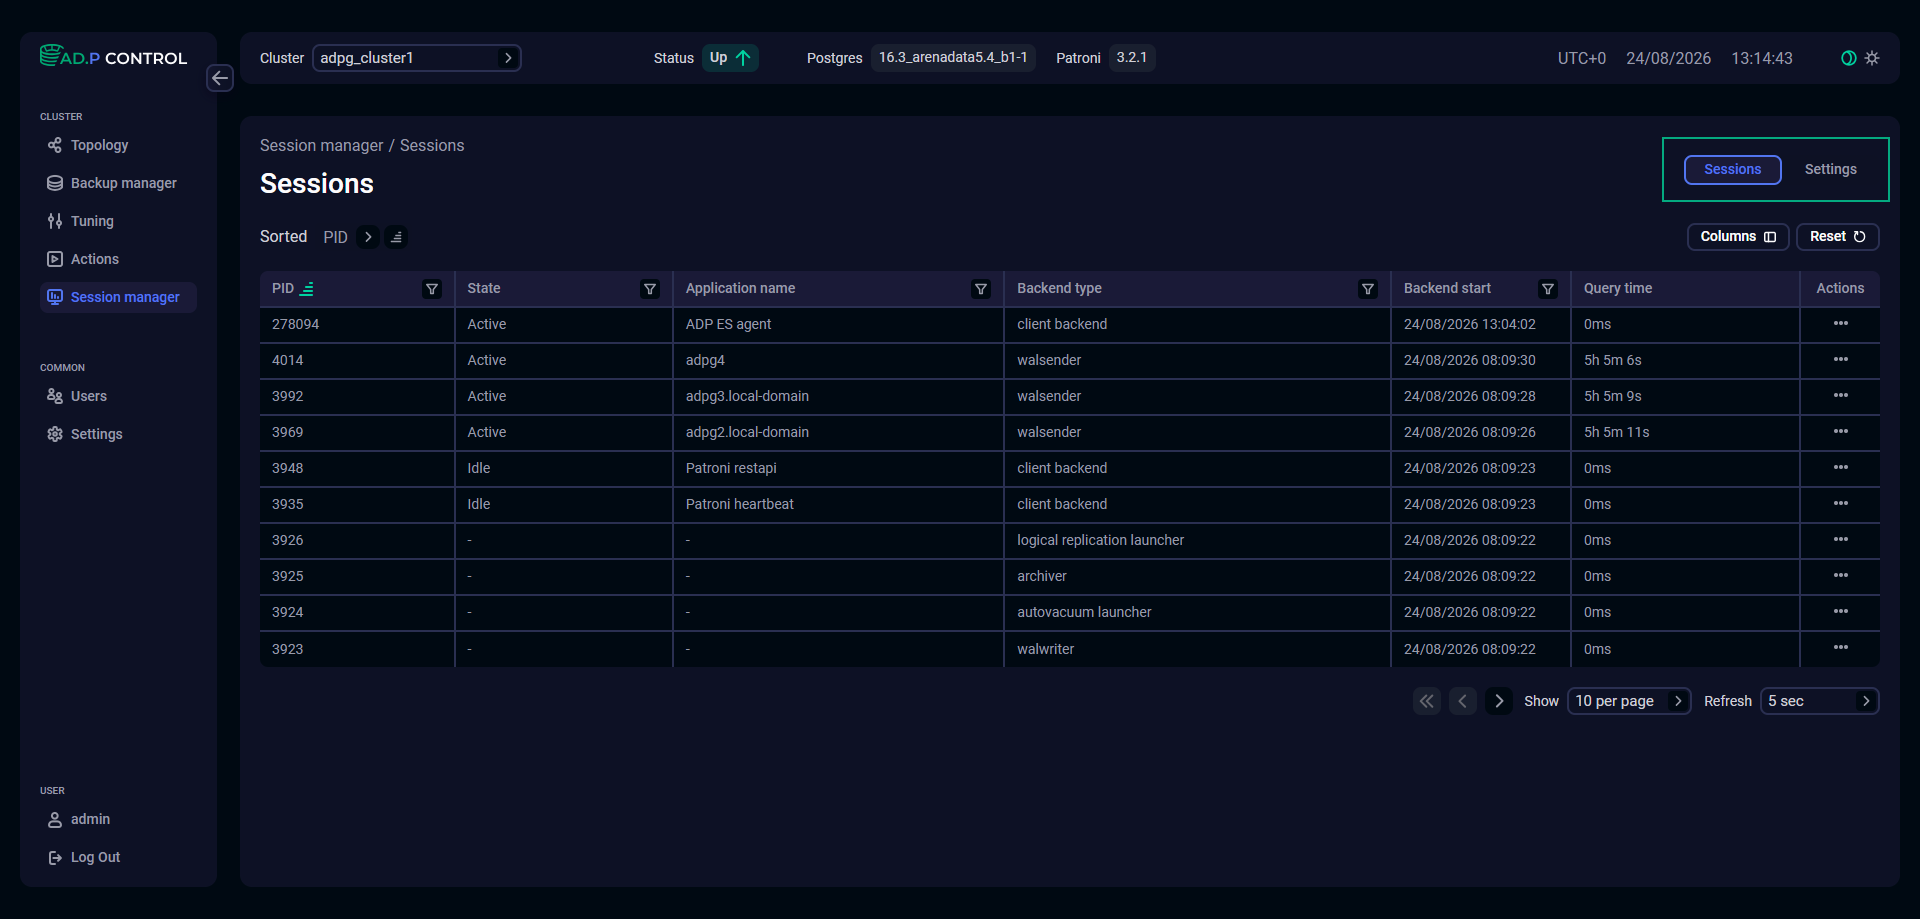
The Session manager page contains the following tabs:
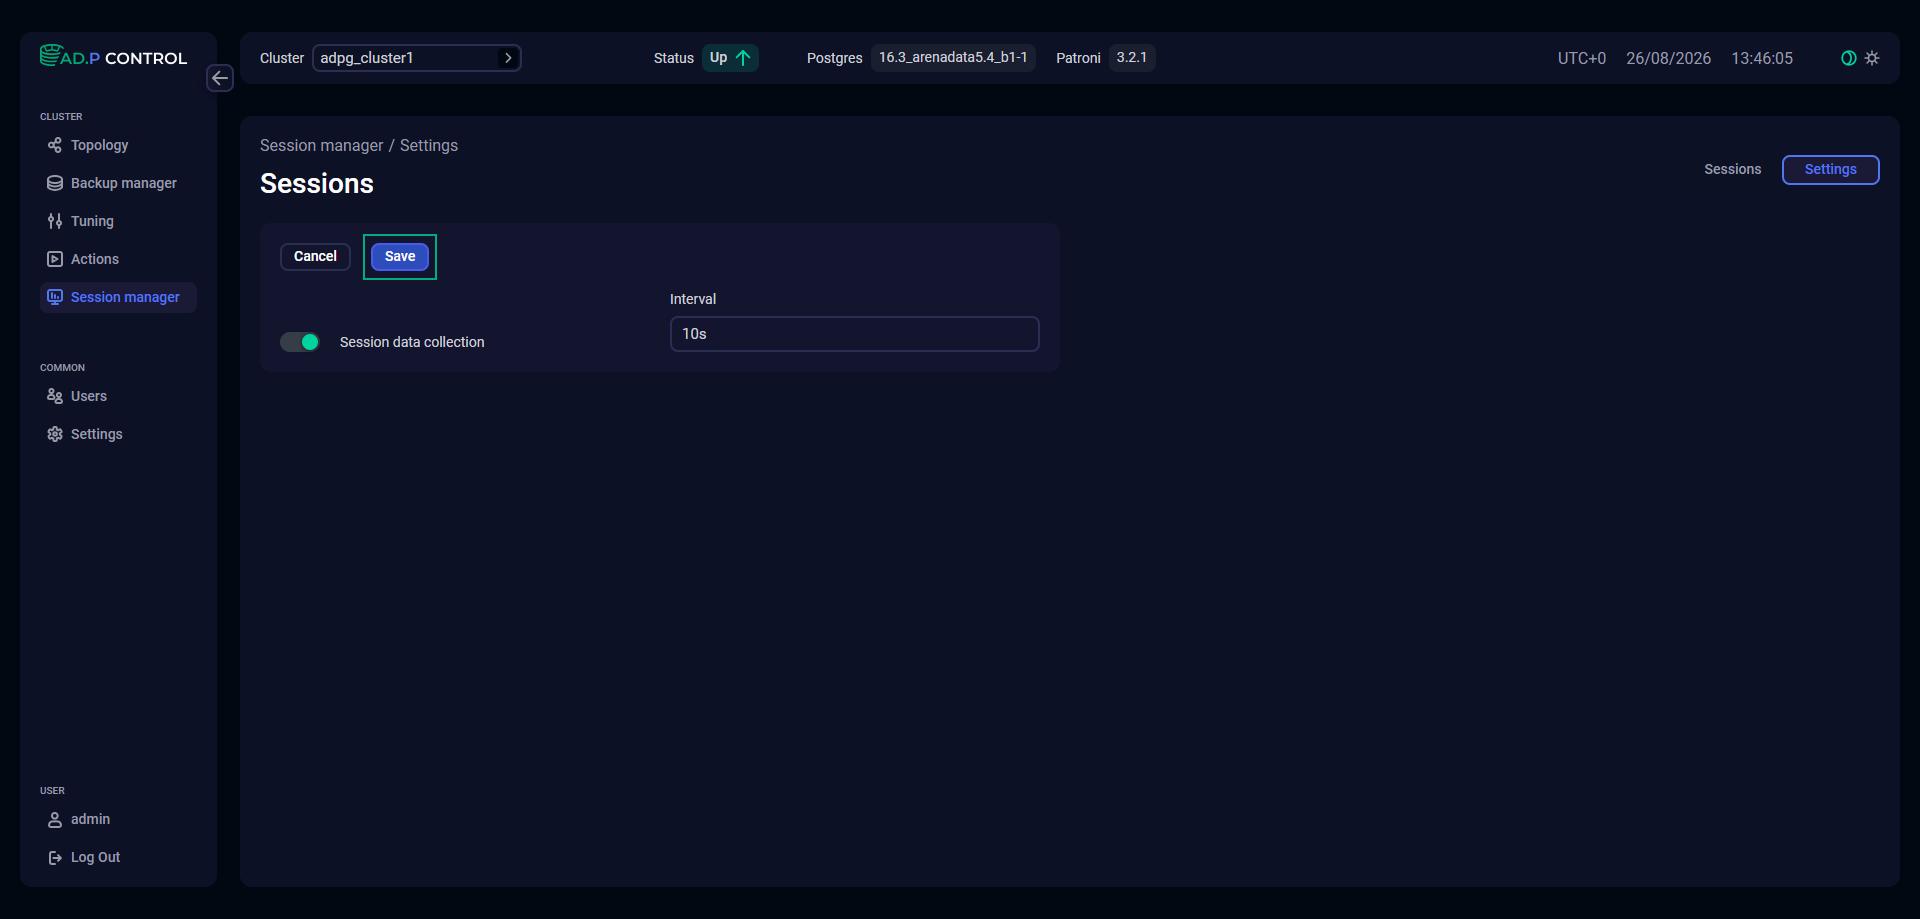
By default, session monitoring is disabled. You can enable it on the Settings tab.
Sessions tab
The Sessions tab displays a table with session information. The table fields are listed in the table below.
| Name | Description |
|---|---|
PID |
Backend process ID |
State |
State of the current backend process. Possible values are:
|
Application name |
Name of the application that connects to the backend process |
Backend type |
Type of the current backend process |
Backend start |
Time when the backend process was started |
Query time |
Time of active query execution |
Actions |
Contains the |
Database |
Name of the database the backend process connects to |
Username |
Name of the user who started the backend process |
Host |
IP address of the client connected to this backend process |
Port |
TCP port number that the client is using for communication with this backend process |
Query start |
Time when the currently active query was started; if the state is not |
Wait event type |
Type of the event for which the backend process is waiting. Possible values are:
|
Wait event |
Wait event name if a backend process is currently waiting |
Query text |
Text of the backend’s most recent query |
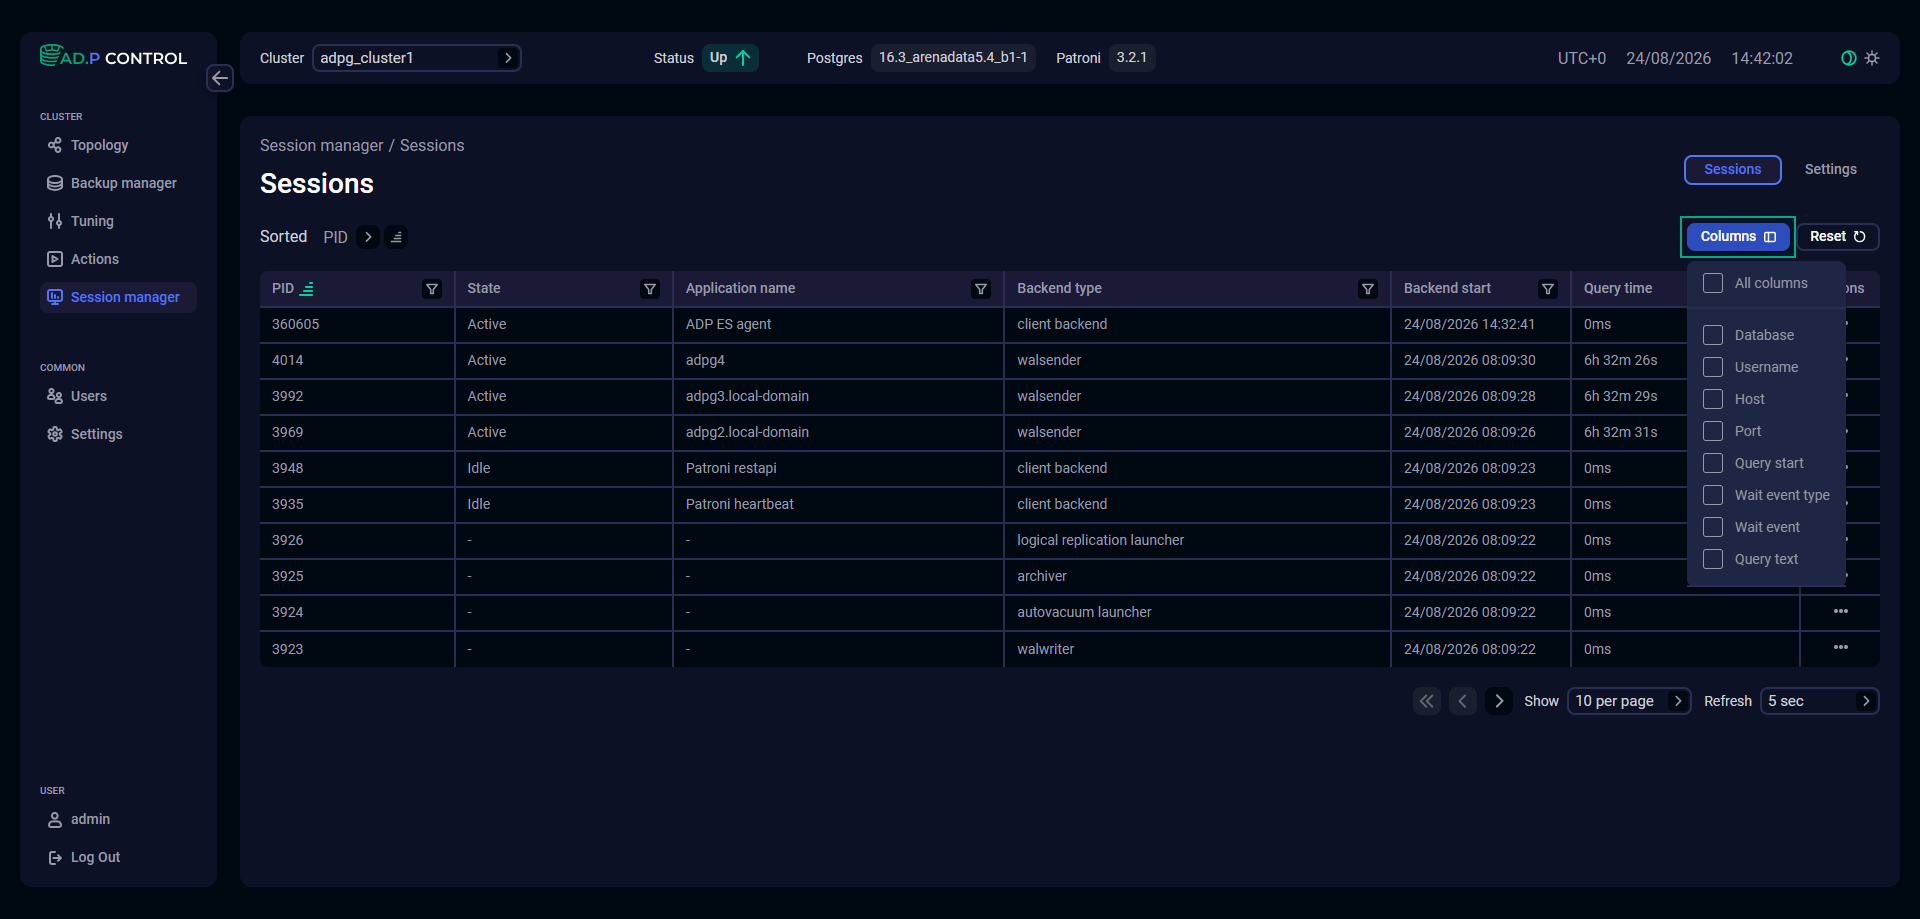
By default, the PID, State, Application name, Backend type, Backend start, Query time, and Actions fields are shown in the table. To display other fields, click Columns above the table and select the required columns.
In the column headers, there are filters that you can use to select specific data. To open a filter, click the 
 icon. For the columns where the set of possible values is limited (for example,
 State), you can select a value from the drop-down list.
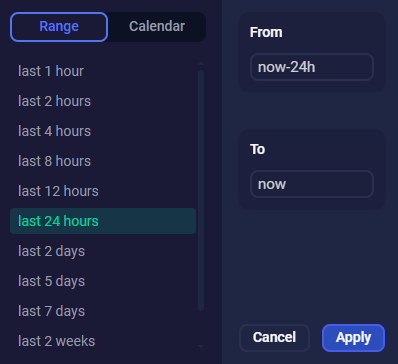
For columns that show date and time (for example, Query start), the period of time can be selected from the list of predefined ranges or from a calendar.
The 
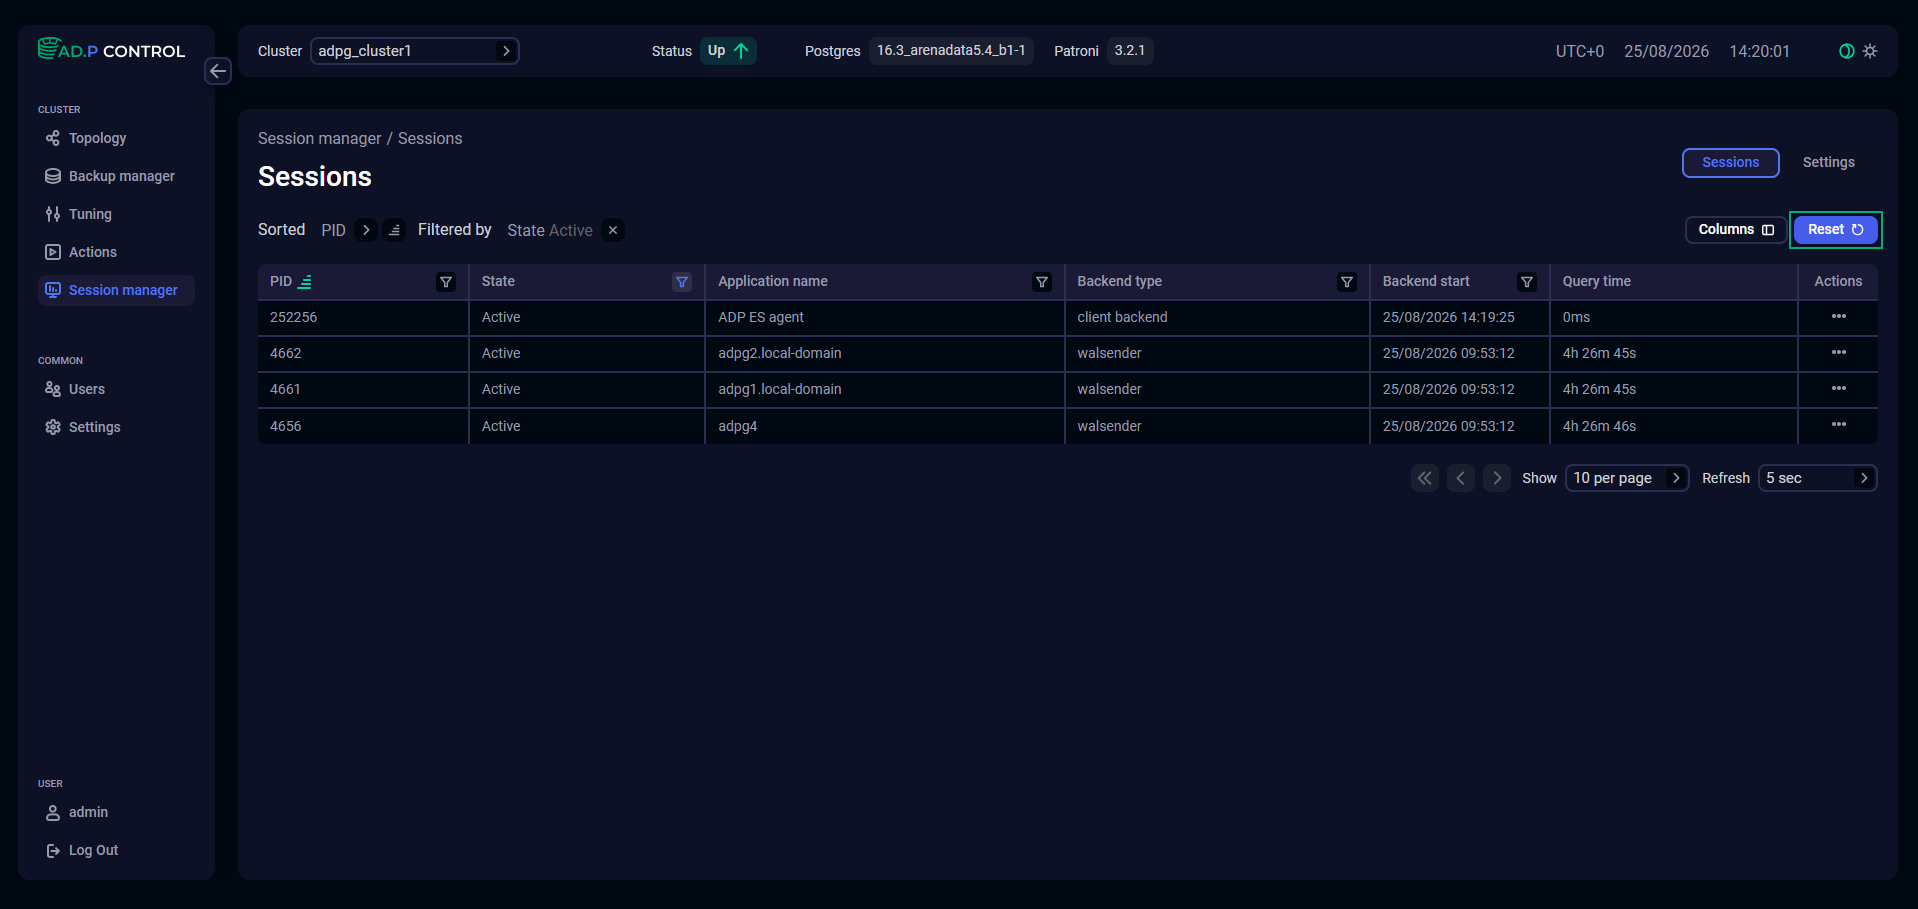
 icon means that a filter is defined for the column. To reset all filters to their default values, click Reset.
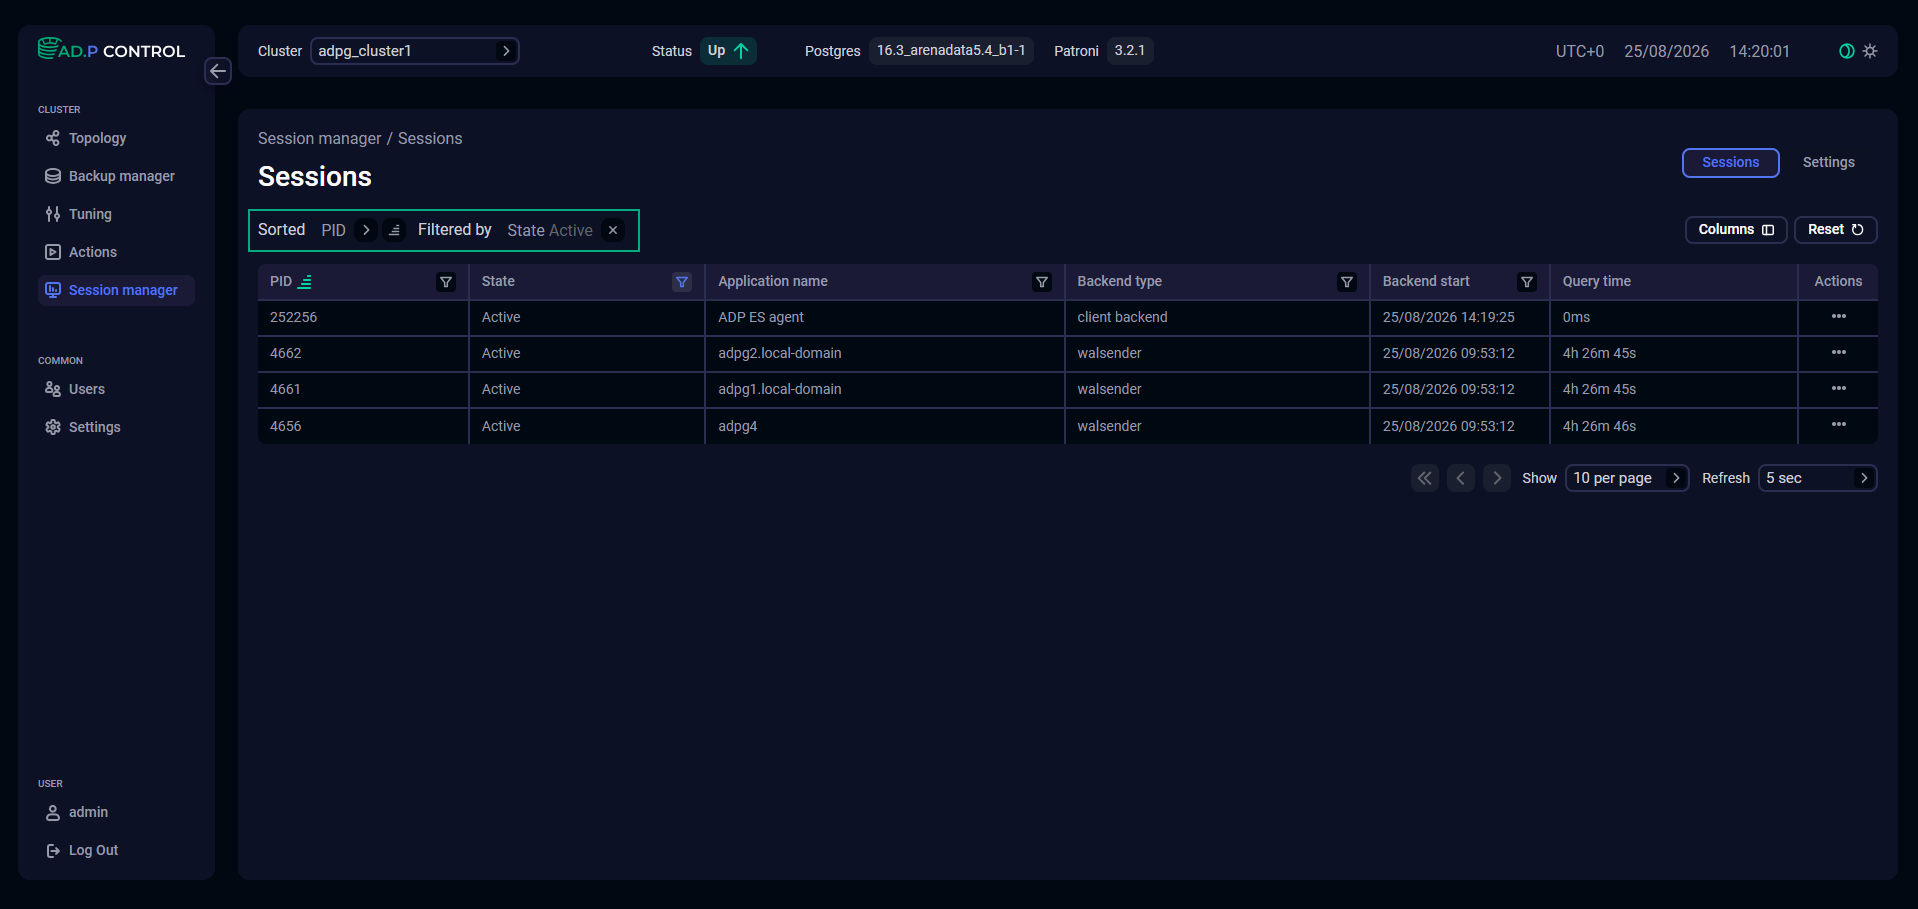
Also, the applied filters and sorting are displayed above the table with sessions.
Session manager actions
On the Sessions tab, you can run the following session actions:
-
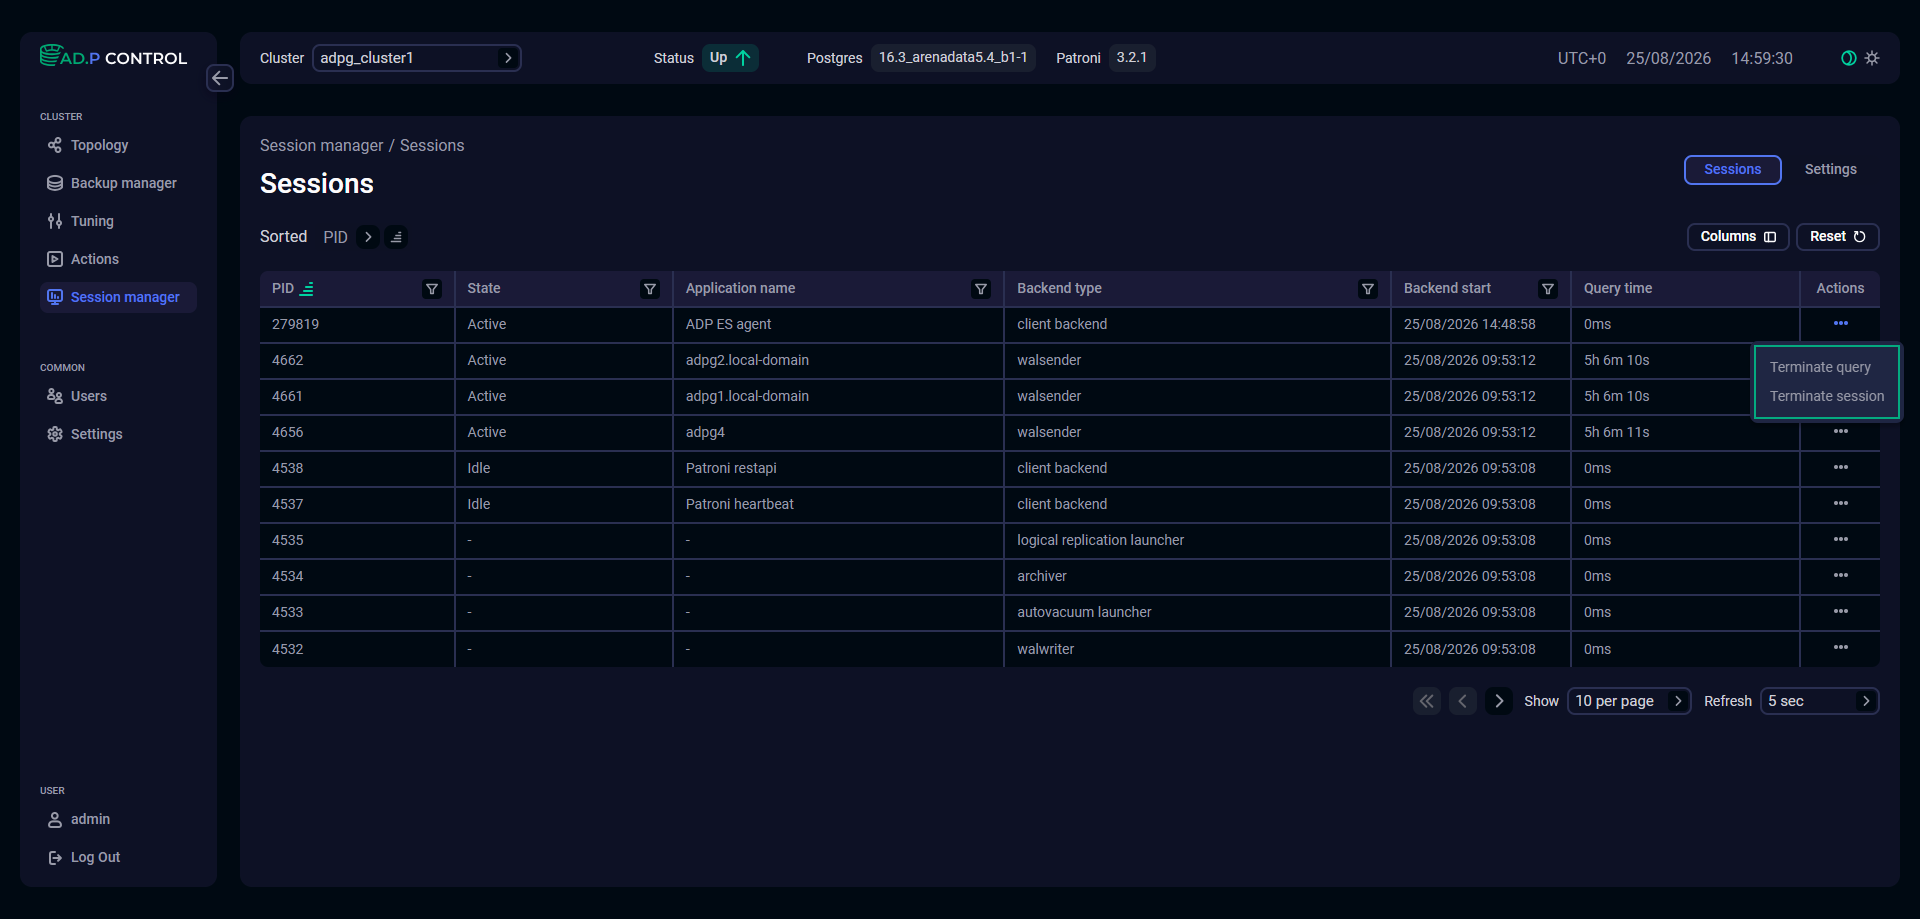
Terminate query — stops the active query execution in a related backend process without the session termination (similar to the
pg_cancel_backendPostgreSQL function); -
Terminate session — terminates the session and closes the connection (similar to the
pg_terminate_backendPostgreSQL function).
To run a session action, click the 
 icon in the
 Actions column and select an action from the list.
Settings tab
The Settings tab allows you to manage session monitoring. Click Edit to change Session manager settings.
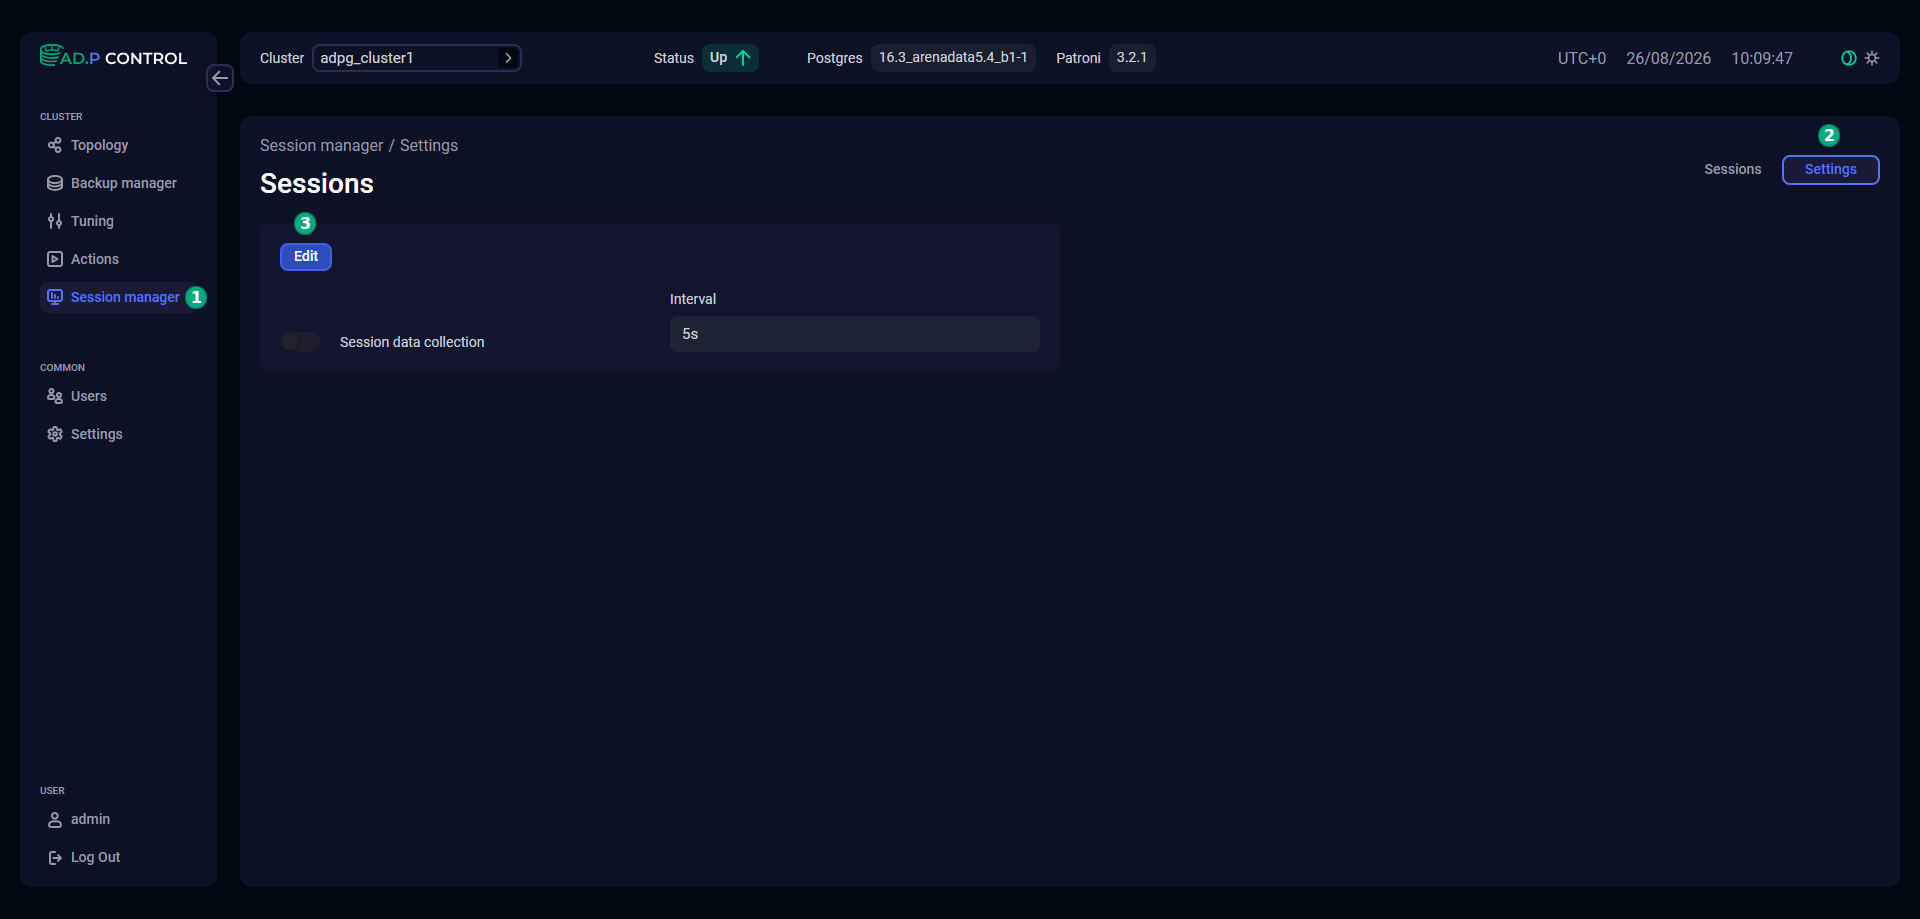
To enable or disable session monitoring, use the Session data collection toggle.
To specify how often monitoring agents should gather ADP/PostgreSQL session metrics, set the Interval field value. The minimum value is 1s, the maximum value is 24h. The following units can be used:
-
s— seconds; -
m— minutes; -
h— hours; -
d— days.
After you specify the required settings, click Save.