

Integrate ADP ES with an ADP/PostgreSQL cluster
ADP ES allows you to manage ADP and PostgreSQL clusters. The ADP bundle contains all the agents required for the integration with ADP ES. In case of a PostgreSQL cluster, you need to install an Arenadata X (ADX) cluster. This article provides step-by-step instructions for each of these scenarios:
|
NOTE
|
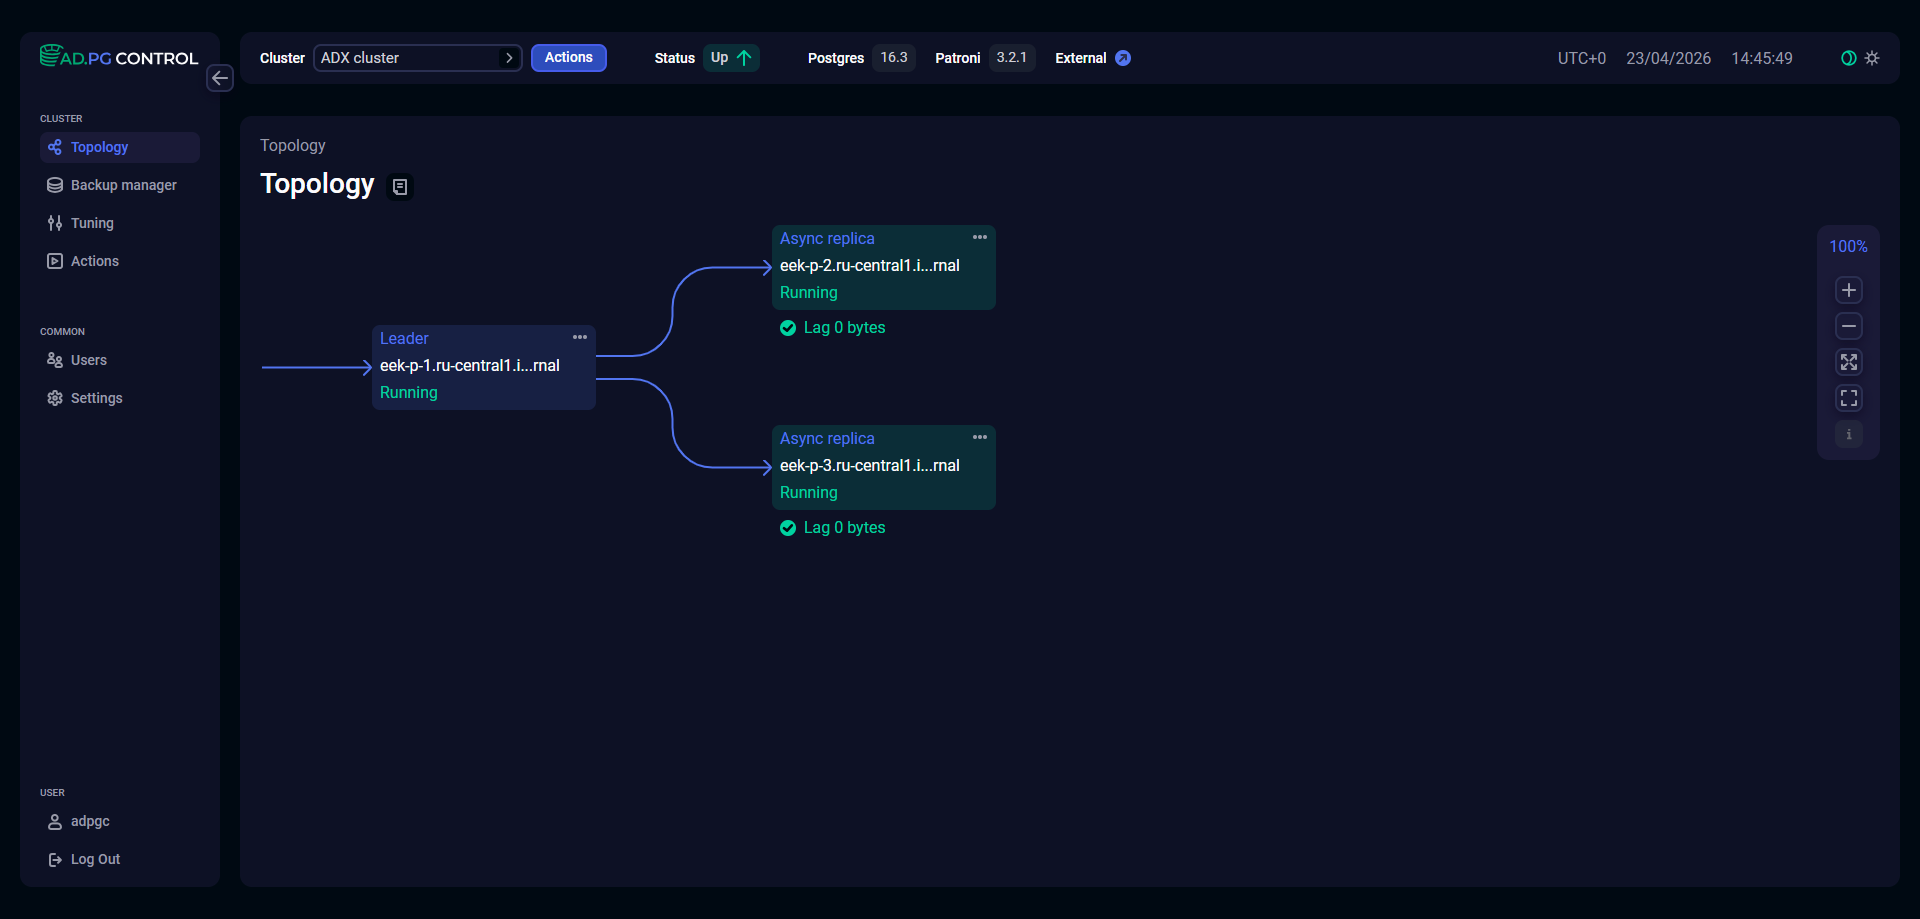
Note that the Monitoring service is required for ADP and PostgreSQL (ADX) clusters to display node parameters on the Topology page.
Integrate with an ADP cluster
The integration with an ADP cluster is performed on the ADP cluster side during its installation. To do this, follow the steps below:
-
Map the ADP Control Agent and Backup Manager Agent (optional) components of the ADP ES Agents service to all hosts with ADPG service in the ADP cluster.
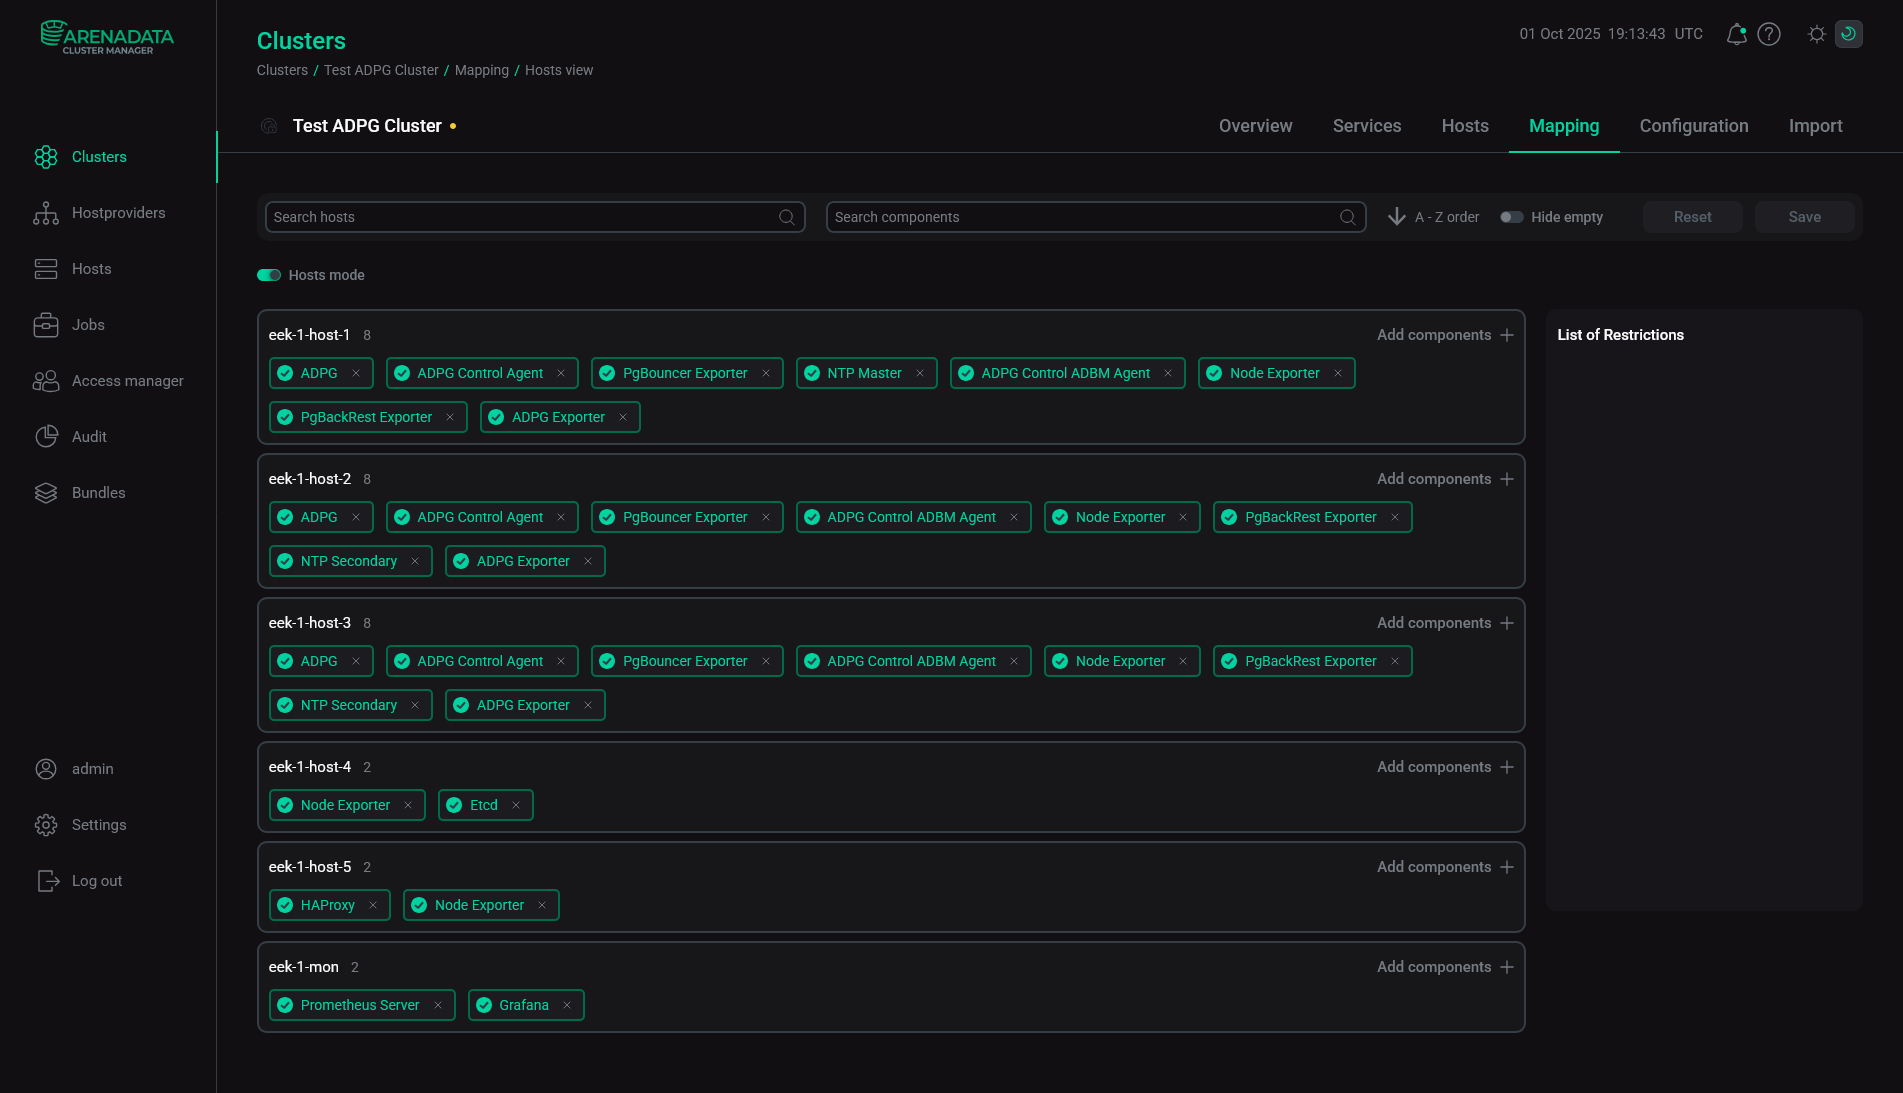 ADP Control agents mapping
 -
Open the Import tab of the ADP cluster. Select Cluster configuration and All services of ADP ES and click Import.
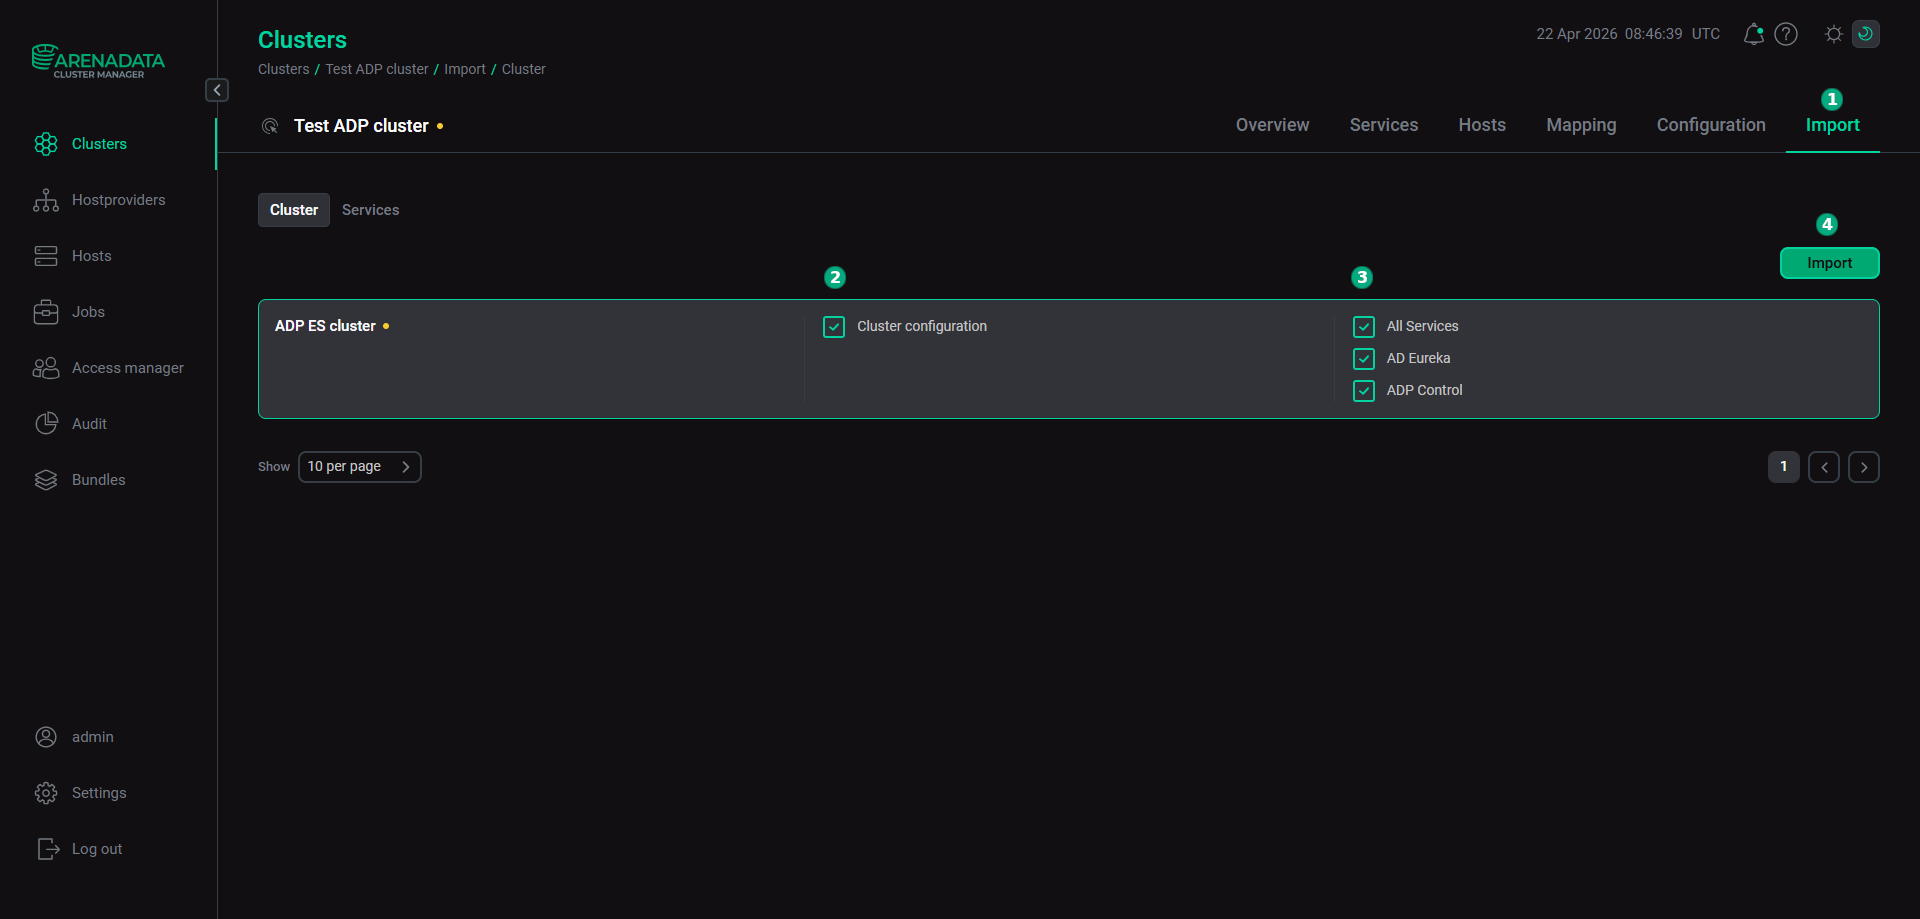 Import of the ADP ES services
 -
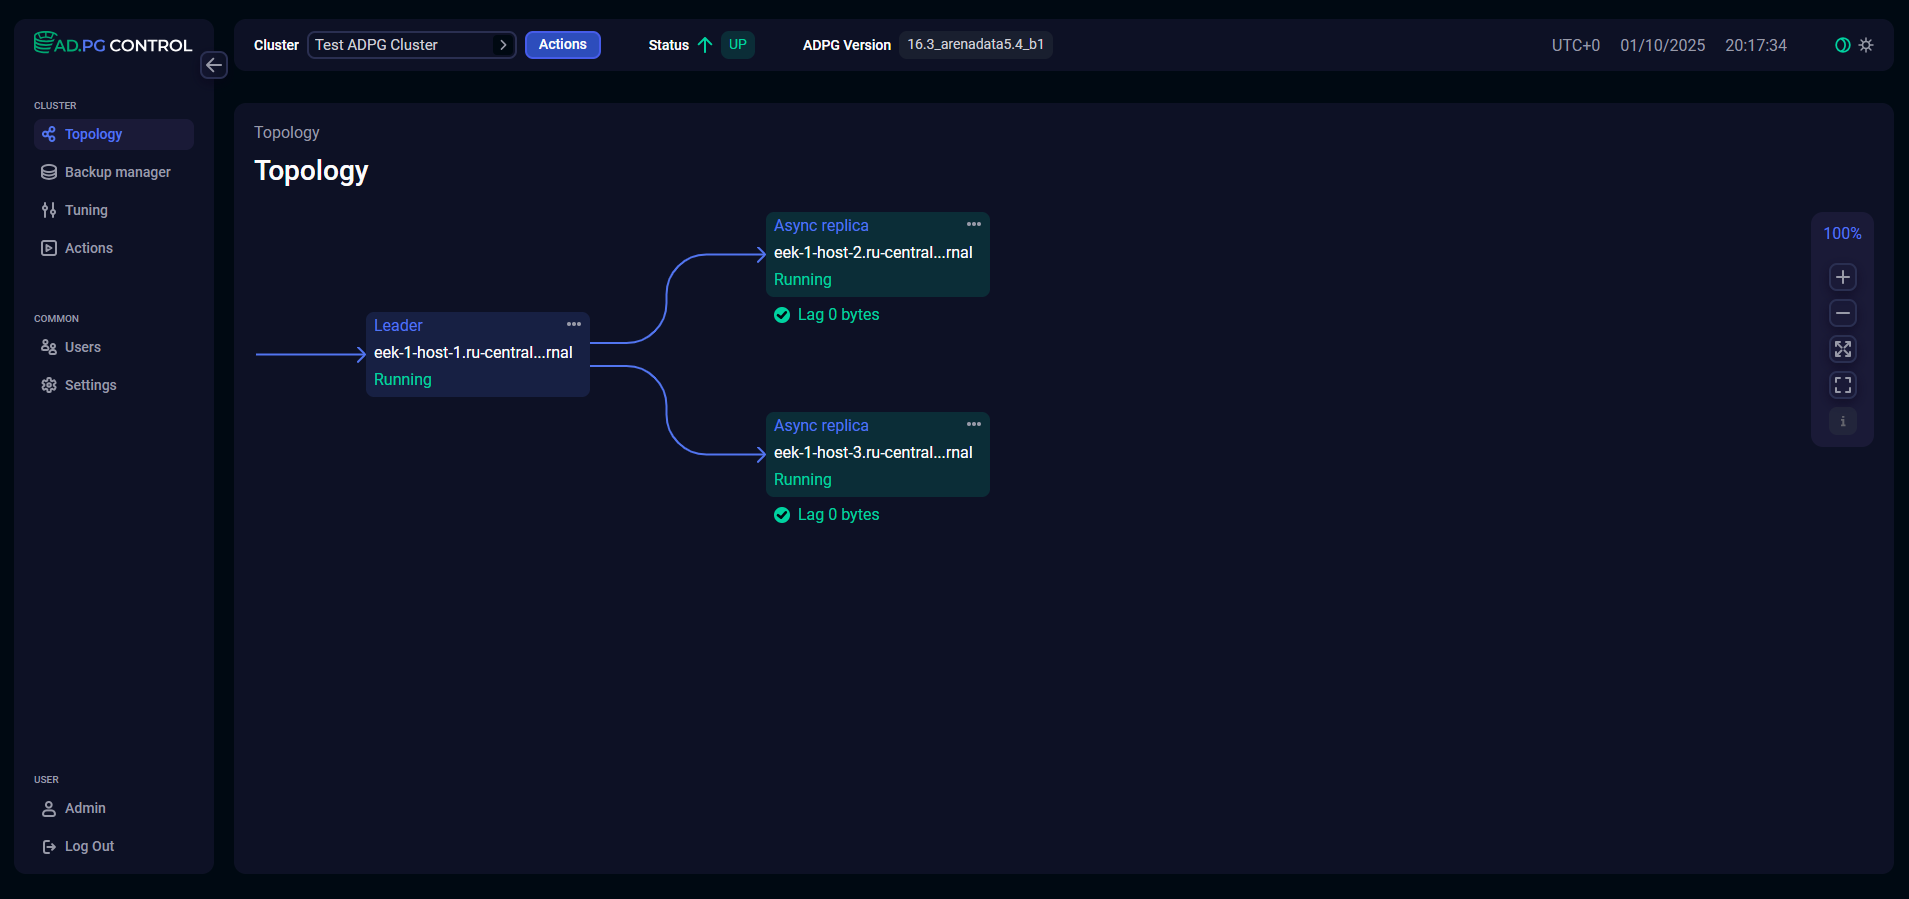
Install the ADP cluster. See Install a cluster. After installation, the ADP cluster is imported to ADP ES. You can find the ADP cluster topology on the Topology page of the ADP Control web user interface.
|
CAUTION
If you need to register your ADP cluster in a new ADP ES cluster, follow the steps below:
|
Integrate with a PostgreSQL cluster
To integrate ADP ES with a PostgreSQL cluster, perform the steps below.
-
Add hosts with the PostgreSQL cluster to ADCM. Use the SSH hostprovider to do this.
-
Get an Arenadata X (ADX) bundle from the Arenadata support team and upload a bundle to ADCM. To do this, go to the Bundles page and click Upload bundle. Then, select a bundle in the dialog window. As a result, a bundle is displayed on the Bundles page.
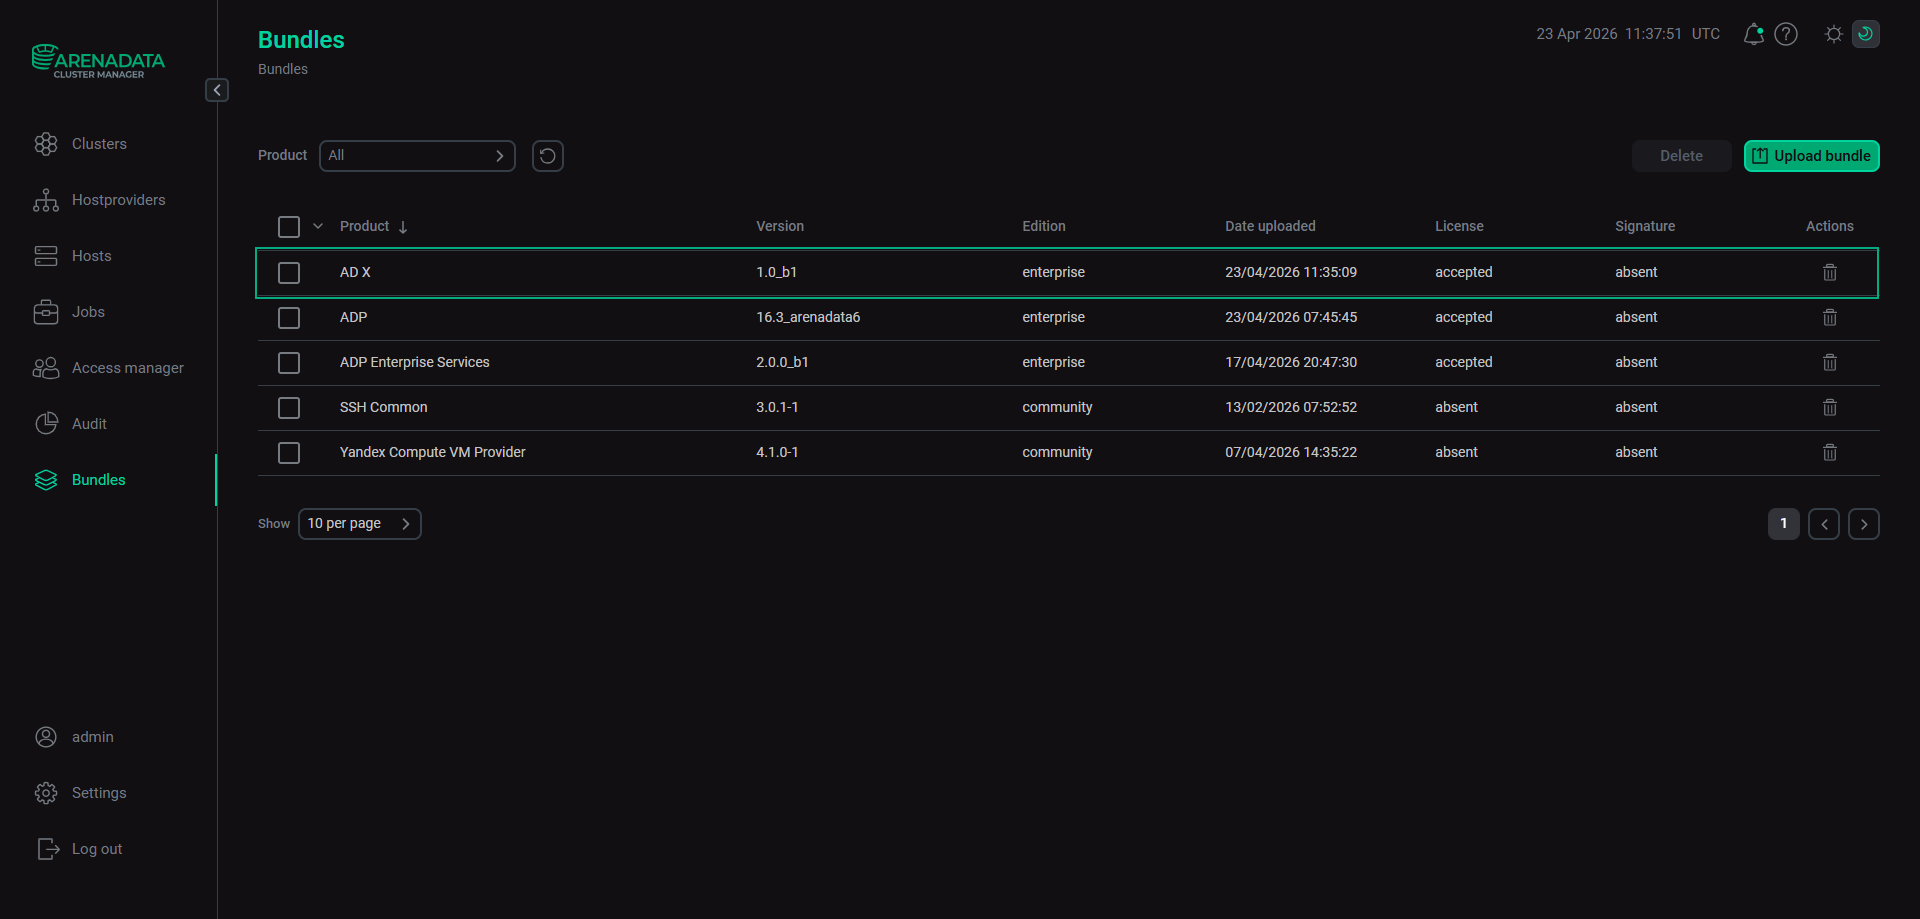 The result of successful uploading a bundle
 -
Create a cluster — select the Clusters item in the left navigation menu and click Create cluster.
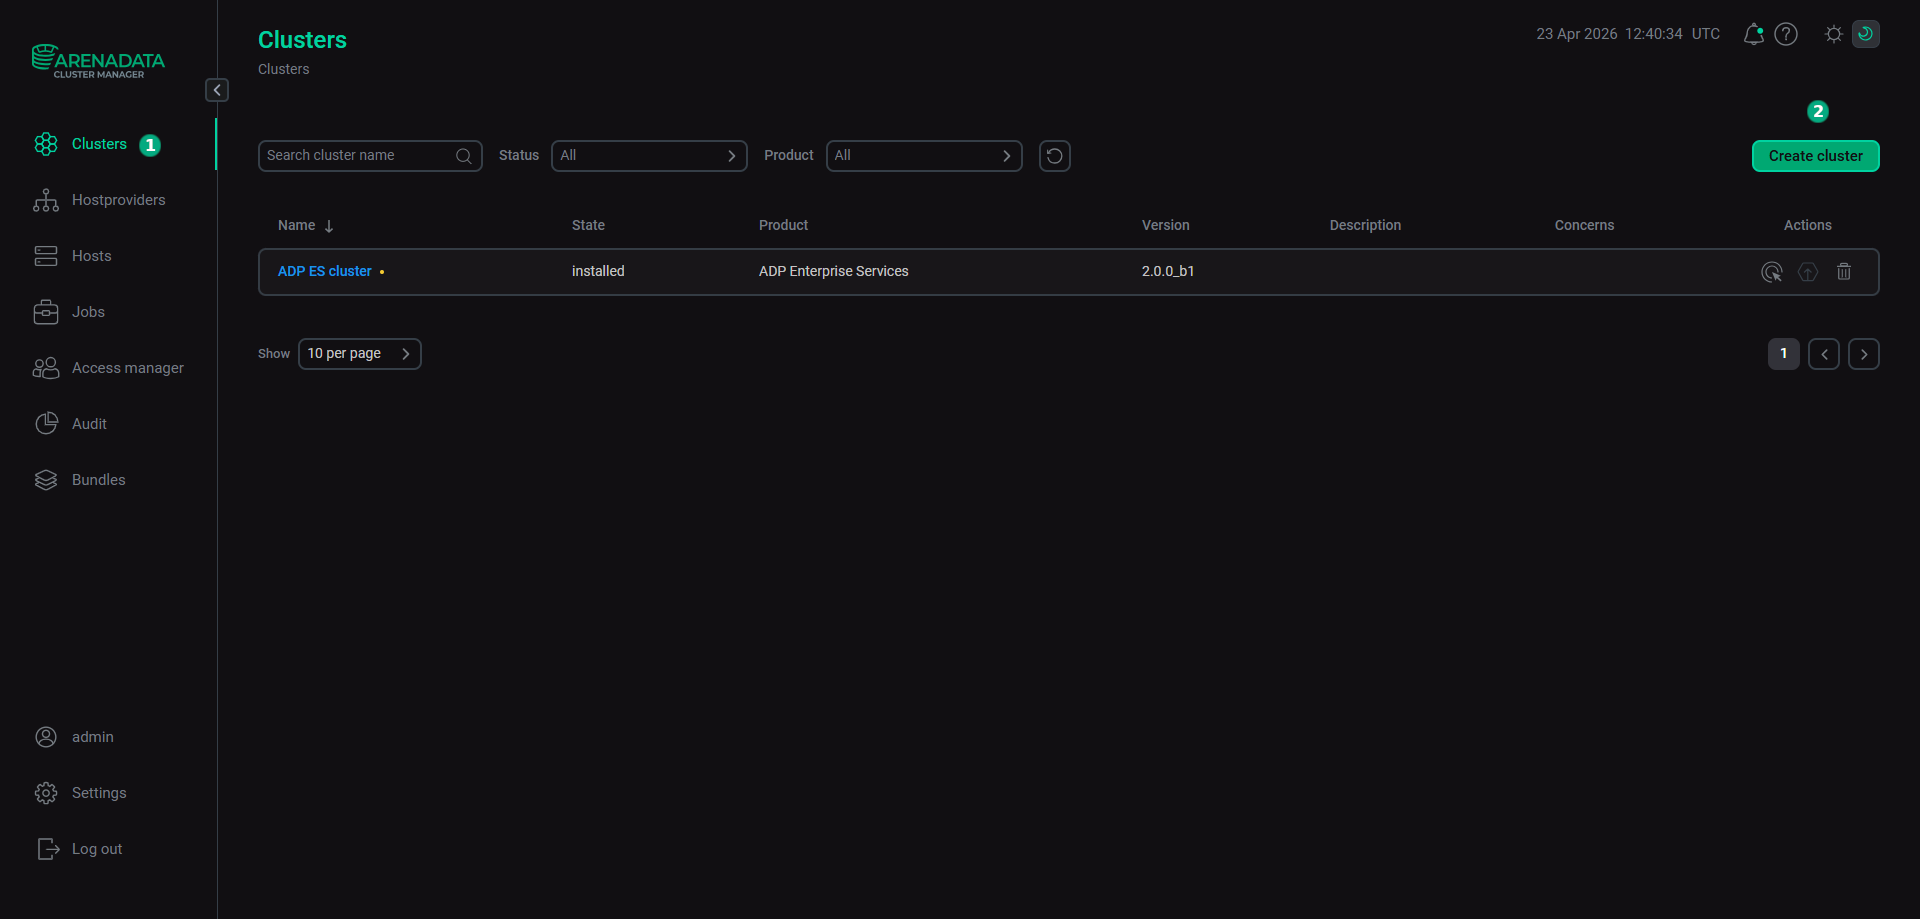 Switch to the cluster creation
In the opened dialog, describe a new cluster instance:
-
Select an uploaded cluster bundle in the Product field.
-
Select a bundle version in the Product version field.
-
Enter a cluster name in the Cluster name field.
-
Enter a cluster description in the Description field if necessary.
-
Set the I accept Terms of Agreement flag to sign the license agreement. To read the agreement text, refer to the Terms of Agreement link. You can also sign the license agreement on the Bundles page by clicking the desired product bundle.
-
Click Create.
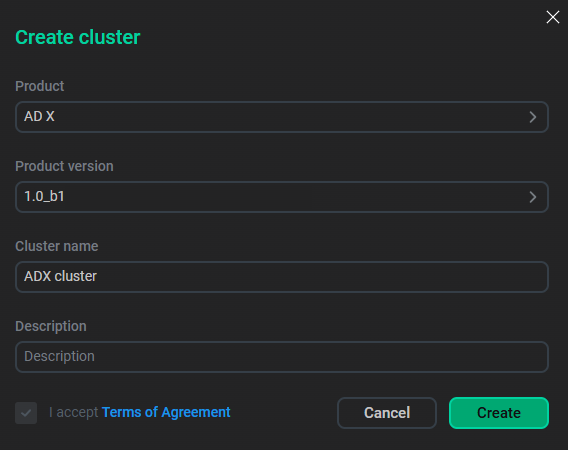 Create a cluster
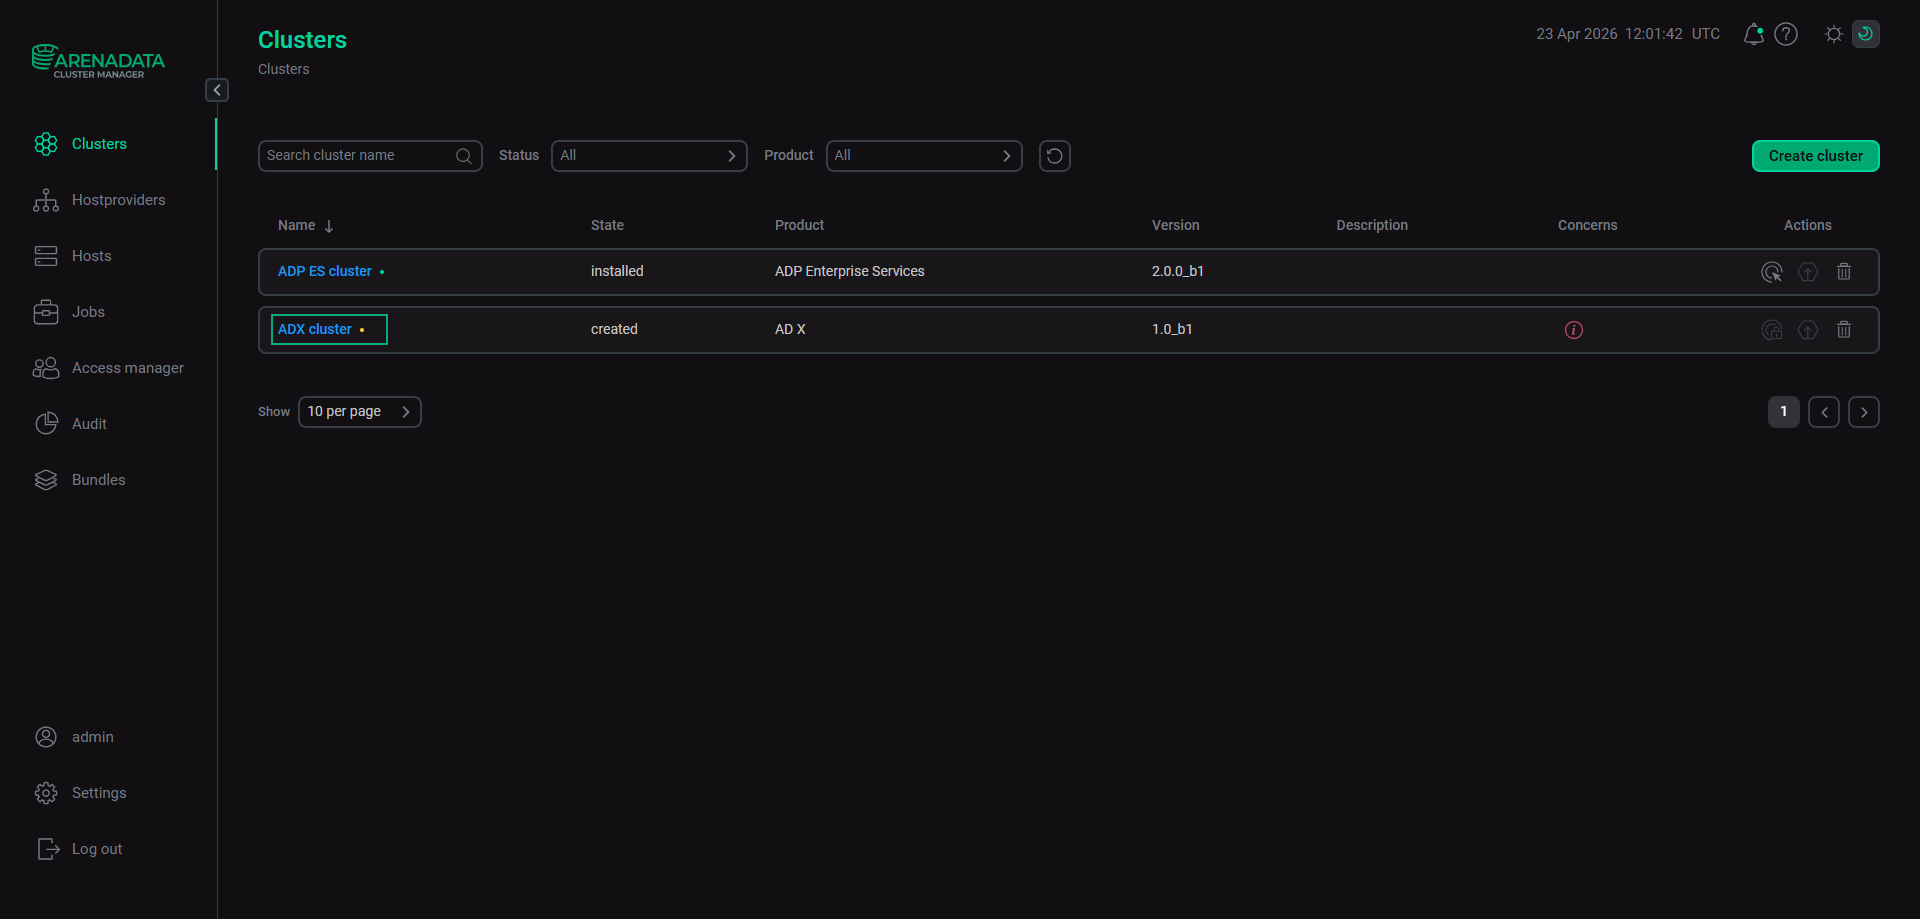
As a result, the created cluster instance is displayed on the Clusters page.
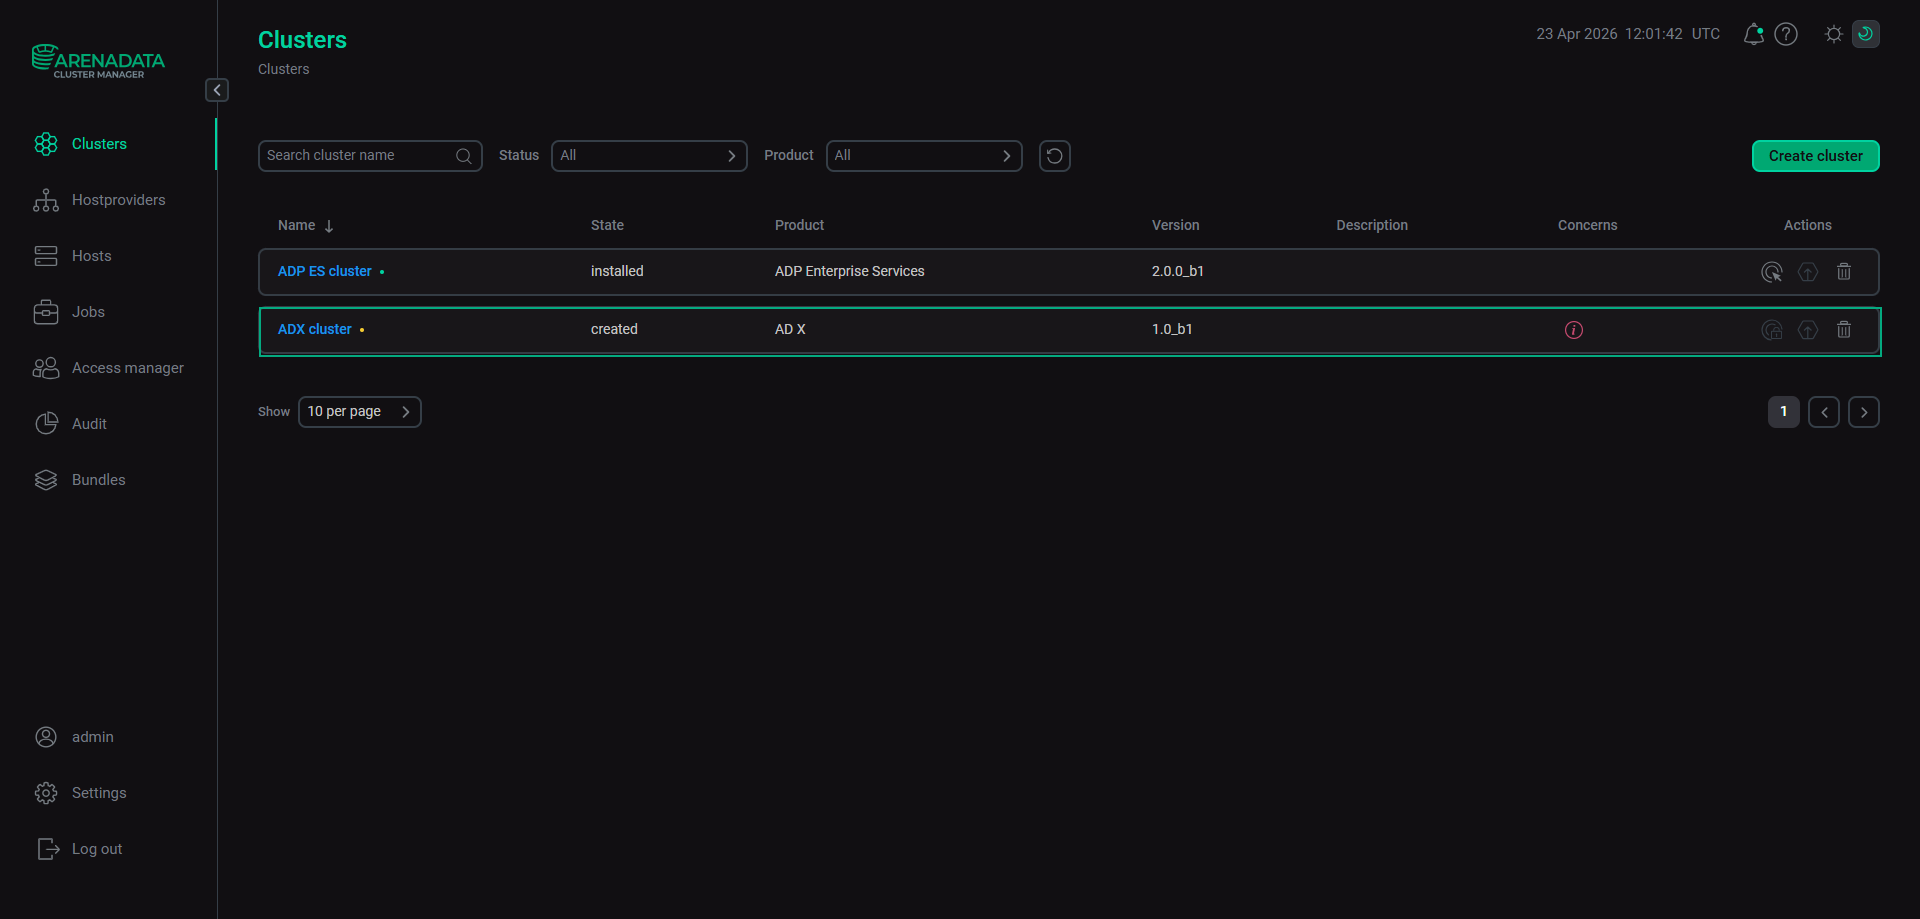 The result of a successful cluster creation
 -
-
Add services. To do this, click a cluster name on the Clusters page.
 Select a cluster
Open the Services tab on the cluster page and click Add service.
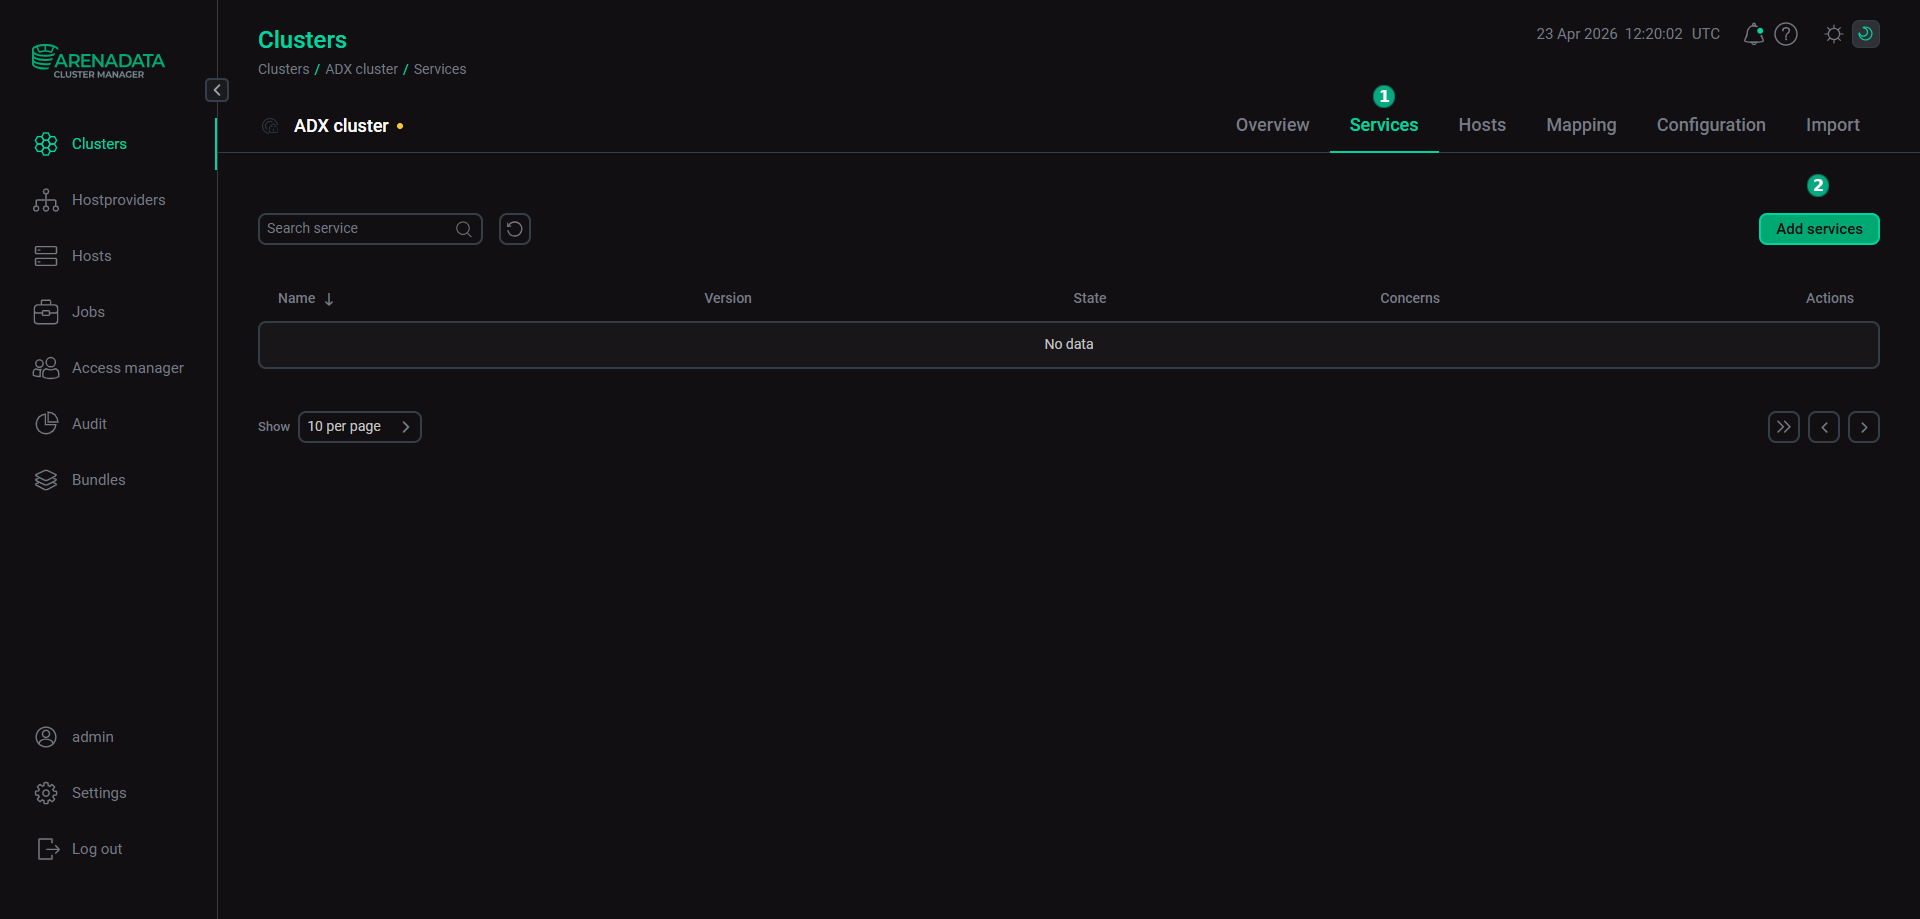 Switch to add services
In the opened dialog, select services that should be added to the cluster and click Add.
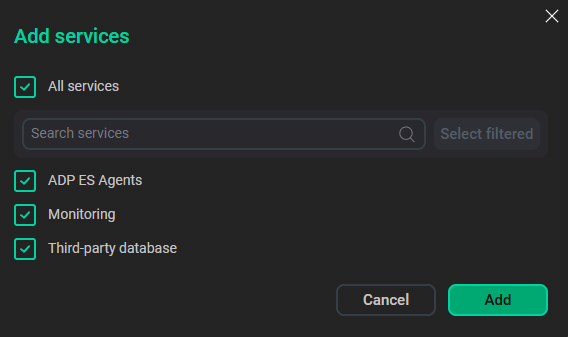 Select services
Services that can be added to the ADP cluster Service Mandatory Purpose ADP ES Agents
Yes
Allows you to manage a PostgreSQL cluster with ADP ES
Monitoring
Yes
Service for collecting and storing PostgreSQL cluster metrics based on the Prometheus monitoring system and the Grafana service
Third-party database
Yes
Interacts with the PostgreSQL cluster and provides access to its configuration
The added services are displayed at the Services tab.
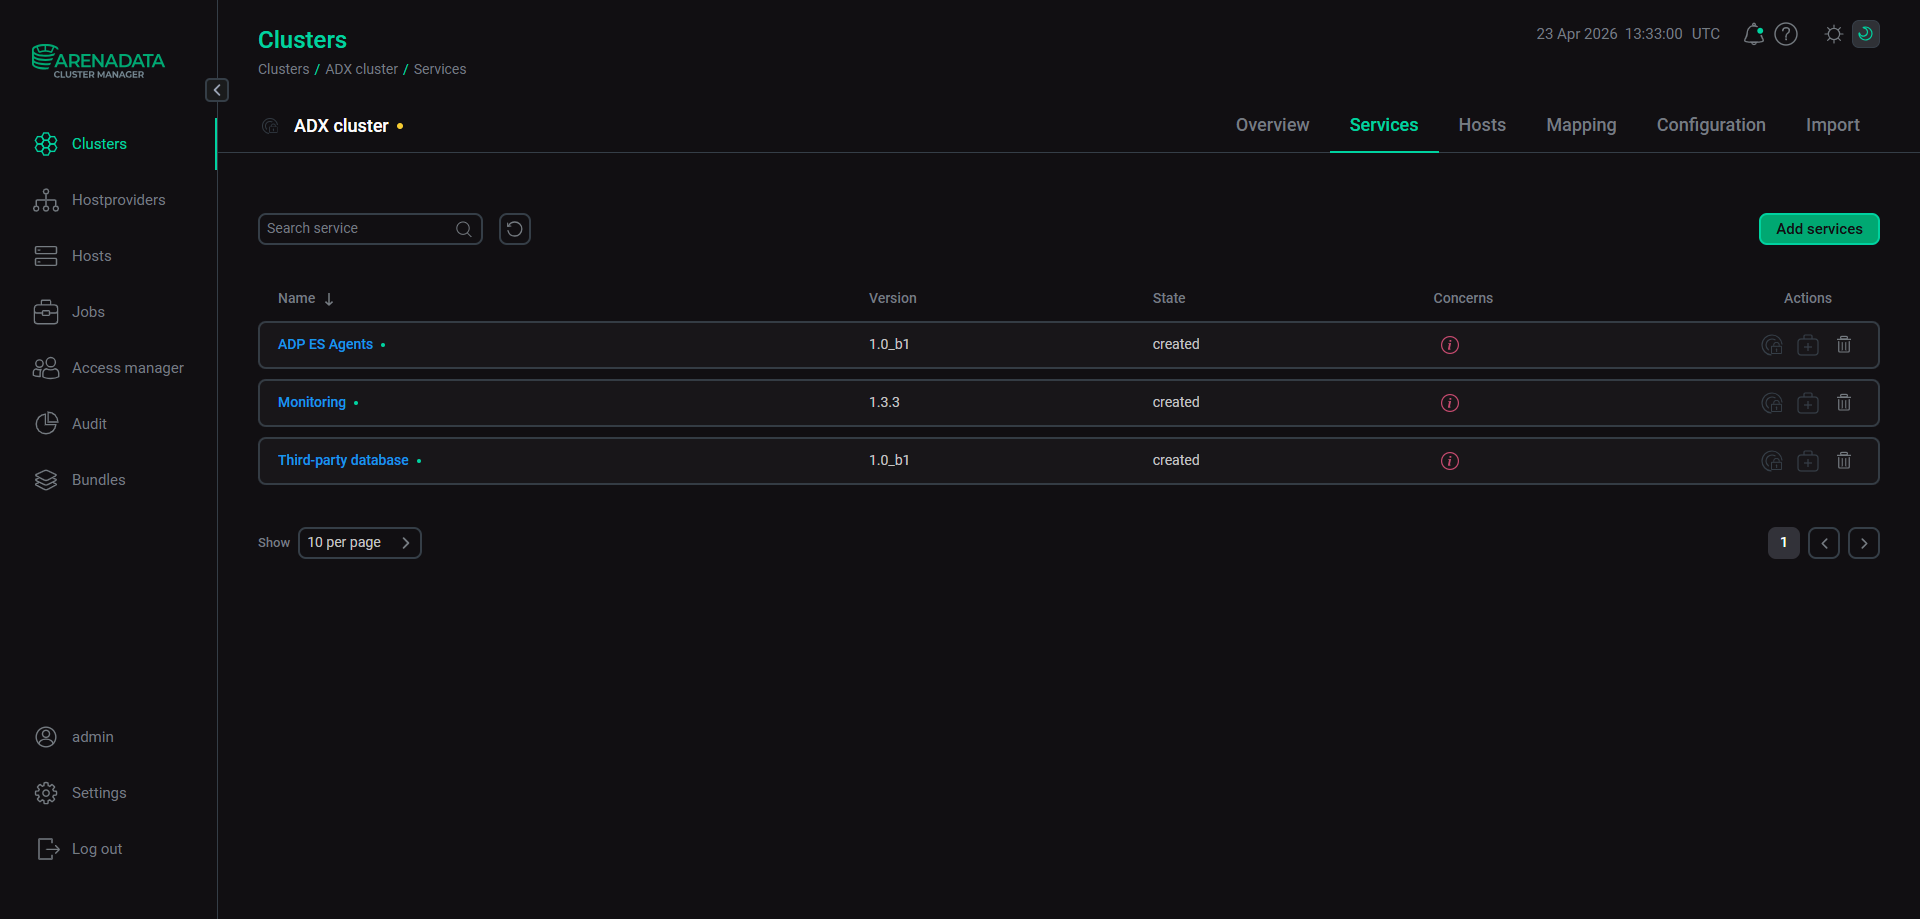 Services added to the cluster
 -
Add hosts to the cluster. Open the Hosts tab on the cluster page and click Add hosts.
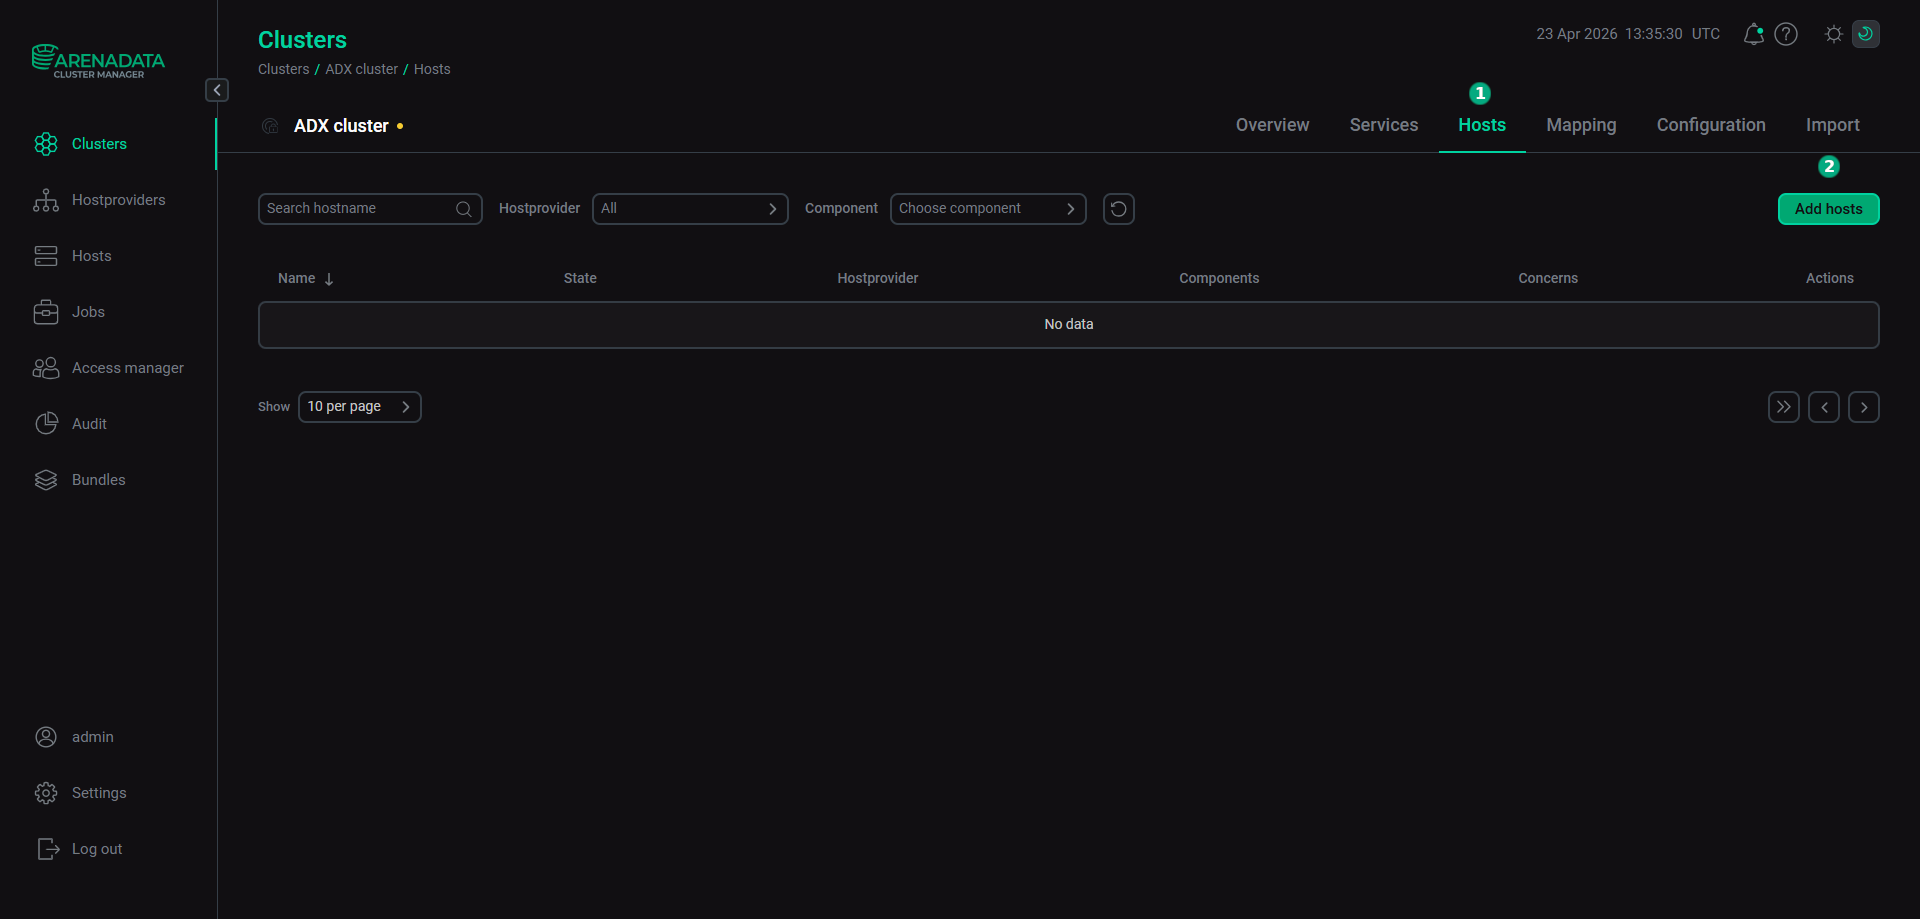 Switch to add hosts
In the opened dialog, select hosts that should be added to the cluster and click Add.
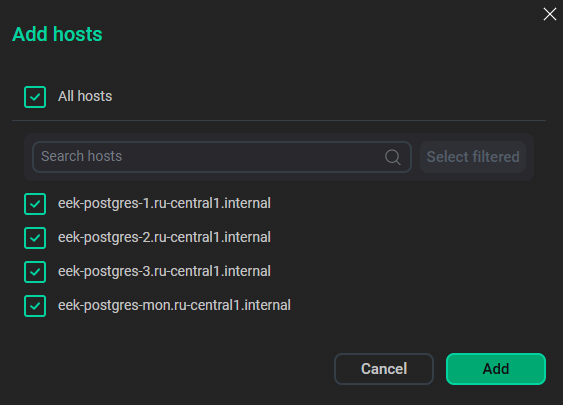 Select hosts
The added hosts are displayed on the Hosts tab.
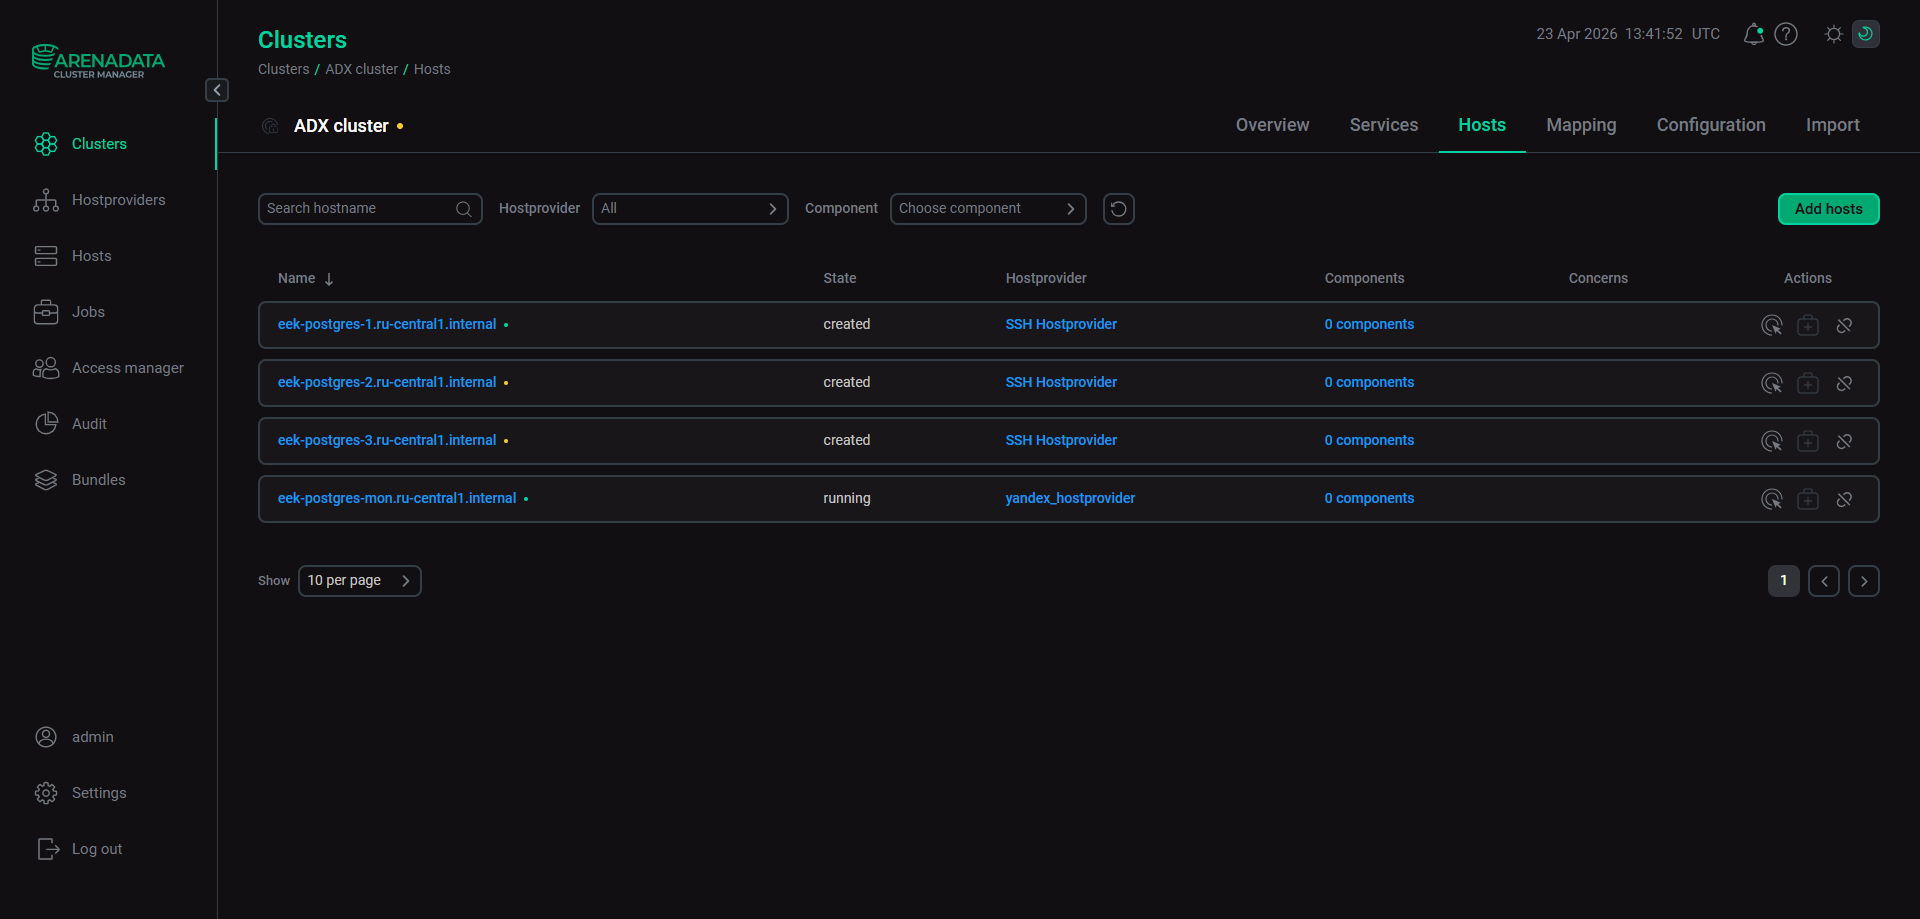 The result of successful adding hosts to a cluster
 -
Add components to the cluster hosts. To do this, open the Mapping tab on the cluster page. In the window that opens, map components to hosts. Mandatory components are highlighted in red.
To assign hosts for each component, click Add hosts and select hosts in the pop-up window.
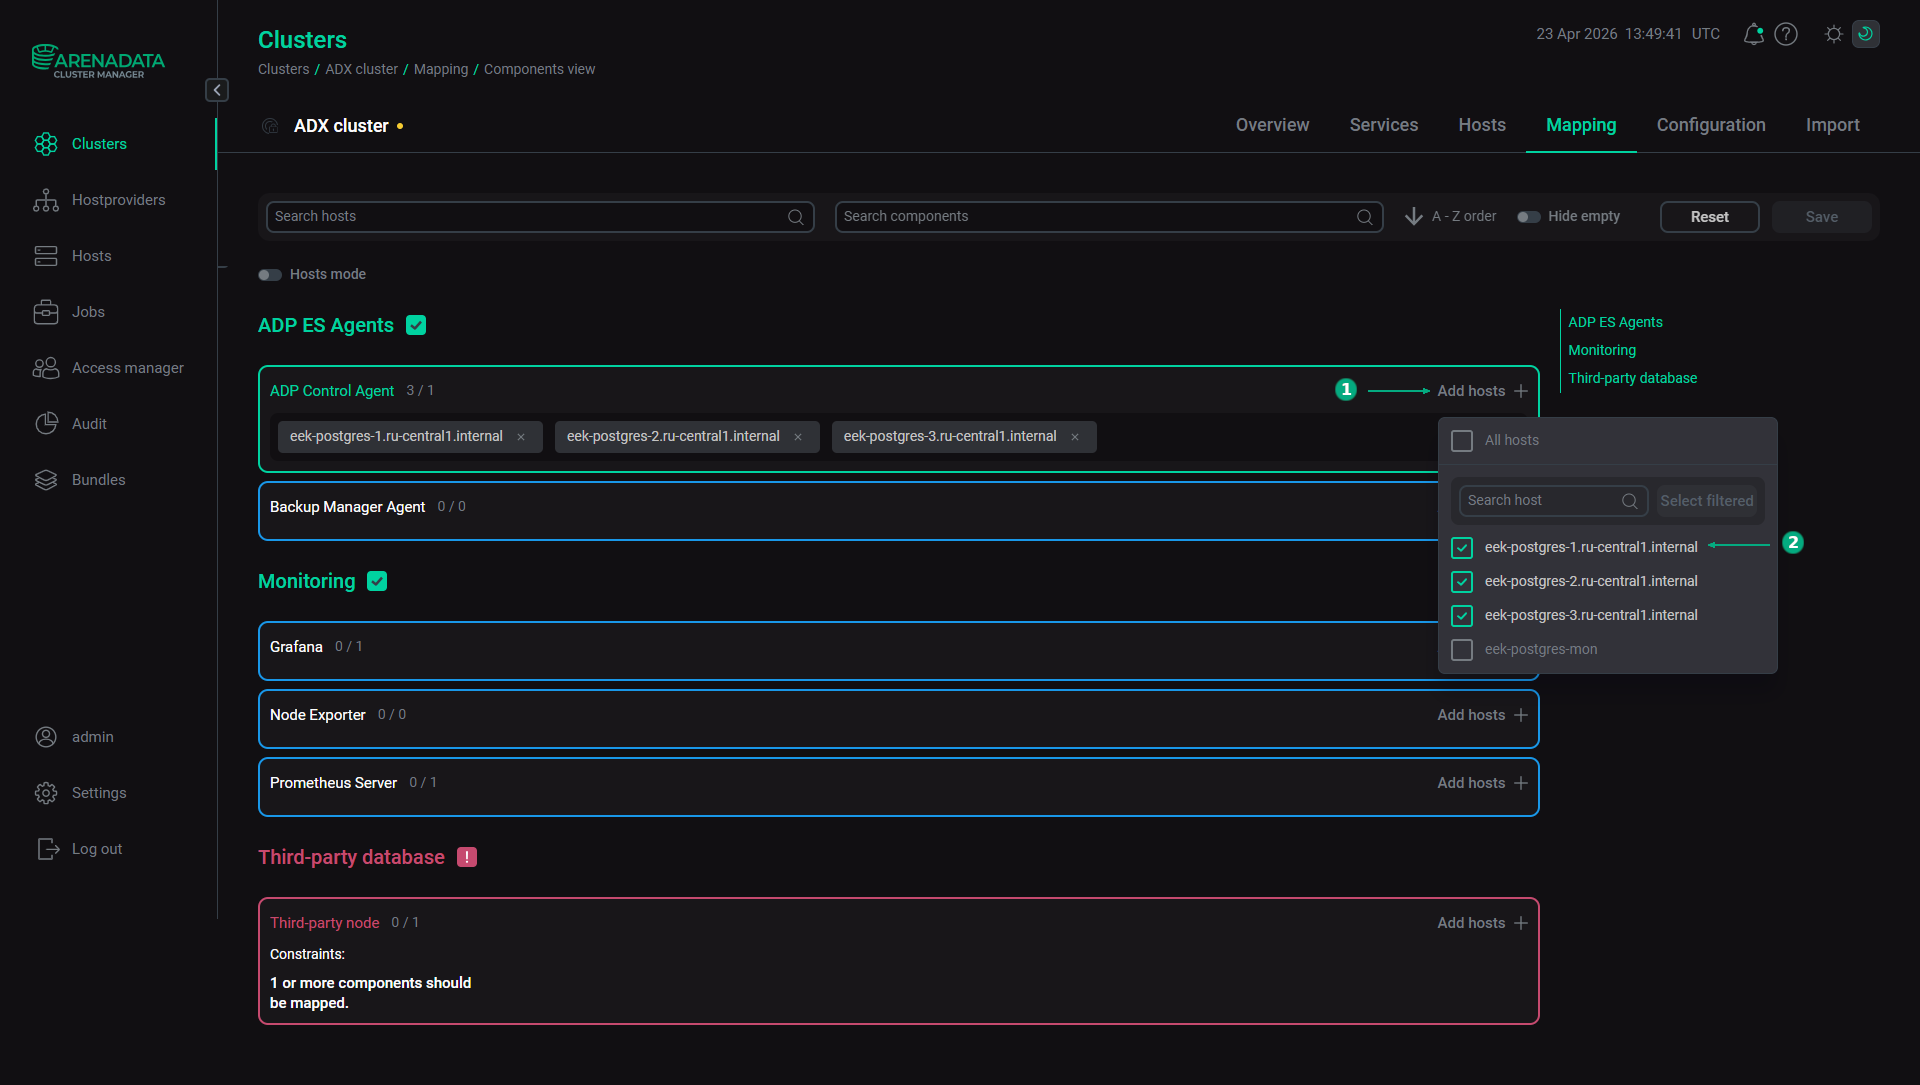 Select hosts for a component
An example of components distribution for the ADX cluster is shown in the table below.
ADX components distribution Host Service Component Notes Hosts with PostgreSQL
Third-party database
Third-party node
Interacts with the PostgreSQL cluster. The host can be a leader or replica
ADP ES Agents
ADP Control Agent
An agent that allows you to manage a PostgreSQL cluster with ADP Control
Backup Manager Agent
A backup manager agent that ADP Control uses
Monitoring
Node Exporter
The component collects system metrics and passes them to Prometheus
Host for the Monitoring service
Monitoring
Prometheus Server
The Prometheus server that collects and stores metrics
Grafana
The Grafana web interface for creating dashboards to visualize metrics. It is recommended to install Grafana and Prometheus Server on the same host
Once the components are distributed, click Save.
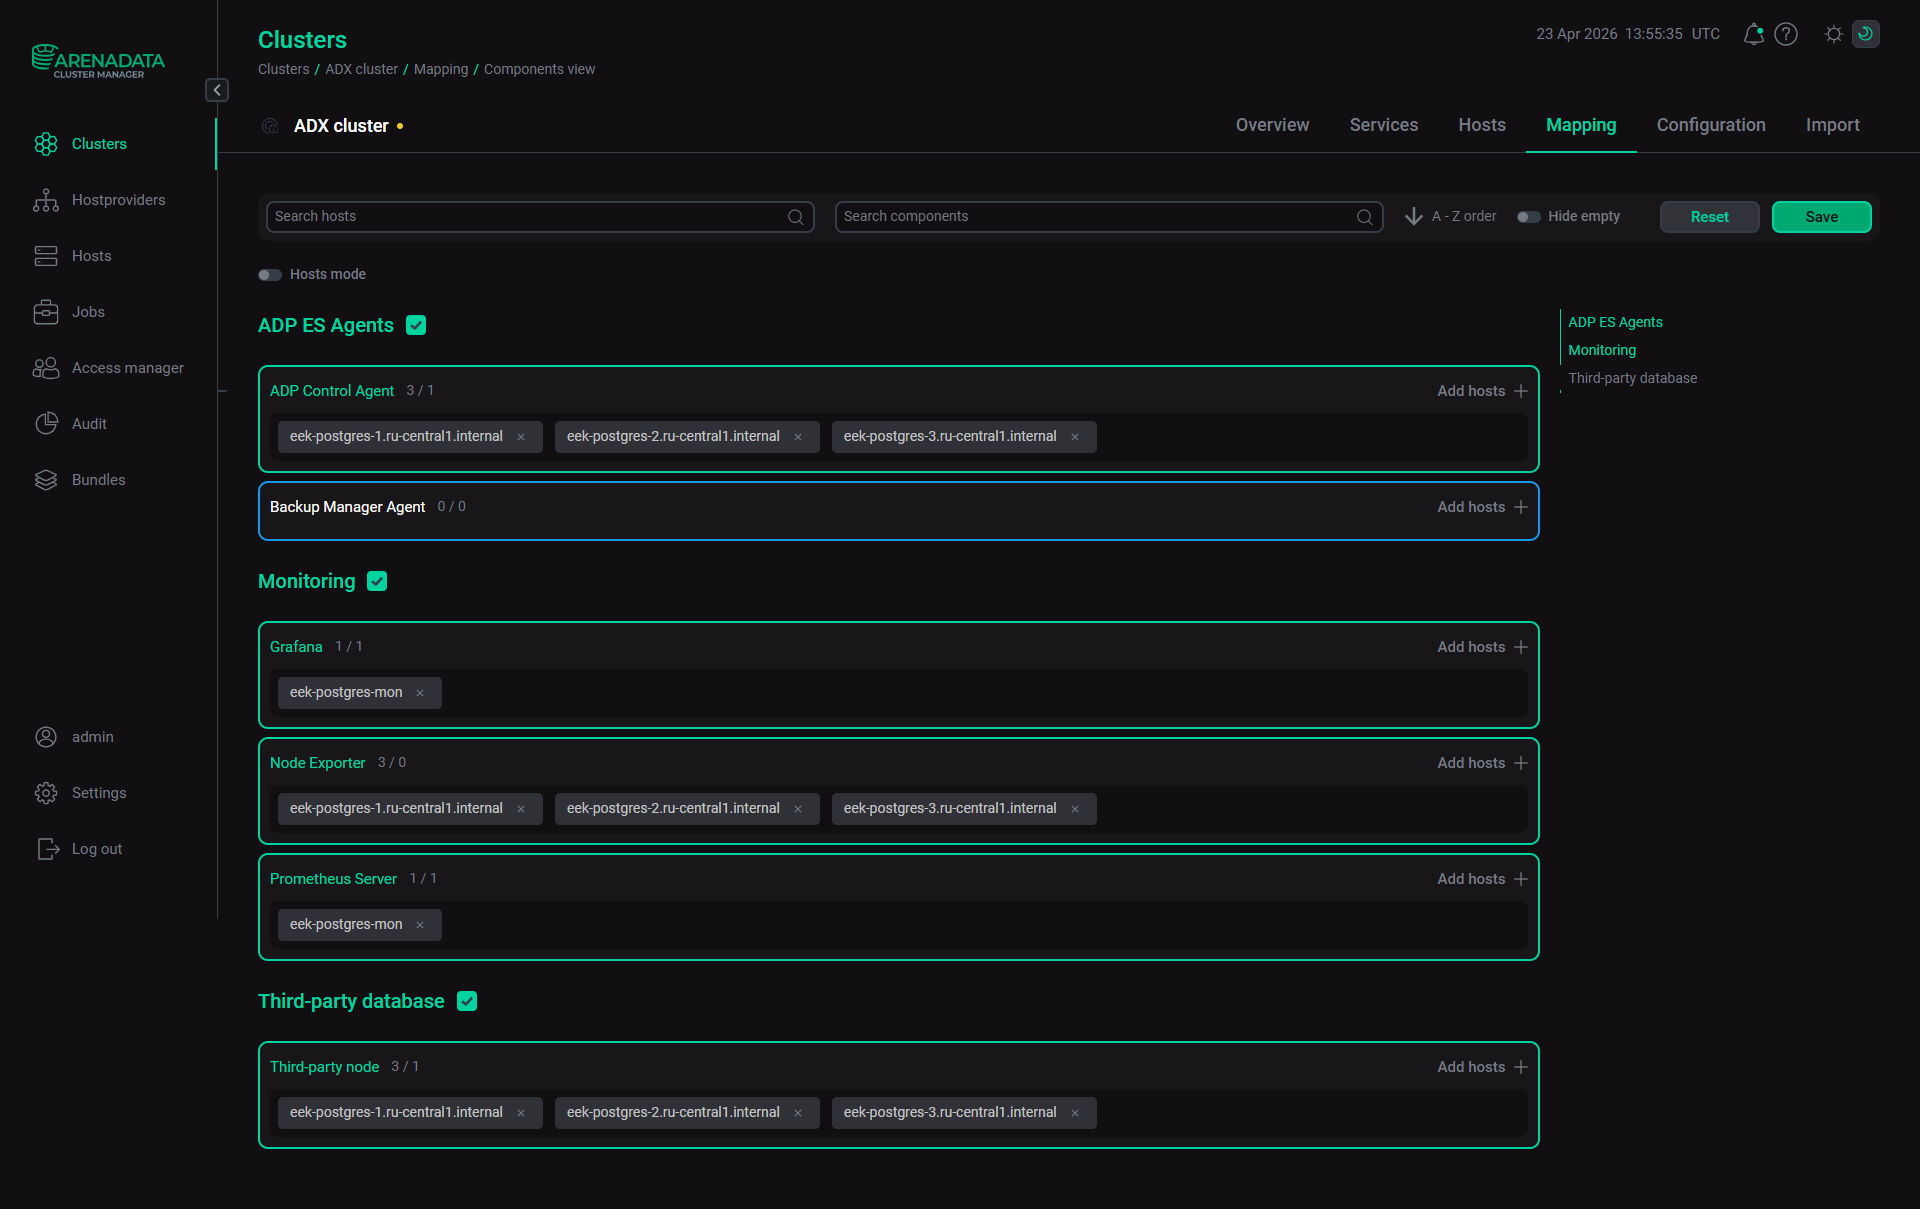 Save mapping of components
 -
Configure services — open the Services tab on the cluster page and click its name in the Name column. In the window that opens:
-
Open the Primary Configuration tab.
-
Fill in configuration parameters of the selected service. The fields highlighted in red are mandatory.
-
Click Save.
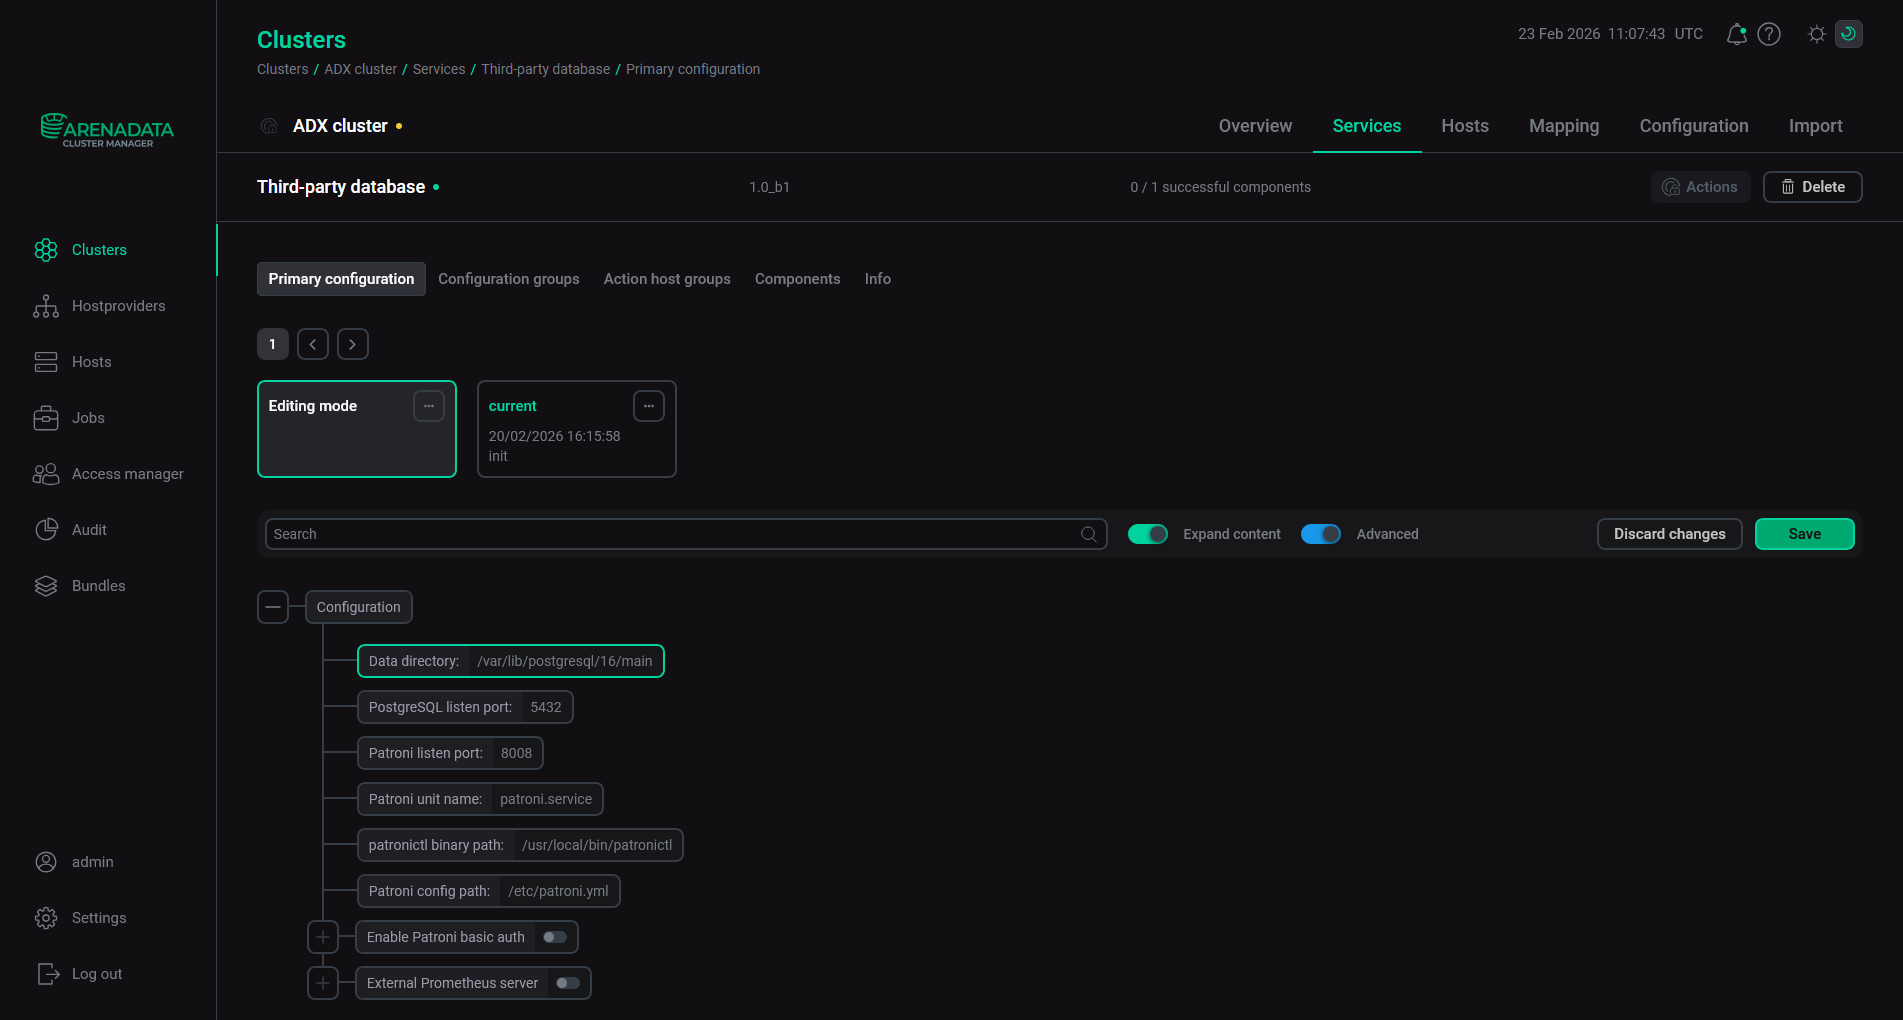 Configure a service
Pay attention to the following parameters that should be set during the installation:
-
Parameters of the Database service:
-
Data directory
-
Patroni unit name
-
patronictl binary path
-
Patroni config path
-
-
Parameters of the Monitoring service:
-
Prometheus settings — Password for Grafana connection — a password of a Grafana user (
admprom_grafana) that is used to connect to Prometheus; -
Grafana settings — Grafana administrator’s password — a password of the Grafana
adminuser.
-
Passwords should contain a combination of numbers, symbols, lowercase and uppercase letters and have a minimum length of 8.
NOTEFor more information about services configuration parameters, see Configuration parameters of the ADX cluster.
-
-
Import ADP ES services — open the Import tab of the cluster page, select all the ADP ES services, and click Import.
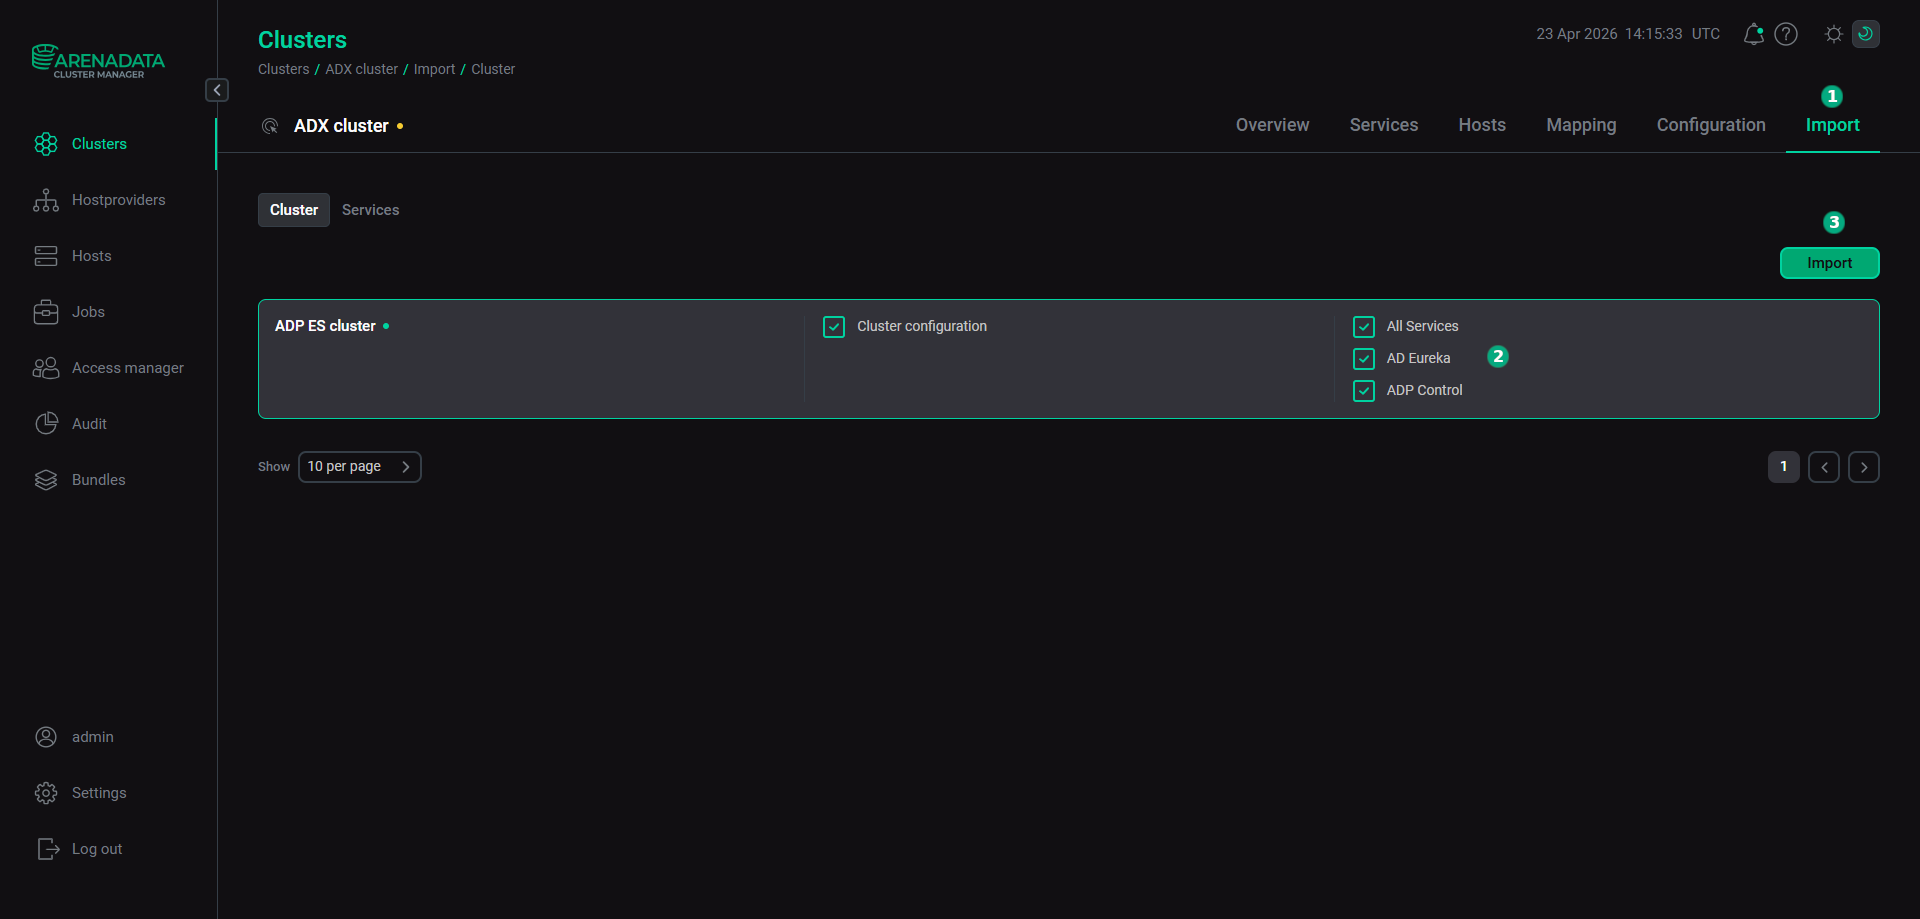 Import ADP ES services
-
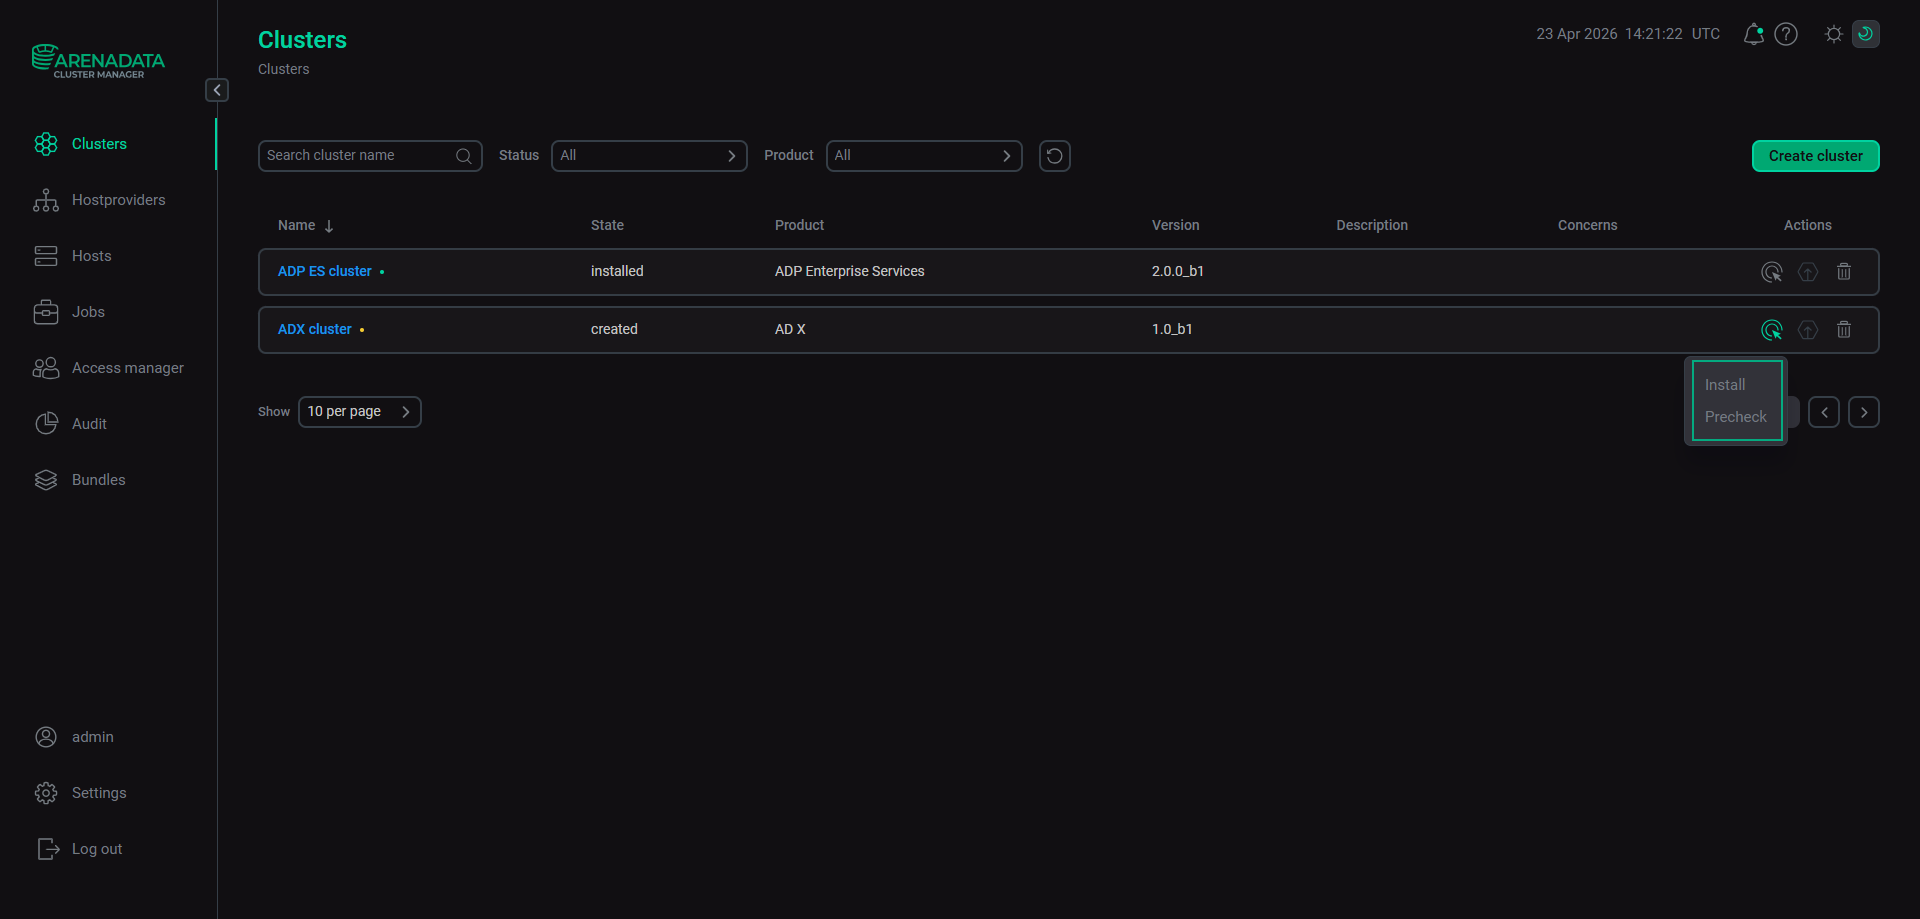
Install the cluster. Before installing a new cluster, it is recommended to run the Precheck action. On the Clusters page, apply the Precheck action to the cluster by clicking the

 icon in the Actions column. You can find the action result and the process of its execution on the Jobs page.
If the Precheck action is successful, run the Install action.
 Install the cluster
After the installation, the cluster state, displayed in the State field on the Clusters page, is changed from
createdtoinstalled.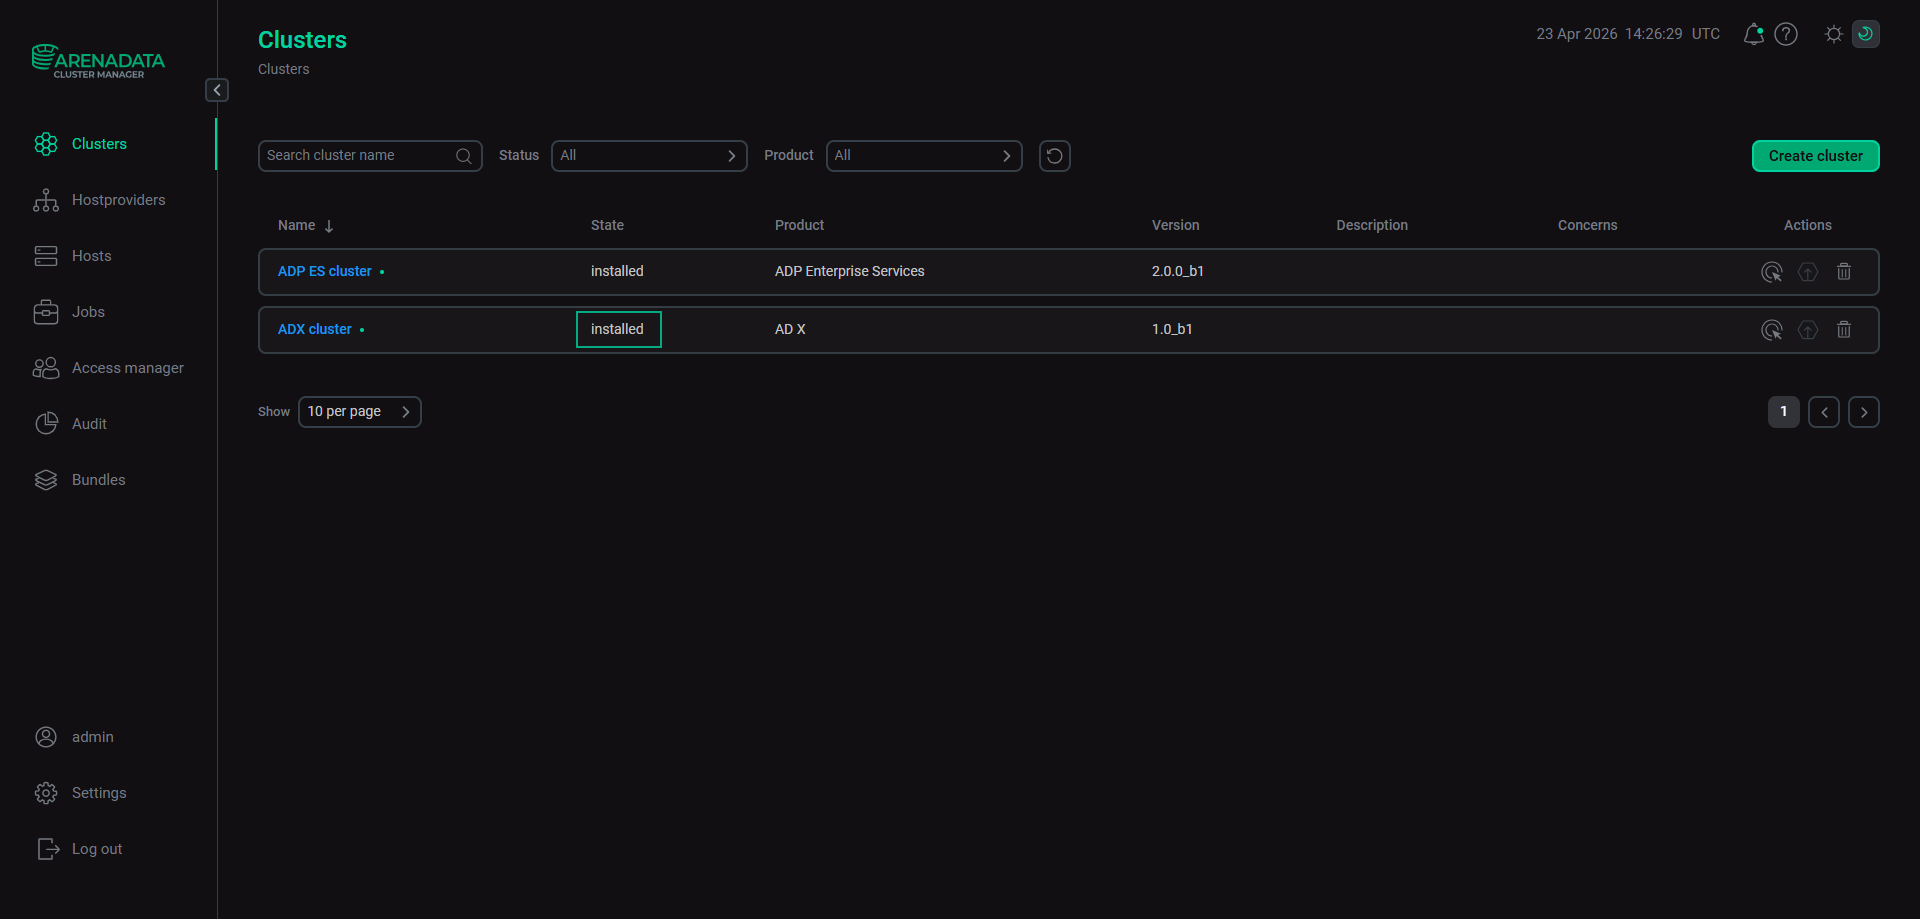 The cluster is installed
After the ADX cluster is installed, the PostgreSQL cluster will become available in the ADP Control web interface at http://<adpc_host>:8090 (where
<adpc_host>is the IP address of the host with the ADP Control component installed and8090is the default value of the Listening WEB UI port parameter in the Backend parameters section of the ADP Control service configuration).
After installing the Monitoring service, which includes the Grafana component, you can view dashboards displaying system metrics in a browser.To do this, enter the address of the host where the Grafana component is deployed and add the port number — the Grafana listen port parameter value (the default value is 11210). For example, http://10.92.6.91:11210. For login, use admin as a username and the Grafana administrator’s password parameter value as a password.