

ADO monitoring metrics
This article describes metrics for monitoring an ADO cluster. For information about monitoring, its components, and how to install it, refer to Install monitoring.
Overview
The Monitoring service collects metrics from ADO components and makes them available through VictoriaMetrics and Grafana. VMAgent collects metrics from configured exporters and ADO services and sends them to the VictoriaMetrics cluster. Prometheus-based monitoring can also be used as an alternative and can coexist with the VictoriaMetrics-based monitoring. Grafana visualizes the collected metrics in dashboards.
These tools help monitor the health of the ADO platform, track GitSync synchronization, observe Airflow activity, monitor Celery workers, and analyze host resource utilization.
The Monitoring service consists of the following components:
-
Node Exporter — exposes hardware and operating system metrics, such as CPU, memory, disk, and network utilization. These metrics are available on the port and endpoint specified in the Node Exporter settings section of the Monitoring service configuration (
11203/metricsby default). -
VMAgent — collects metrics from configured exporters and ADO services and sends them to the VictoriaMetrics cluster.
-
Prometheus Server — provides an alternative Prometheus-based metrics collection and storage solution. It can coexist with the VictoriaMetrics-based monitoring.
-
Grafana — visualizes collected metrics in dashboards. Grafana can use VictoriaMetrics or Prometheus as a data source.
View metrics in Prometheus
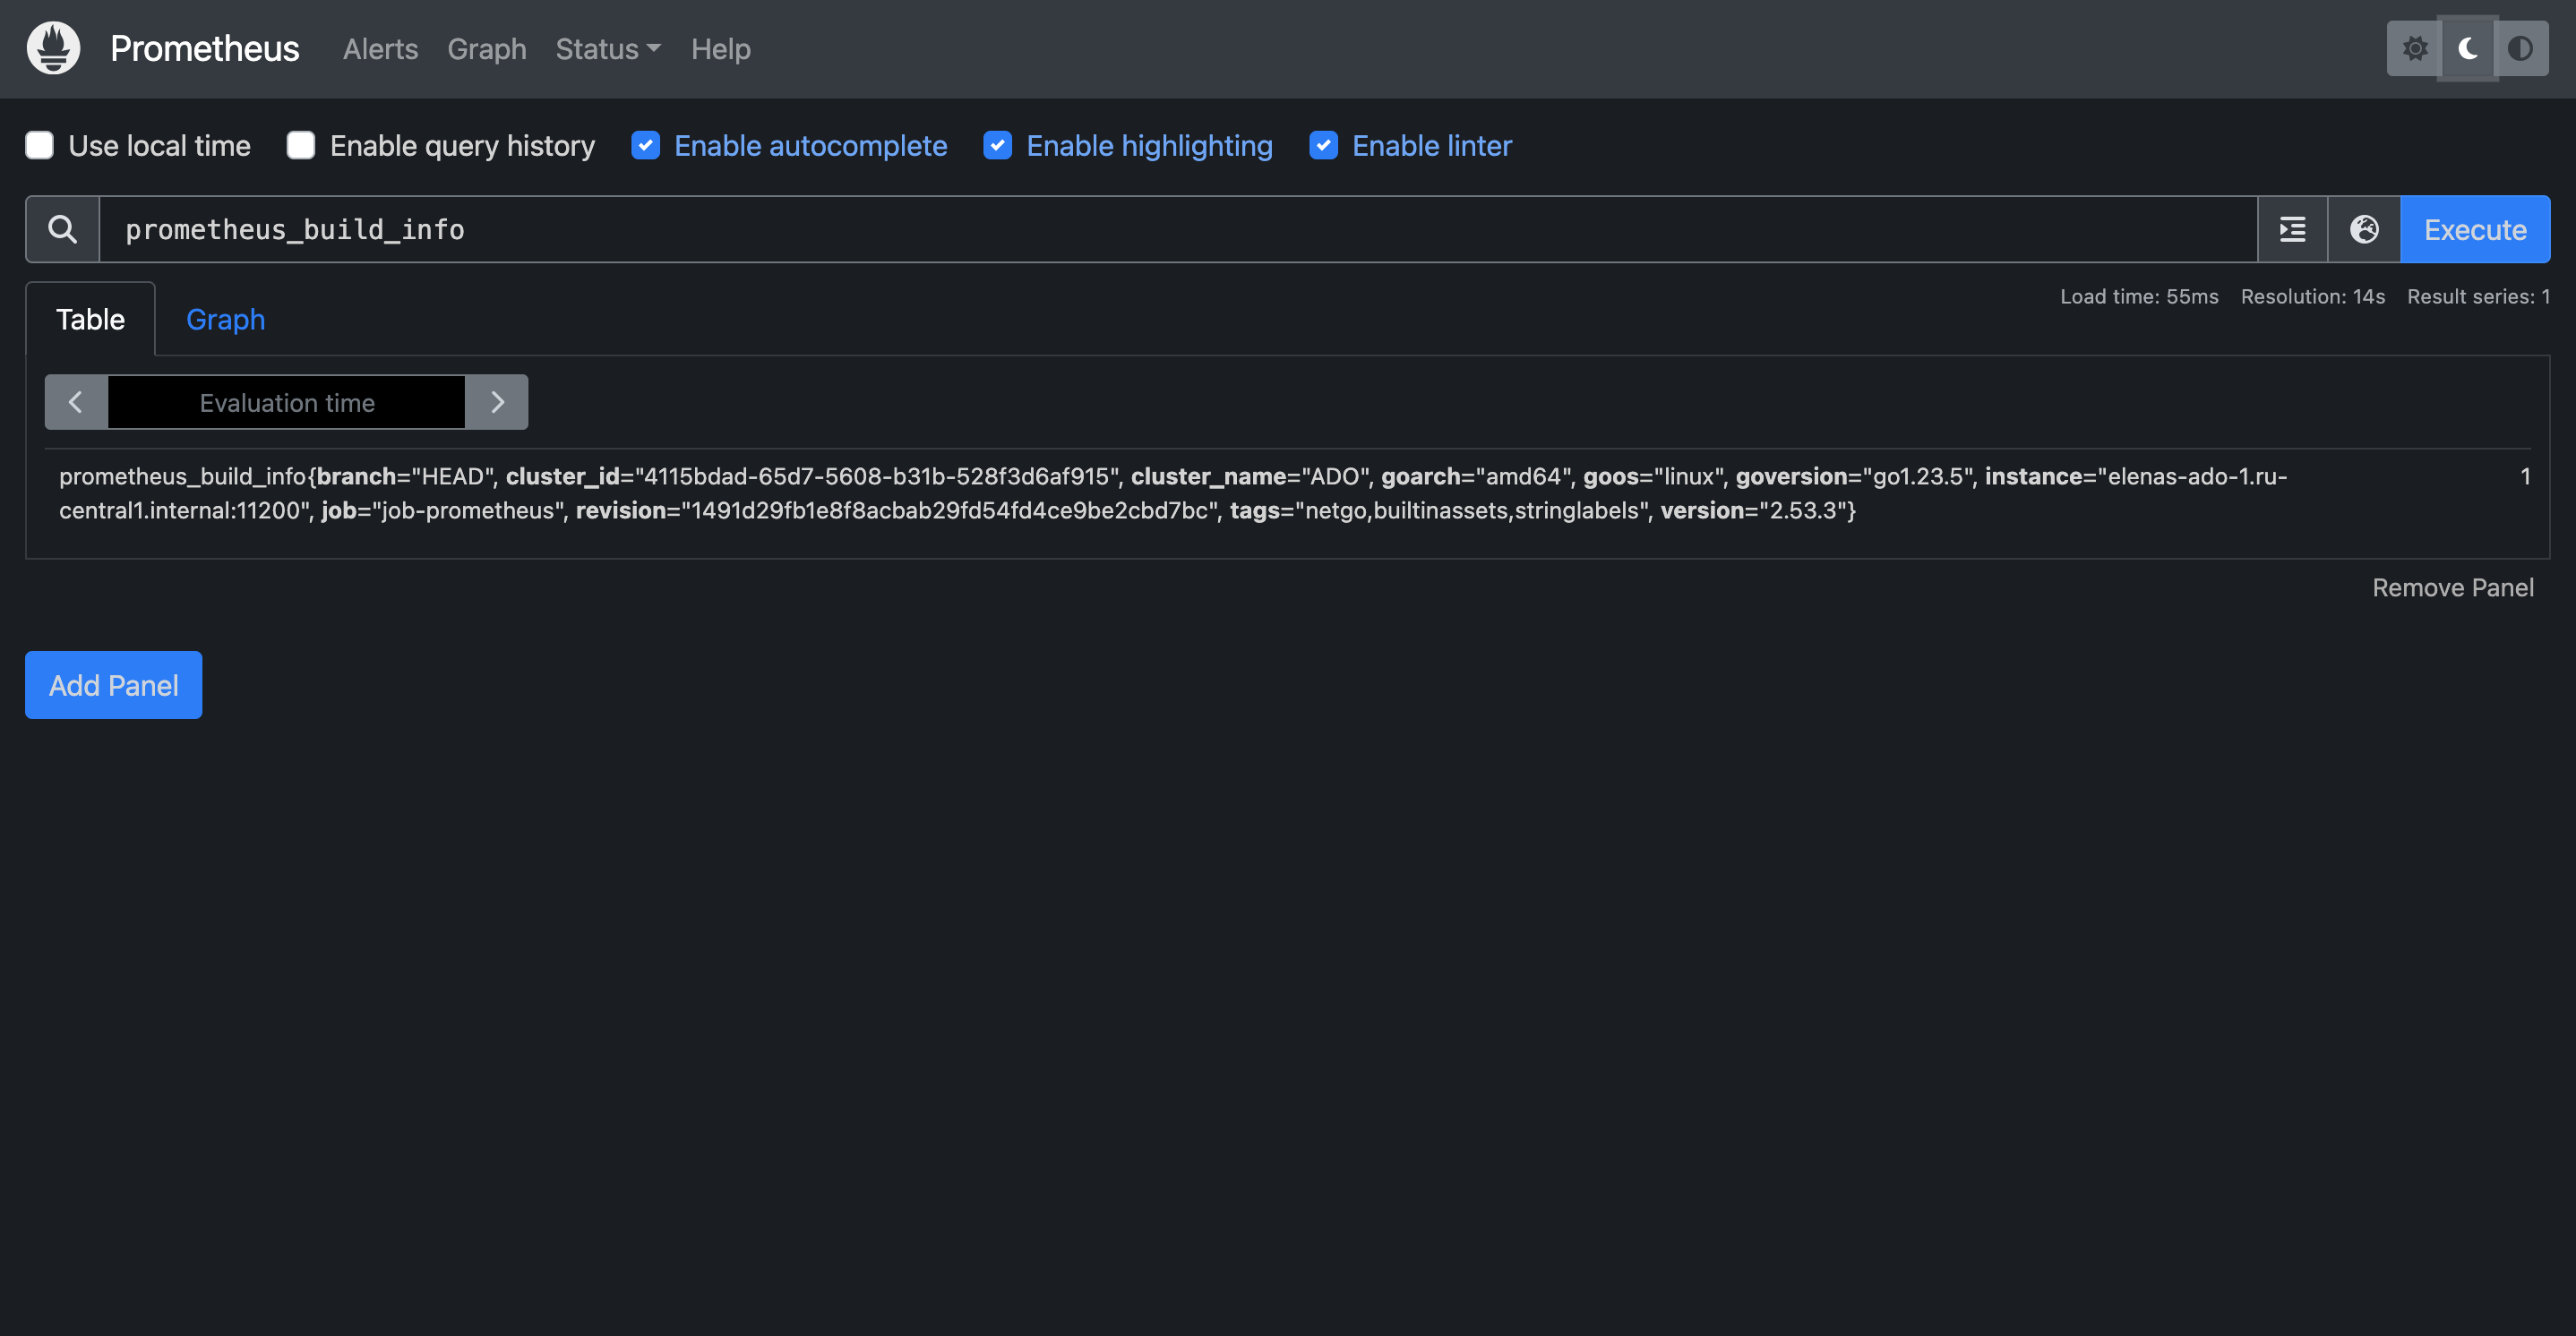
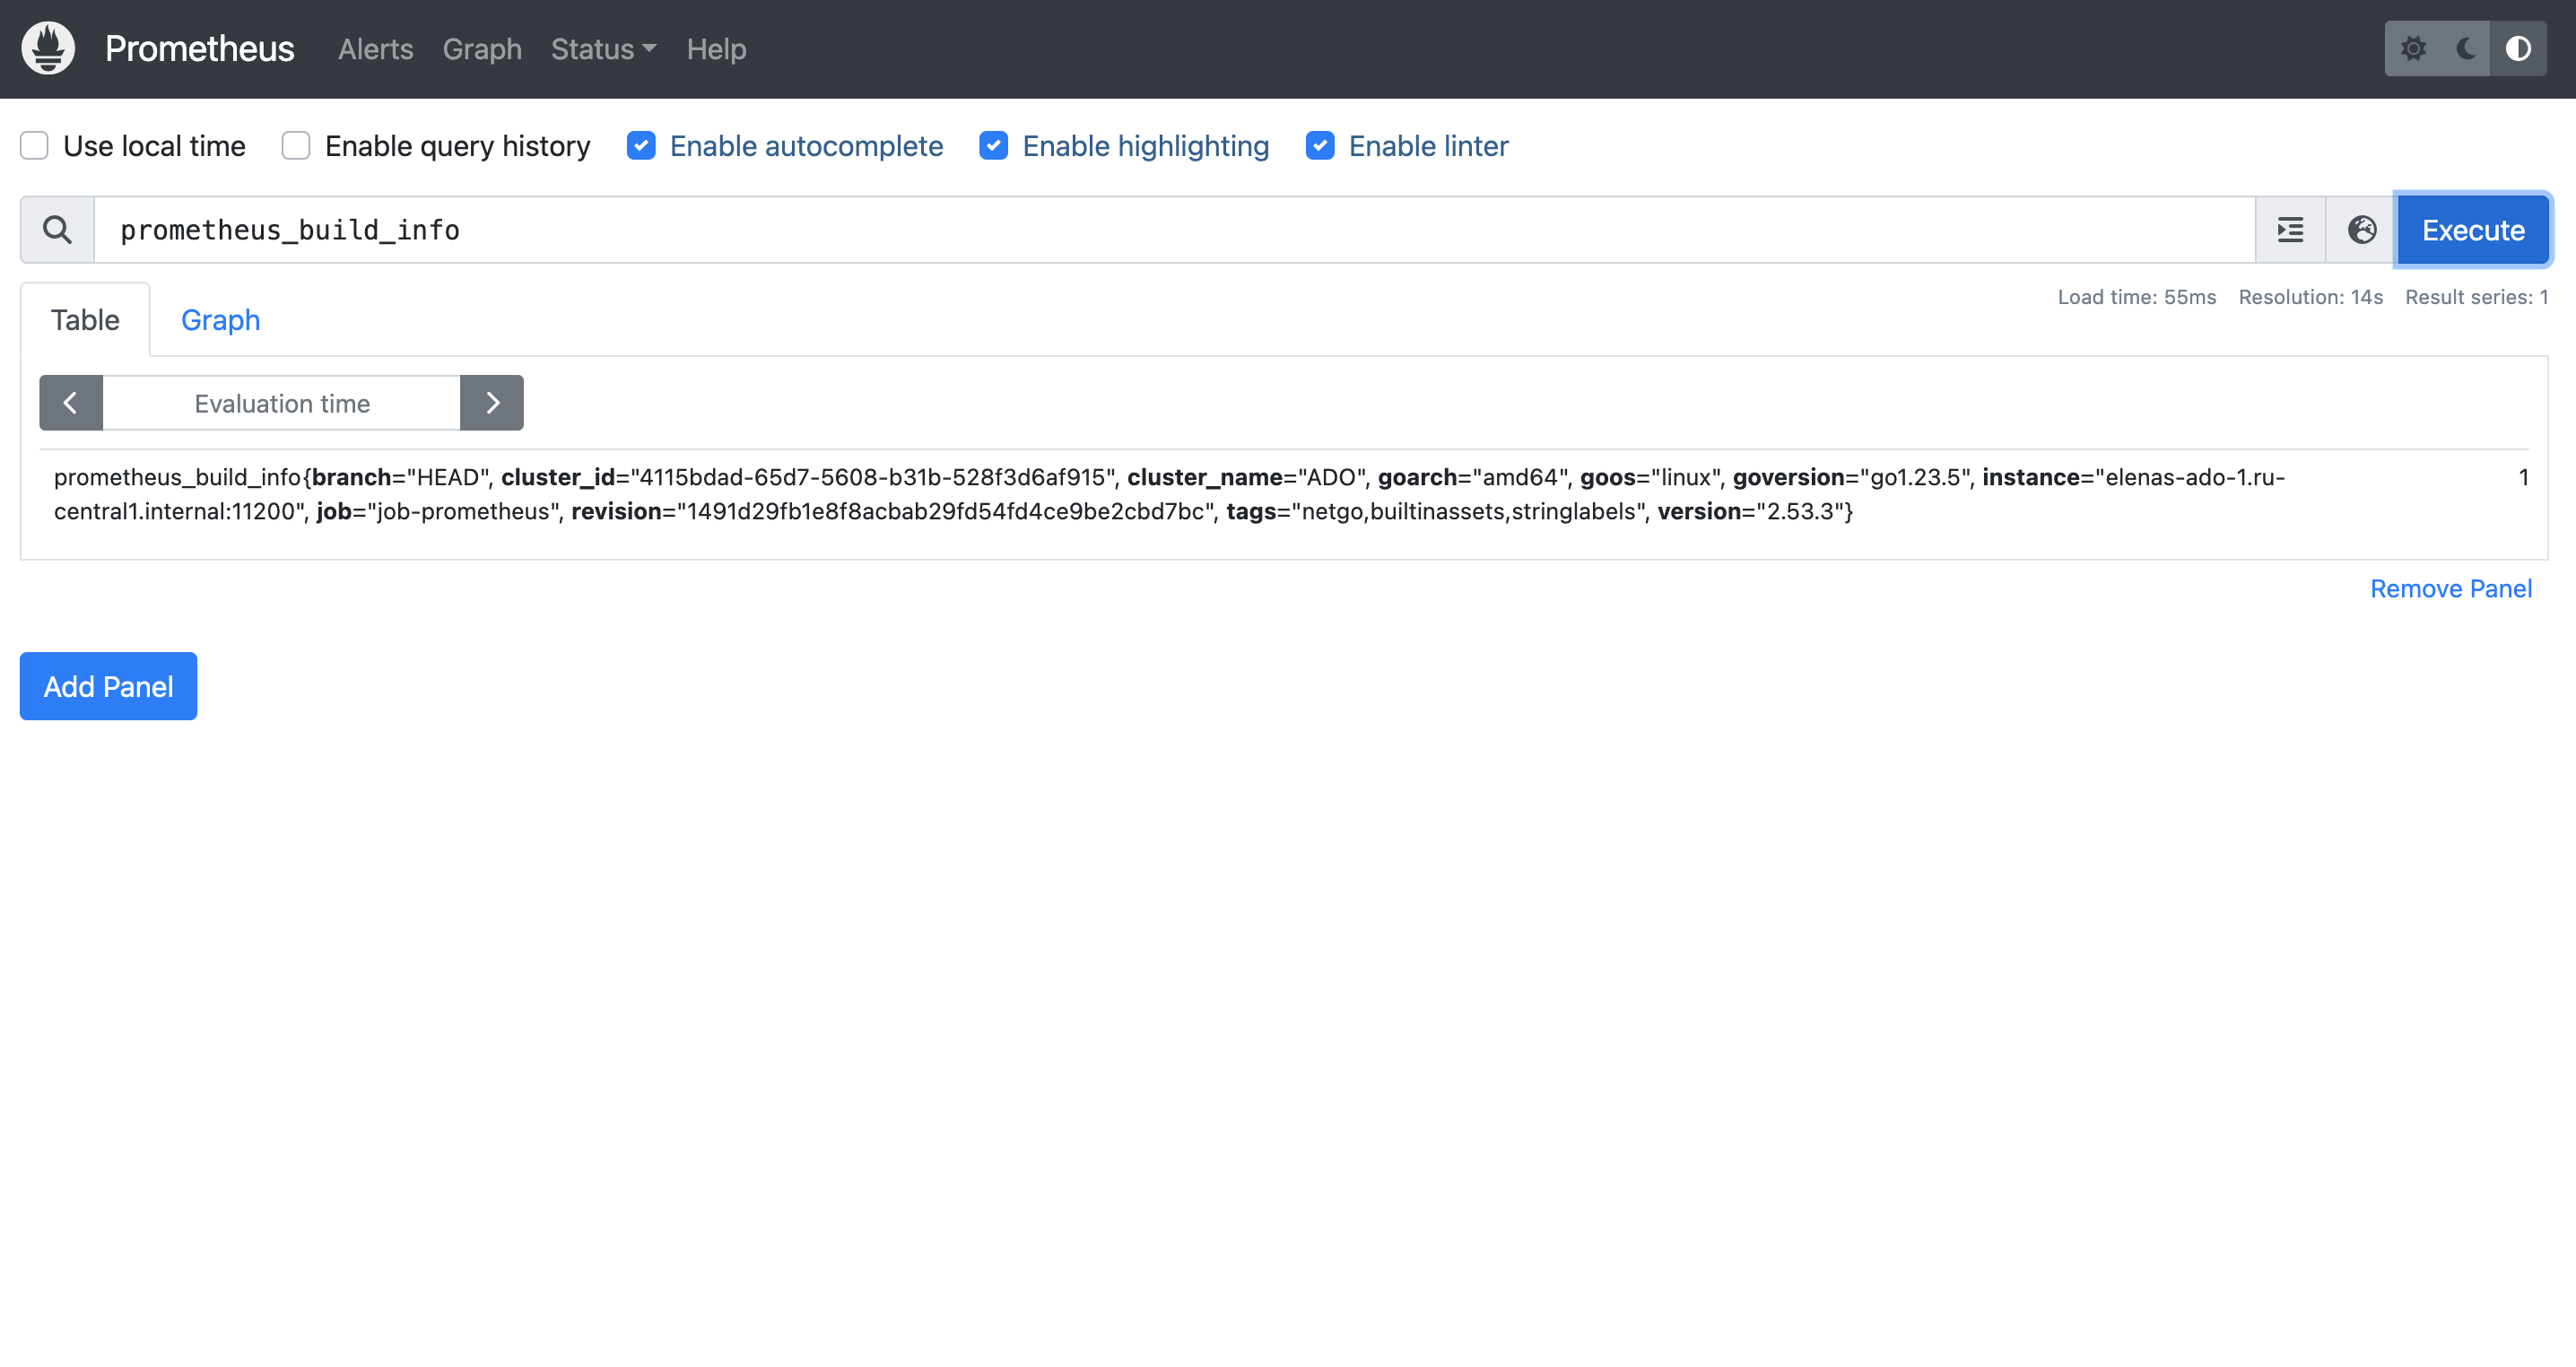
Prometheus is a monitoring and alerting toolkit. It collects metrics from an ADO cluster and its services, while Grafana retrieves these metrics from Prometheus to build dashboards. If a Grafana dashboard displays empty panels or unexpected values, checking Prometheus helps determine whether the issue is related to metric collection or dashboard configuration.
To view metrics in Prometheus:
-
In your browser, enter
<IP address of the monitoring server>:<port>. The default port is11200, and it can be changed in the Prometheus settings section of the Monitoring service configuration.The IP address, port, and hostname of Prometheus are also available on the Info tab of the Monitoring service.
-
In the window that opens, enter the user name and the password that you have configured in the Prometheus users to login/logout to Prometheus field of the Monitoring service configuration.
In the Prometheus web interface, you can:
-
view the Prometheus configuration;
-
verify that ADO exporters and services are available on the Targets page;
-
query collected metrics by using the Prometheus Query Language (PromQL).
Grafana dashboards
Grafana visualizes metrics collected by the monitoring stack and organizes them into dashboards. Depending on the configured monitoring solution, Grafana can use VictoriaMetrics or Prometheus as a data source. You can use the provided dashboards to monitor ADO services or create custom dashboards based on the collected metrics.
To open Grafana:
-
In your browser, enter
<IP address of the monitoring server>:<port>. The default port is11210, and it can be changed in the Grafana settings section of the Monitoring service configuration.The IP address, port, and hostname of Grafana are also available on the Info tab of the Monitoring service.
-
In the window that opens, in the Email or username field, enter
adminand in the Password field, enter the password that you have configured in the Grafana administrator’s password field of the Monitoring service configuration.
By default, the following dashboards are available in Grafana:
Each dashboard focuses on a specific ADO component and provides metrics relevant to its operation.
The following sections describe the available dashboards and the metrics they provide.
GitSync Monitoring
The GitSync Monitoring dashboard provides visibility into repository synchronization, Git operations, validation, worker availability, and dependency installation.
This dashboard helps identify synchronization failures, monitor synchronization performance, detect repository validation issues, and verify that GitSync workers are operating correctly.
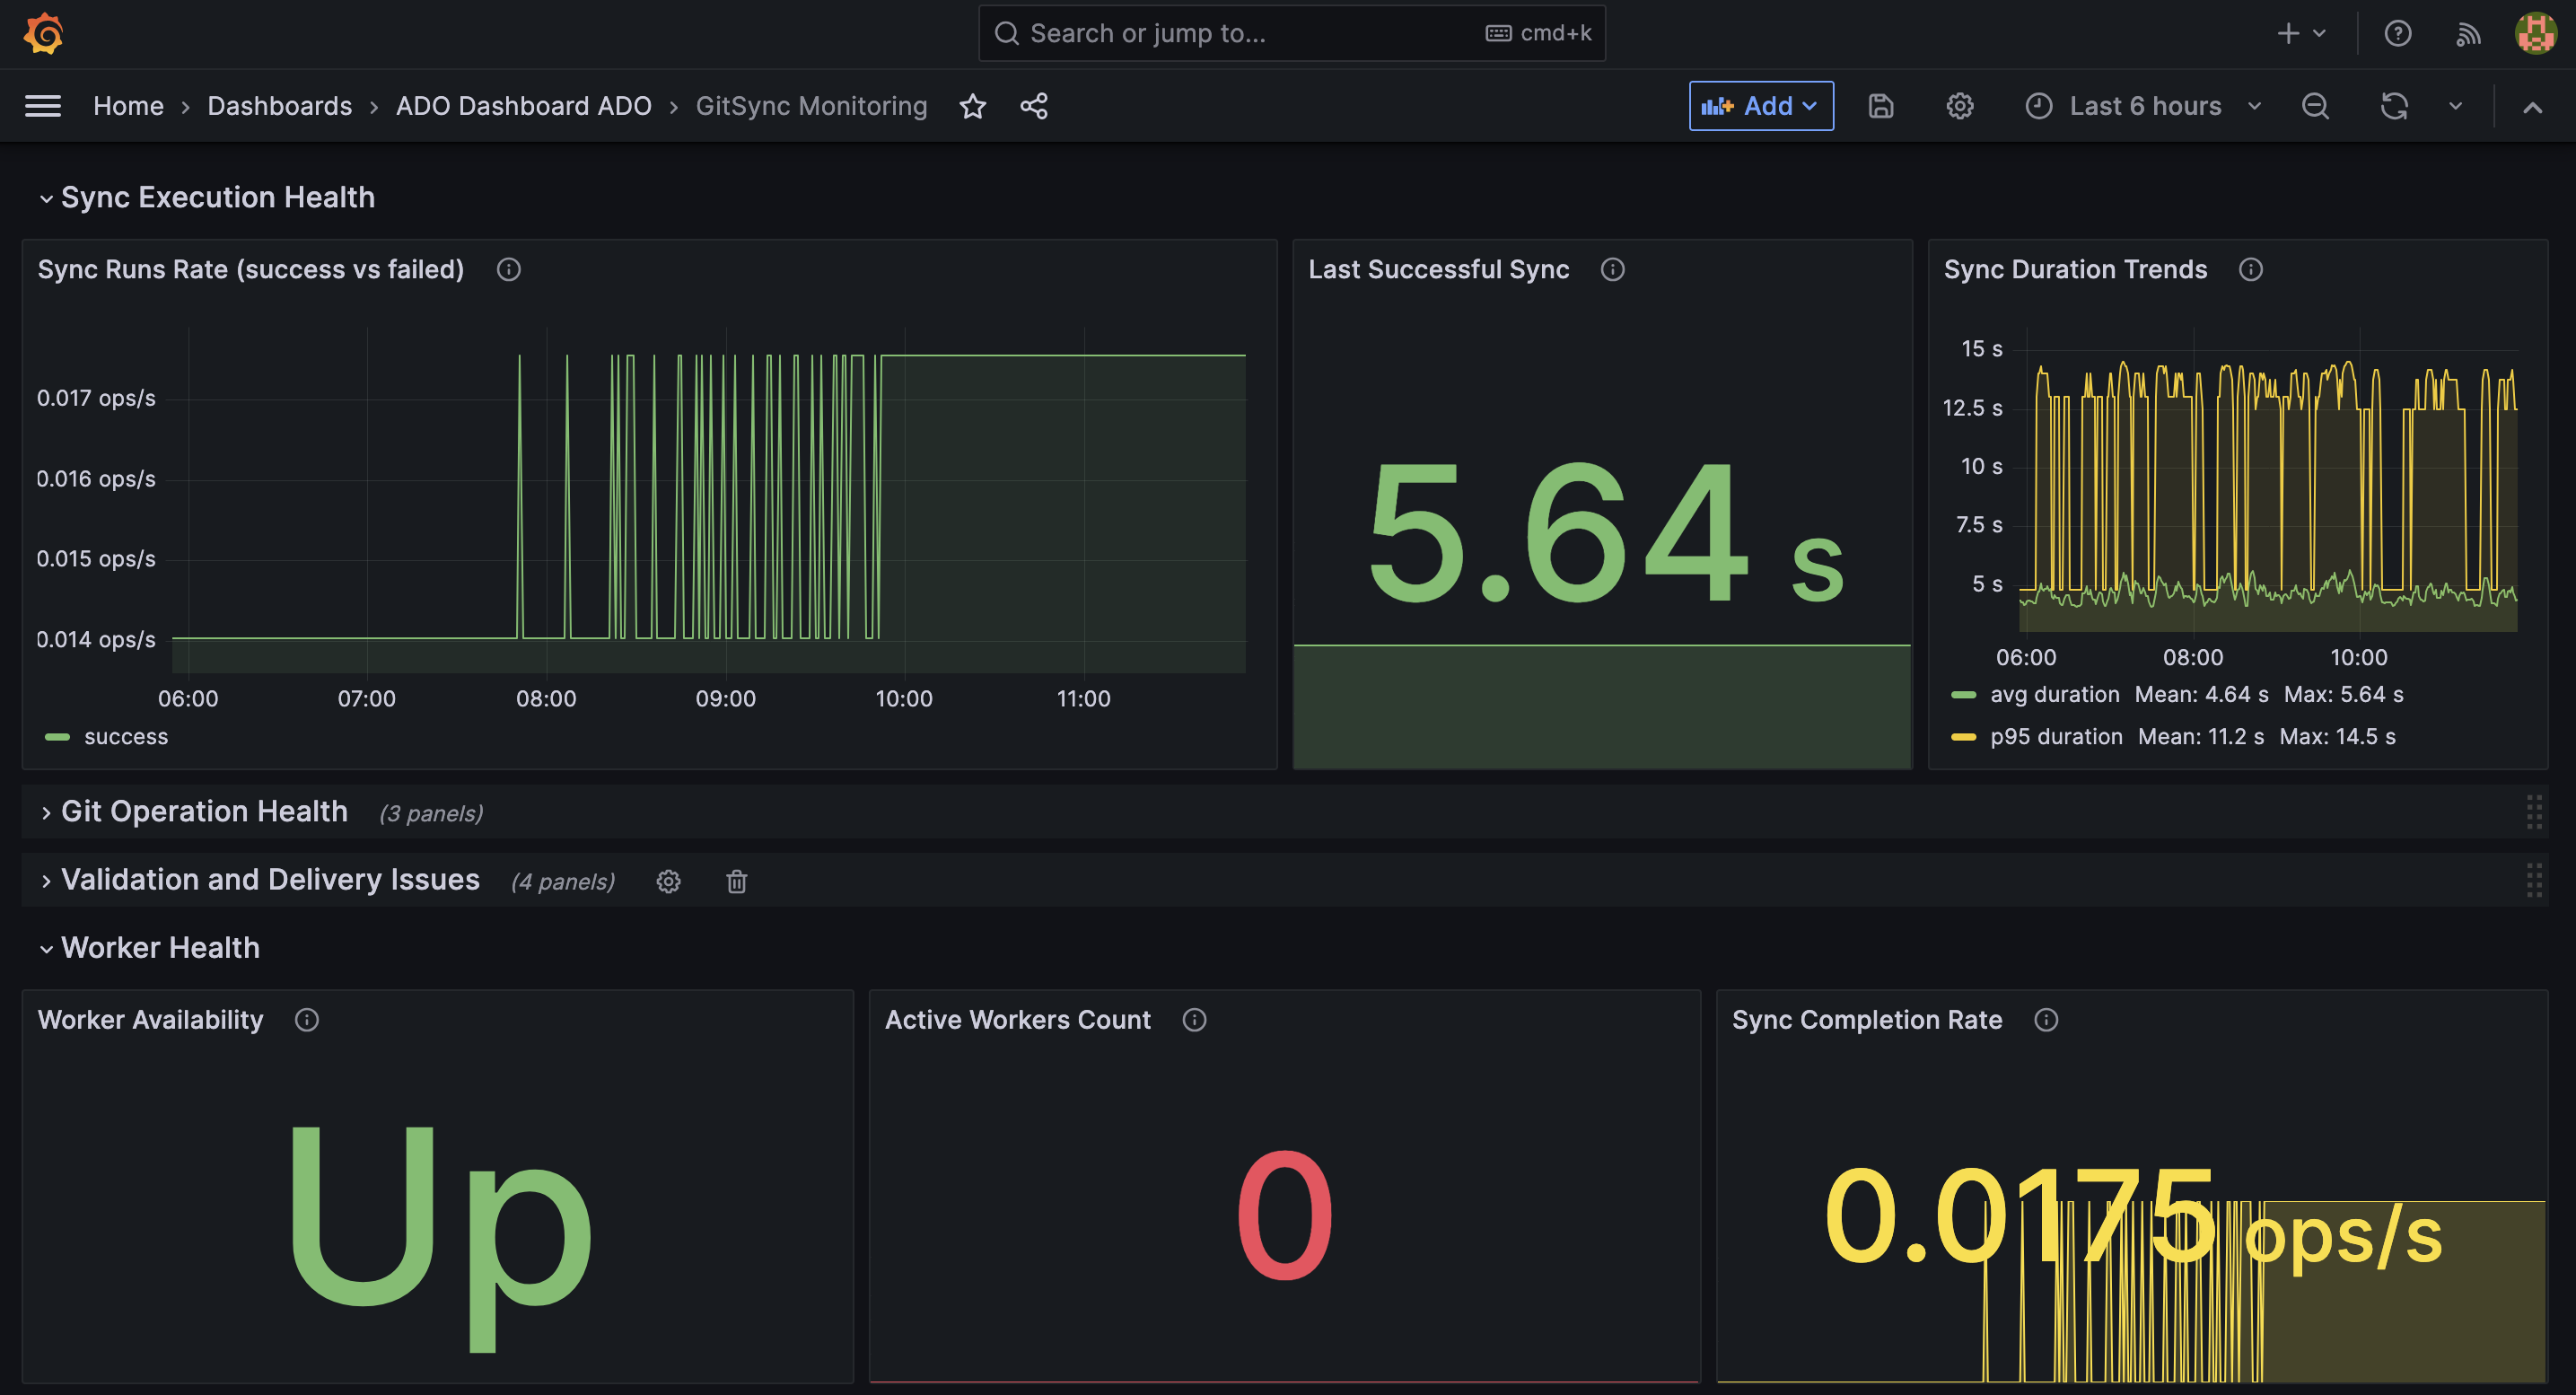
The table below lists the available graphs.
| Panel name | Description |
|---|---|
Sync Runs Rate (success vs failed) |
Shows the rate of successful and failed repository synchronization operations over time |
Last Successful Sync |
Displays the duration of the latest successful synchronization |
Sync Duration Trends |
Shows synchronization duration over time, including the average duration and the 95th percentile (p95). This panel helps identify performance degradation and unusually long synchronization operations |
Git Operations Volume |
Shows the number of Git operations performed over time |
Git Operation Latency (avg and p95) |
Displays the average and 95th percentile duration of Git operations |
Failed Git Operations |
Shows the number of failed Git operations |
Validation Errors |
Displays the number of repository validation errors detected during synchronization |
Target Directory Writability |
Indicates whether the target synchronization directory is writable |
Files Synced Rate |
Shows the rate at which files are synchronized |
Total Files Synced (30m) |
Displays the total number of files synchronized during the last 30 minutes |
Worker Availability |
Shows whether the GitSync worker is available to process synchronization requests |
Active Workers Count |
Displays the number of active GitSync workers |
Sync Completion Rate |
Shows the rate of completed synchronization operations |
Pip Install Duration |
Displays the duration of dependency installation performed from the requirements.txt file during repository synchronization |
Airflow cluster dashboard
The Airflow cluster dashboard provides an overview of the health and performance of Airflow components. It includes scheduler metrics, executor statistics, task execution metrics, and DAG execution performance.
This dashboard helps administrators verify that Airflow components are operating correctly, detect scheduler issues, monitor task execution, and identify bottlenecks affecting workflow execution.
The page includes the Airflow Instance Id filter that allows you to display metrics for a specific host.
The table below lists the available graphs.
| Panel name | Description |
|---|---|
Scheduler heartbeat |
Indicates that the scheduler is running and periodically updating its heartbeat. If this value stops changing, the scheduler may no longer be functioning |
Dagbag size |
Displays the number of DAGs currently loaded by the DAG Processor |
DAG processing total parse time |
Shows the total time required for the DAG Processor to parse all DAG files |
Dagbag import errors |
Displays the number of errors that occurred while importing DAG definitions |
Zombies killed |
Shows the number of zombie task instances detected and terminated by the scheduler |
Total successful tasks |
Displays the cumulative number of successfully completed tasks |
Operator success rate per minute |
Shows the execution rate of successfully completed tasks grouped by operator type |
Operator failure rate per minute |
Shows the execution rate of failed tasks grouped by operator type |
Total failed tasks |
Displays the cumulative number of failed task executions |
Jobs started per minute |
Shows the rate at which jobs are started |
Executor running tasks |
Displays the number of tasks currently running in the executor |
Executor queued tasks |
Shows the number of tasks waiting to be executed |
Jobs ended per minute |
Shows the rate at which jobs finish |
Executor open slots |
Shows the number of executor slots currently available for task execution |
Success DAG run duration |
Displays the execution duration of successful DAG runs. Percentiles (p50, p90, and p99) help identify typical and slow-running workflows |
Failed DAG run duration |
Shows the execution duration of failed DAG runs |
DAG run duration |
Displays the execution duration of all DAG runs regardless of their status |
DAG run dependency check time |
Shows the time required to verify task dependencies before a DAG run begins |
DAG run schedule delay |
Displays the delay between the scheduled execution time and the actual start time of a DAG run |
Airflow DAG dashboard
The Airflow DAG dashboard focuses on performance metrics for an individual DAG. It helps analyze workflow execution time, scheduling delays, and dependency resolution for a selected workflow.
This dashboard is useful for analyzing the behavior of individual workflows, identifying scheduling delays, and detecting performance regressions in specific DAGs.
Use the DAG ID filter at the top of the dashboard to select the DAG whose metrics you want to monitor.
The table below lists the available graphs.
| Panel name | Description |
|---|---|
Success DAG run duration |
Displays the execution duration of successful runs of the selected DAG |
Failed DAG run duration |
Shows the execution duration of failed runs of the selected DAG |
DAG run duration |
Displays the execution duration of all runs of the selected DAG regardless of their status |
DAG run dependency check time |
Shows the time required to evaluate dependencies before each DAG run starts |
DAG run schedule delay |
Displays the delay between the scheduled execution time and the actual start time of a DAG run |
Celery Monitoring
The Celery Monitoring dashboard provides information about the health of Celery workers and the tasks they process.
The table below lists the available graphs.
| Panel name | Description |
|---|---|
Celery Worker Status |
Indicates whether each Celery worker is currently available and responding |
Number of Tasks Currently Executing at Worker |
Displays the number of tasks that are currently being executed by each Celery worker |
Node Exporter Full
This dashboard provides operating system and hardware metrics collected from hosts running ADO components.
It helps administrators monitor CPU, memory, storage, network, and system resource utilization to identify infrastructure bottlenecks and diagnose performance issues.
At the top of the dashboard, the following filters are available:
-
Datasource — the configured VictoriaMetrics or Prometheus data source.
-
Job — the scrape job.
-
Host — the host whose metrics should be displayed.
The dashboard contains the following sections.
| Section | Description |
|---|---|
Quick CPU / Mem / Disk |
Provides a high-level overview of CPU utilization, system load, memory usage, swap usage, filesystem utilization, system uptime, and available hardware resources |
Basic CPU / Mem / Net / Disk |
Displays the primary CPU, memory, network, and filesystem metrics for the selected host |
Memory Meminfo |
Provides detailed information about physical memory usage reported by the operating system |
Memory Vmstat |
Displays virtual memory statistics, including paging and memory management activity |
System Timesync |
Shows time synchronization metrics that help verify clock synchronization on the monitored host |
System Processes |
Provides statistics about running processes and process states |
System Misc |
Displays miscellaneous operating system metrics, including file descriptors, interrupts, context switches, and other kernel statistics |
Hardware Misc |
Provides hardware-related metrics collected from the operating system |
Systemd |
Displays metrics for services managed by systemd |
Storage Disk |
Provides detailed disk I/O statistics and performance metrics for storage devices |
Storage Filesystem |
Displays filesystem capacity, utilization, and available space |
Network Traffic |
Shows transmitted and received network traffic for each network interface |
Network Sockstat |
Displays socket usage statistics |
Network Netstat |
Provides protocol-level network statistics reported by the operating system |
Node Exporter |
Displays internal metrics exposed by the Node Exporter process itself |