

View a dashboard
The Dashboard page of the ADQM Control web interface displays general information about an ADQM cluster state as:
-
Heat map — graphically represents the states of the ADQM cluster hosts.
-
Recent alerts — lists the latest alerts about potential and critical issues detected on the ADQM cluster hosts.
-
Top 10 tables — 10 largest tables by data amount in the ADQM cluster and 10 tables to which the most queries were sent.
-
Top 10 queries — 10 queries that took the longest to execute and 10 queries that used the most memory.
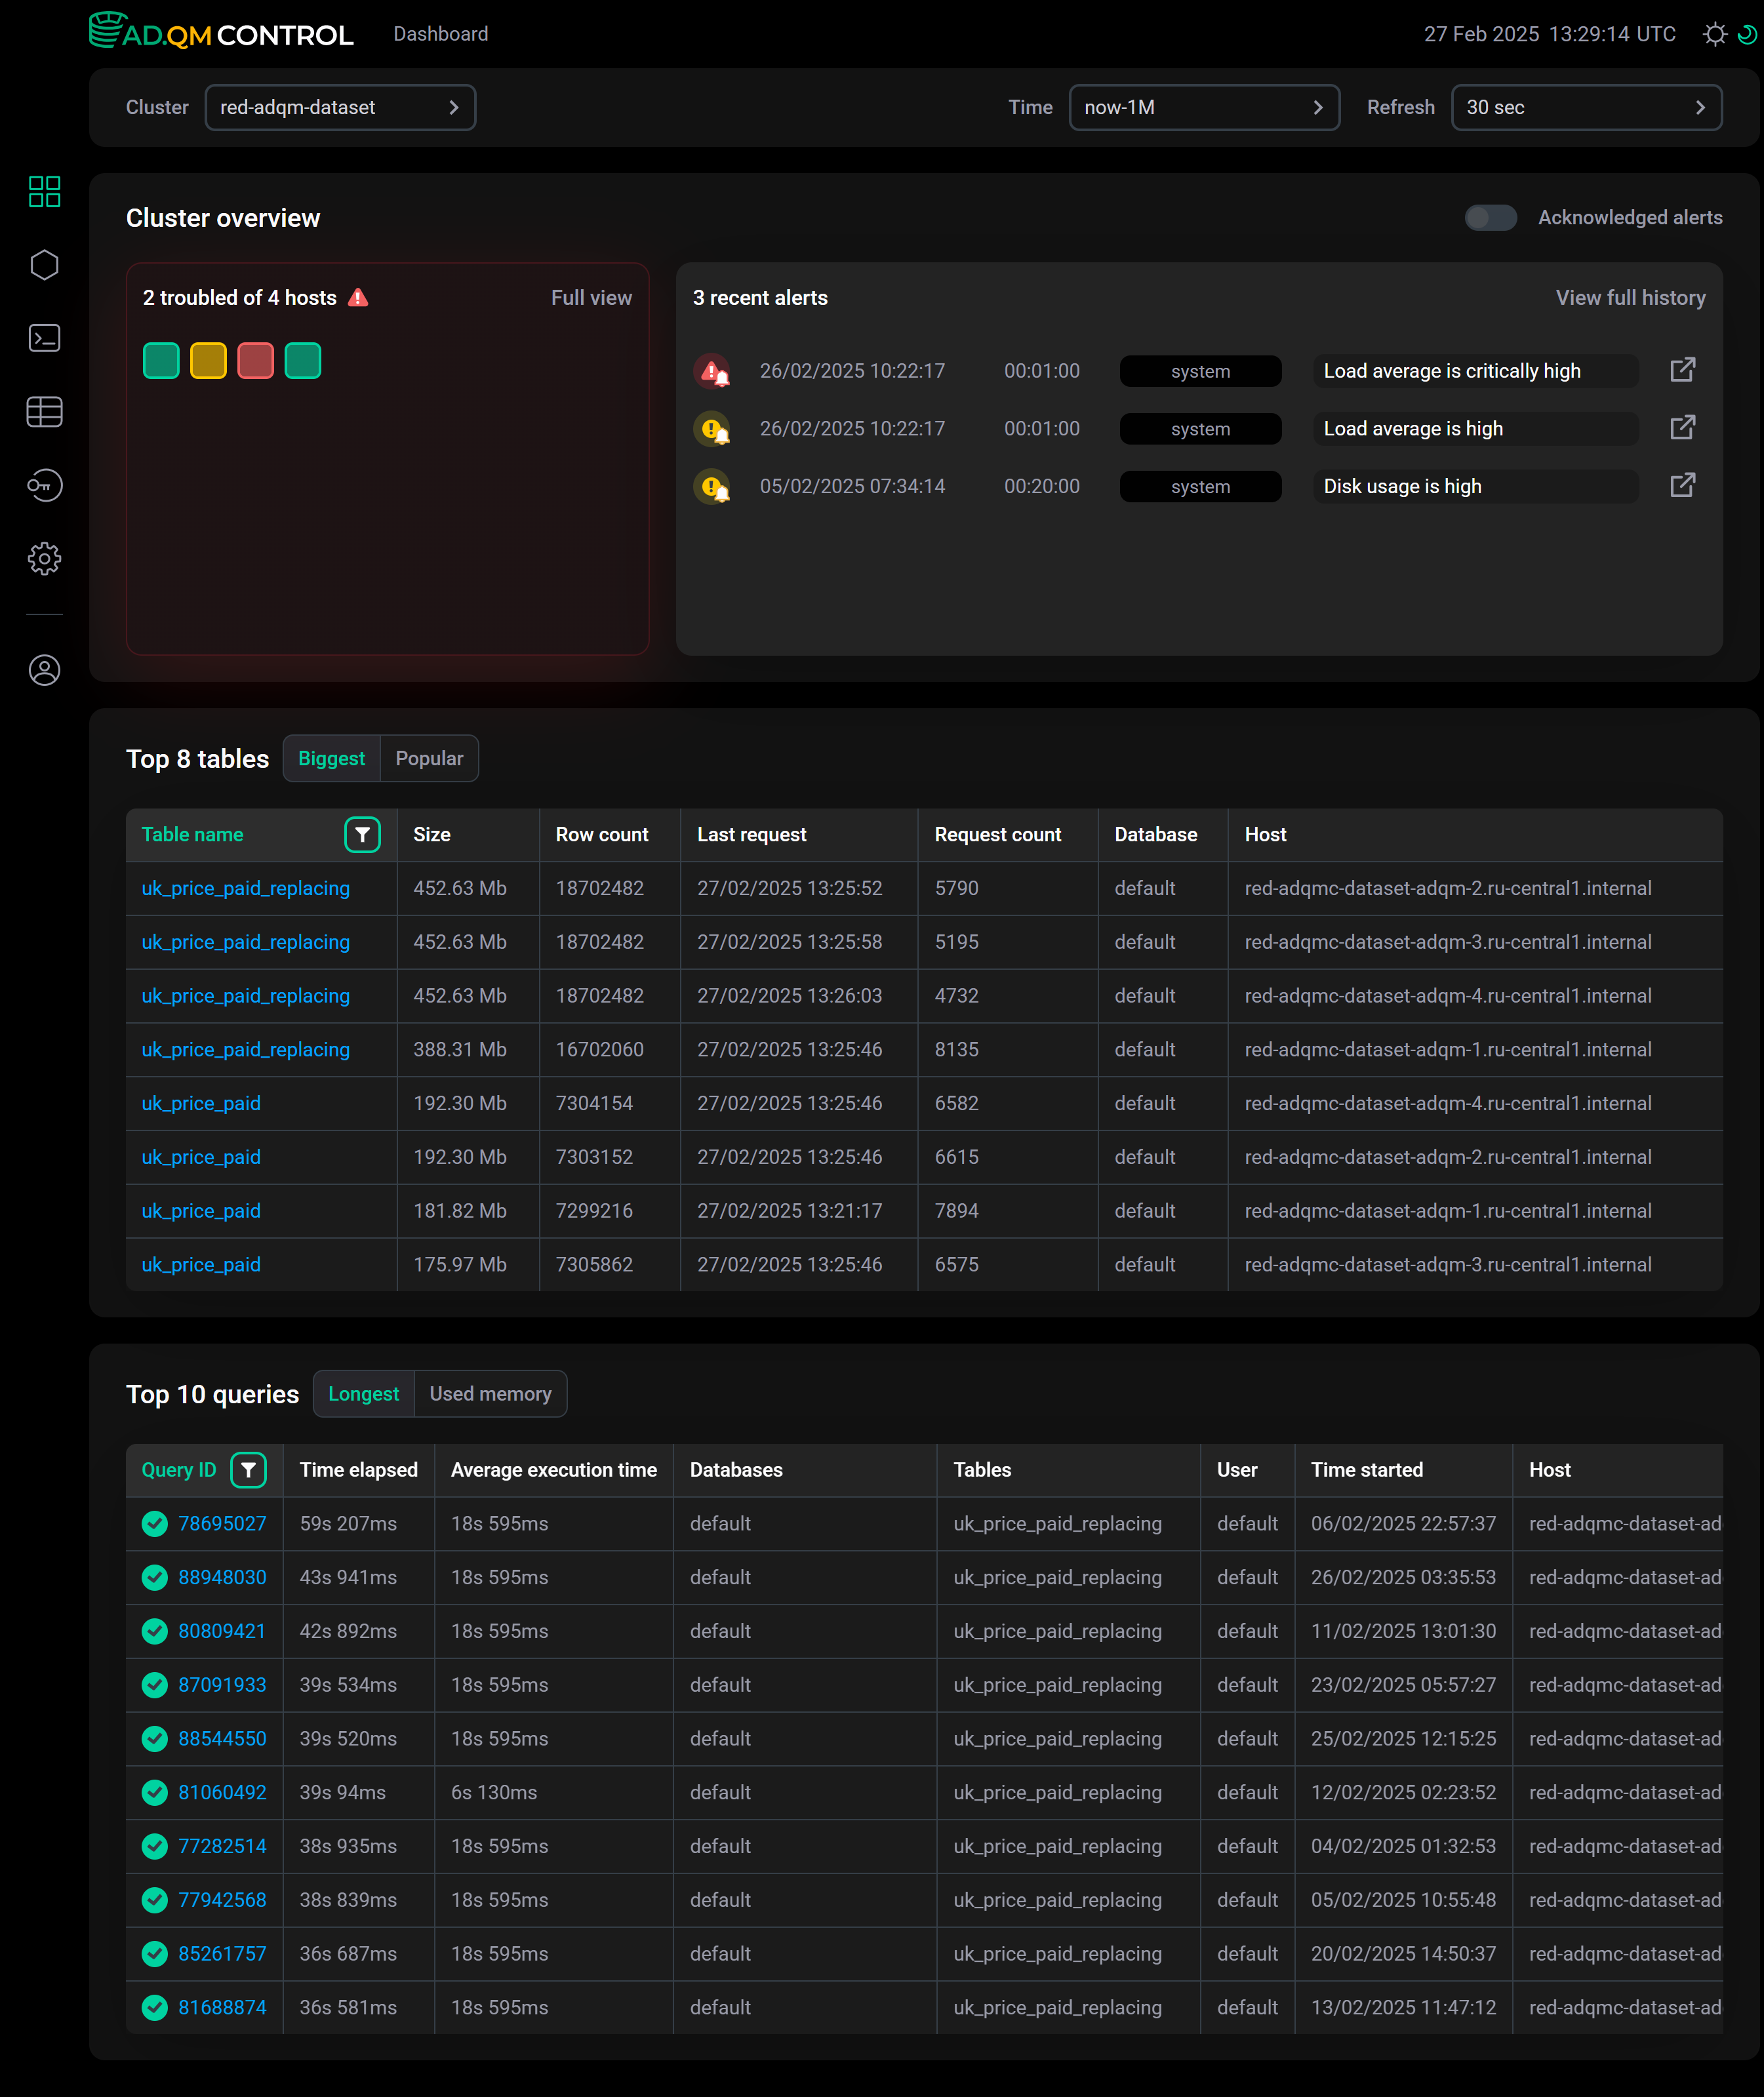
In the fields at the top of the screen, you can configure the following filters for selecting data to build a dashboard:
-
Cluster — ADQM cluster for which information should be displayed.
-
Time — time period for which information is required. In the window that opens when you click the field, you can select an interval from the offered options on the Range tab or set a custom time range (at least 1 hour) on the Calendar tab.
-
Refresh — frequency of data updates.
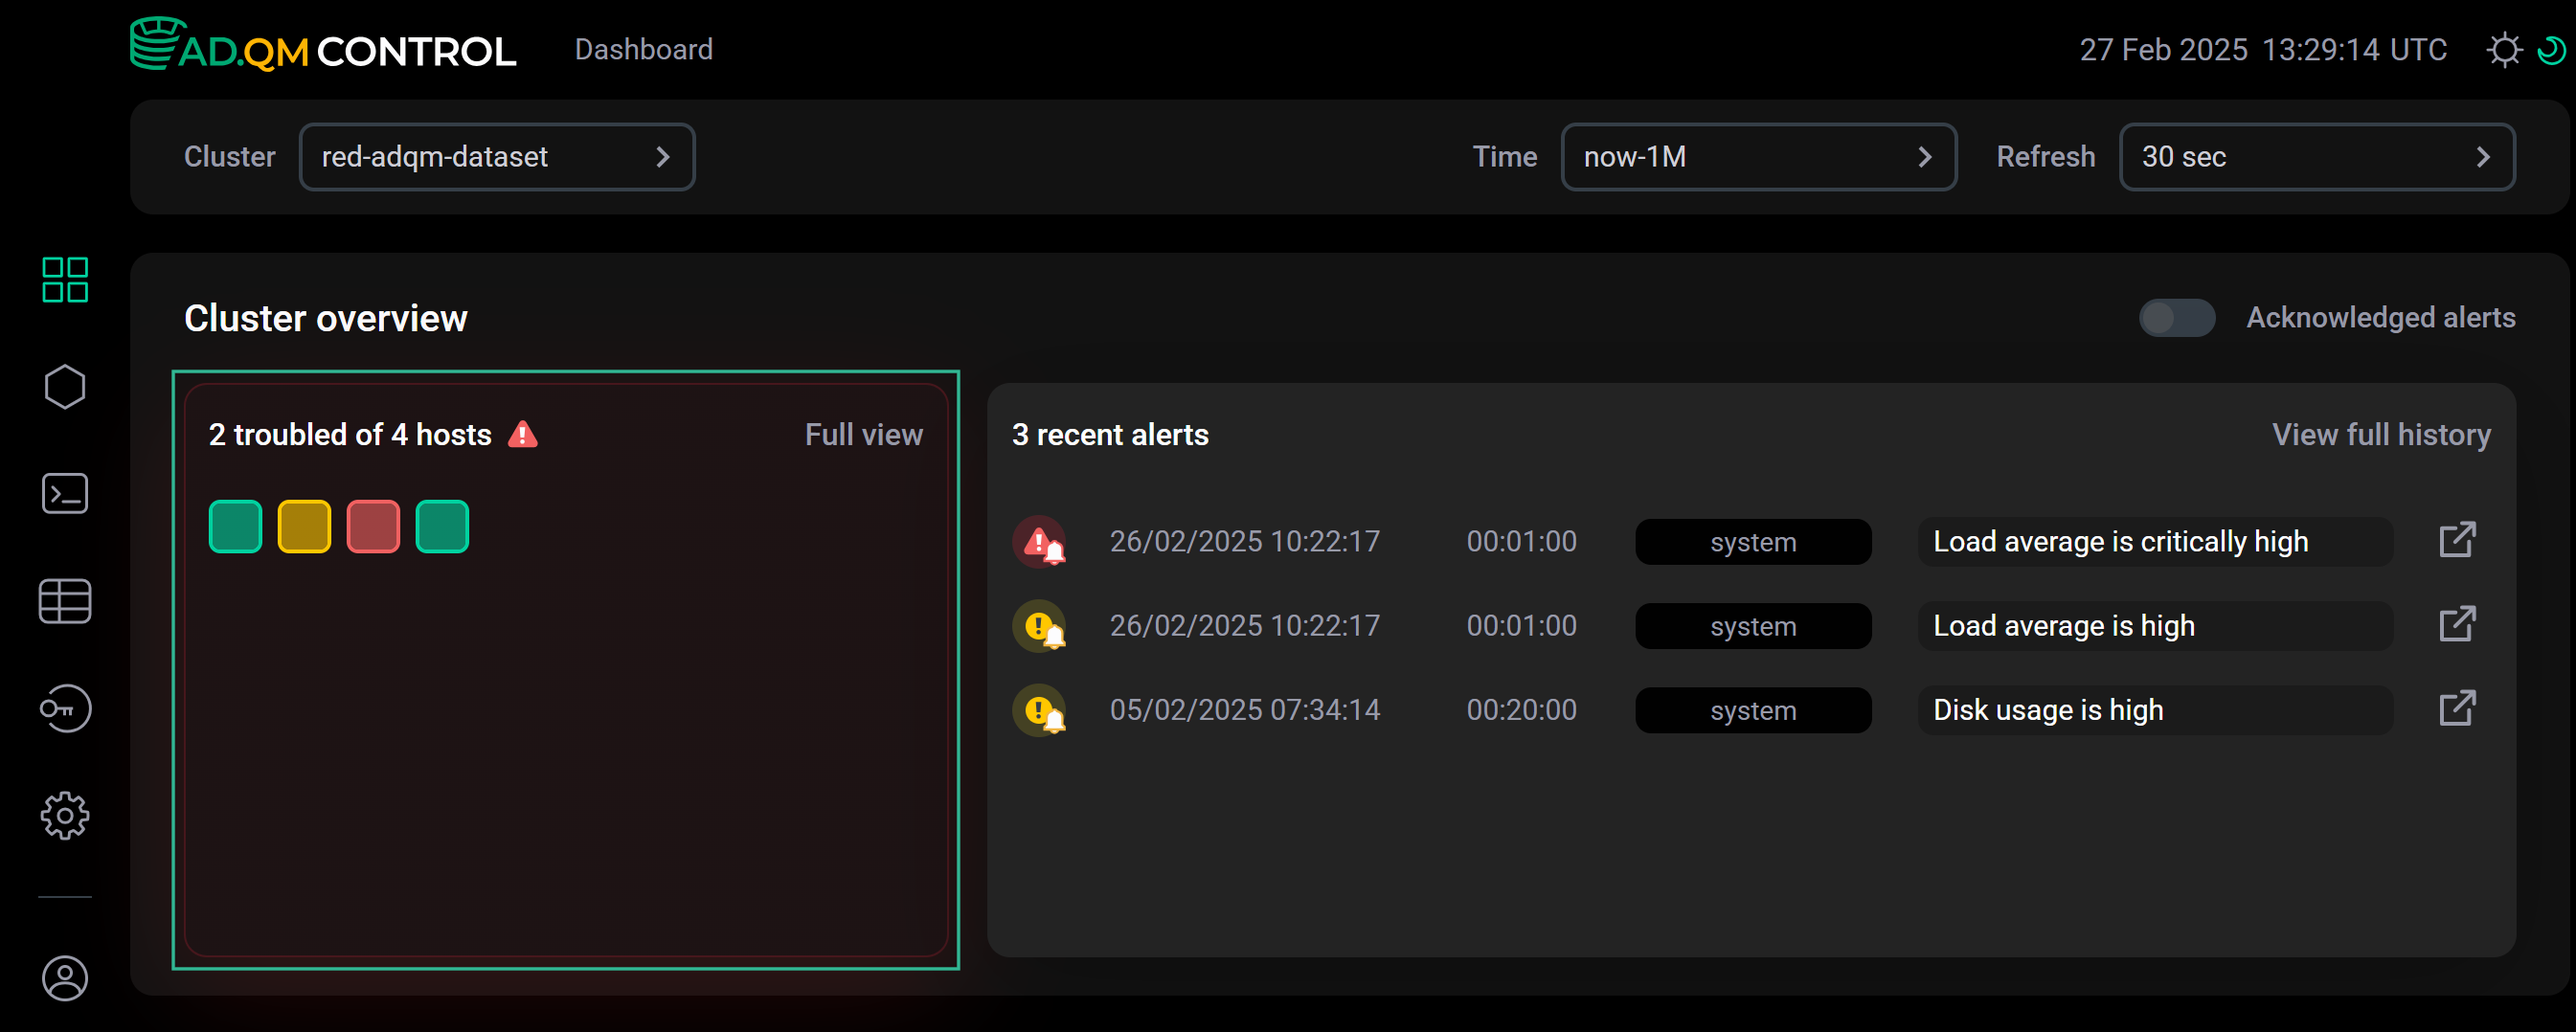
Cluster overview
Heat map
A heat map visualizes information about the states of all hosts in the ADQM cluster — each host is drawn as a square, and its color indicates the system state at the selected time interval.
ADQM Control determines a host state and assigns the corresponding color to it in the heat map matrix based on existing alerts about host issues:
 — there are no alerts about any issues on a host in ADQM Control (a healthy host).
 — only potential issues have been detected on a host (for example, the increase in the values of some system metrics), but they are not yet critical. Appropriate warning alerts about these issues have been generated in ADQM Control.
 — at least one critical issue has been detected on a host, and the corresponding alert of the high-importance level about it exists in ADQM Control.
 — a host or the ADQMDB service is unavailable, and an alert about this has been generated in ADQM Control (conditions for generating these alerts are configured in Internal alerts).
|
TIP
From ADQM Control, you can navigate to the ADQM Notebook interface (supported in ADQM since the version 25.8.16.34), which provides a lot of features for working with ADQM databases and tables. To do this, hover the mouse over a host in Heat map and click ADQM Notebook in the pop-up window. |
Recent alerts
The Dashboard page also displays the most recent alerts (up to 5) about problems on the ADQM cluster hosts, sorted in descending order by the time the alerts were generated, not by their importance.
| Alert severity level | Description | Condition for generating an alert |
|---|---|---|
|
A potential problem has been detected on a host |
A system metric value exceeds a threshold set via the Warning parameter in the System alerts configuration |
|
A critical problem has been detected on a host |
A system metric value exceeds a threshold set via the Critical parameter in the System alerts configuration |


You can select one or more hosts in Heat map (by clicking) — then the list of recent alerts will include the alerts only for the selected hosts.
To get a full list (history) of alerts for all hosts of the cluster generated during the specified period of time, click View full history in the top right corner within the Recent alerts section — it will open the Alerts history tab on the Cluster metrics page.
Acknowledged alerts
The Acknowledged alerts option allows you to specify which alerts about problems on cluster hosts ADQM Control should take into account when generating the heat map and the list of recent alerts:
![]()
![]() Acknowledged alerts — all alerts generated during the selected time period;
Acknowledged alerts — all alerts generated during the selected time period;
![]()
![]() Acknowledged alerts — only relevant alerts, i.e. alerts that are not set as acknowledged. ADQM Control highlights relevant alerts (requiring your attention to be resolved) with the bell sign in their icons:
Acknowledged alerts — only relevant alerts, i.e. alerts that are not set as acknowledged. ADQM Control highlights relevant alerts (requiring your attention to be resolved) with the bell sign in their icons:  or
or  .
.
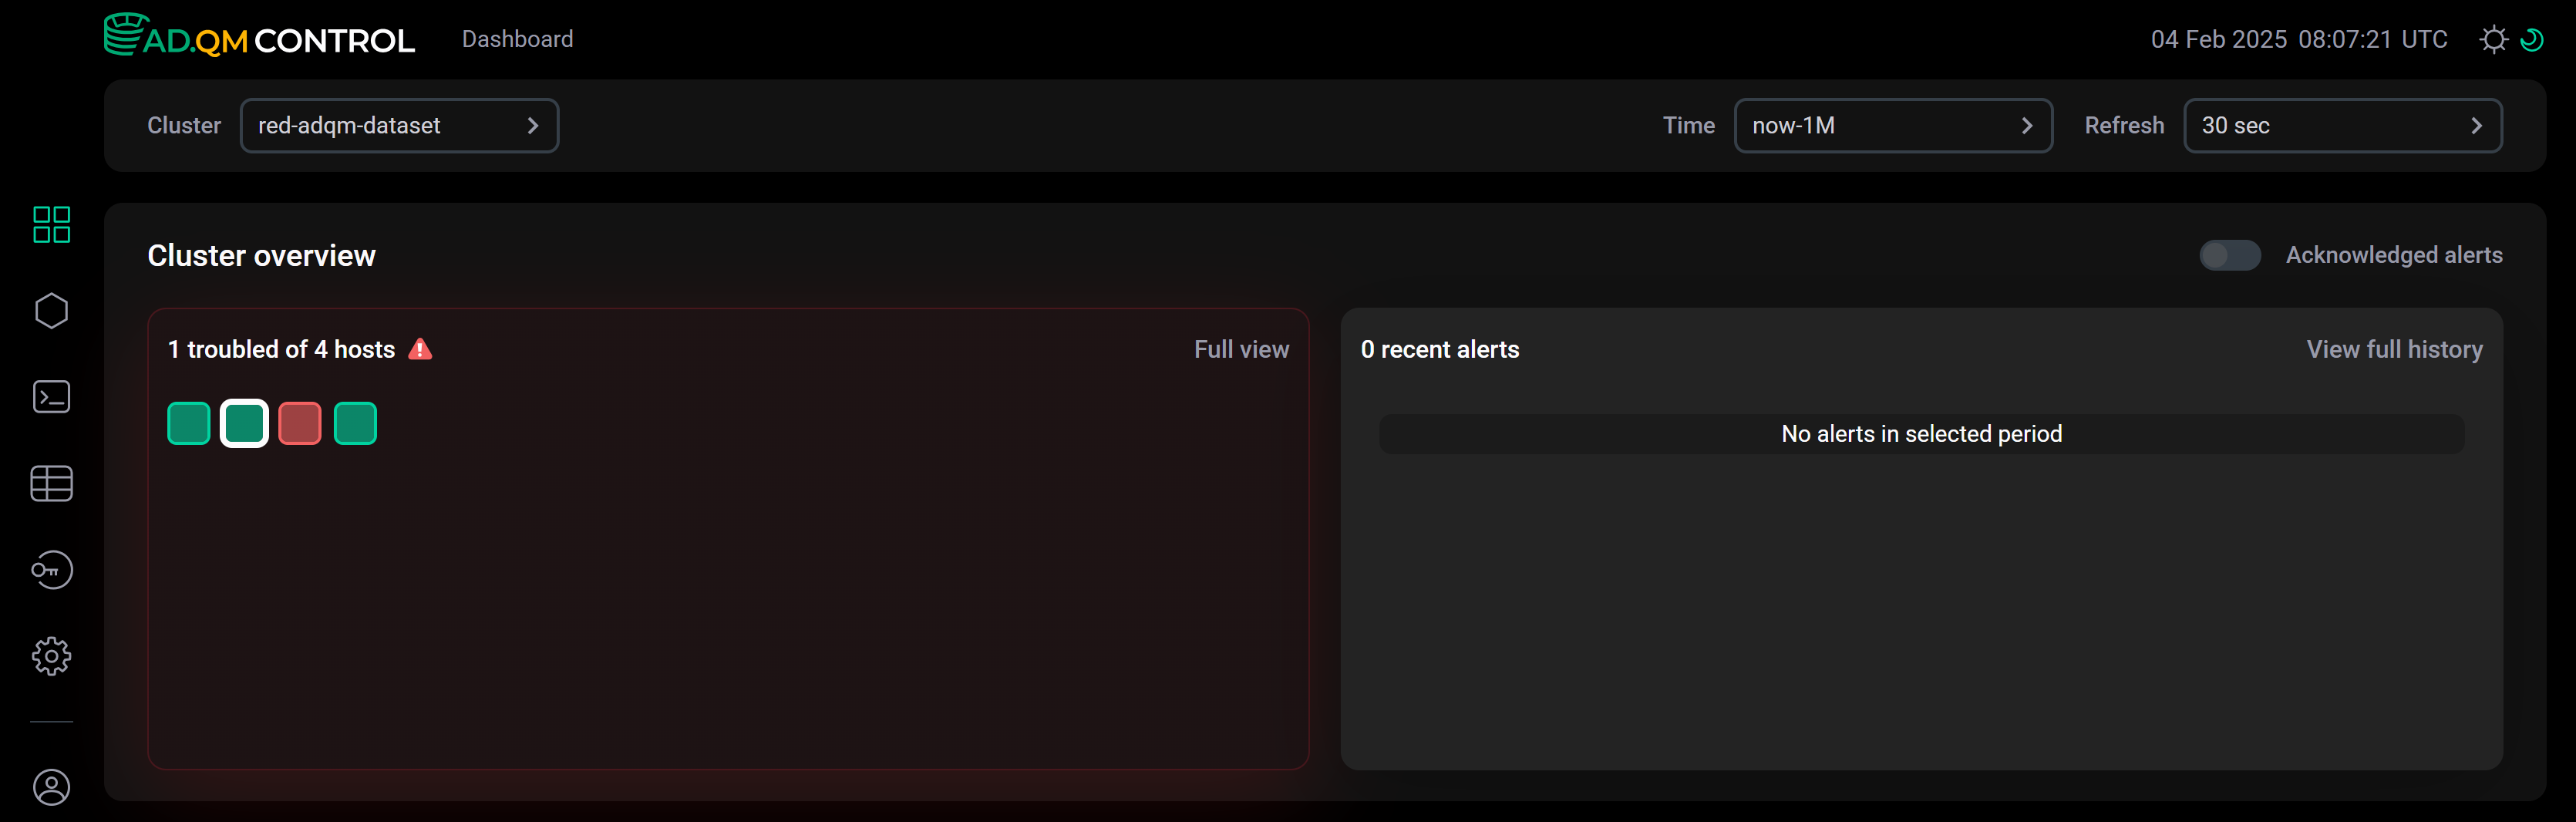
For example, no issues were detected for the specified period of time on the second host of the cluster (it is selected in the image below) or all alerts were set as acknowledged — in this case, with the ![]()
![]() Acknowledged alerts option disabled, this host is filled with green in Heat map and the Recent alerts list is empty.
Acknowledged alerts option disabled, this host is filled with green in Heat map and the Recent alerts list is empty.
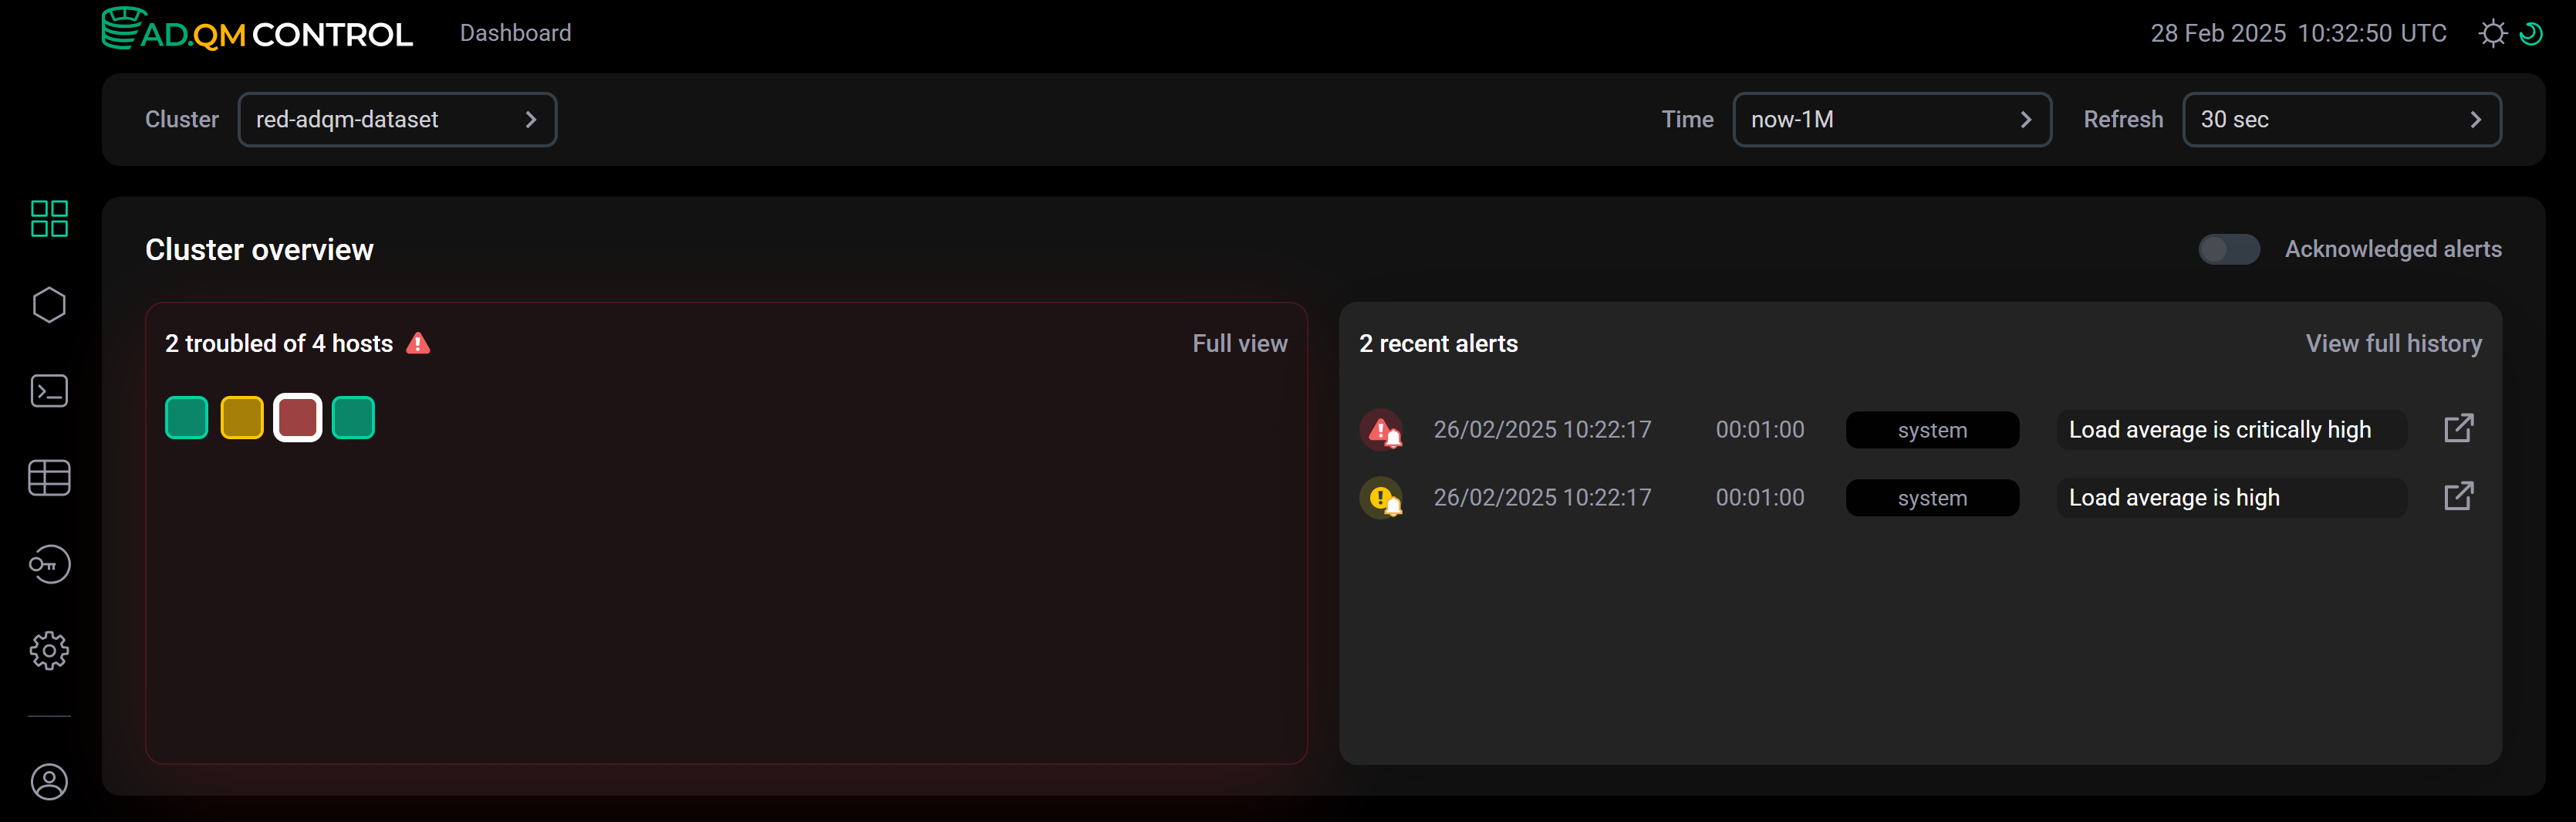
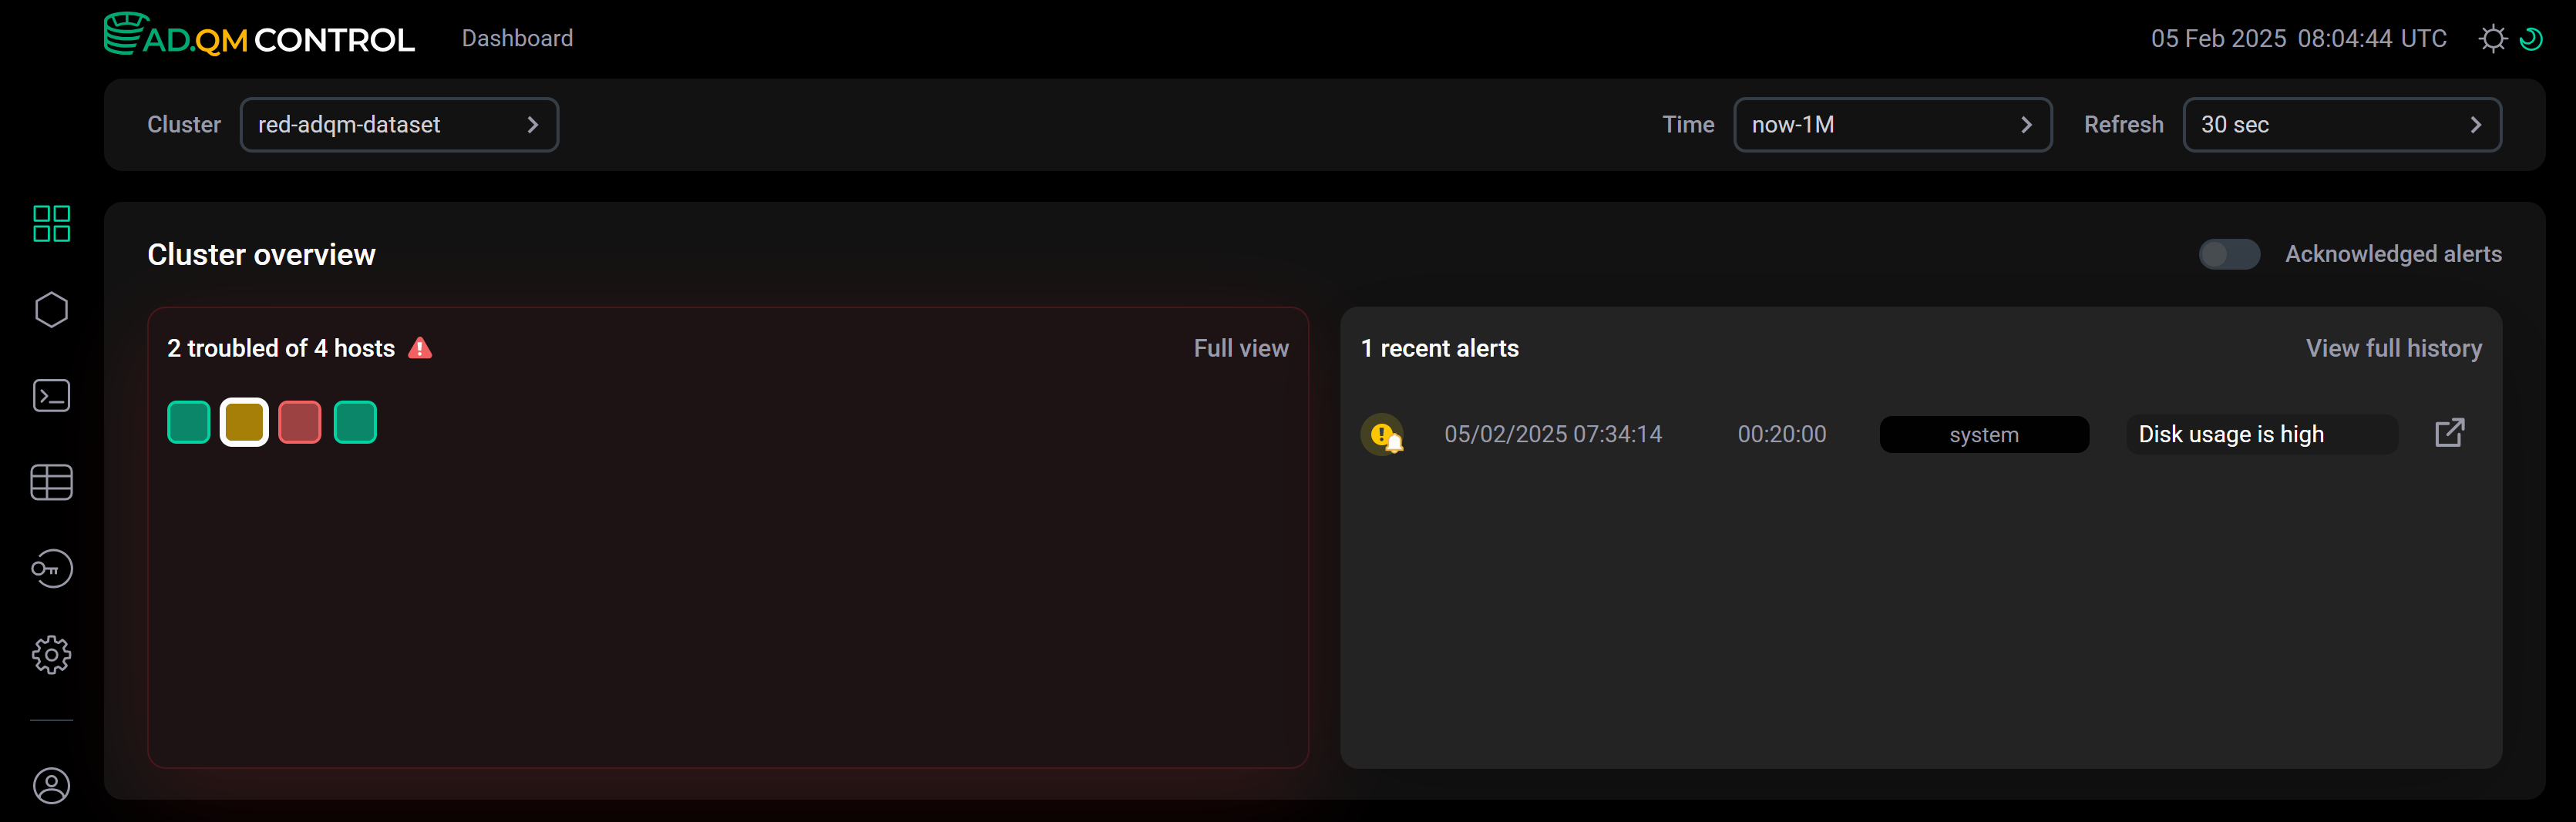
Then, the issue Disk usage is high occurred on this host, and ADQM Control generated a warning alert. This alert is now displayed in the Recent alerts list and the color of the host is yellow in Heat map, as shown in the following image.
If the disk usage issue has been analyzed and resolved, it no longer requires attention and you can add the corresponding alert to the list of acknowledged alerts (on the page with alert details — see the next section). After that, ADQM Control will not take into account this alert when monitoring the cluster health — it will display the host in green in Heat map again and exclude the alert from the Recent alerts list for the host.
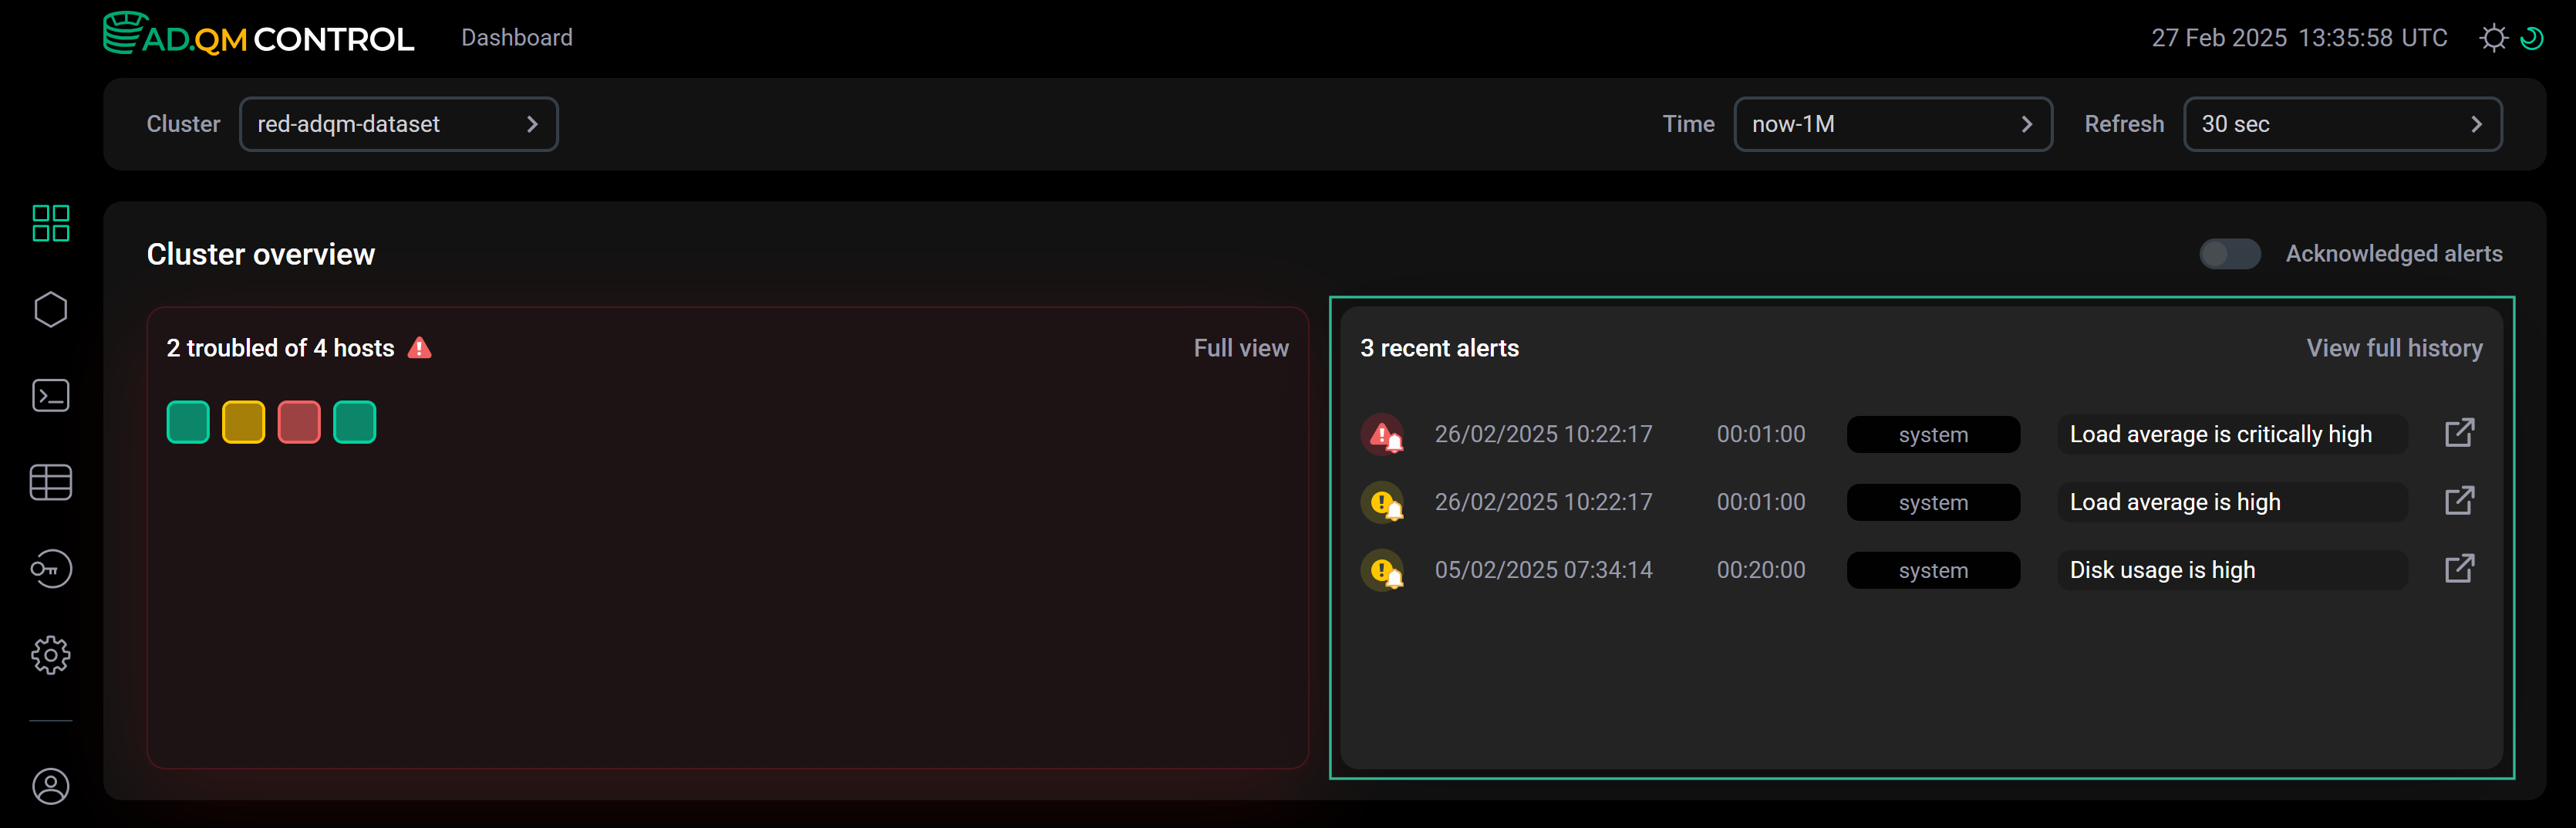
If the ![]()
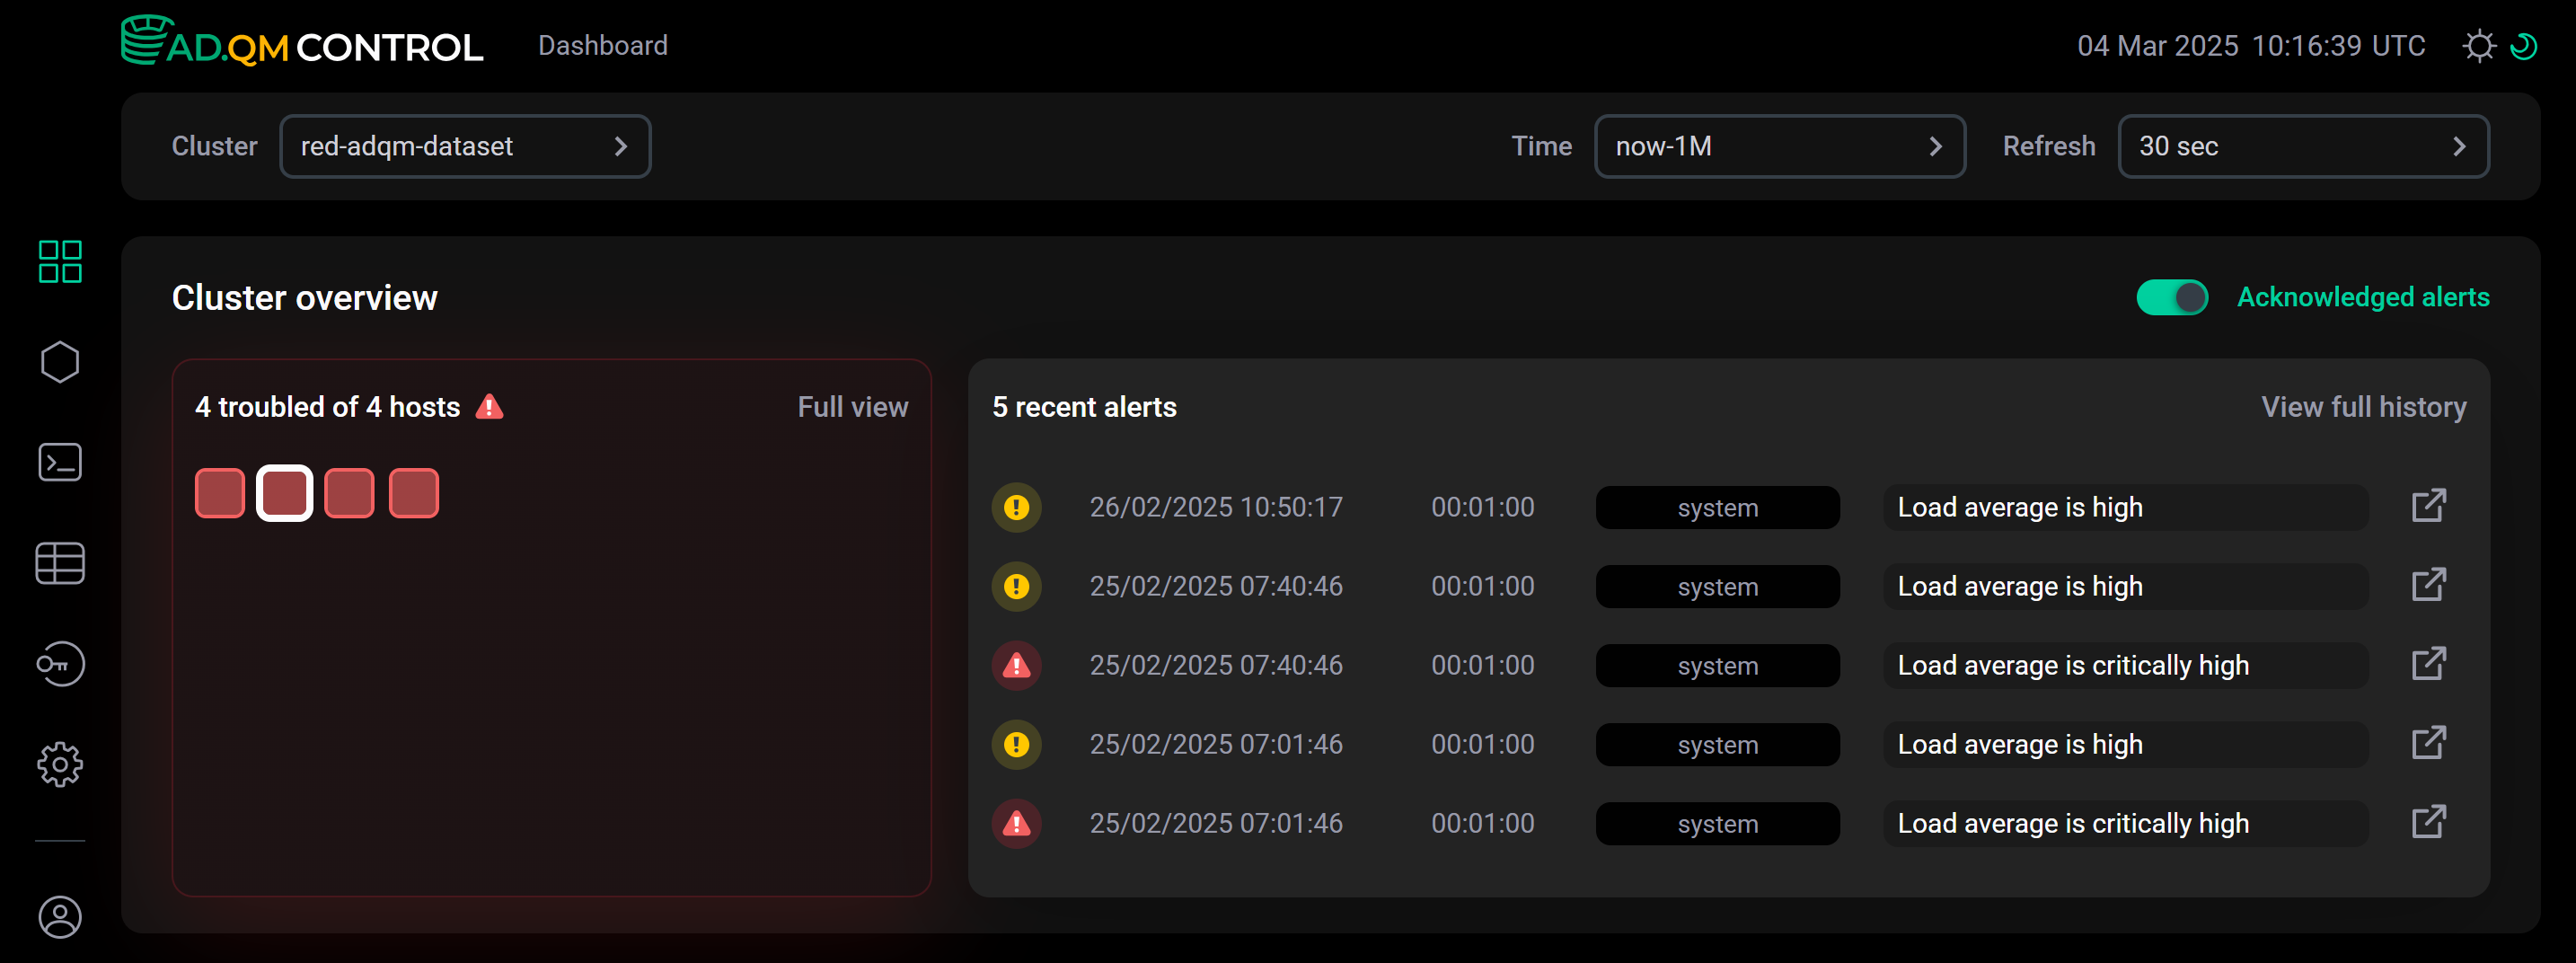
![]() Acknowledged alerts option is enabled, the Recent alerts list shows the latest alerts among all alerts (active and "closed") generated during the specified time period, and all alerts affect the heat map. For example, in the image below, all cluster hosts in Heat map are red — this means that at least one critical issue was detected on each of these hosts during the selected time period (the last month in this example). The Recent alerts list shows that there are no relevant alerts among the most recent alerts about problems on the selected host (alert icons are without the bell sign).
Acknowledged alerts option is enabled, the Recent alerts list shows the latest alerts among all alerts (active and "closed") generated during the specified time period, and all alerts affect the heat map. For example, in the image below, all cluster hosts in Heat map are red — this means that at least one critical issue was detected on each of these hosts during the selected time period (the last month in this example). The Recent alerts list shows that there are no relevant alerts among the most recent alerts about problems on the selected host (alert icons are without the bell sign).
Open alert details
From the Dashboard page, you can access detailed information about a problem related to a host in one of the following ways:
-
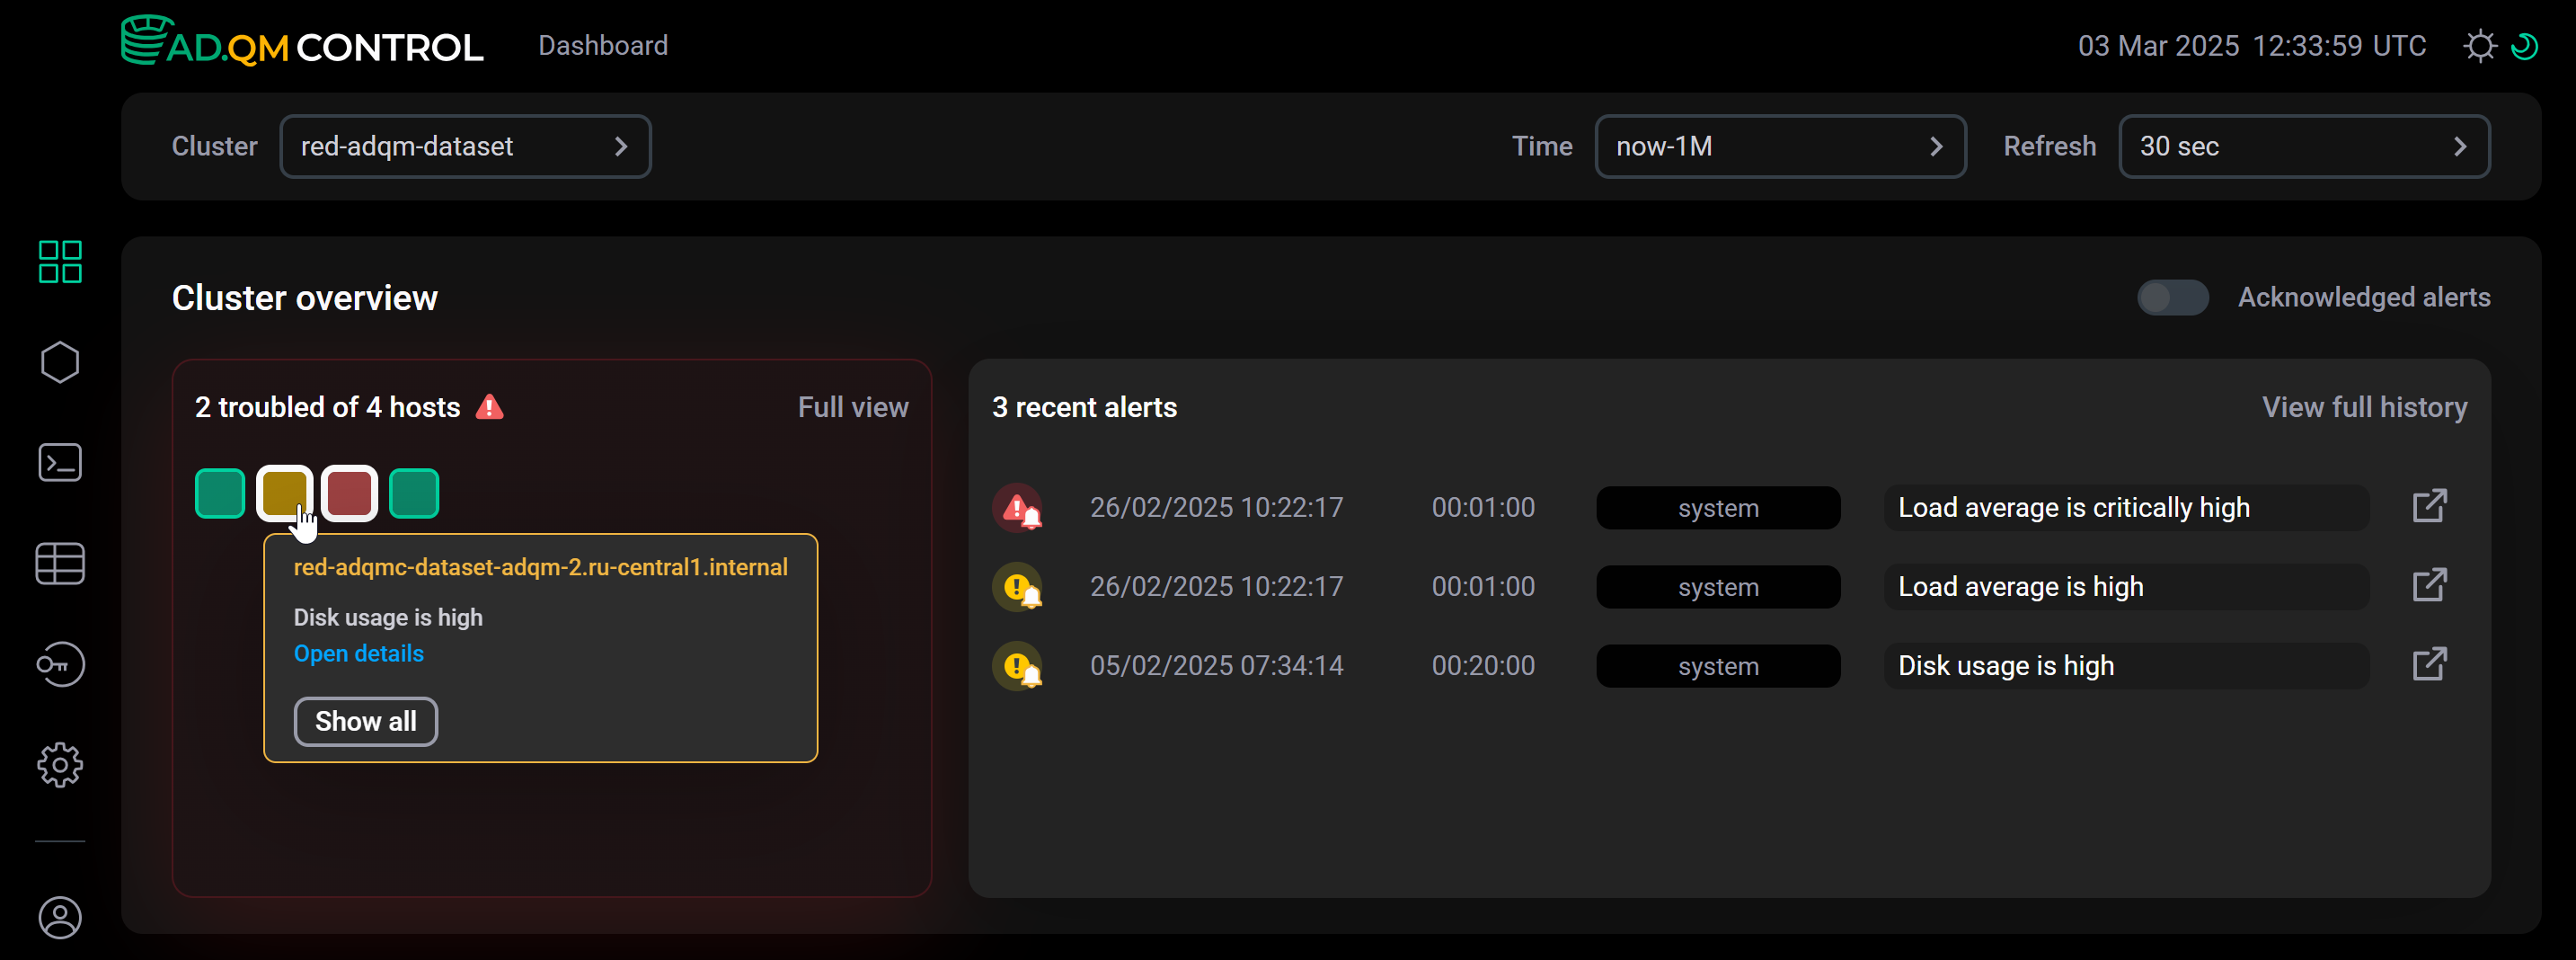
In Heat map, hover the mouse over a host — a pop-up window will show alerts about the last two problems found on that host. Click Open alert below an alert corresponding to an issue you want to receive more information about.
 Summary of host issues
 -
In the Recent alerts list, click the icon

 in an alert row.
Each of these actions opens a separate page with a detailed description of the corresponding issue. For example, the details of the alert Disk usage is high show which device is exceeding its usage limit. The threshold field contains the metric threshold value set in Settings → Alerts, based on which the alert was generated.
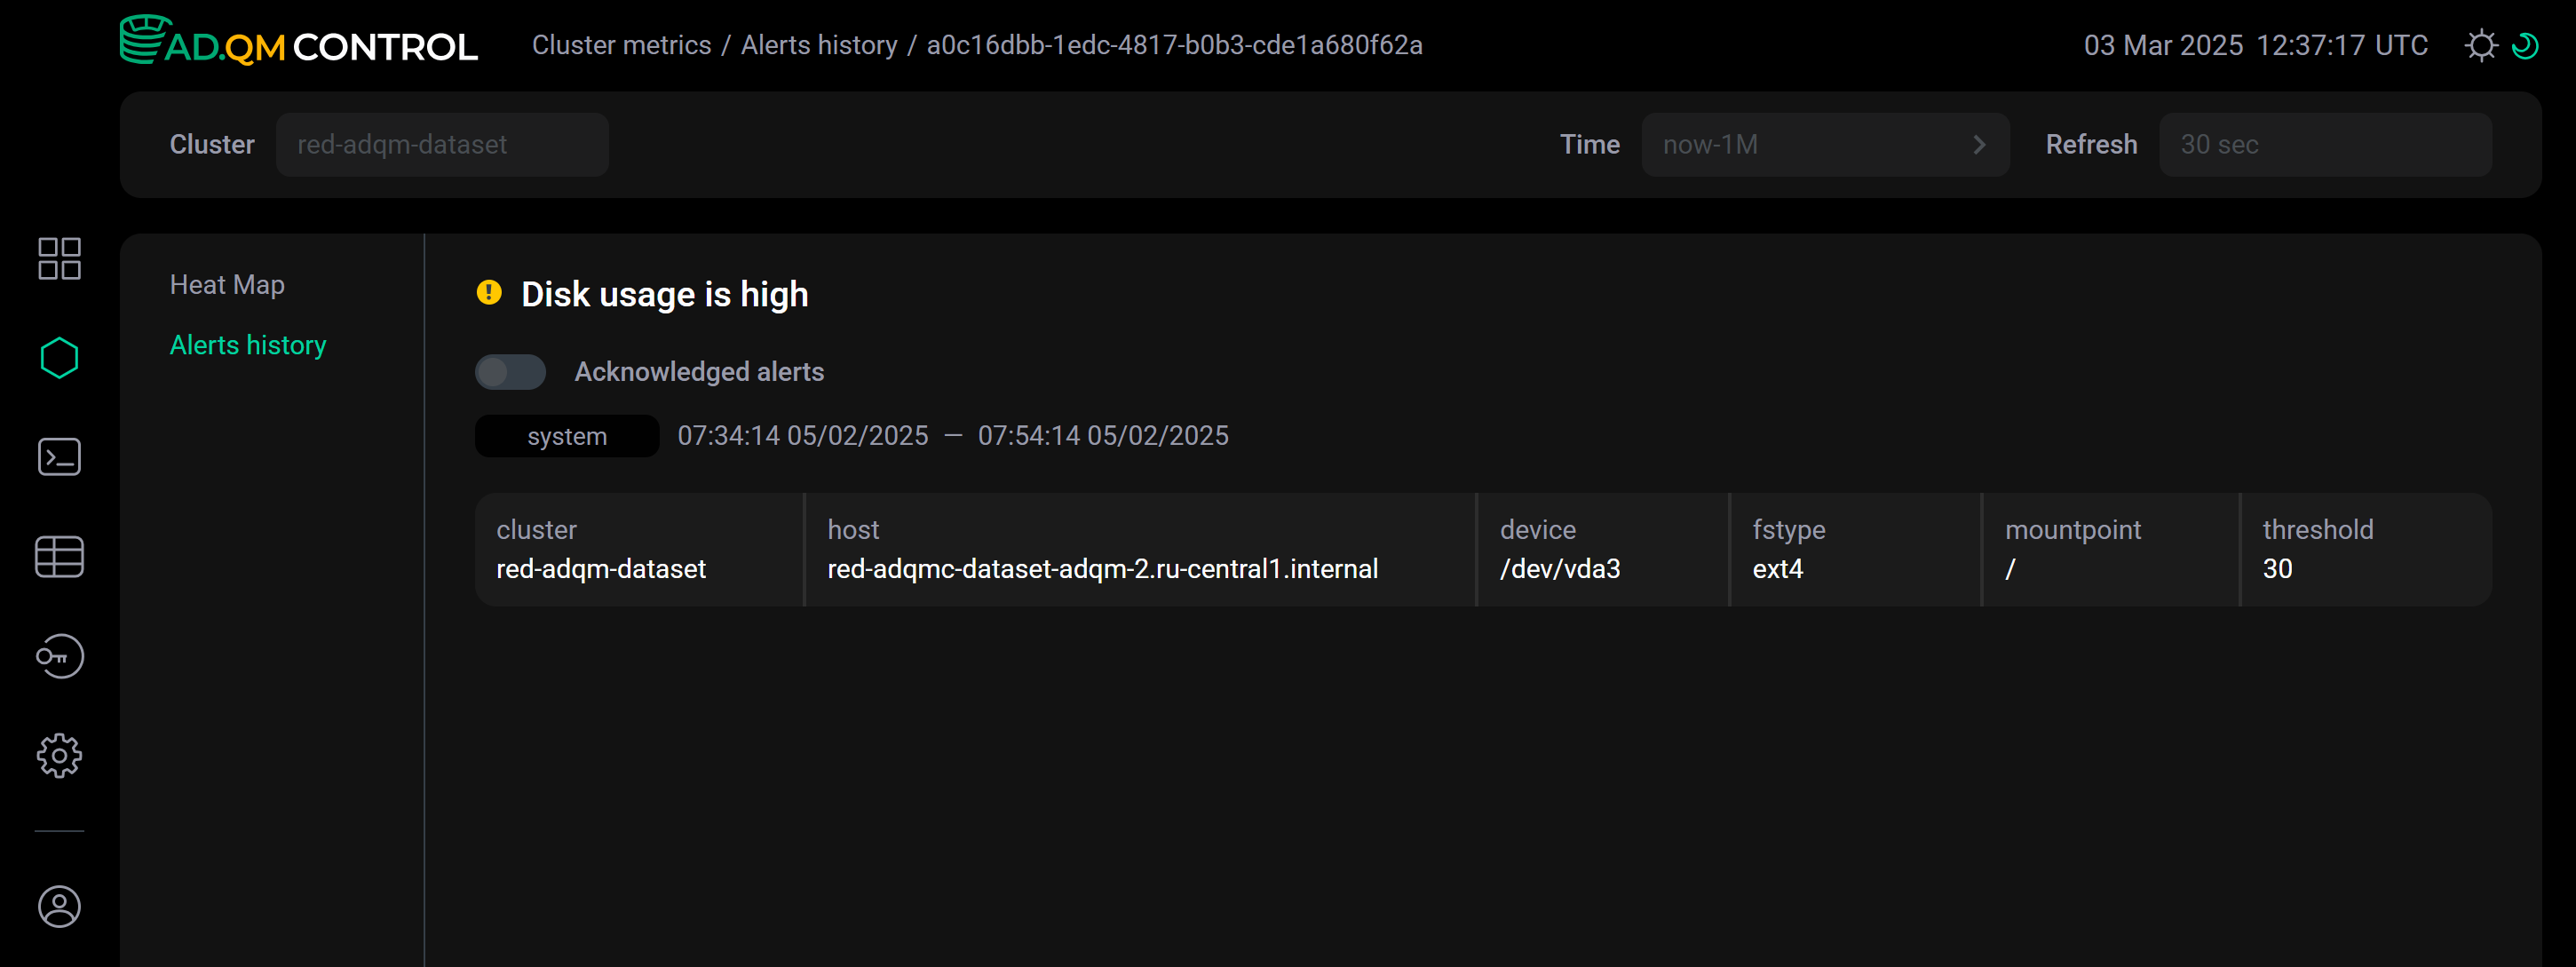
Use the Acknowledged alerts option on this page to change an alert status and mark the corresponding issue as acknowledged (in other words, known or resolved).
Go to the Cluster metrics page
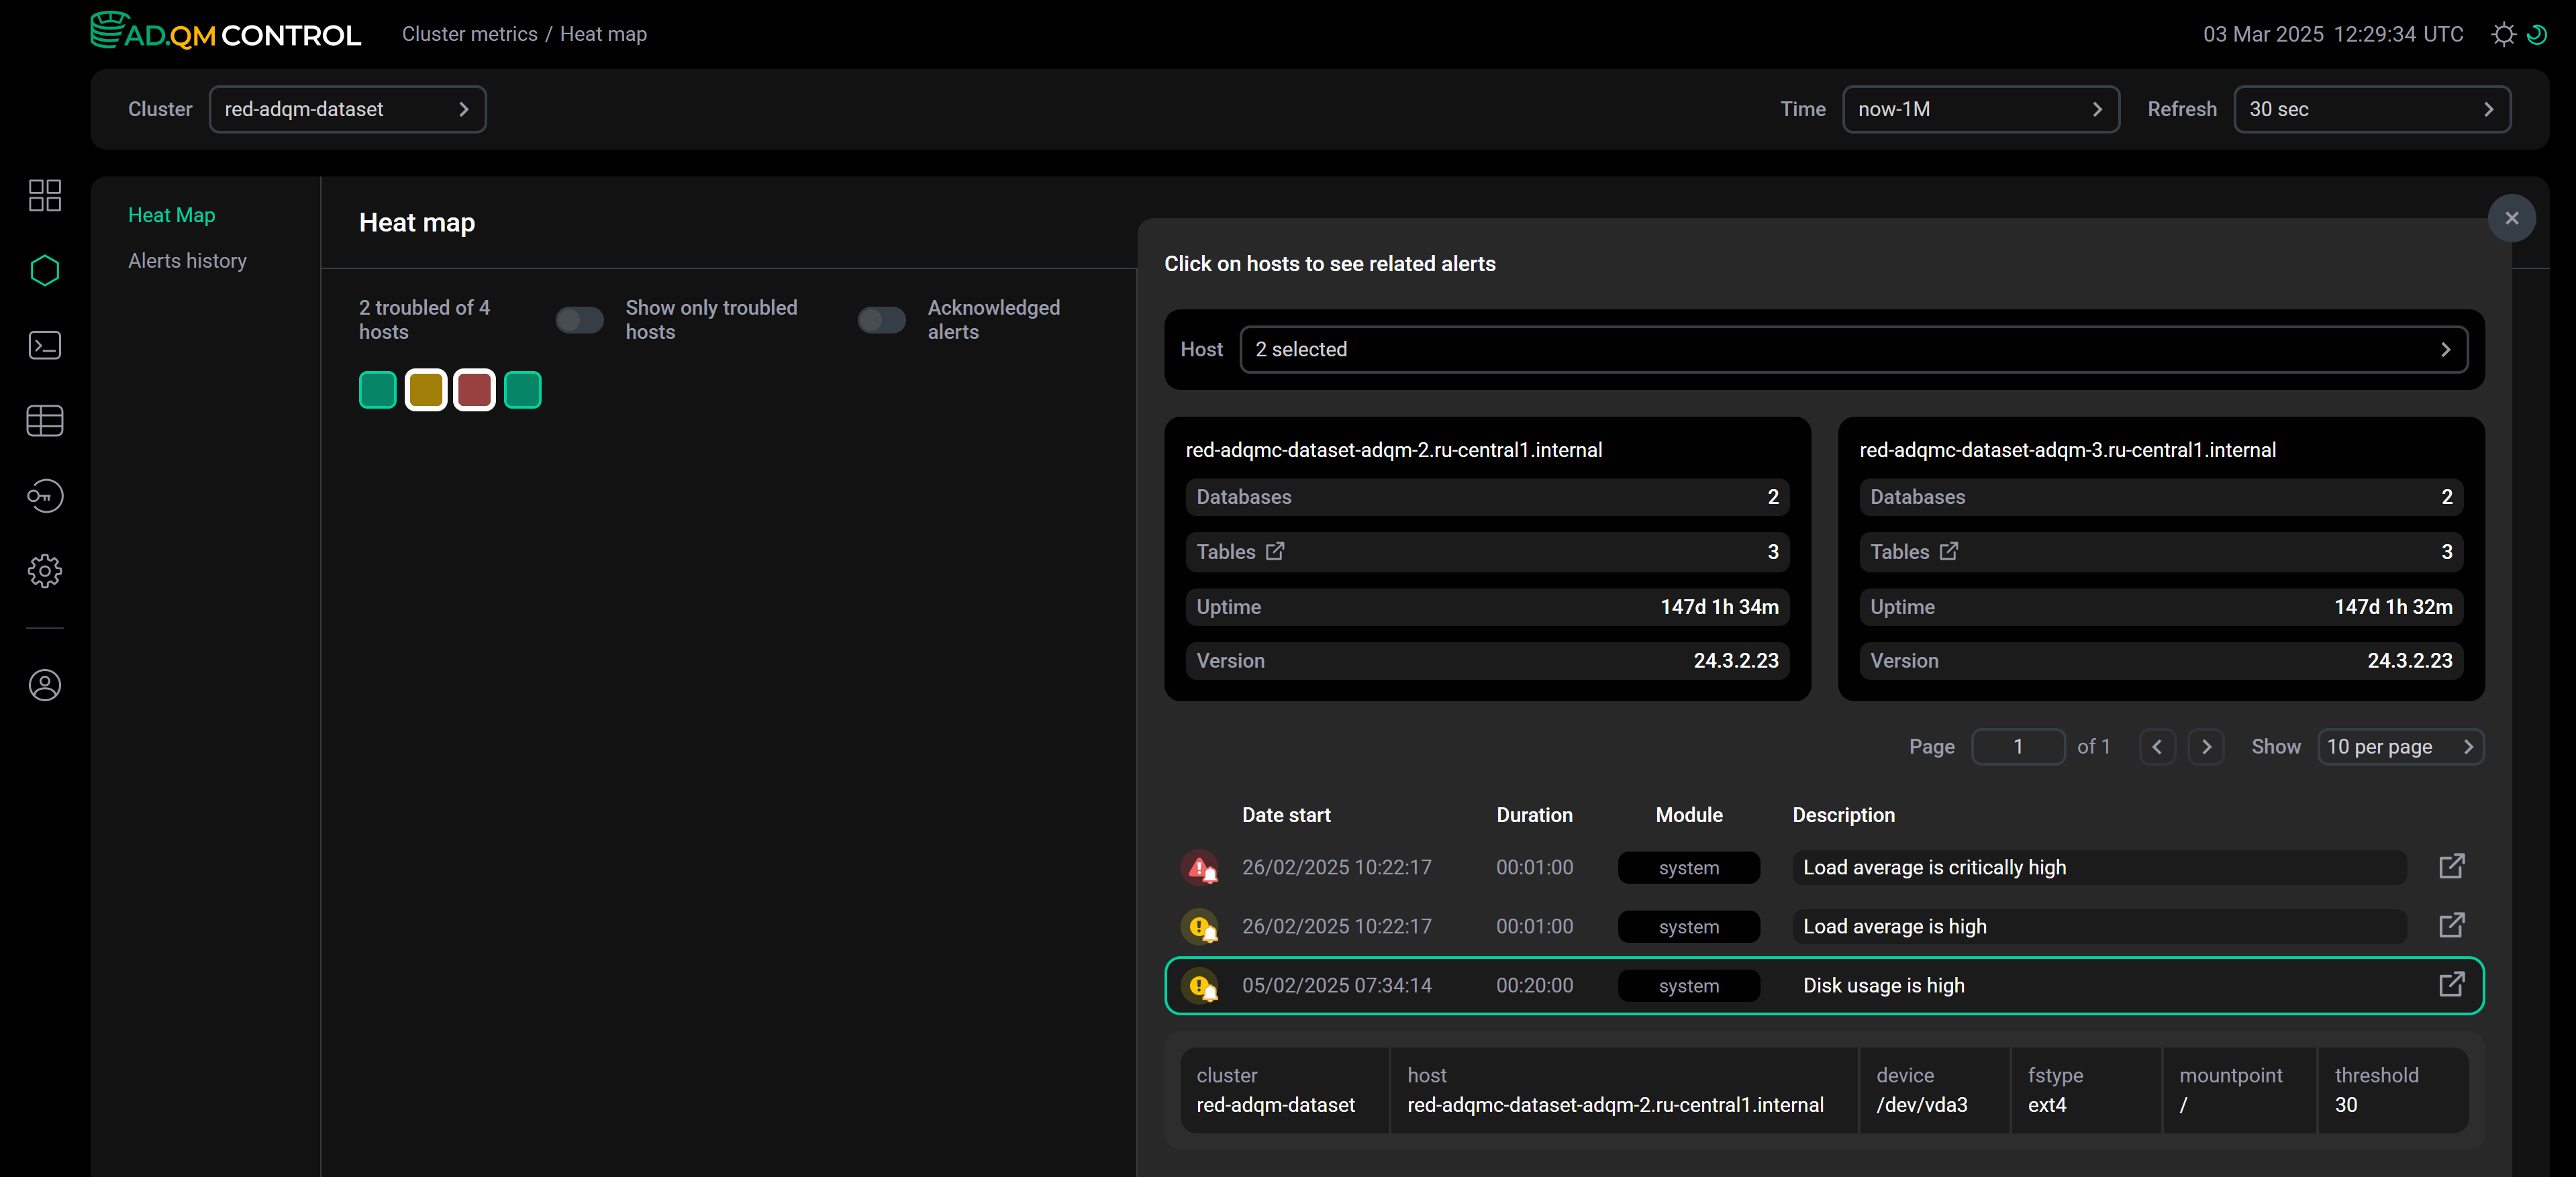
From Heat map on the Dashboard page, you can go to the Heat map tab on the Cluster metrics page. It also shows the heat map matrix for an ADQM cluster and additionally displays general information about ClickHouse servers as well as a table with a list of all alerts (not just the latest ones) related to the selected hosts on the right. You can get here more information about a specific alert by clicking the corresponding row in the table — alert details will appear below the row.
To go to the Cluster metrics → Heat map page, do one of the following in Heat map of the Dashboard page:
-
Click Details in the pop-up window that appears when you hover the mouse over the selected (by clicking) host.
-
Click Full view in the top right corner of Heat map.
A set of selected hosts and the Acknowledged alerts setting are synchronized between the Dashboard and Cluster metrics pages — changing these settings on one page automatically updates the same settings on the other page.
Top 10 tables
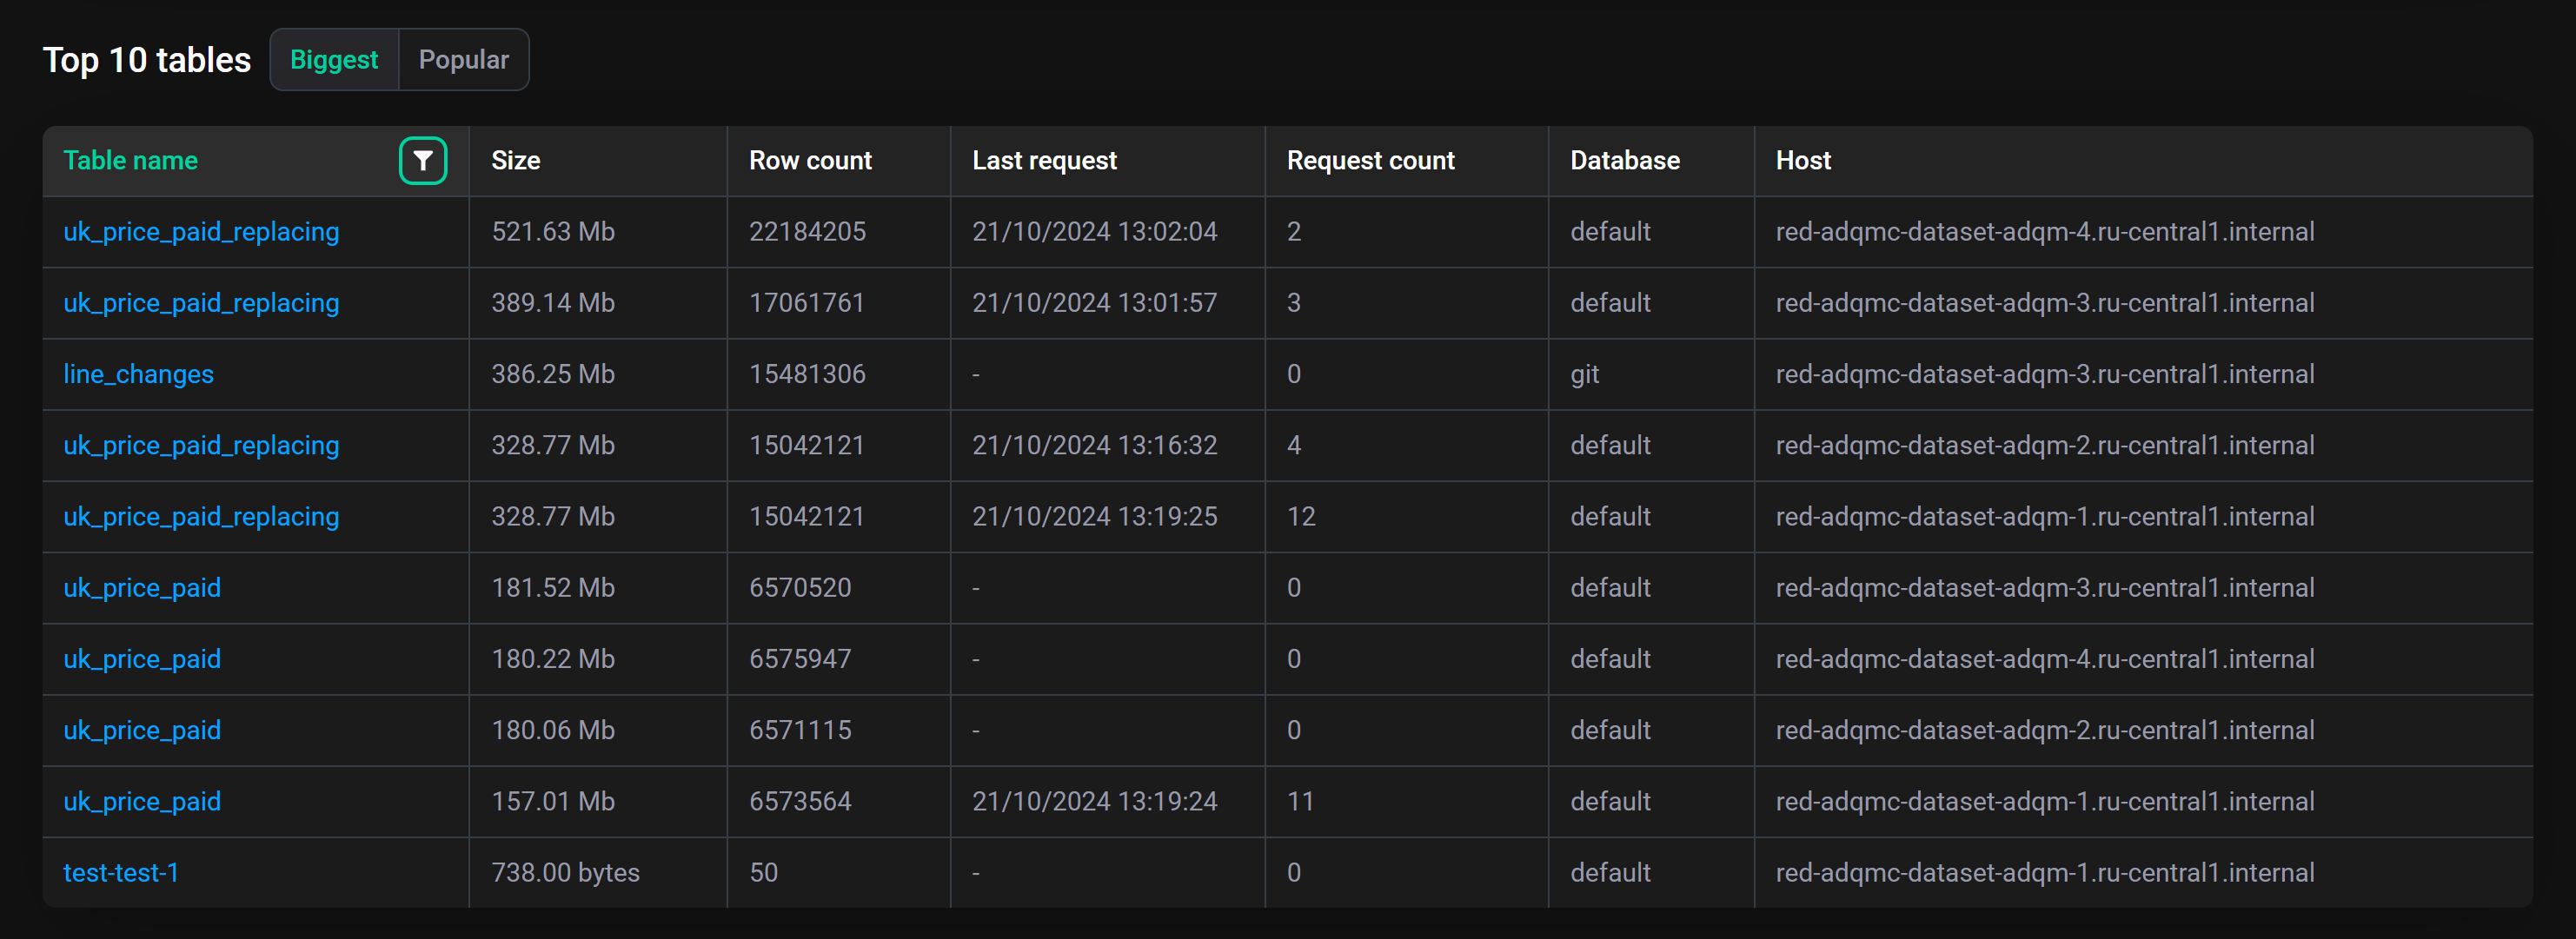
The Top 10 tables section contains two tabs with information about data tables in an ADQM cluster for a specified time interval:
-
Biggest — 10 largest tables by the amount of data they store (sorted in descending order by Size — size of compressed data in a table at the end of the selected time interval).
-
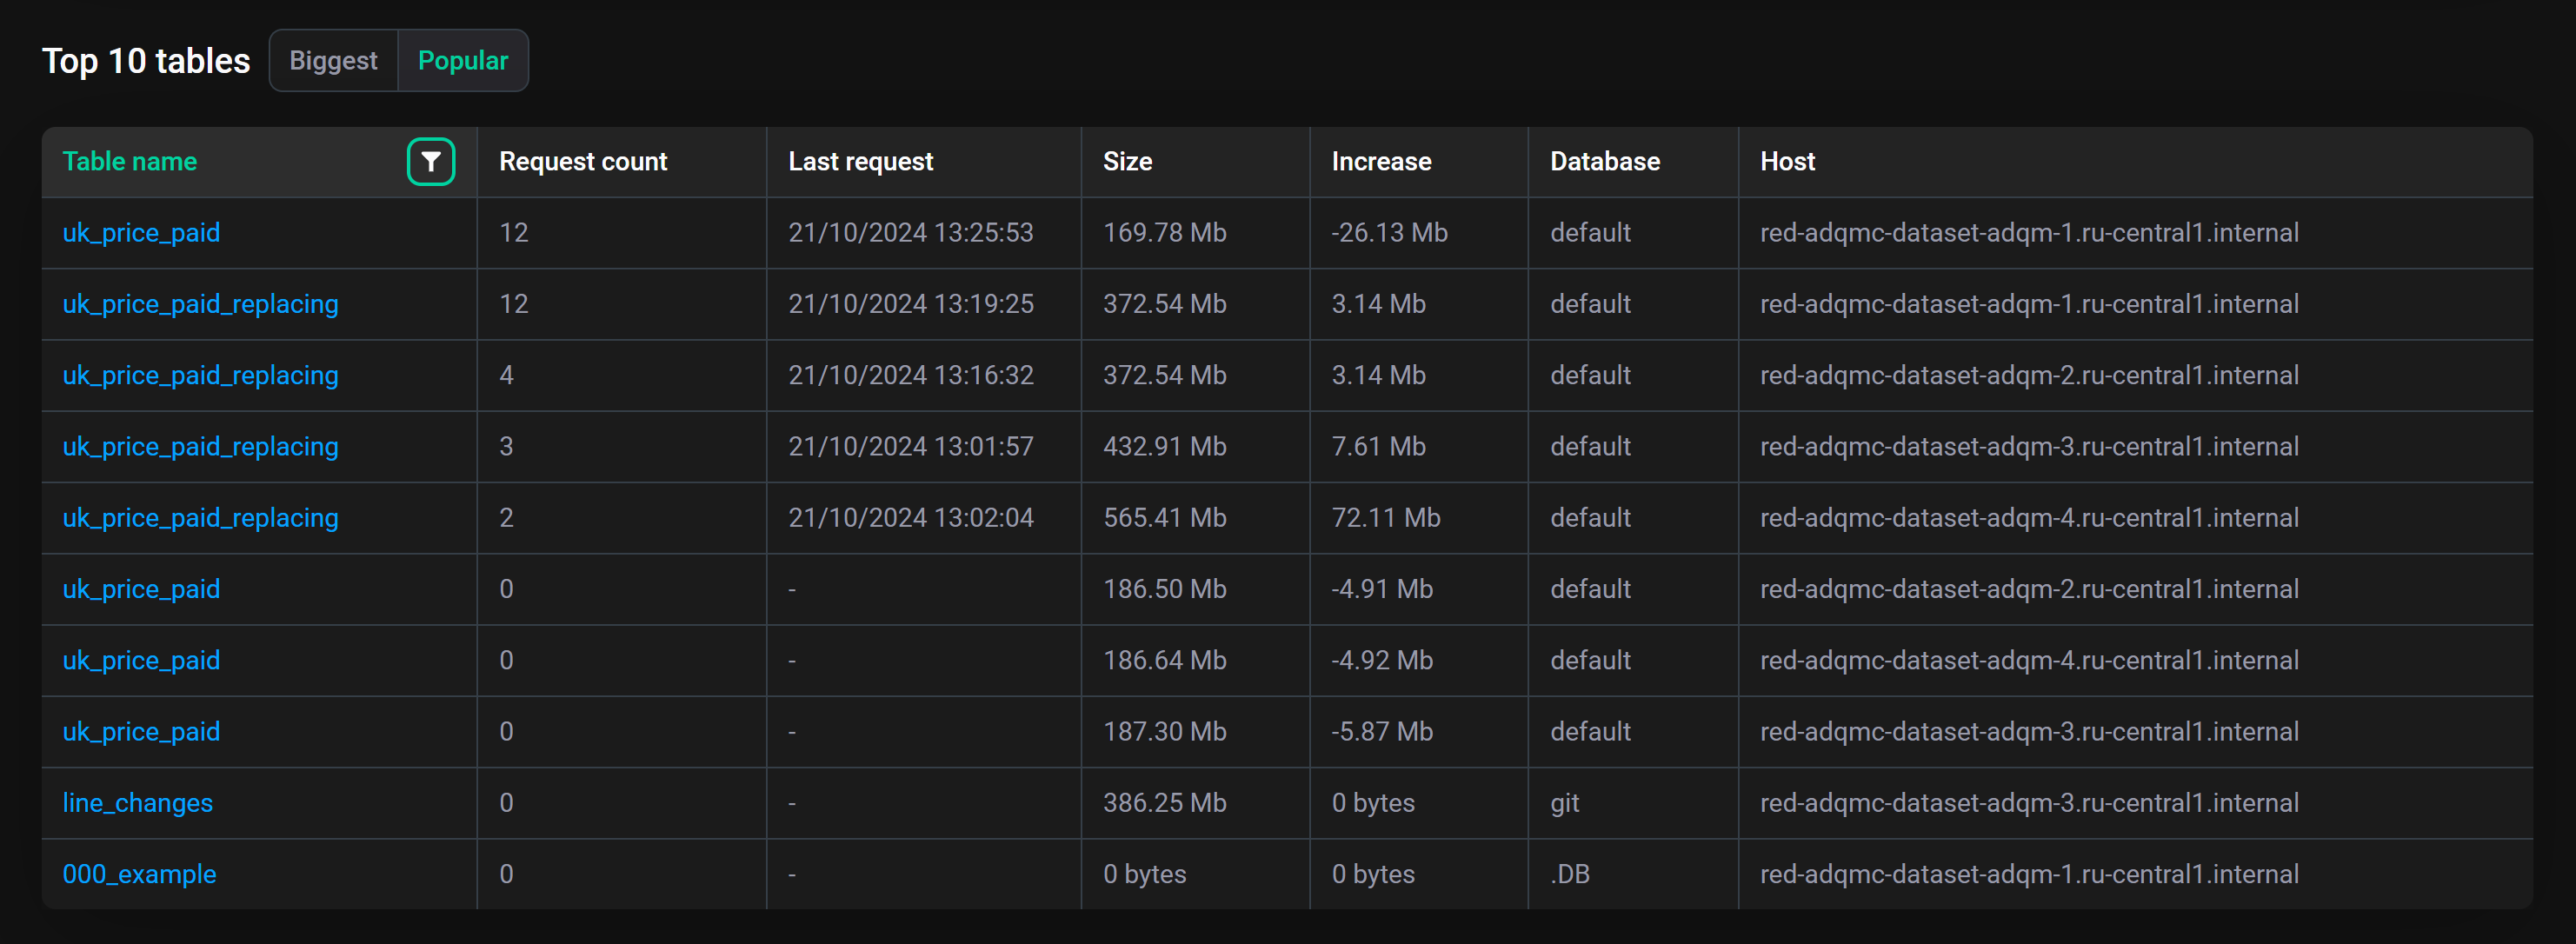
Popular — 10 tables to which the most queries were sent (sorted in descending order by Request count — number of queries sent to a table during the selected time interval).
Options located at the top right allow you to select how ADQM Control should calculate metrics for ADQM tables when generating the Top 10 tables list:
-
Separated — each table located on a separate ADQM cluster host is accounted for separately;
-
Aggregated — metrics are calculated for data tables grouped by name, database name, and engine (in other words, a table whose data is stored on multiple hosts of an ADQM cluster is considered a single aggregated table).
Depending on the selected option, Separated or Aggregated, the following information on ADQM data tables (in addition to Size and Request count) is provided in this section:
-
Table name — table name (click on a table name opens a page with detailed information on table columns);
-
Row count (on the Biggest tab) — number of data rows in a table at the end of the selected time interval;
-
Exist — table lifetime (since the ADQM cluster was connected to ADQM Control for monitoring);
-
Last request — time the last query to a table was run during the selected time interval;
-
Increase (on the Popular tab) — change in a table size over the selected time interval (a negative value means a decrease in the amount of data in the table);
-
Database — database to which a table belongs;
-
Host — host where a table is located (the icon
opens the ADQM Notebook interface or the built-in ClickHouse web interface for this host depending on the ADQM version — ADQM Notebook is supported starting with 25.8.16.34).
-
Table name — table name (click on an aggregated table name opens a page with a list of tables in the group, from which you can go to detailed information on columns of a table located on a specific host);
-
Row count (on the Biggest tab) — total number of data rows in a table across all hosts at the end of the selected time interval;
-
Exist — table lifetime (since the ADQM cluster was connected to ADQM Control for monitoring);
-
Last request — time the last query to a table was run during the selected time interval;
-
Increase (on the Popular tab) — change in the total size of a table over the selected time interval (a negative value means a decrease in the amount of data in the table);
-
Database — database to which a table belongs;
-
Hosts — number of hosts on which a table is located;
-
Size imbalance (on the Biggest tab) — imbalance in distribution of table data between hosts by data size;
-
Requests imbalance (on the Popular tab) — imbalance in distribution of queries sent to a table on different hosts.
In the header of the Table name field, there is the icon ![]()
![]() , which when clicked allows you to view or change the filter that determines from which ADQM tables the largest or most popular tables are selected. The following predefined filters are available:
, which when clicked allows you to view or change the filter that determines from which ADQM tables the largest or most popular tables are selected. The following predefined filters are available:
-
Existing (default) — top 10 tables are selected from those that exist in the cluster at the end of the specified time interval (tables are considered existing if ADQM Control continues to receive their metrics at the end of the time interval). To calculate values of aggregated table metrics, only data from tables that exist in the group at the end of the selected time interval is taken into account.
-
Historical — top 10 tables are selected from all tables that existed in the cluster during the specified time interval (including tables that were deleted). Values of aggregated table metrics are calculated based on data from all tables that existed in the group during the selected time interval.
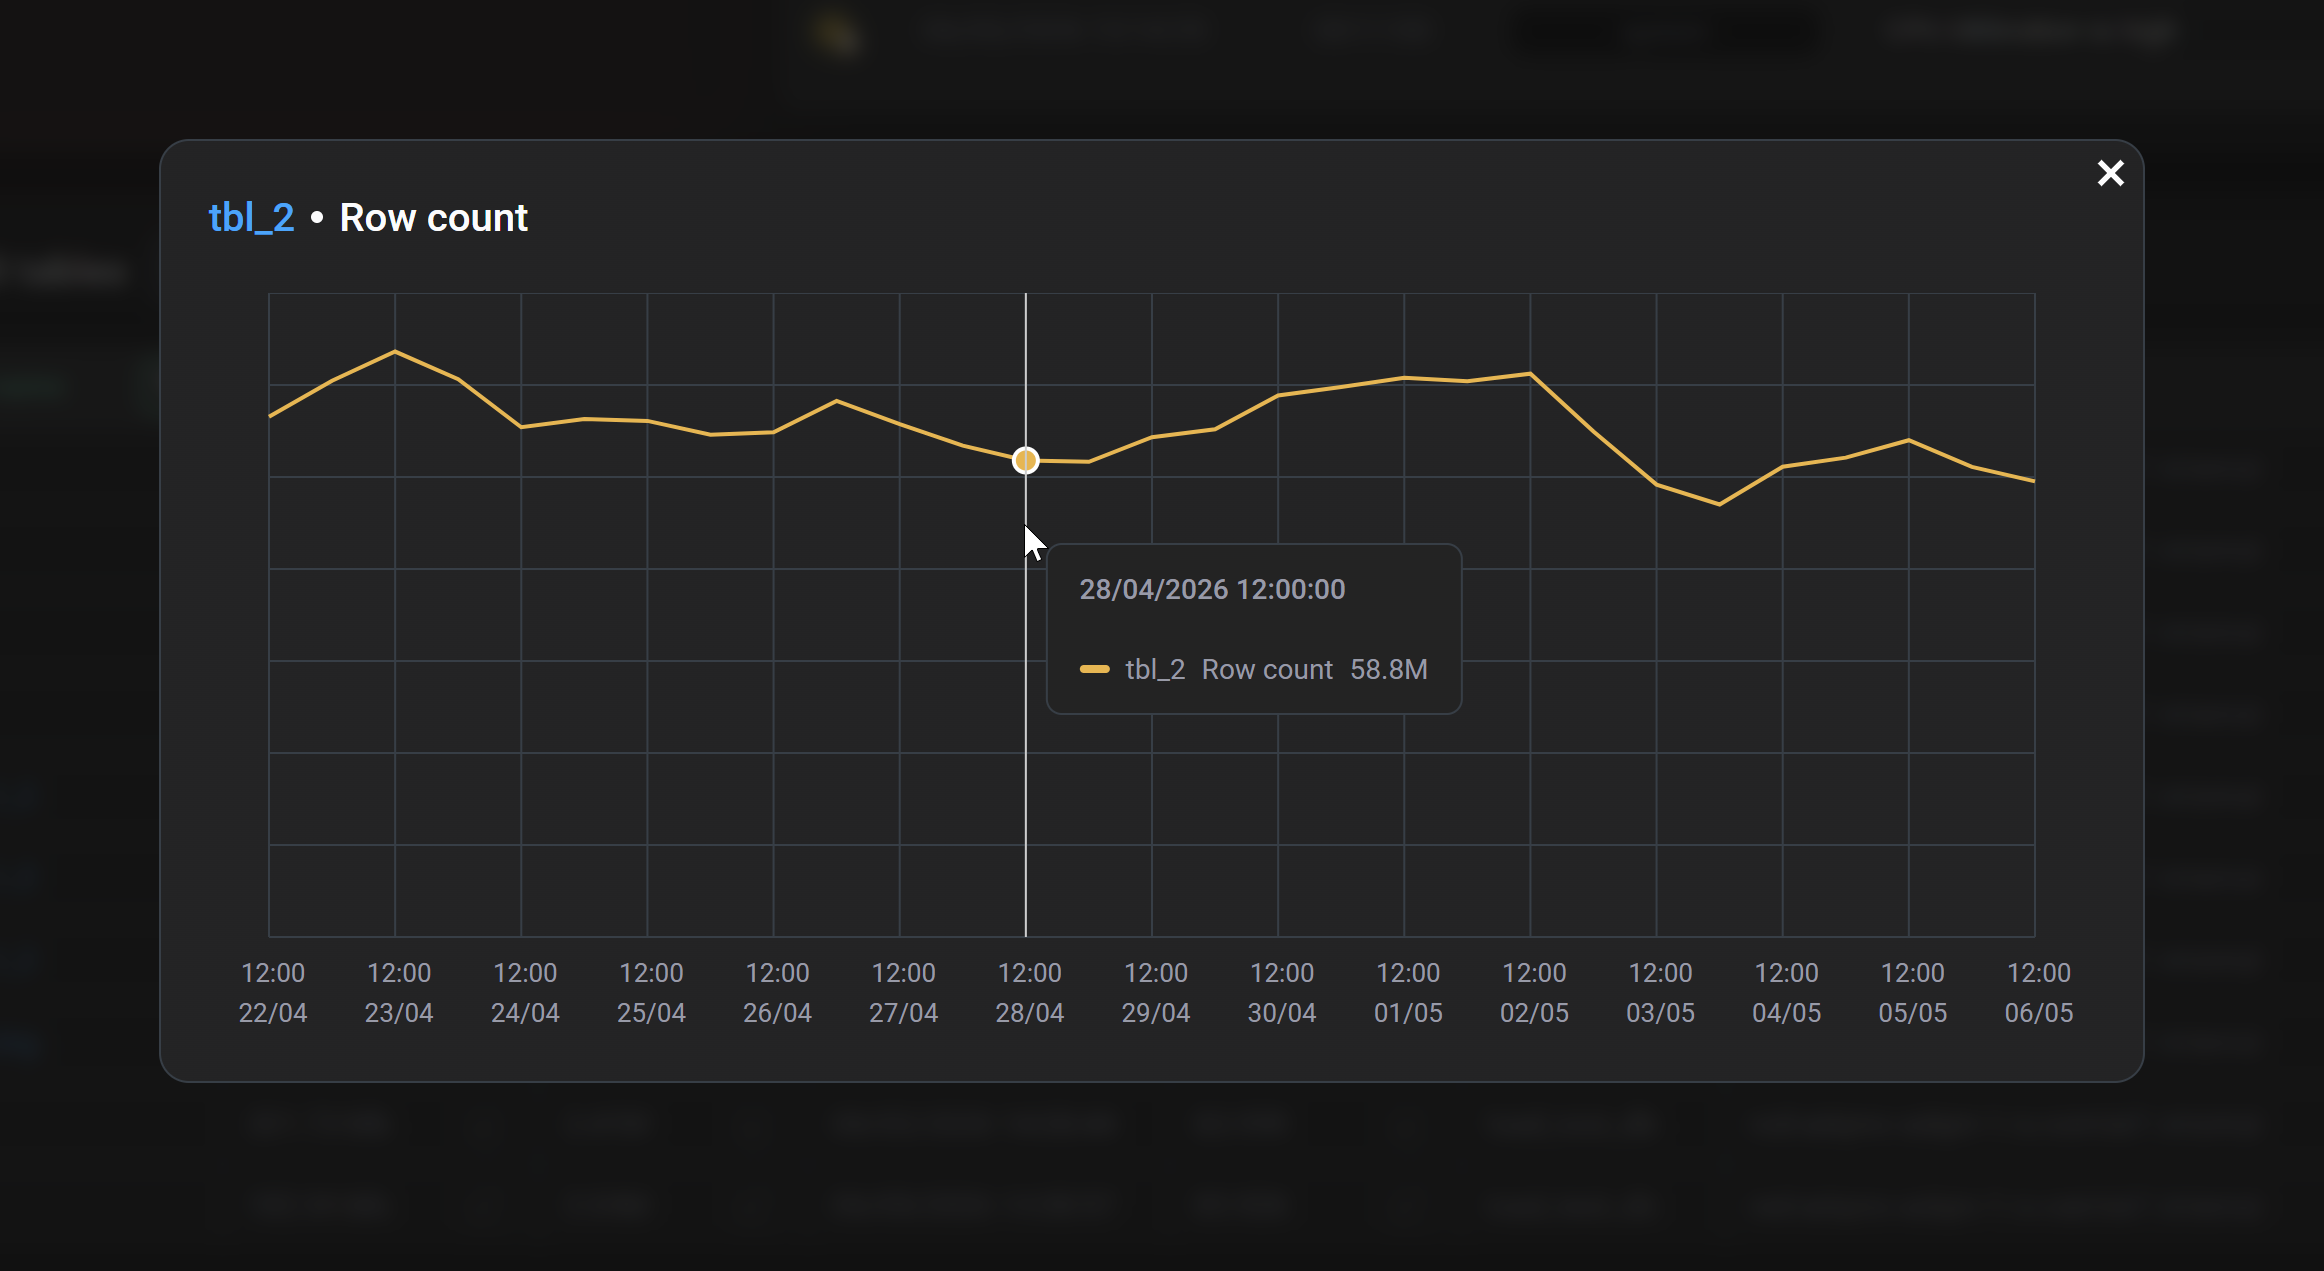
In each row of the Size, Row count, Request count, Size imbalance, and Requests imbalance columns, there is the icon ![]()
![]() that opens a modal window with a graph of changes in the corresponding metric of an ADQM table. From this window, you can go to the page with detailed information about a table — to do this, click a table name in the top left corner of the window.
that opens a modal window with a graph of changes in the corresponding metric of an ADQM table. From this window, you can go to the page with detailed information about a table — to do this, click a table name in the top left corner of the window.
|
NOTE
To get information on all cluster tables for the specified time period, see the Tables page. |
Top 10 queries
The Top 10 queries section contains two tabs with information about queries sent to ADQM cluster databases during a specified time interval:
-
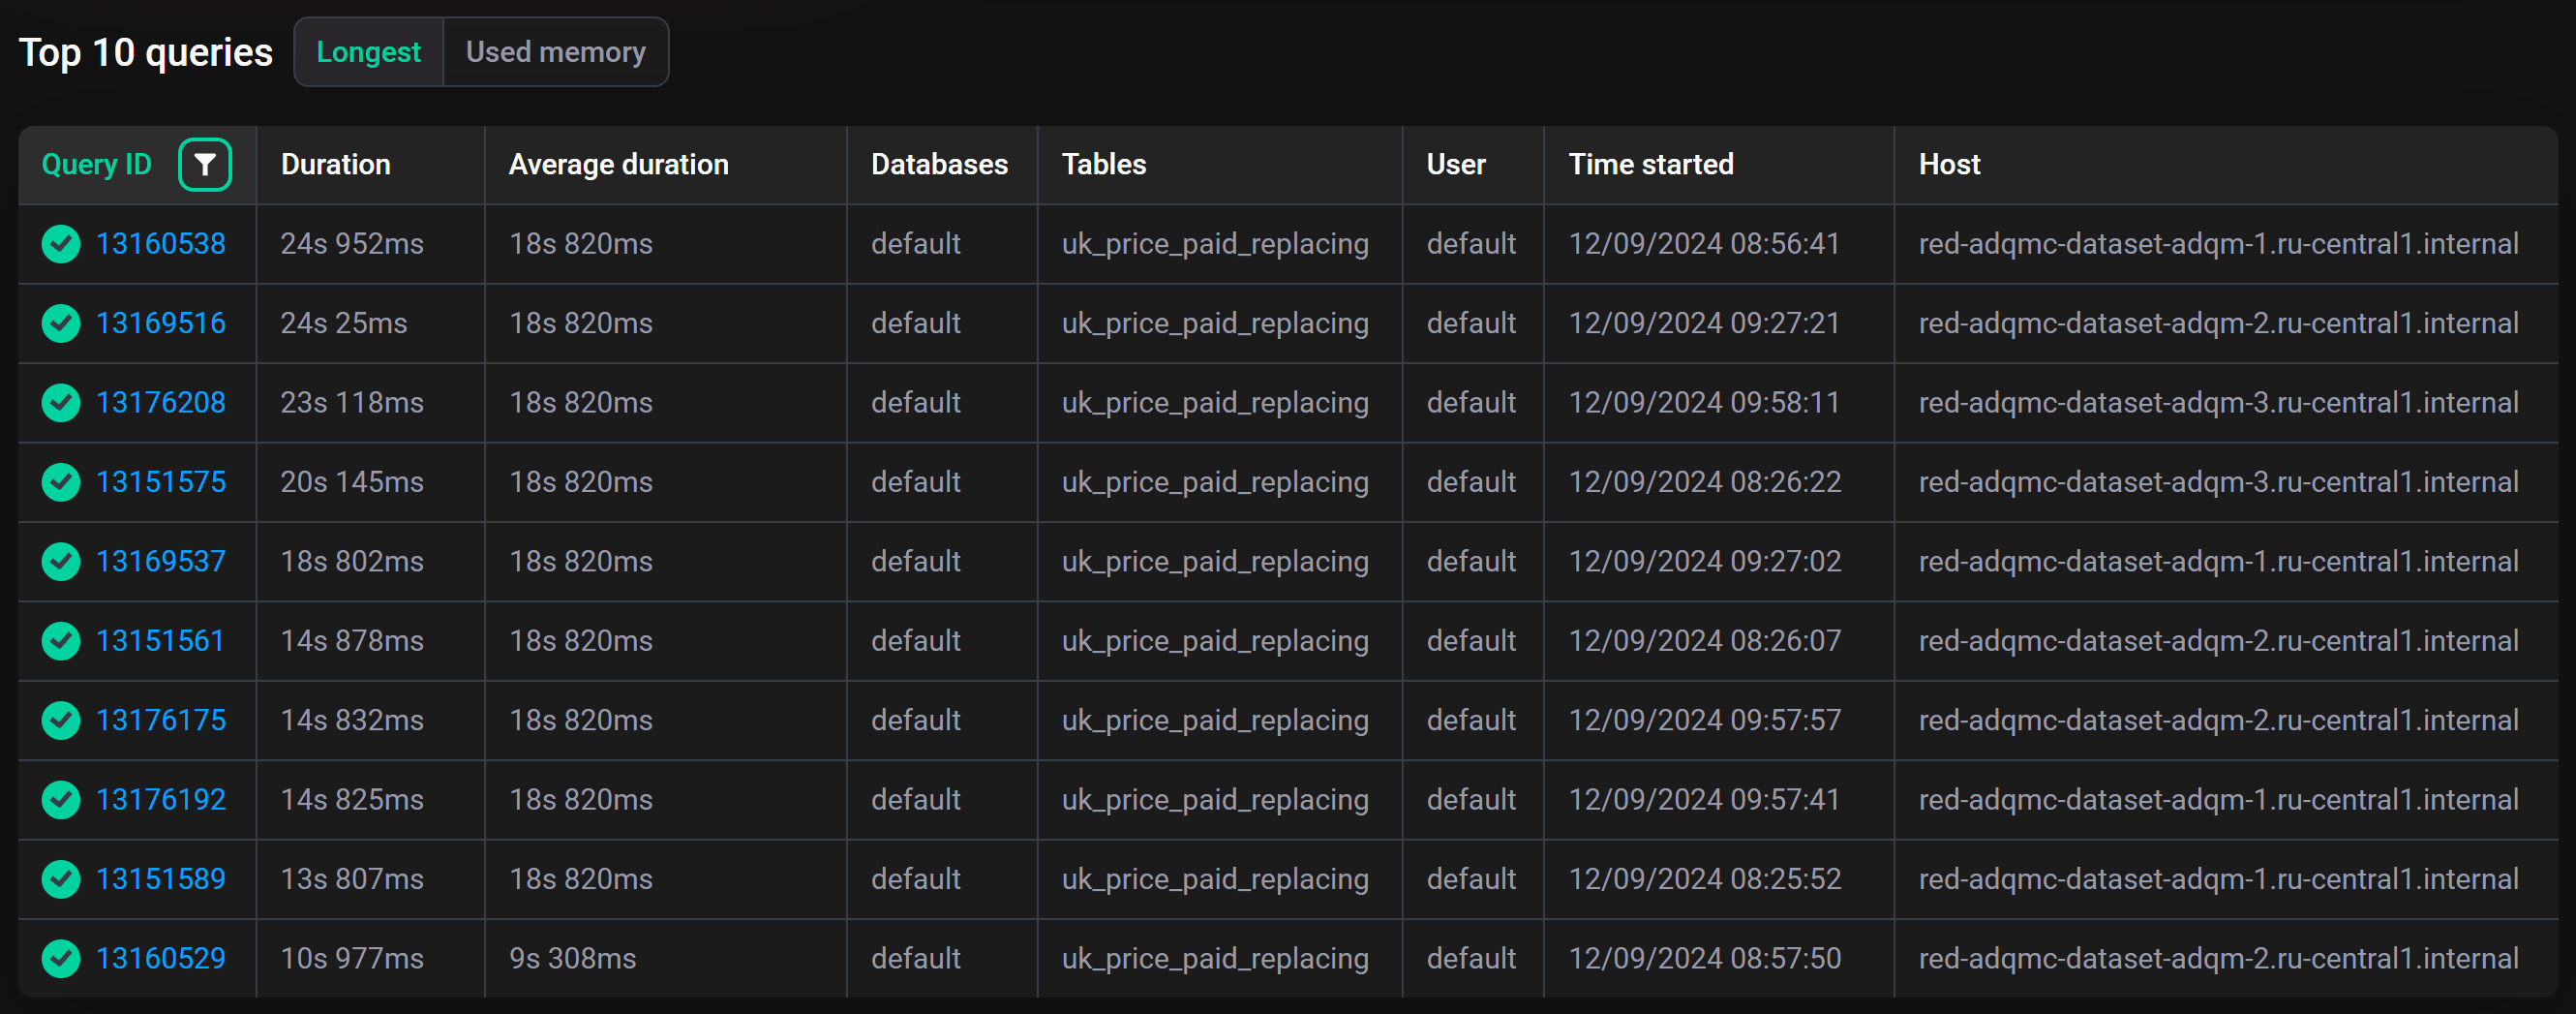
Longest — top 10 successfully completed queries that took the longest time to process (sorted in descending order by Duration — duration of a query execution).
-
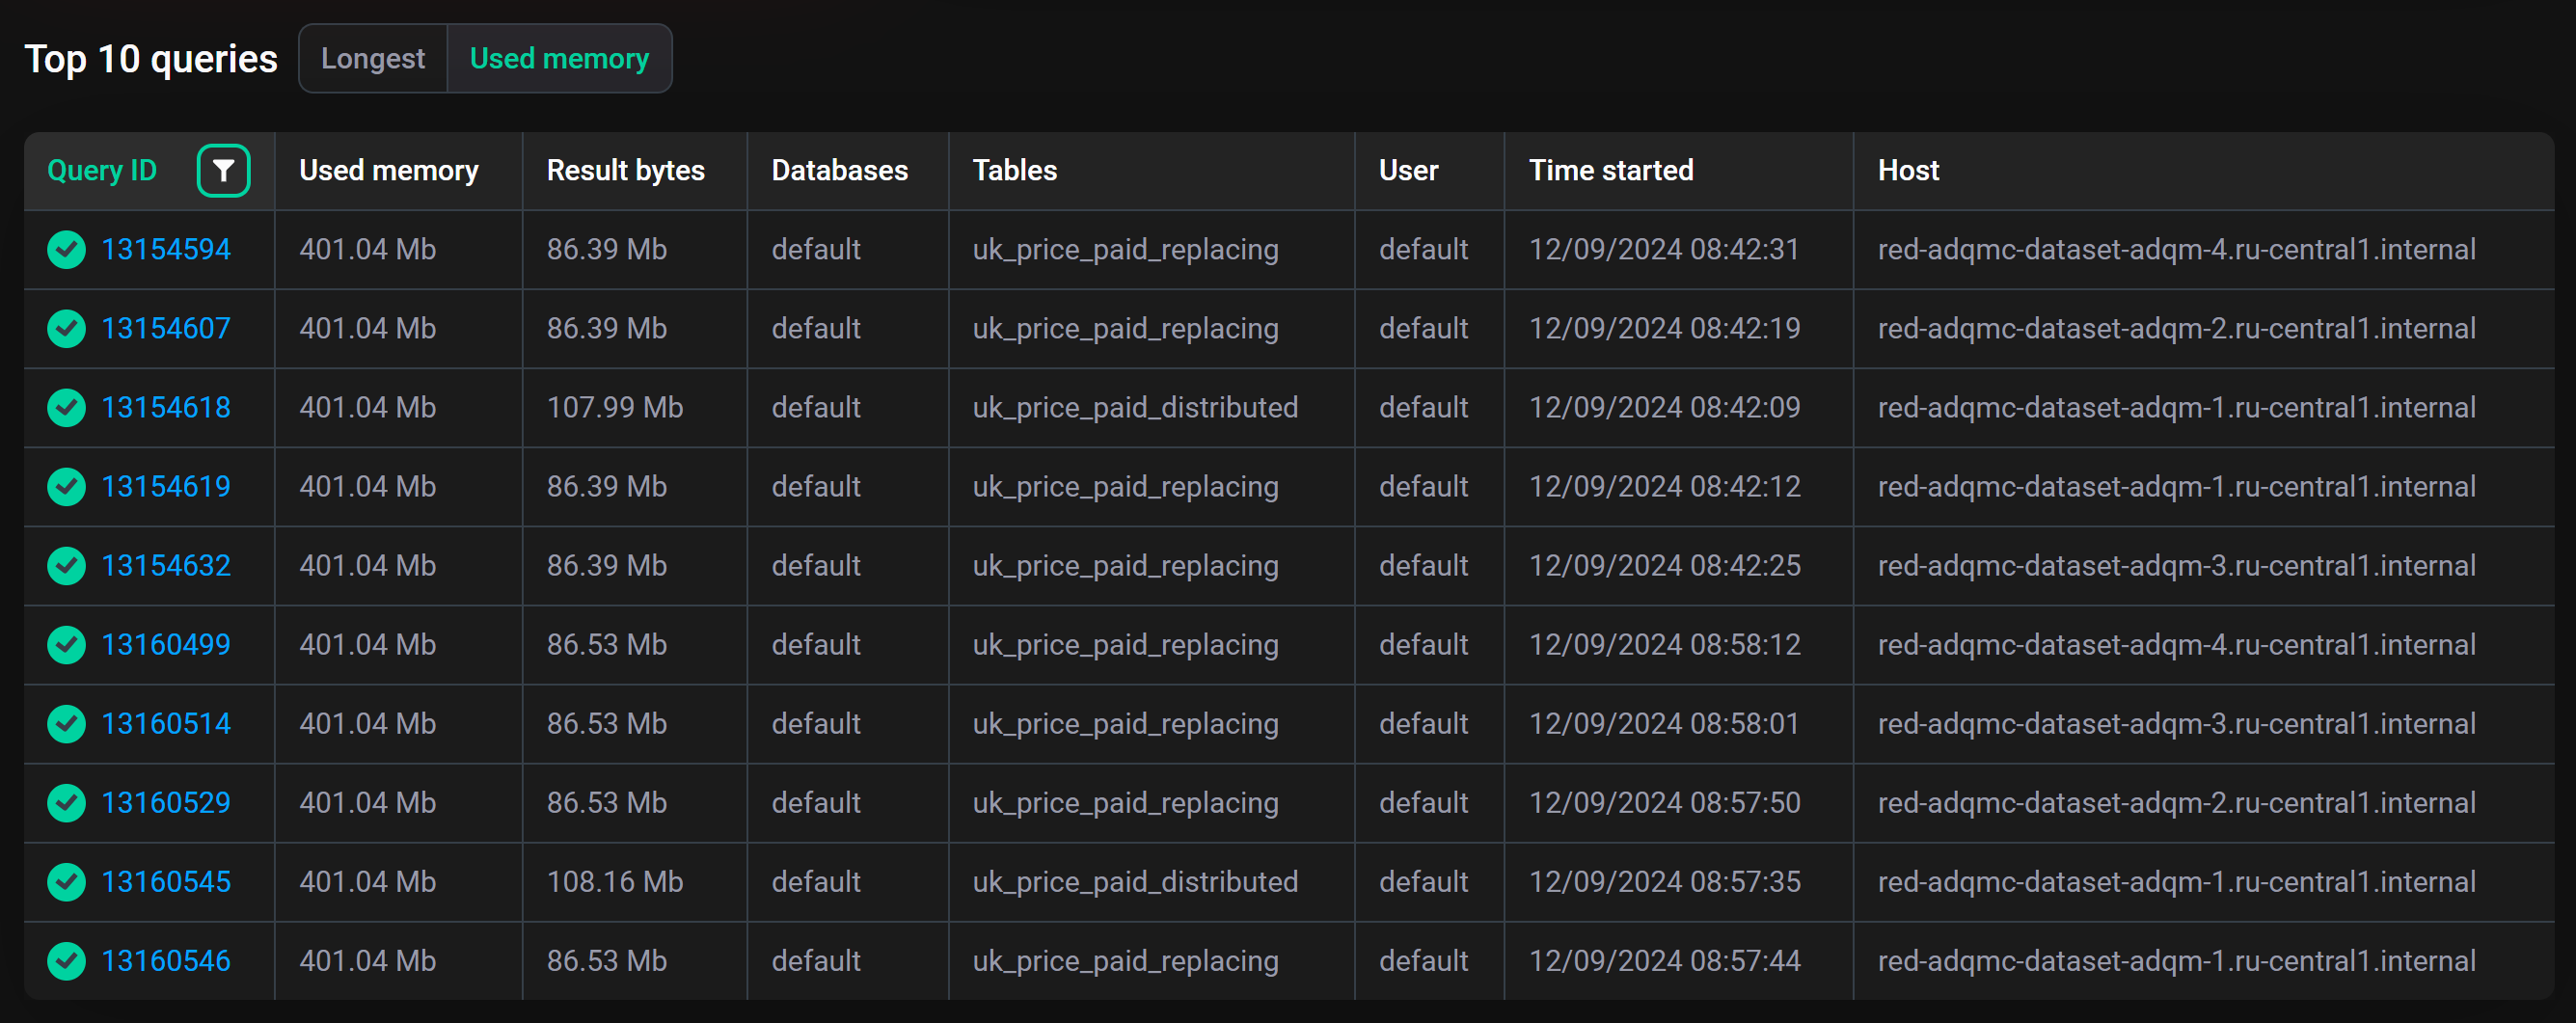
Used memory — top 10 queries that required the most memory (sorted in descending order by Used memory — amount of memory consumed by a query).
For each query, the following information is also provided:
-
Query ID — the query identifier (click on an identifier opens the Query details page where you can view the query text);
-
Average duration (on the Longest tab) — average query execution time (statistics are calculated for queries whose text completely matches, i.e. for parameterized queries, specific parameter values are taken into account);
-
Result bytes (on the Used memory tab) — amount of memory to store the query result;
-
Databases — names of databases to which the query is sent;
-
Tables — names of tables to which the query is sent;
-
User — name of an ADQM user who initiated the query execution;
-
Time started — the query execution start time;
-
Host — host where the query was run.
In the header of the Query ID field, there is the icon ![]()
![]() , by clicking on which, you can view or change the filter that determines from which queries the longest or most memory-intensive ones are selected. The following predefined filters are available:
, by clicking on which, you can view or change the filter that determines from which queries the longest or most memory-intensive ones are selected. The following predefined filters are available:
-
Completed (on the Longest tab) — top 10 longest queries are selected from all the completed queries (i.e. from all queries except active ones);
-
All (on the Used memory tab) — top 10 most memory-intensive queries are selected from all queries;
-
Successful (default filter) — top 10 queries are selected from those that were completed successfully.
|
NOTE
To view the full history of queries for the required period of time, switch to the Queries page. |