

ADQM Control monitoring metrics
The Monitoring service installed in an ADQM Control cluster collects two groups of metrics: system metrics from hosts and ADQM Control service metrics.
You can view metrics in your browser in the Prometheus format (ports and endpoints for access to metrics are described below), as well as use the Prometheus and Grafana web interfaces.
System metrics
System metrics indicate general characteristics of cluster hosts, usually related to resource consumption: for example, CPU utilization, disk capacity, memory usage, I/O performance, and other parameters.
To view system metrics of ADQM Control hosts in the Prometheus format, enter in the address bar of your browser: http://<adqmc_host_ip>:11203/metrics, where 11203 and /metrics are a port number and endpoint to listen for system metrics, which are set up in the Node Exporter settings section of the Monitoring service configuration.
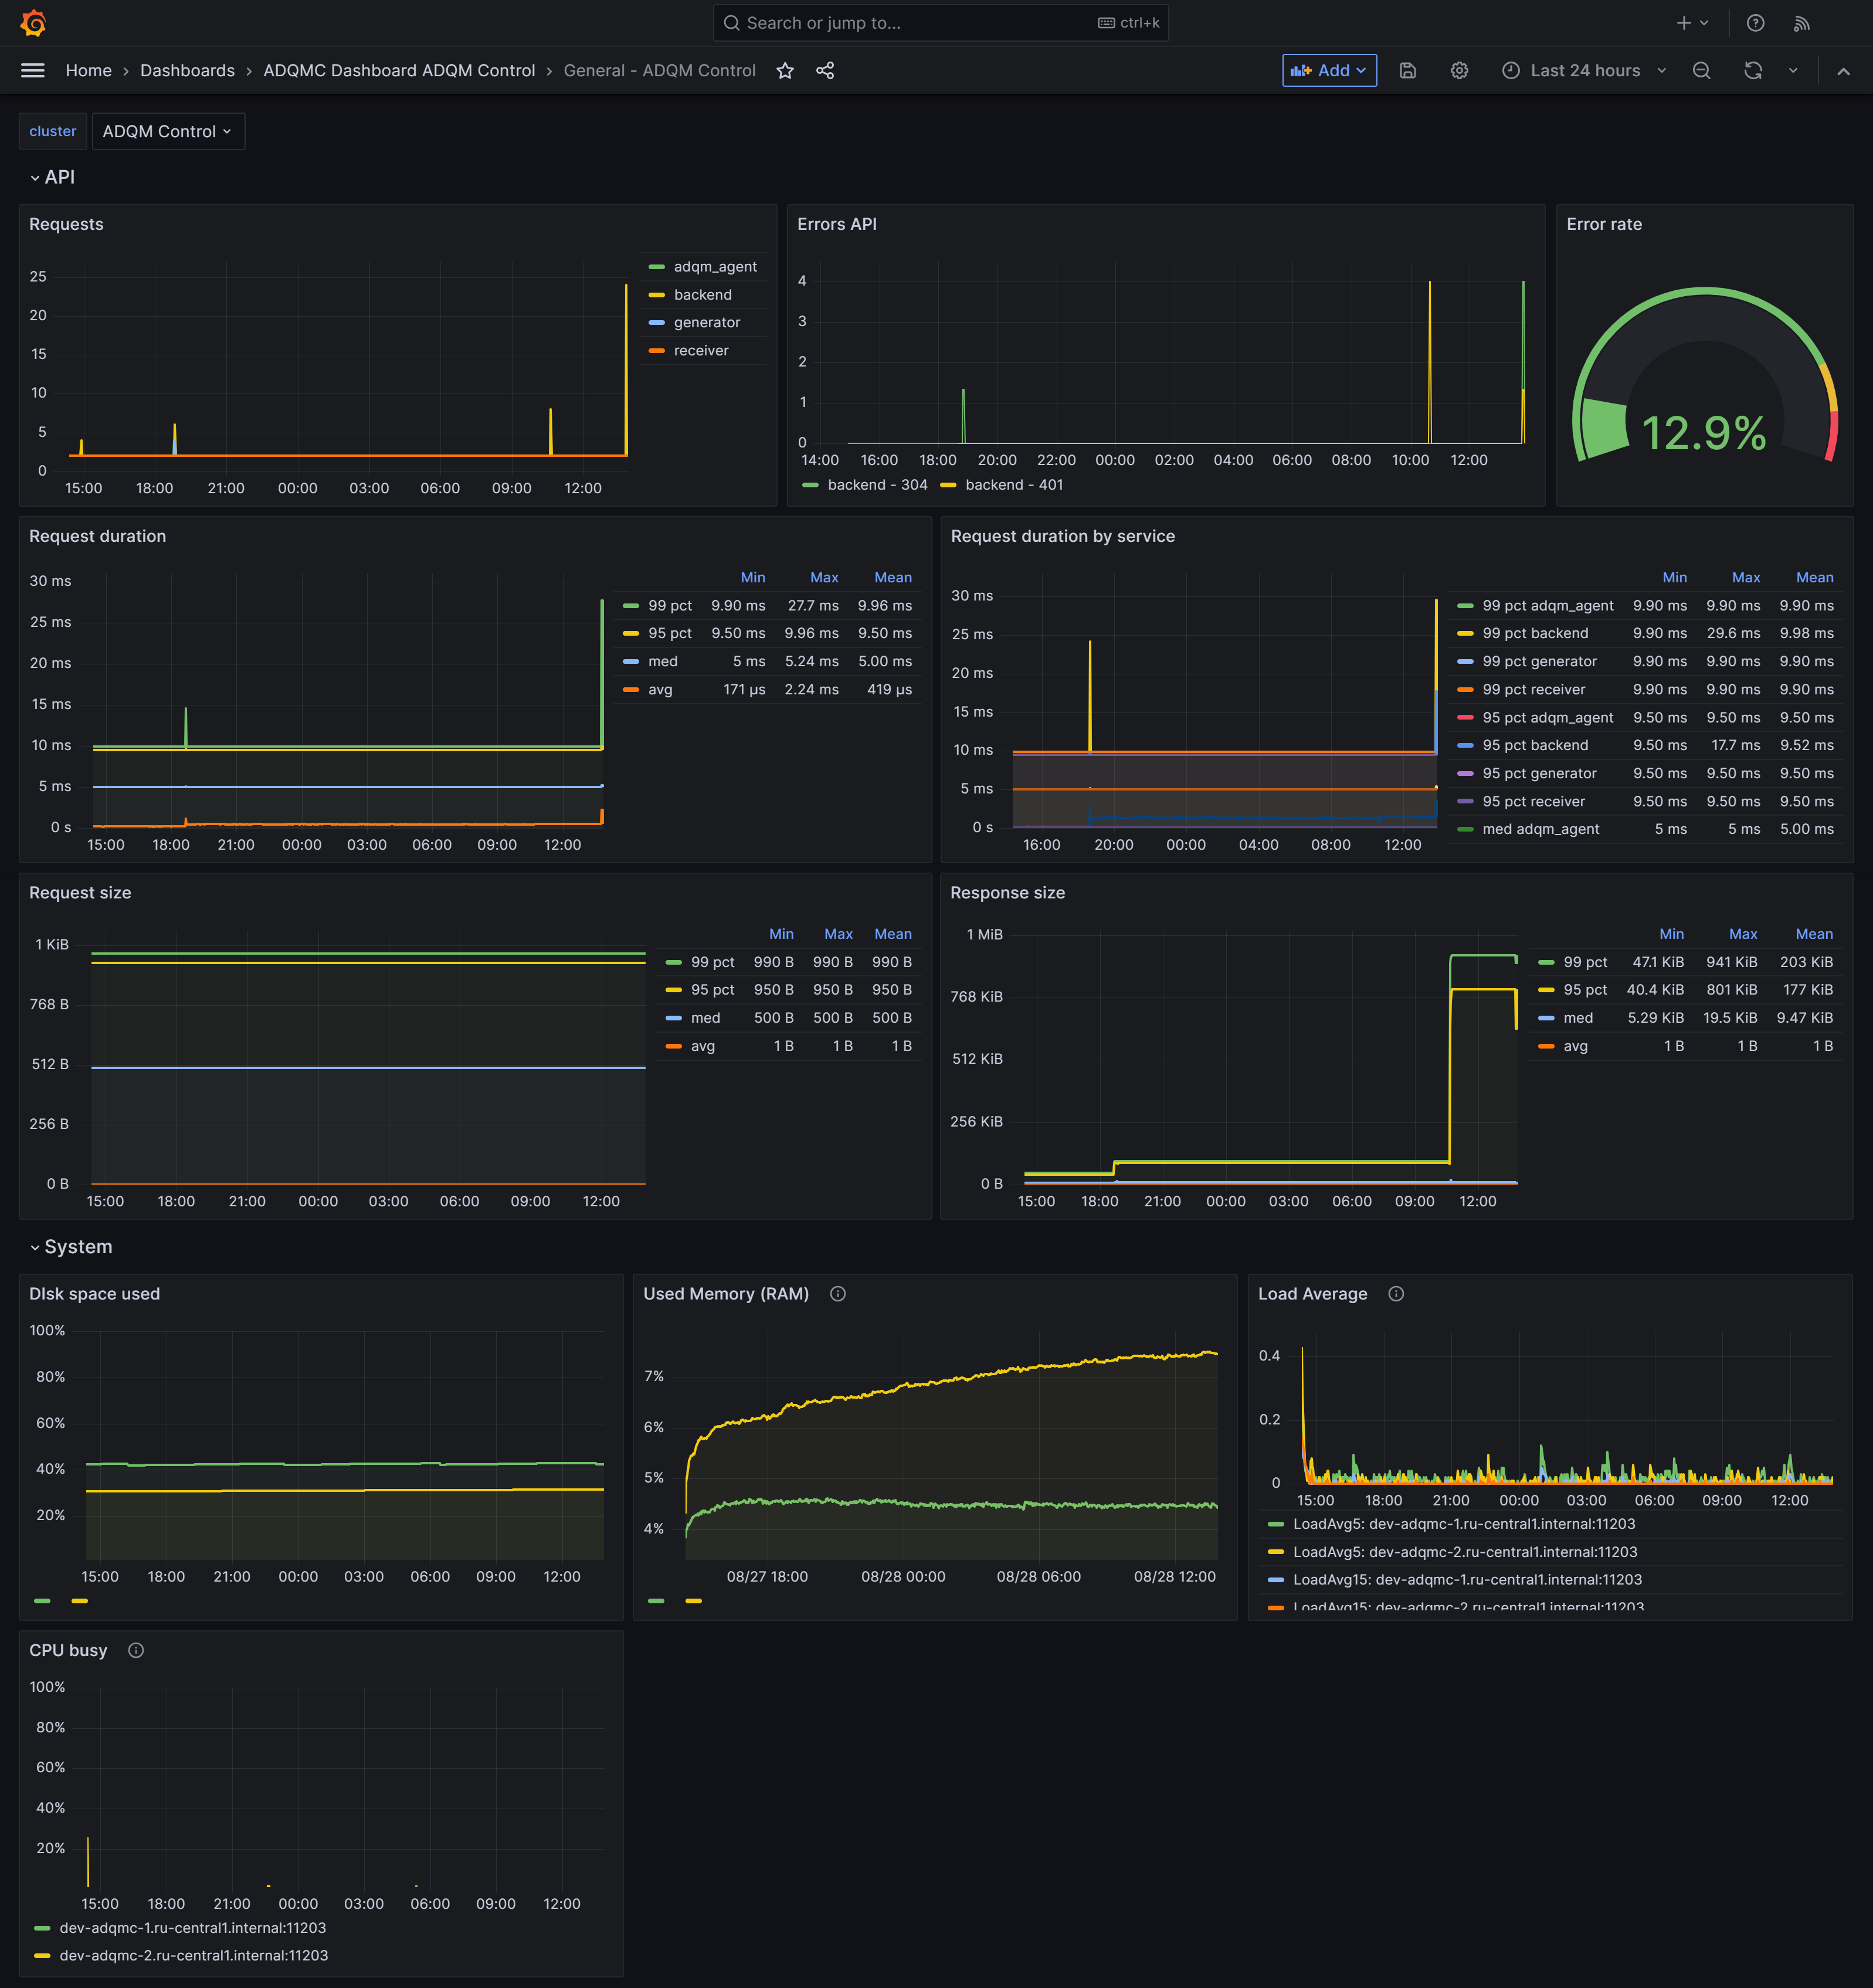
In the Grafana interface, system metrics for ADQM Control hosts are displayed in the System dashboard and in the System row of the General dashboard.
The General dashboard also contains the Database section with the Postgres requests duration and Postgres requests duration per service graphs based on the postgres_client_duration_seconds_bucket metric — duration of queries to the PostgreSQL database.
ADQM Control service metrics
ADQM Control service metrics allow you to monitor and analyze various parameters of ADQM Control operation and performance: for example, availability of service components, types and frequency of errors, response time for user requests, frequency of alert generation and alert types, and other metrics.
Use the addresses listed in the table below to explore monitoring metrics of the ADQM Control service components in the Prometheus format. Provided addresses contain default ports for accessing metrics of service components. You can change these ports in the Network configuration section of the ADQM Control service configuration.
| ADQM Control service component | Address to access component metrics |
|---|---|
Agents |
http://<host_ip>:5002/api/v1/metrics |
Alert Generator |
http://<host_ip>:5001/api/v1/metrics |
Alert Receiver |
http://<host_ip>:12322/api/v1/metrics |
Alertmanager |
http://<host_ip>:9093/metrics |
Backend |
http://<host_ip>:5555/api/v1/metrics |
The tables below describe the ADQM Control service metrics, grouped as they are presented on dashboards in the Grafana interface.
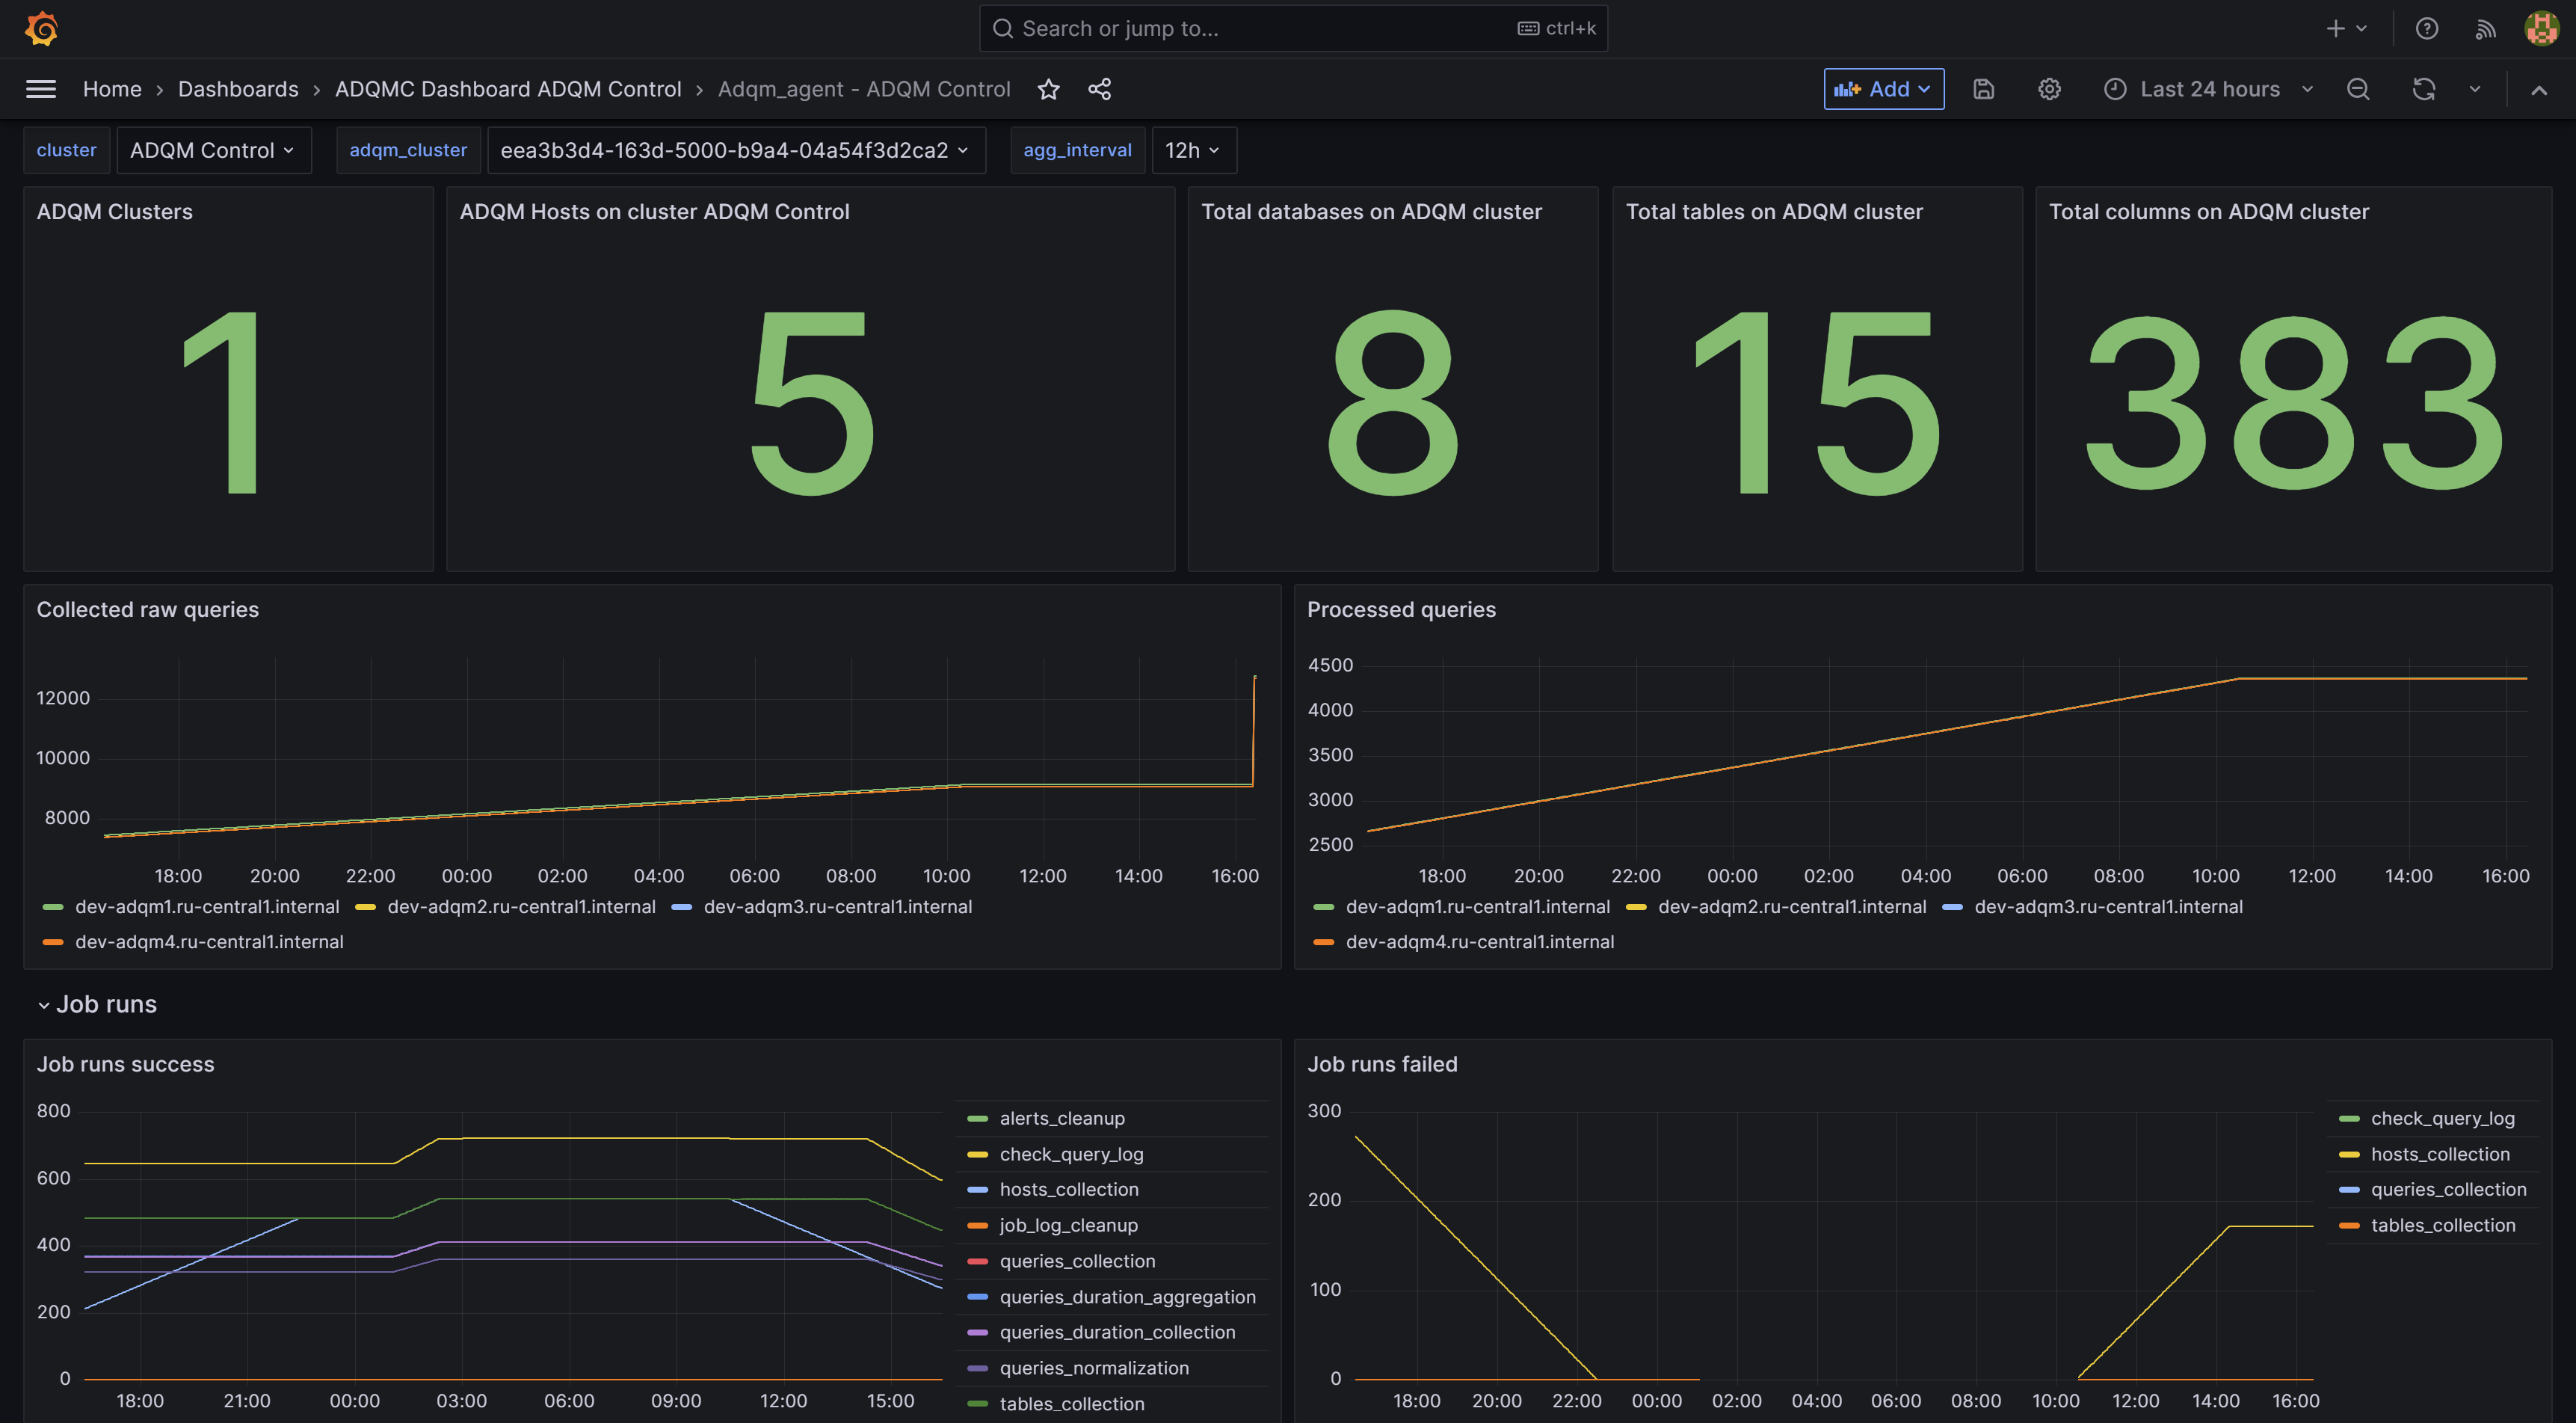
Metrics of the Agents component show which information about ADQM clusters is collected and stored by ADQM Control.
| Metric name | Description |
|---|---|
adqm_agent_hosts |
Number of ADQM cluster hosts |
adqm_agent_databases |
Number of ADQM databases |
adqm_agent_tables |
Number of ADQM tables |
adqm_agent_columns |
Number of columns in ADQM tables |
adqm_agent_queries |
Number of queries run in ADQM |
adqm_agent_queries_normalized |
Number of normalized (linked to tables) queries |
jobs_total |
Number of jobs performed by a service. Job statuses: Job types: |
adqm_agent_queries_unnormalizable |
Number of queries that cannot be normalized |
adqm_agent_queries_unnormalized |
Number of unnormalized queries |
adqm_agent_queries_queue_size |
Size of the current queue of queries for normalization |
adqm_agent_normalization_cache_hit_ratio |
Coefficient of hitting normalization tables in the cache |
adqmc_database_corruption |
Indicates issues with the consistency of the ADQM Control database (the Missing* panels at the bottom of the Adqm_agent dashboard) |
| Metric name | Description |
|---|---|
alertgenerator_alerts_lifetime_bucket |
Alert lifetime (the period between the time an alert is sent and the time the alert is no longer considered valid) |
alertgenerator_alerts_total |
Number of generated alerts |
alertgenerator_fired_alerts_total |
Number of alerts sent to Alert Manager |
alertreceiver_alerts_received_total |
Number of alerts received by Alert Receiver |
alertgenerator_alerts_resend_total |
Number of alerts resent to Alert Manager |
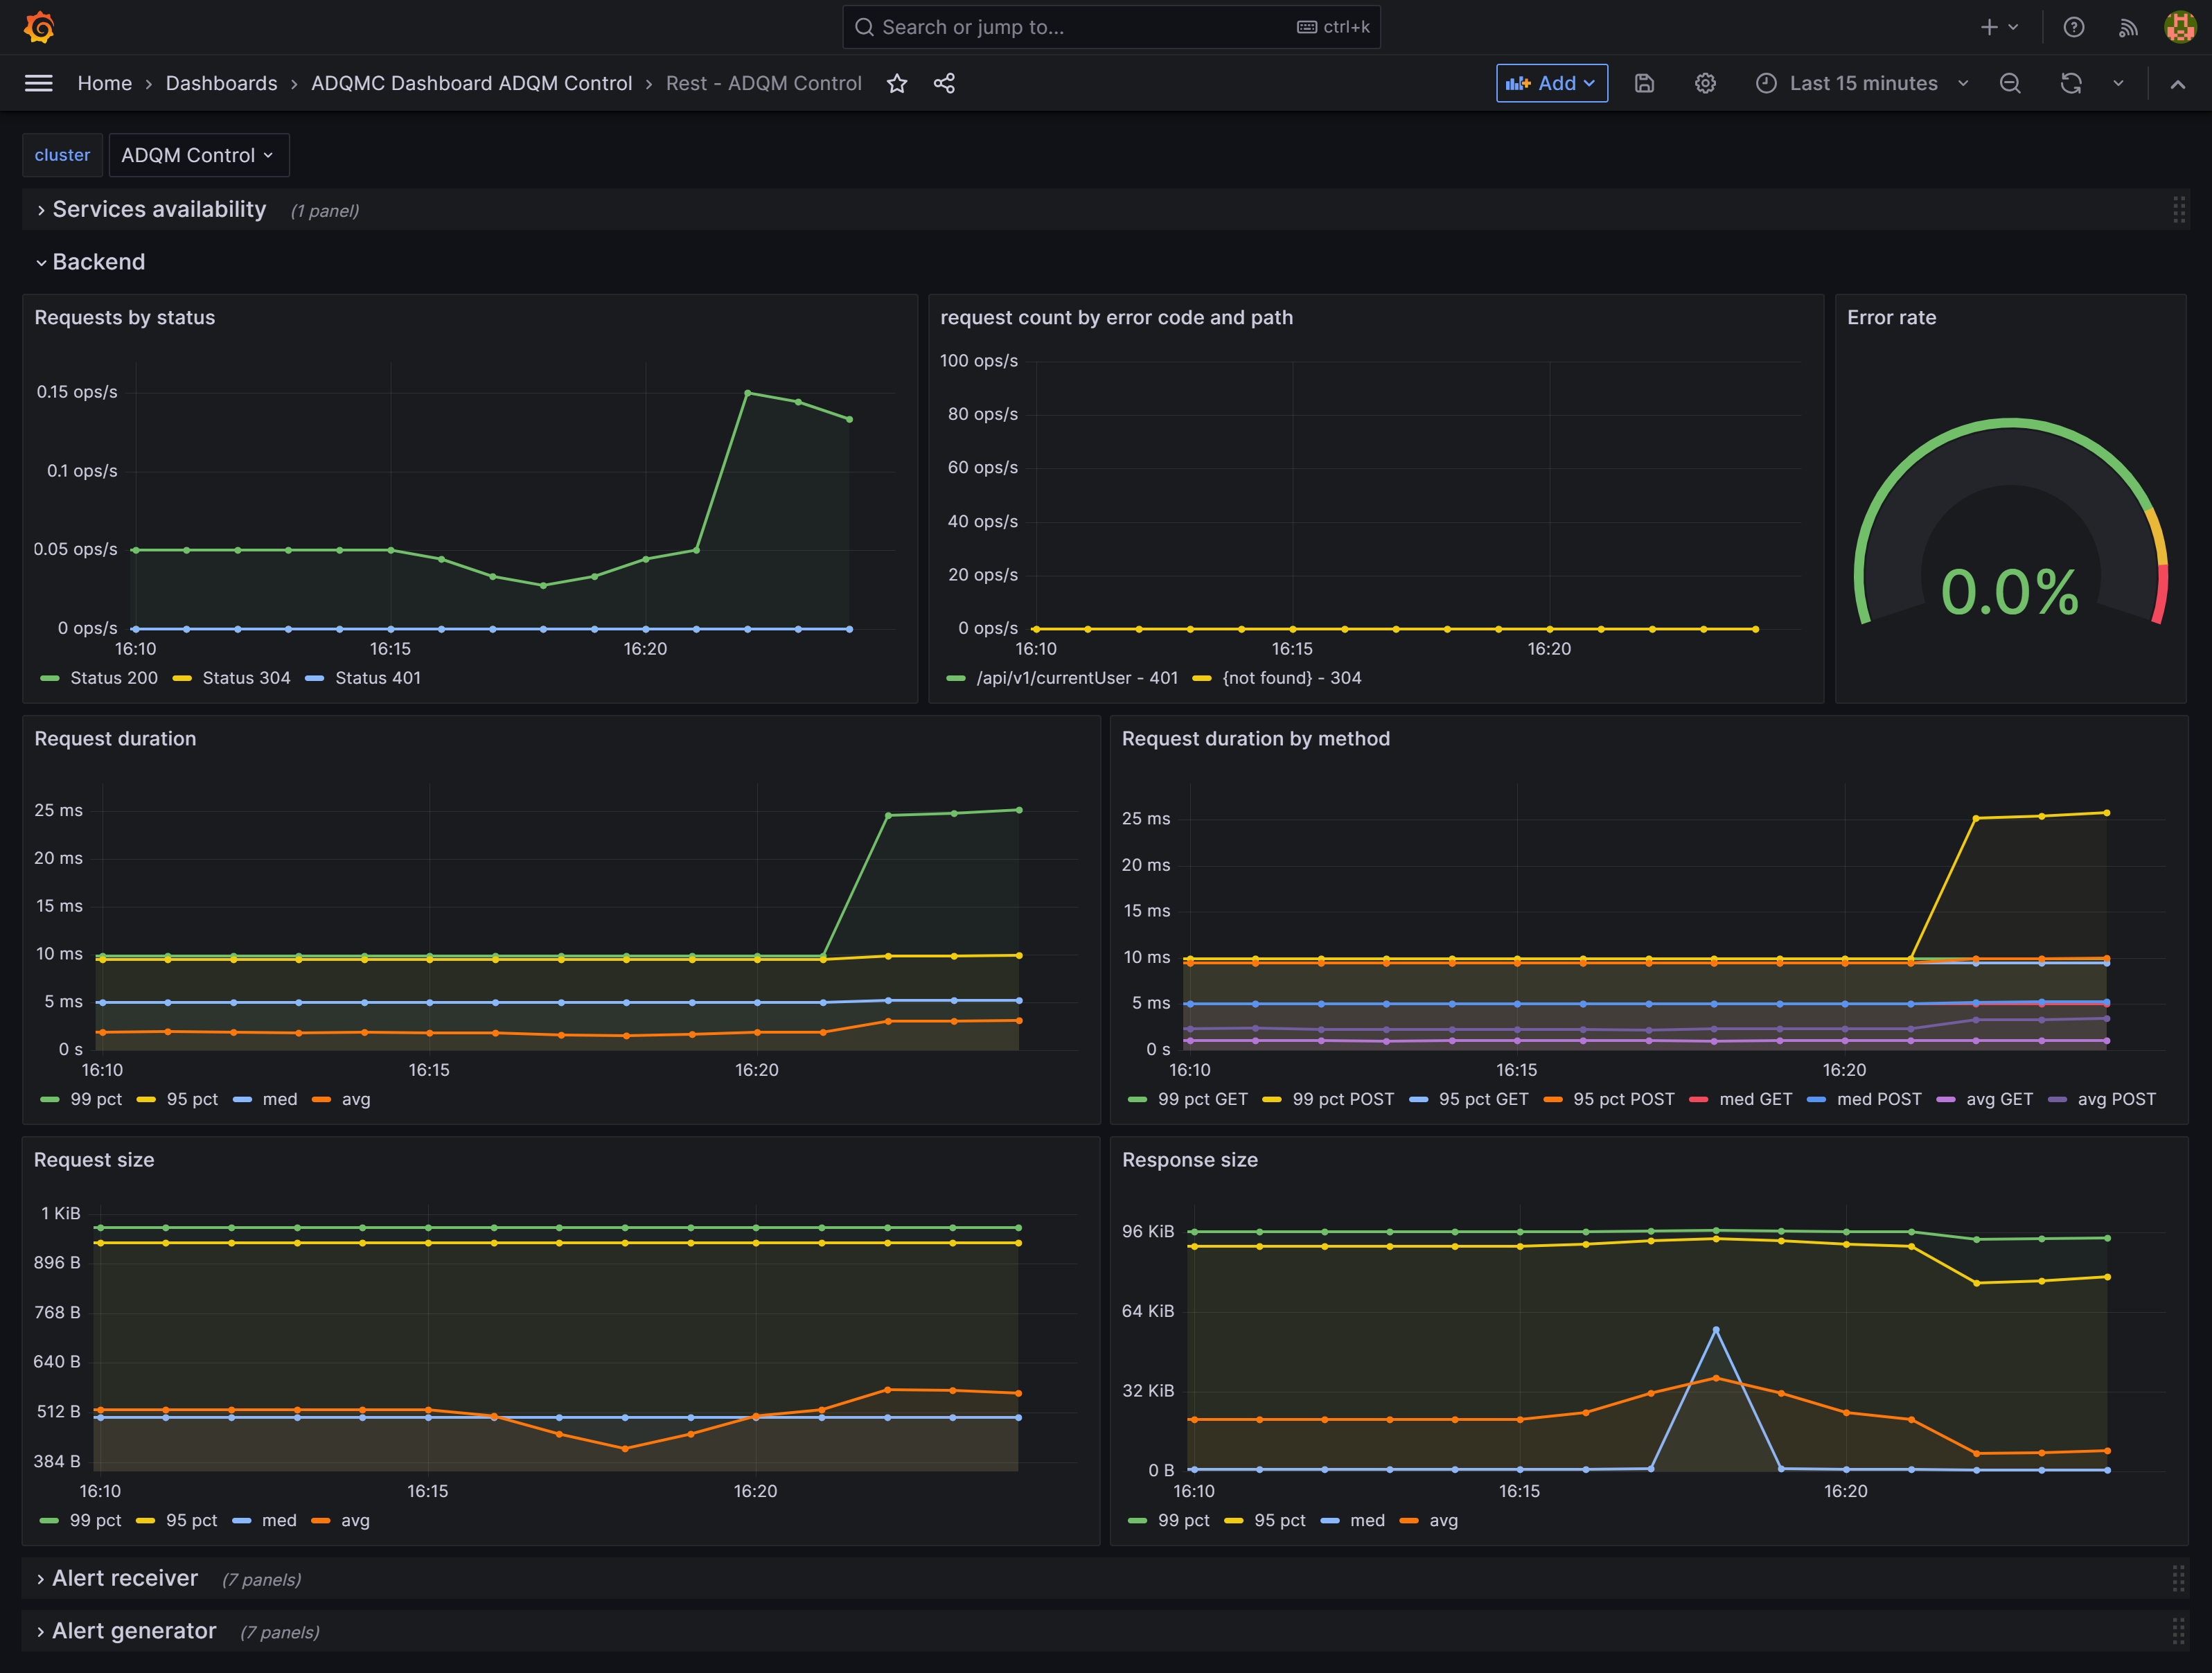
The Rest dashboard contains the Backend, Alert receiver, and Alert generator rows, where panels display the following metrics for the corresponding service components.
| Metric name | Description |
|---|---|
http_request_count_total |
Number of requests |
http_request_duration_seconds_bucket |
Duration of requests in seconds |
http_request_size_bytes_bucket |
Size of requests in bytes |
http_response_size_bytes_bucket |
Size of responses in bytes |
REST API metrics, grouped differently, are also visualized in the API section of the General dashboard.