Work with queries in ADQM Control
The Queries page in the ADQM Control web interface displays SQL queries executed in ADQM clusters connected to the monitoring system. On this page, you can get an overview of queries to cluster databases and view various query execution metrics — for example, to analyze query performance, amounts of read/written data, resource usage, errors if they have occurred during query execution, etc. Information on queries can also be presented in the form of graphs, which allow you to visualize the number of queries of different types, see how the total number of queries sent to the cluster is distributed among users, and track any queries that are too long (compared to the average).
At the top of the screen, you can set up the following filters to select which data the Queries page should display:
-
Cluster — ADQM cluster where queries were executed.
-
Time — time period when queries were launched. In the window that opens when you click the field, you can select an interval from the offered options on the Range tab or set a custom time range (at least 1 hour) on the Calendar tab.
-
Refresh — frequency of data updates.
Query history is always displayed on the Queries page according to these filters — it contains all queries run on the selected ADQM cluster during the specified time period. For each DDL query (with ON CLUSTER), it also includes the queries executed on each host of the cluster and displays the /* ddl_entry=query-num */ prefix before the main text of such queries.
You can also get a list of the longest-running queries or queries used the most memory in the Top 10 queries section on the Dashboard page.
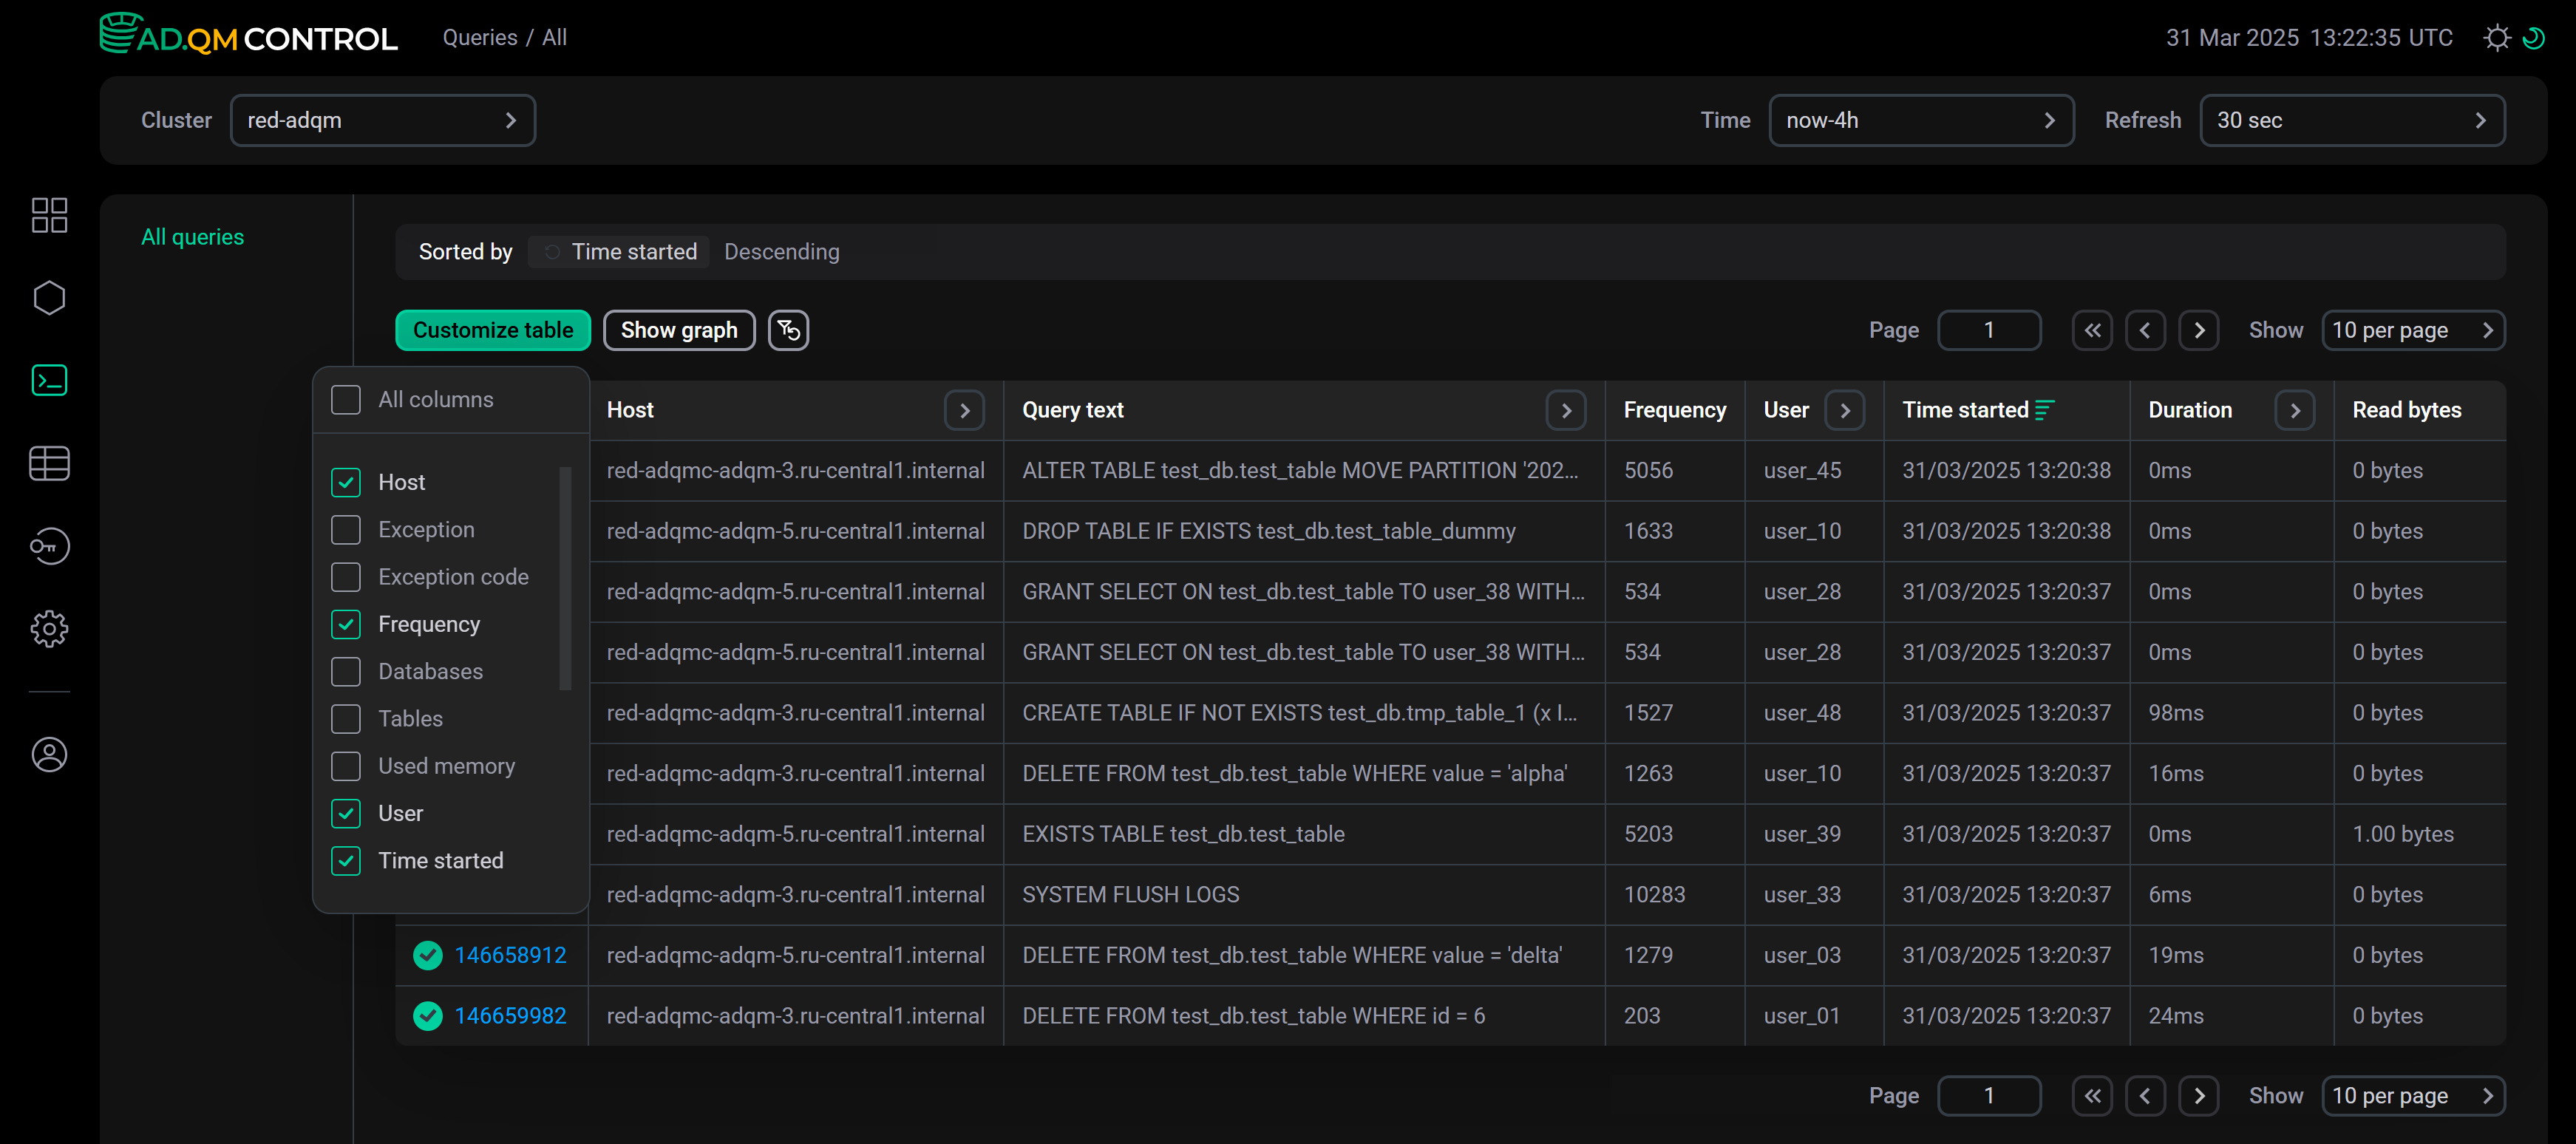
Fields of the Queries table
The table with the list of queries on the Queries page can include the following fields.
| Field | Description |
|---|---|
Query ID |
Unique query identifier. The column also shows an icon indicating the query status:
Query status can also be separately displayed in the Status column that allows filtering |
Query text |
Query text. For a long query, its text is truncated and when you hover the mouse cursor over the column cell, it is displayed as |
Status |
Current status of a query. Possible values:
|
Host |
Host where a query was run |
Exception |
Text of an error occurred before or during a query execution |
Exception code |
Code of an error occurred before or during a query execution |
Frequency |
How many times a query was executed in the cluster during the selected time period in the context of all filters currently applied on the page. Statistics are calculated for queries whose text completely matches (i.e. for parameterized queries, specific parameter values are taken into account) |
Databases |
Names of databases accessed by a query (there may be multiple — for example, if a query uses JOIN) |
Tables |
Names of tables accessed by a query (there may be multiple — for example, if a query uses JOIN) |
Used memory |
Amount of memory consumed by a query |
User |
Name of an ADQM user who initiated a query execution. For queries executed on cluster hosts when running a distributed query, a user is not defined — the User column shows an empty string ( |
Time started |
Query execution start time |
Duration |
Duration of a query execution or the current execution time ( |
Average duration |
Average query execution time. Statistics are calculated for queries whose text completely matches (i.e. for parameterized queries, specific parameter values are taken into account) |
Read bytes |
Total amount of data read from all tables and table functions participated in a query. For distributed queries, this is the number of bytes read on all replicas — each replica sends its |
Result bytes |
Amount of memory to store a query result |
Result rows |
Number of rows in the result of a |
Read rows |
Total number of rows read from all tables and table functions participated in a query. For distributed queries, this is the total number of rows read on all replicas — each replica sends its |
Written rows |
Number of rows written by an |
Written bytes |
Amount of data written by an |
Type |
Query type. Possible values:
|


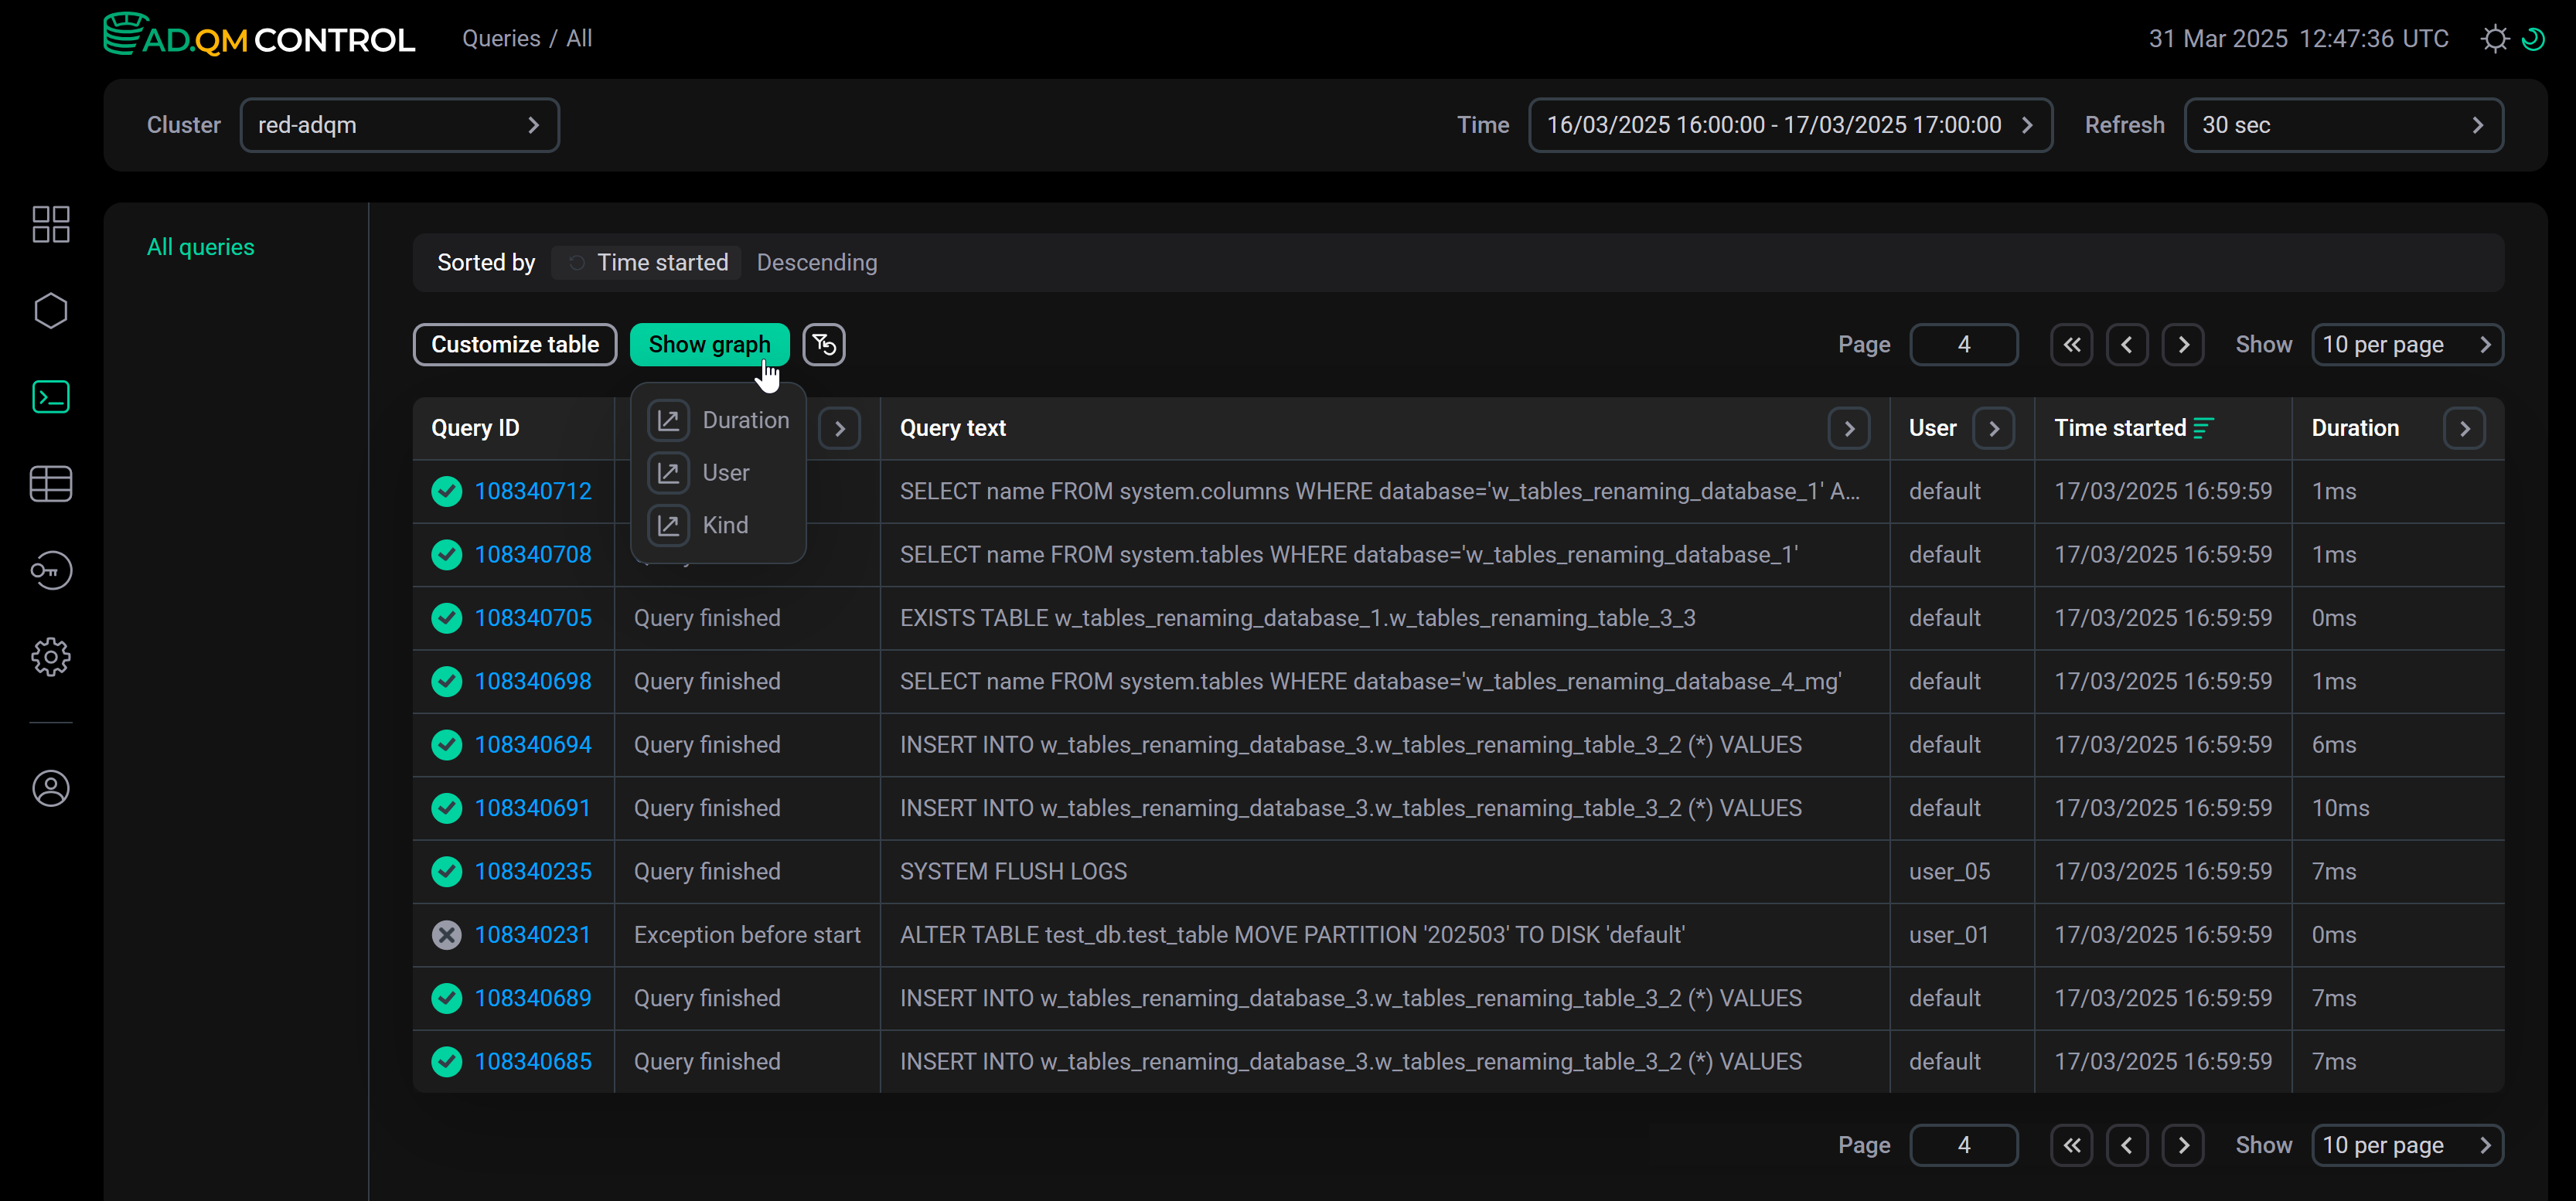
To display/hide fields of the Queries table, click Customize table and select the desired fields in the drop-down list. The Query ID and Query text fields are always visible, they cannot be hidden.
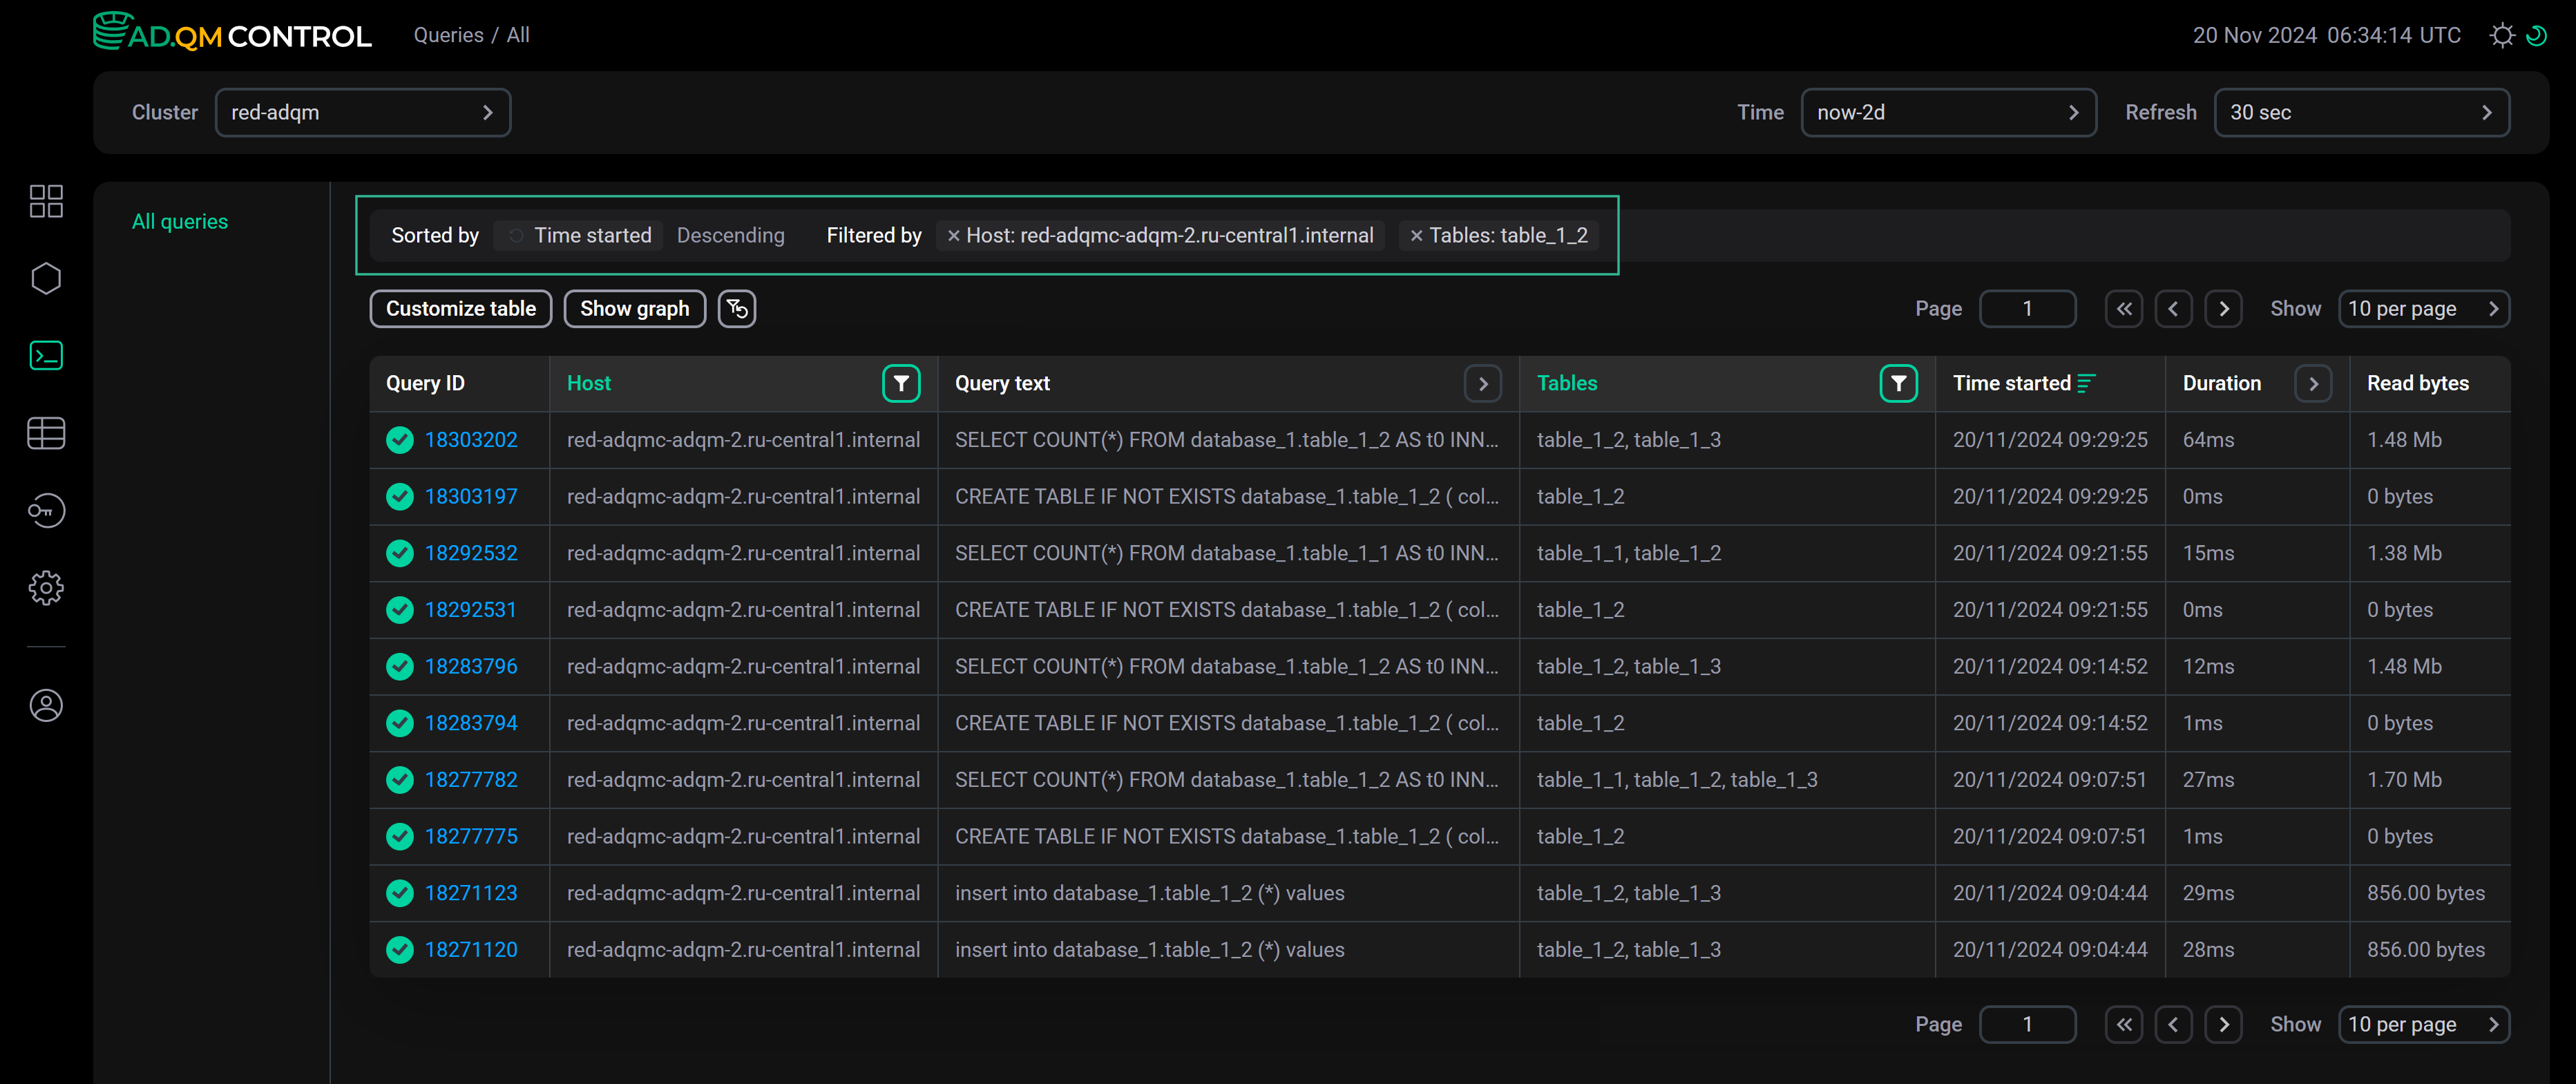
Sort and filter data
In the column headers of the table with the list of queries, there are filters that you can use to select specific data. To open a filter, click the icon ![]()
![]() . Filters are available in the following columns:
. Filters are available in the following columns:
-
Query text — enter a truncated query text (as it is displayed in a tooltip that appears when you hover the mouse cursor over a column cell) or its fragment;
-
Databases, Tables — enter a name of a database or table (for rows with multiple databases or tables separated by commas in the Databases or Tables column, filtering works only if the search is performed by one item from a list of databases or tables in a cell);
-
Exception code — enter a numerical error code (or multiple comma-separated codes) on the Search tab or select a group of errors on the Presets tab;
-
Host, User — you can enter names of multiple hosts or users, respectively (for queries initiated by a distributed query, filtering by an empty value in the User column is not supported);
-
Duration — you can enter the minimum and maximum query execution time (in seconds);
-
Status, Type — you can select a value (query status or type) from the drop-down list.
The icon ![]()
![]() indicates that a filter by column values is applied. To reset all filter conditions, click
indicates that a filter by column values is applied. To reset all filter conditions, click ![]()
![]() .
.
Data sorting is available in the following columns: Exception (actually sorting is performed by error code), Exception code, Used memory, Time started, Duration, Read bytes, Result bytes, Result rows, Read rows, Written rows, and Written bytes. To change a sort order by column values, use the icon ![]()
![]() or
or ![]()
![]() in the column header.
in the column header.
Above the table with queries, there is a panel that shows the sorting (Sorted by) and filtering (Filtered by) conditions currently applied to data.
Query details
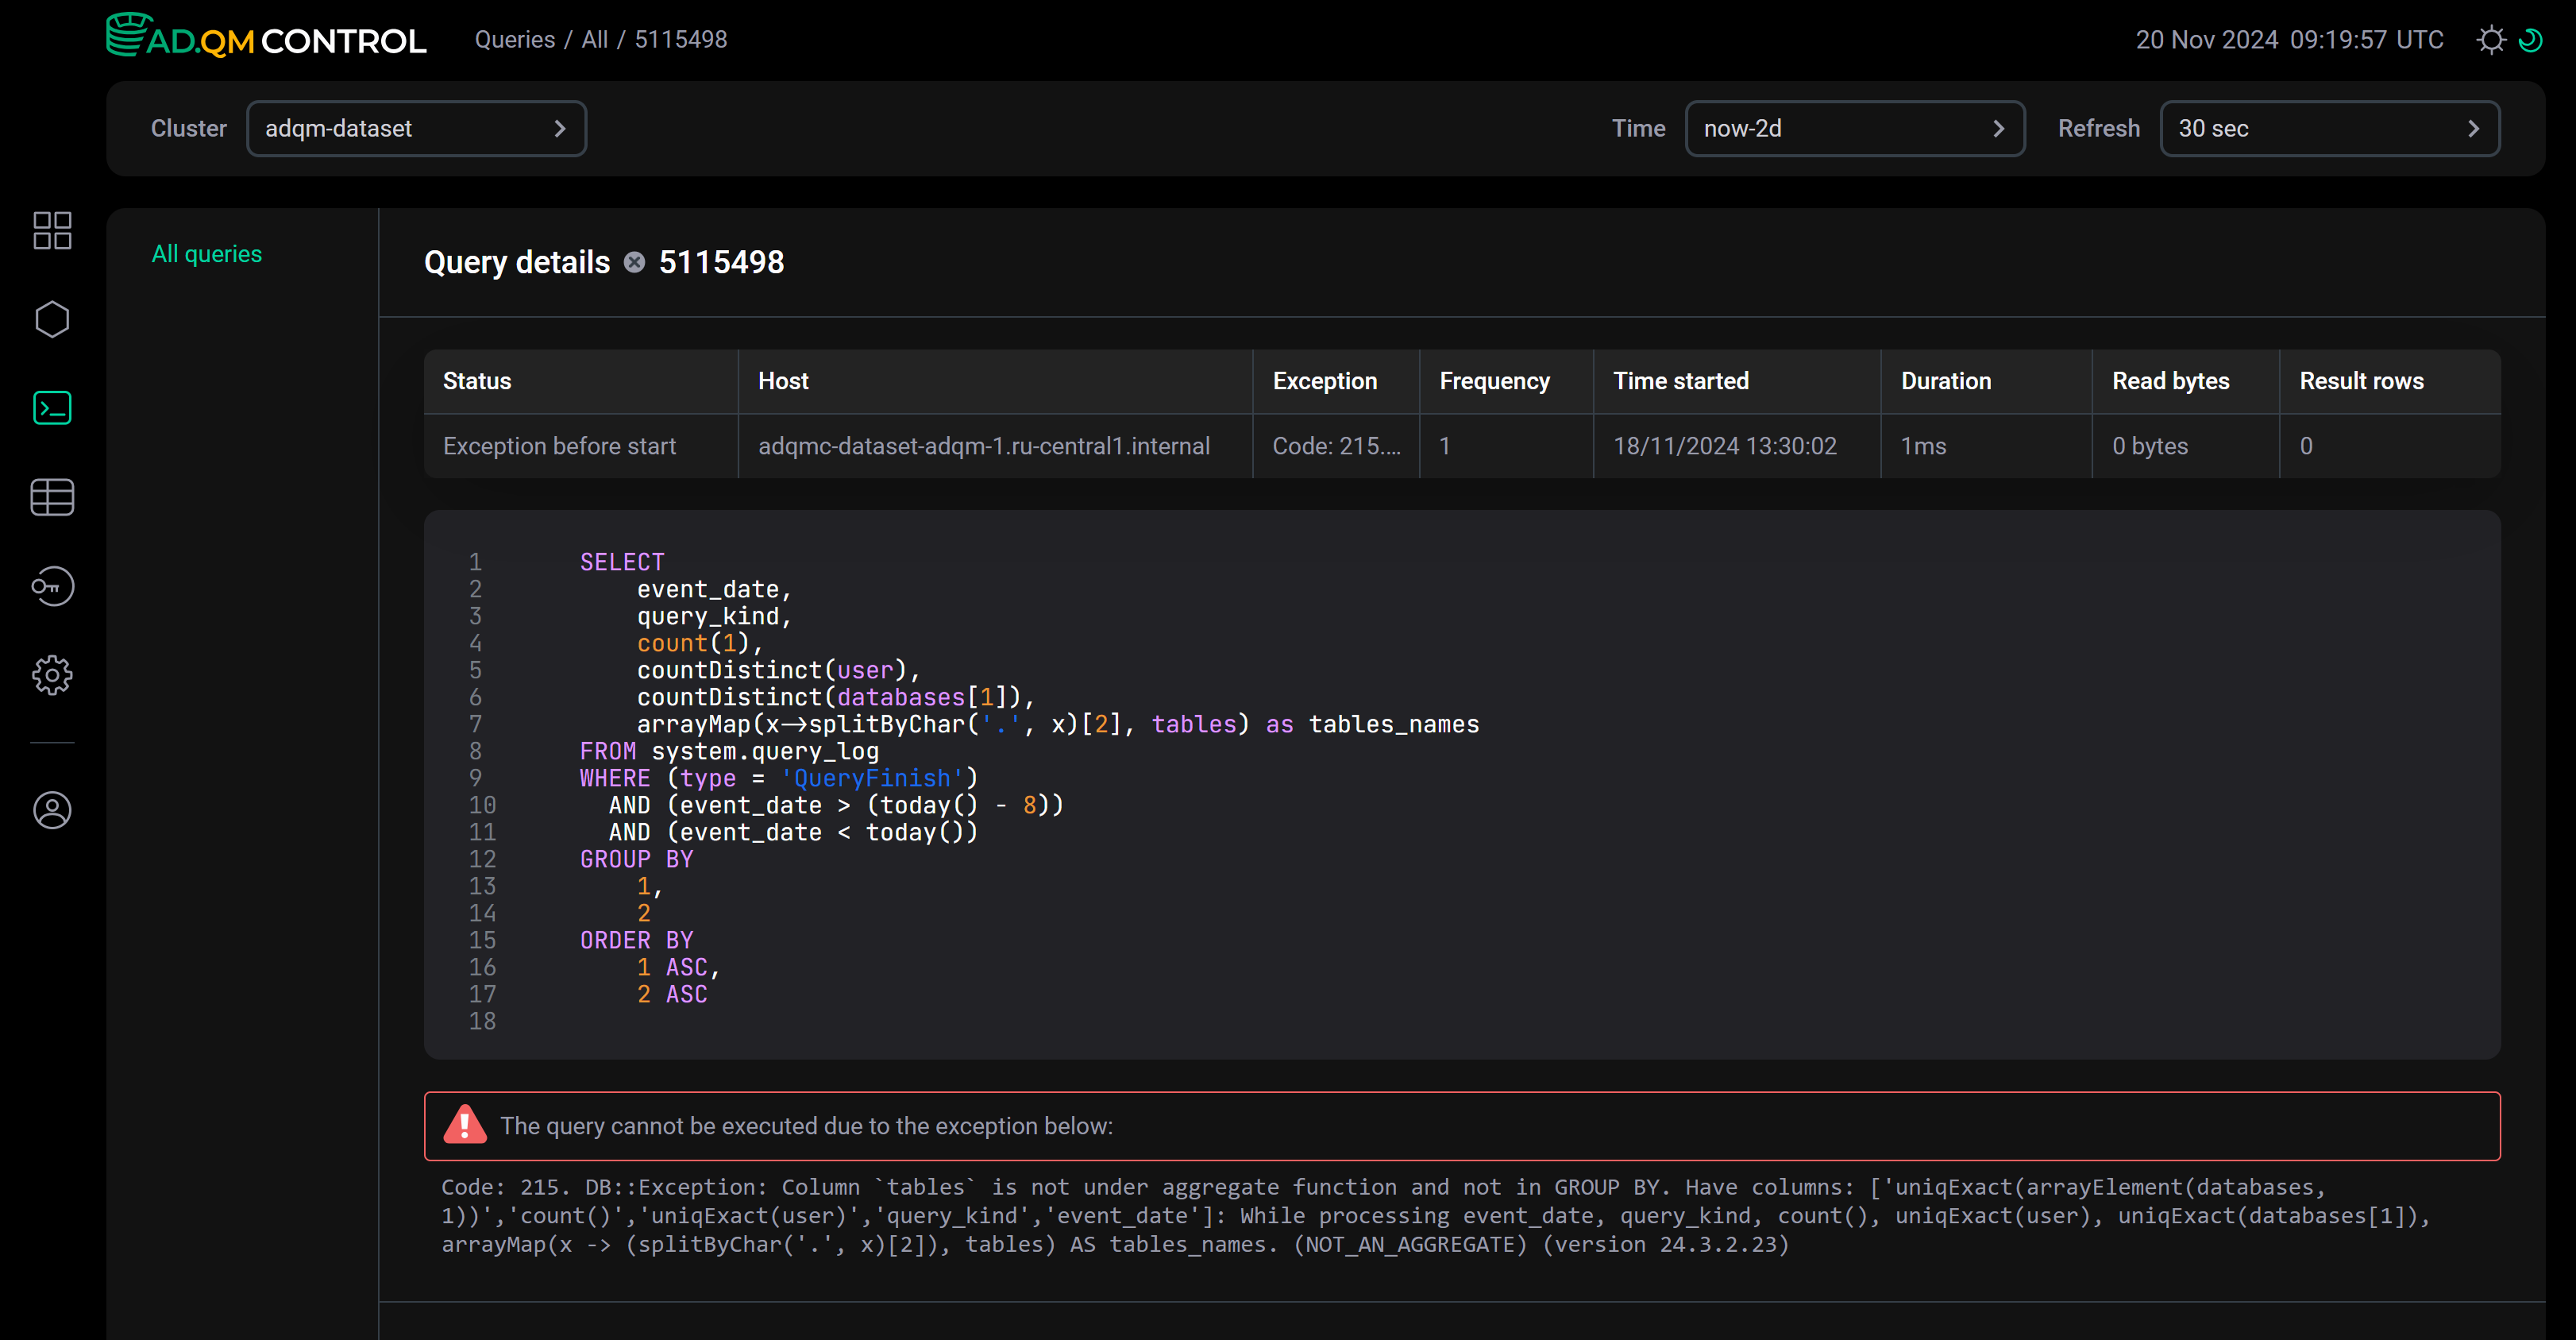
To view detailed information on a query, click its identifier in the Query ID field of the Queries table.
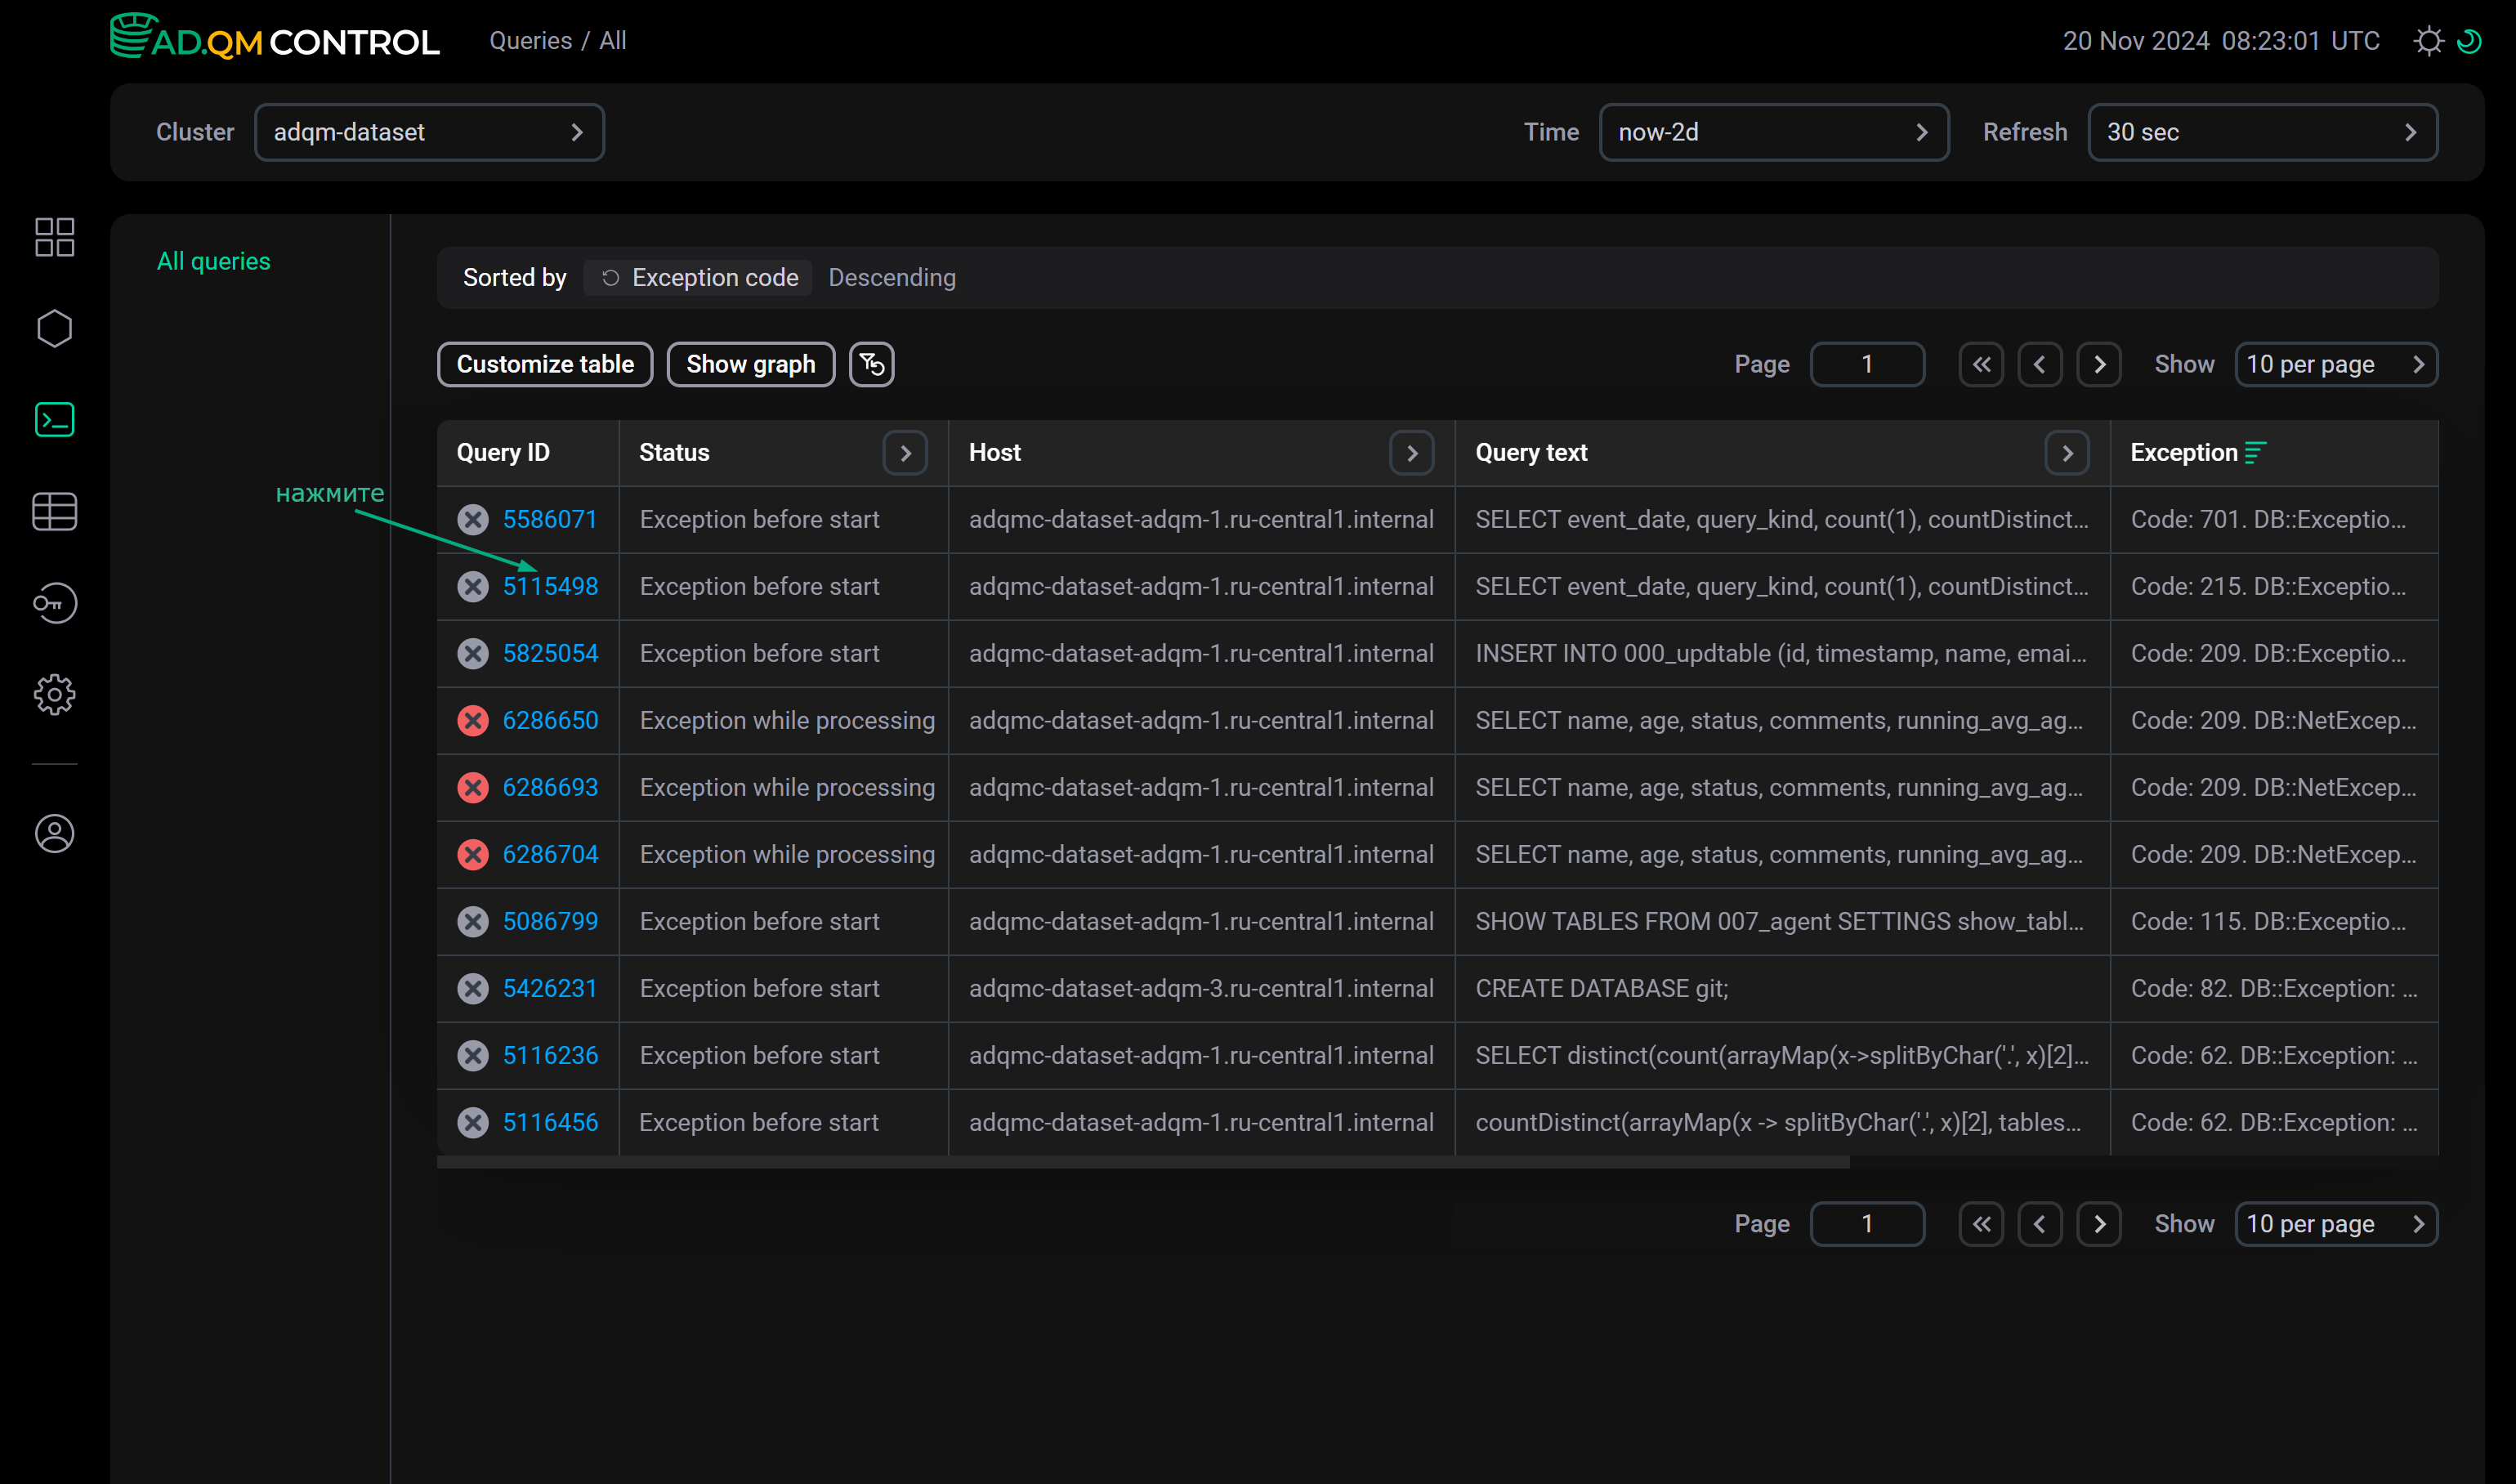
The Query details page that opens contains the full text of the selected query, as well as the description of an error if it has occurred during the query processing. The page also displays query metrics in the columns selected on the Queries page via Customize table.
Graphs
On the Queries page, you can build graphs to analyze queries sent to your ADQM cluster tables during a specified period of time, based on the following metrics:
-
Duration — query execution time;
-
User — number of queries sent by particular users;
-
Kind — number of queries of certain types;
-
Host — distribution of queries across cluster hosts (with detecting possible anomalies by various metrics of host load during query execution).
To build a graph, click Show graph and select the desired graph type from the drop-down list.
In the drop-down menu to the right of the graph, you can change the graph type, as well as choose the level of detail (number of points on the graph): Low or High.
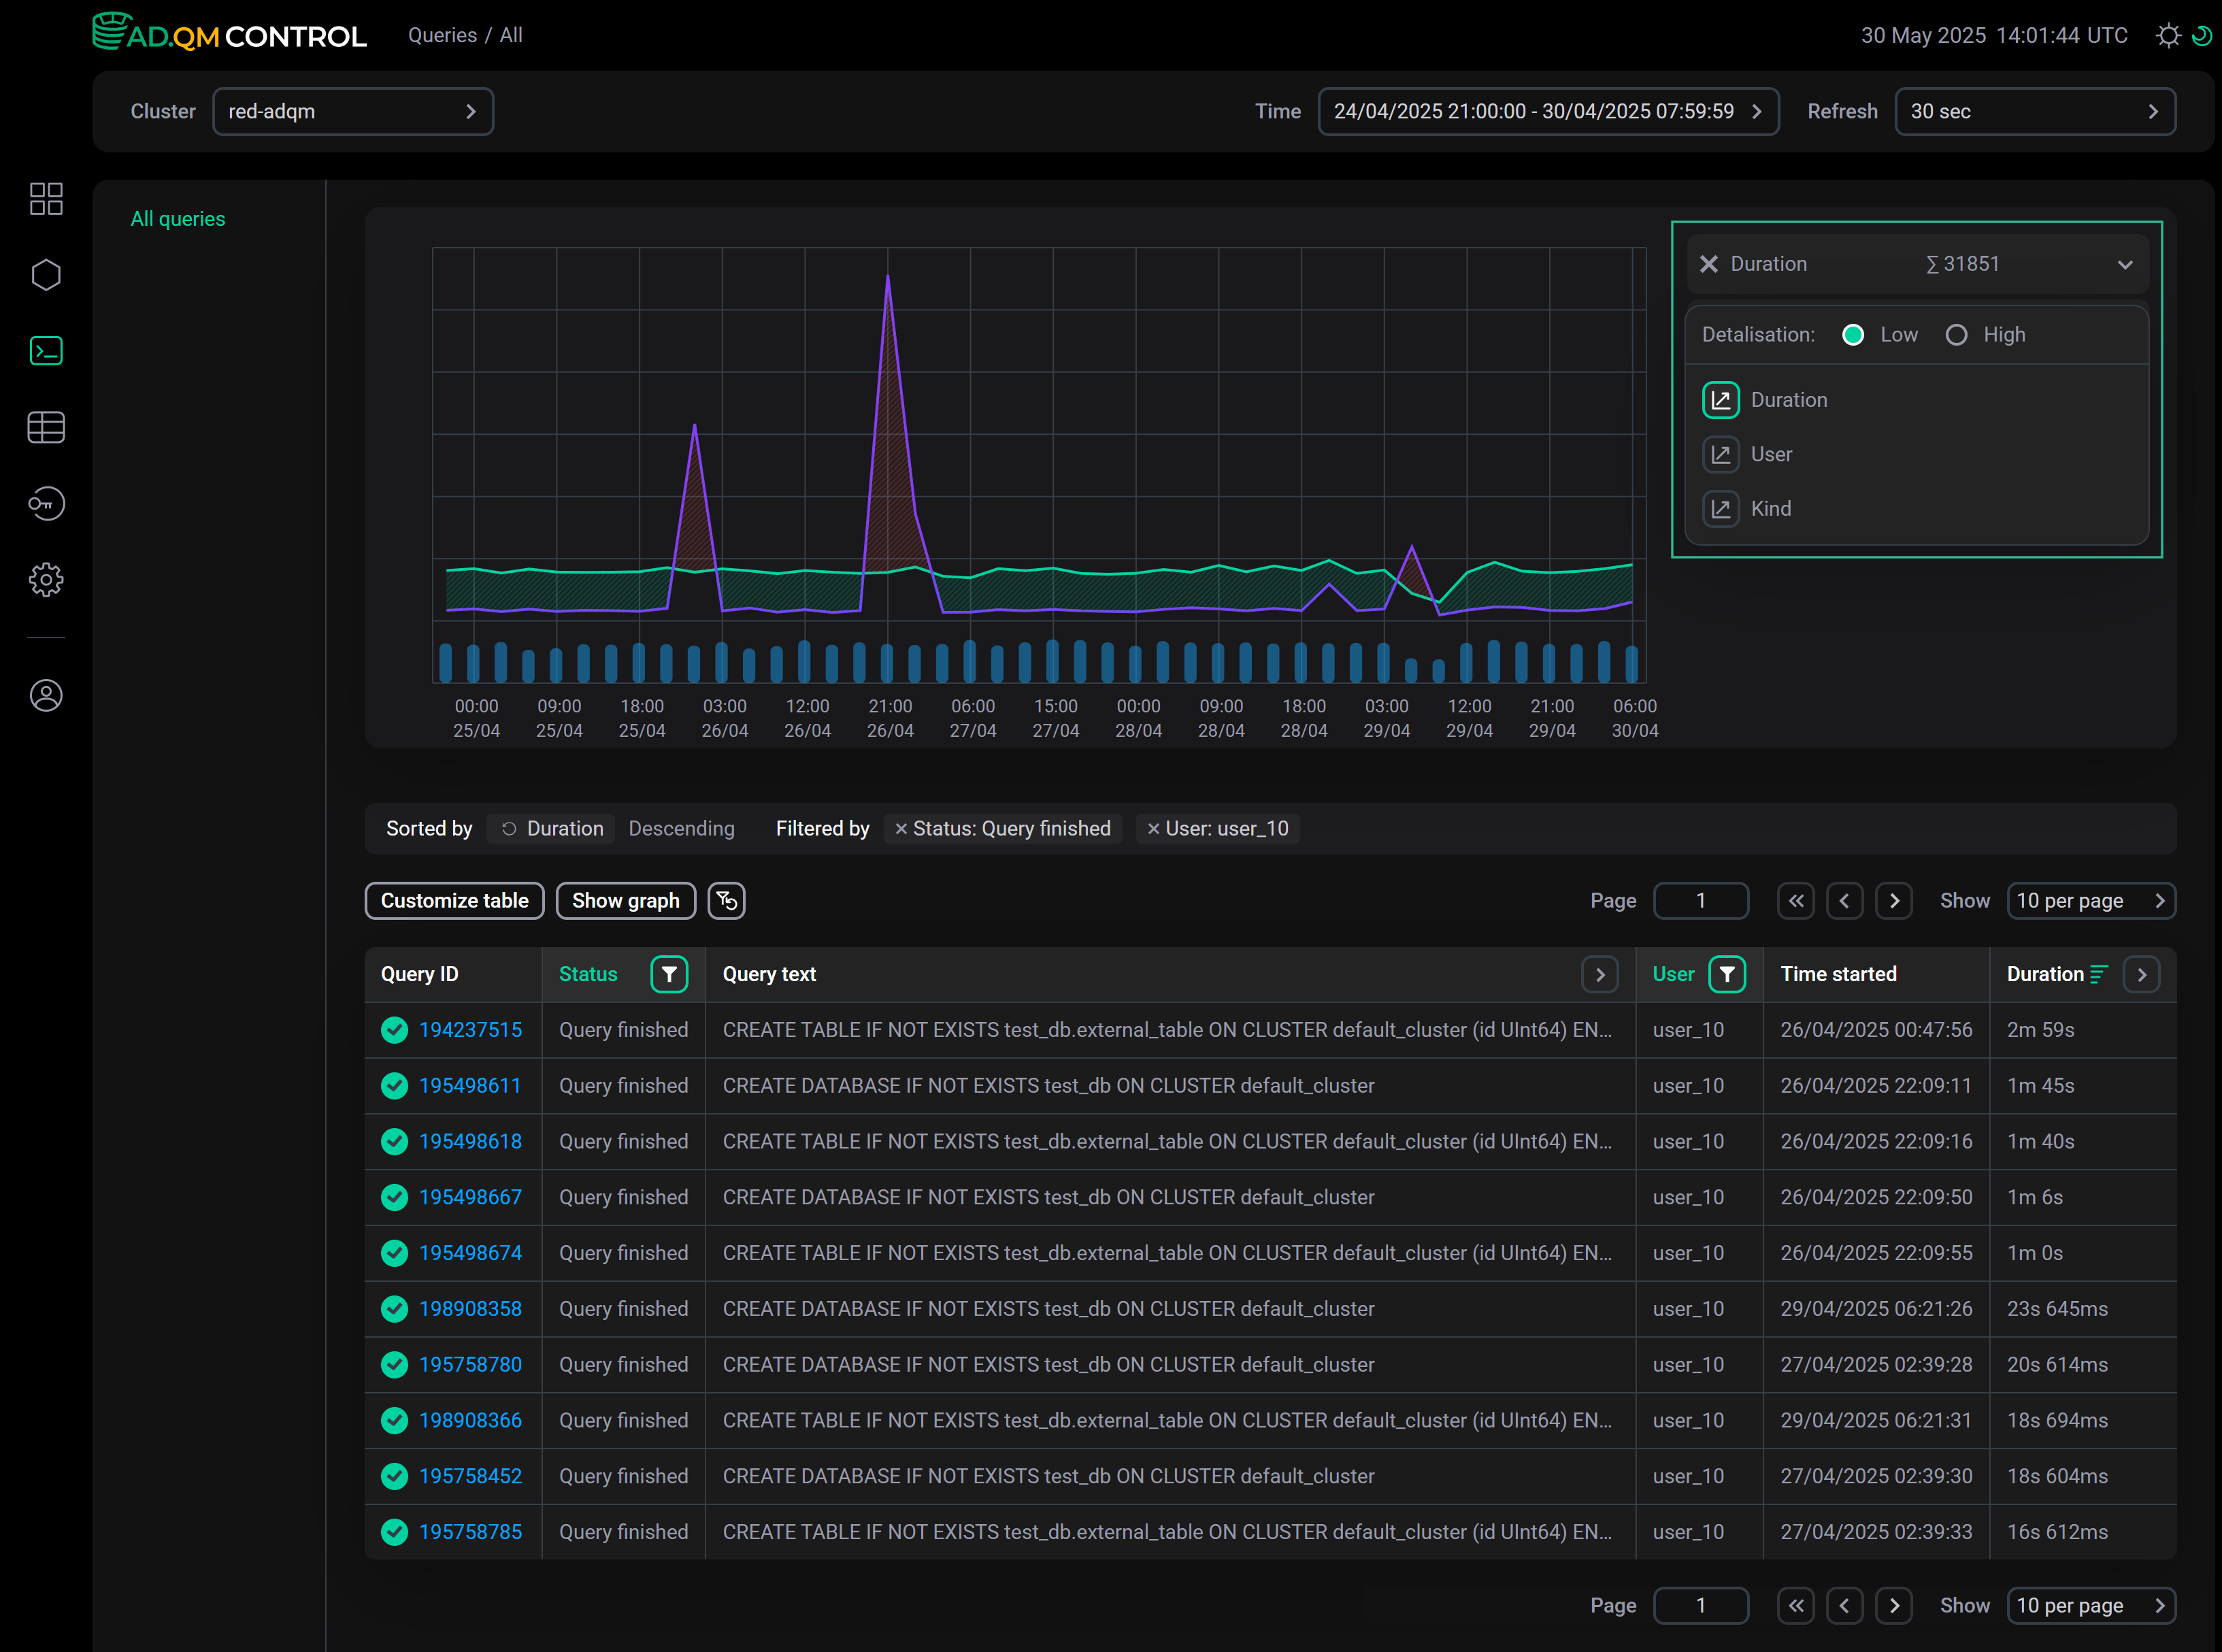
Duration
The Duration graph shows the overall trend of query execution duration allowing you to find queries that have taken a long time to complete (relative to other queries in the same time interval) and need to be analyzed.
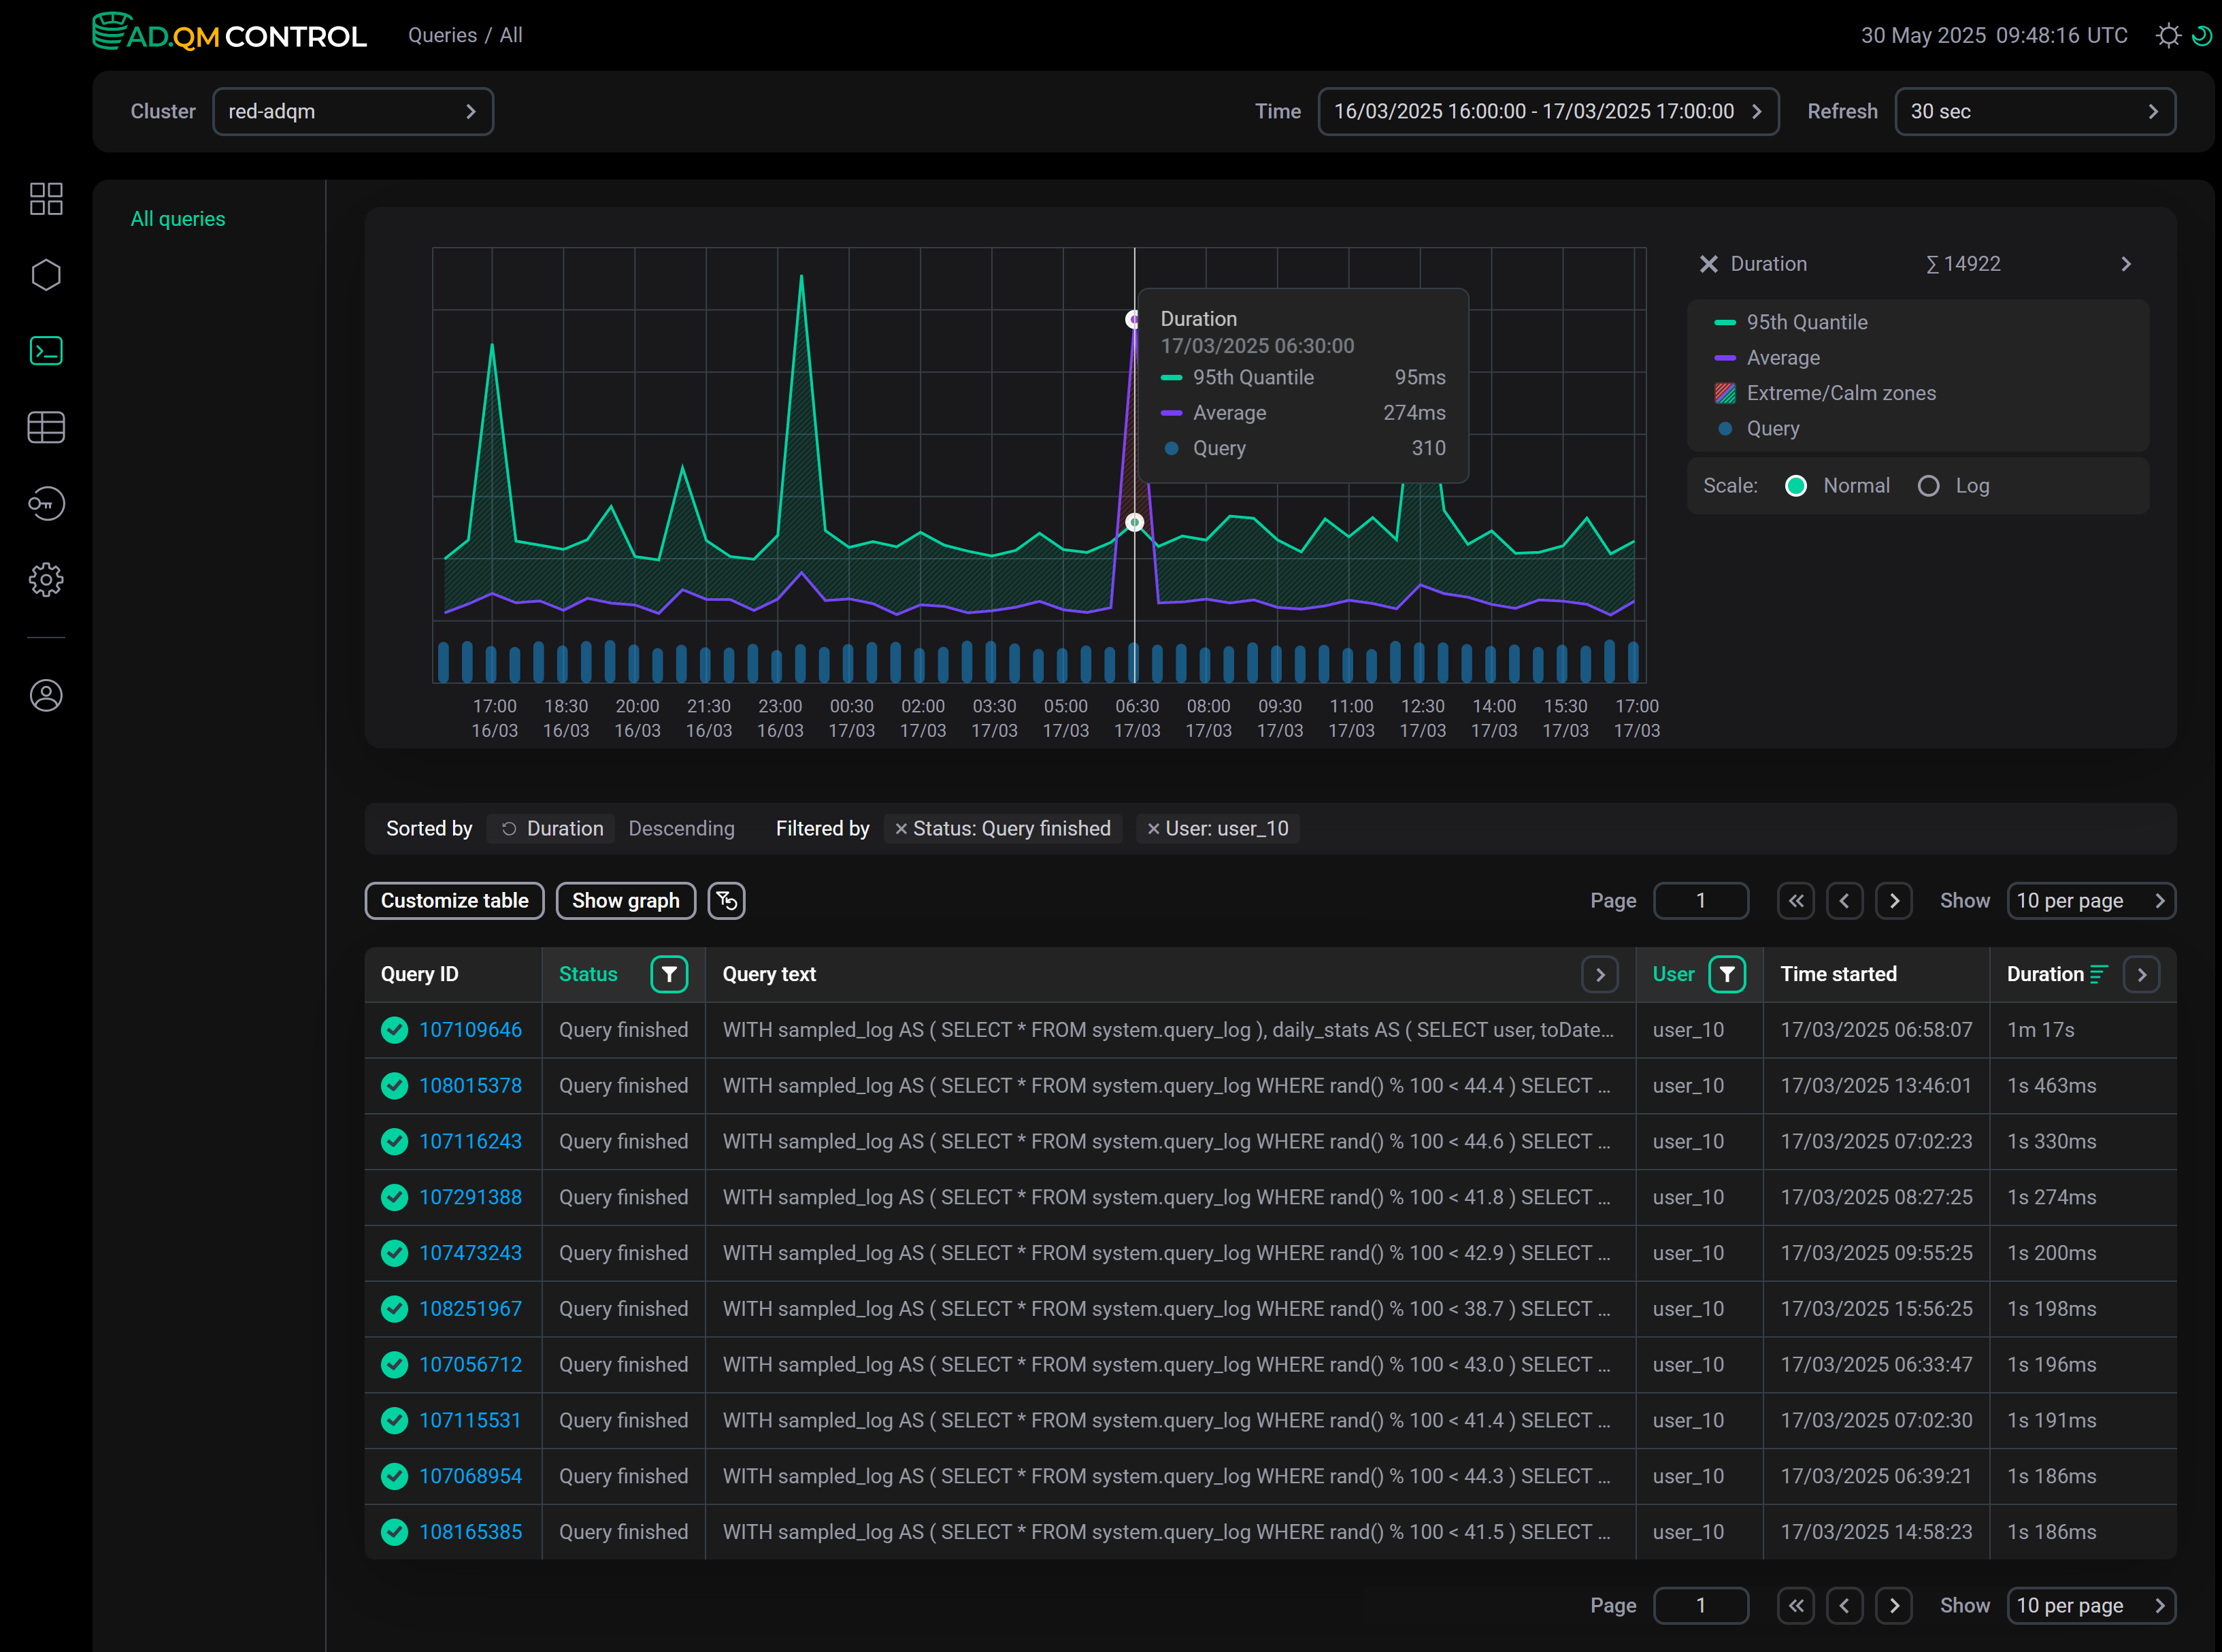
This graph displays the following information on the execution time of queries sent to an ADQM cluster during a specified period of time:
-
95th Quantile — 95th quantile of query execution time.
-
Average — average query execution time.
-
Extreme zone (area shaded in red if the Average line is above the 95th Quantile line) — time interval when there was one or more long queries relative to most others. For example, in the graph above, such a zone is observed in the time range from
6:00to7:00— in the queries table, you can see that at06:58:07there was a query with a duration of1m 17s, while all other queries were completed much faster (the queries in the table are sorted by the Duration column in descending order).
Calm zone (area between the Average and 95th Quantile lines, shaded in green) — time interval when duration of all queries was comparable. A peak in this zone means that all queries in a given time interval have become longer to complete. -
Query — number of queries.
-
No data (area shaded in gray) — time interval for which there is no data about queries according to the applied filters. The No data item appears in the legend only if the graph contains one or more time intervals with missing query information.
Example of a graph with no data on queries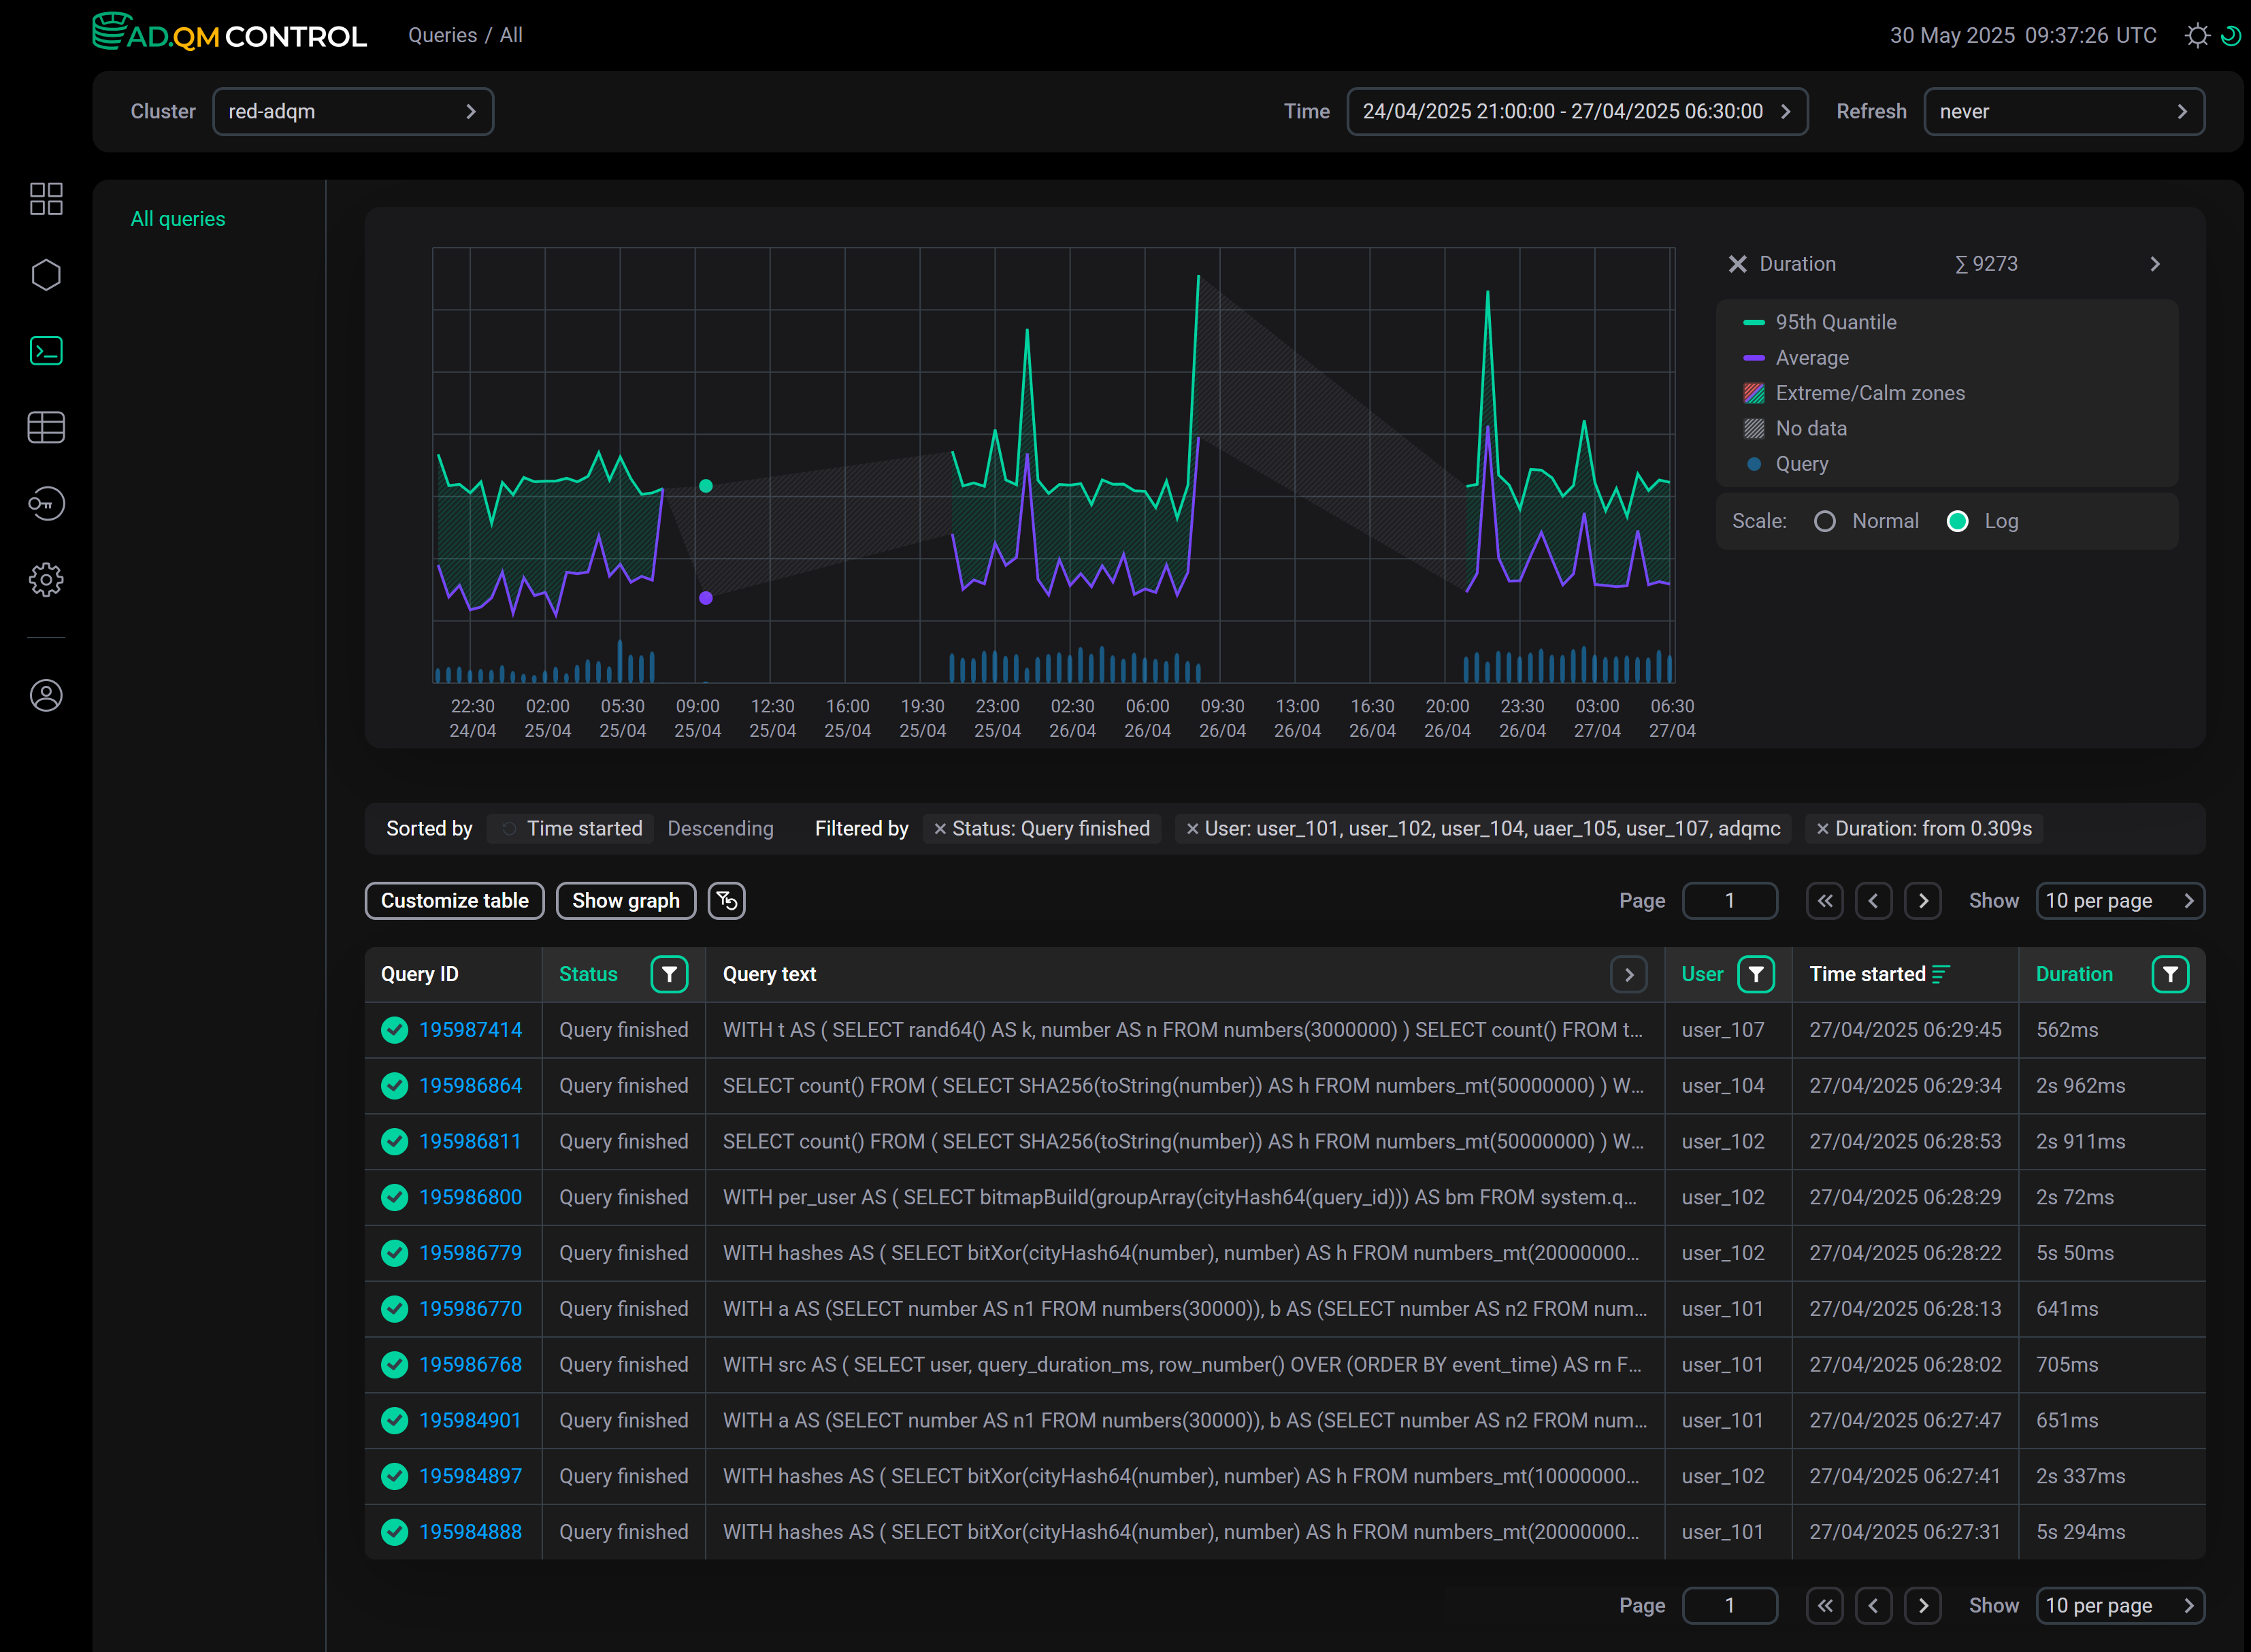 Graph including "No data" time intervals
For the Duration graph, you can select the scale type: Normal or Log (the logarithmic scale can be more convenient for larger time intervals — for example, a month or a week).
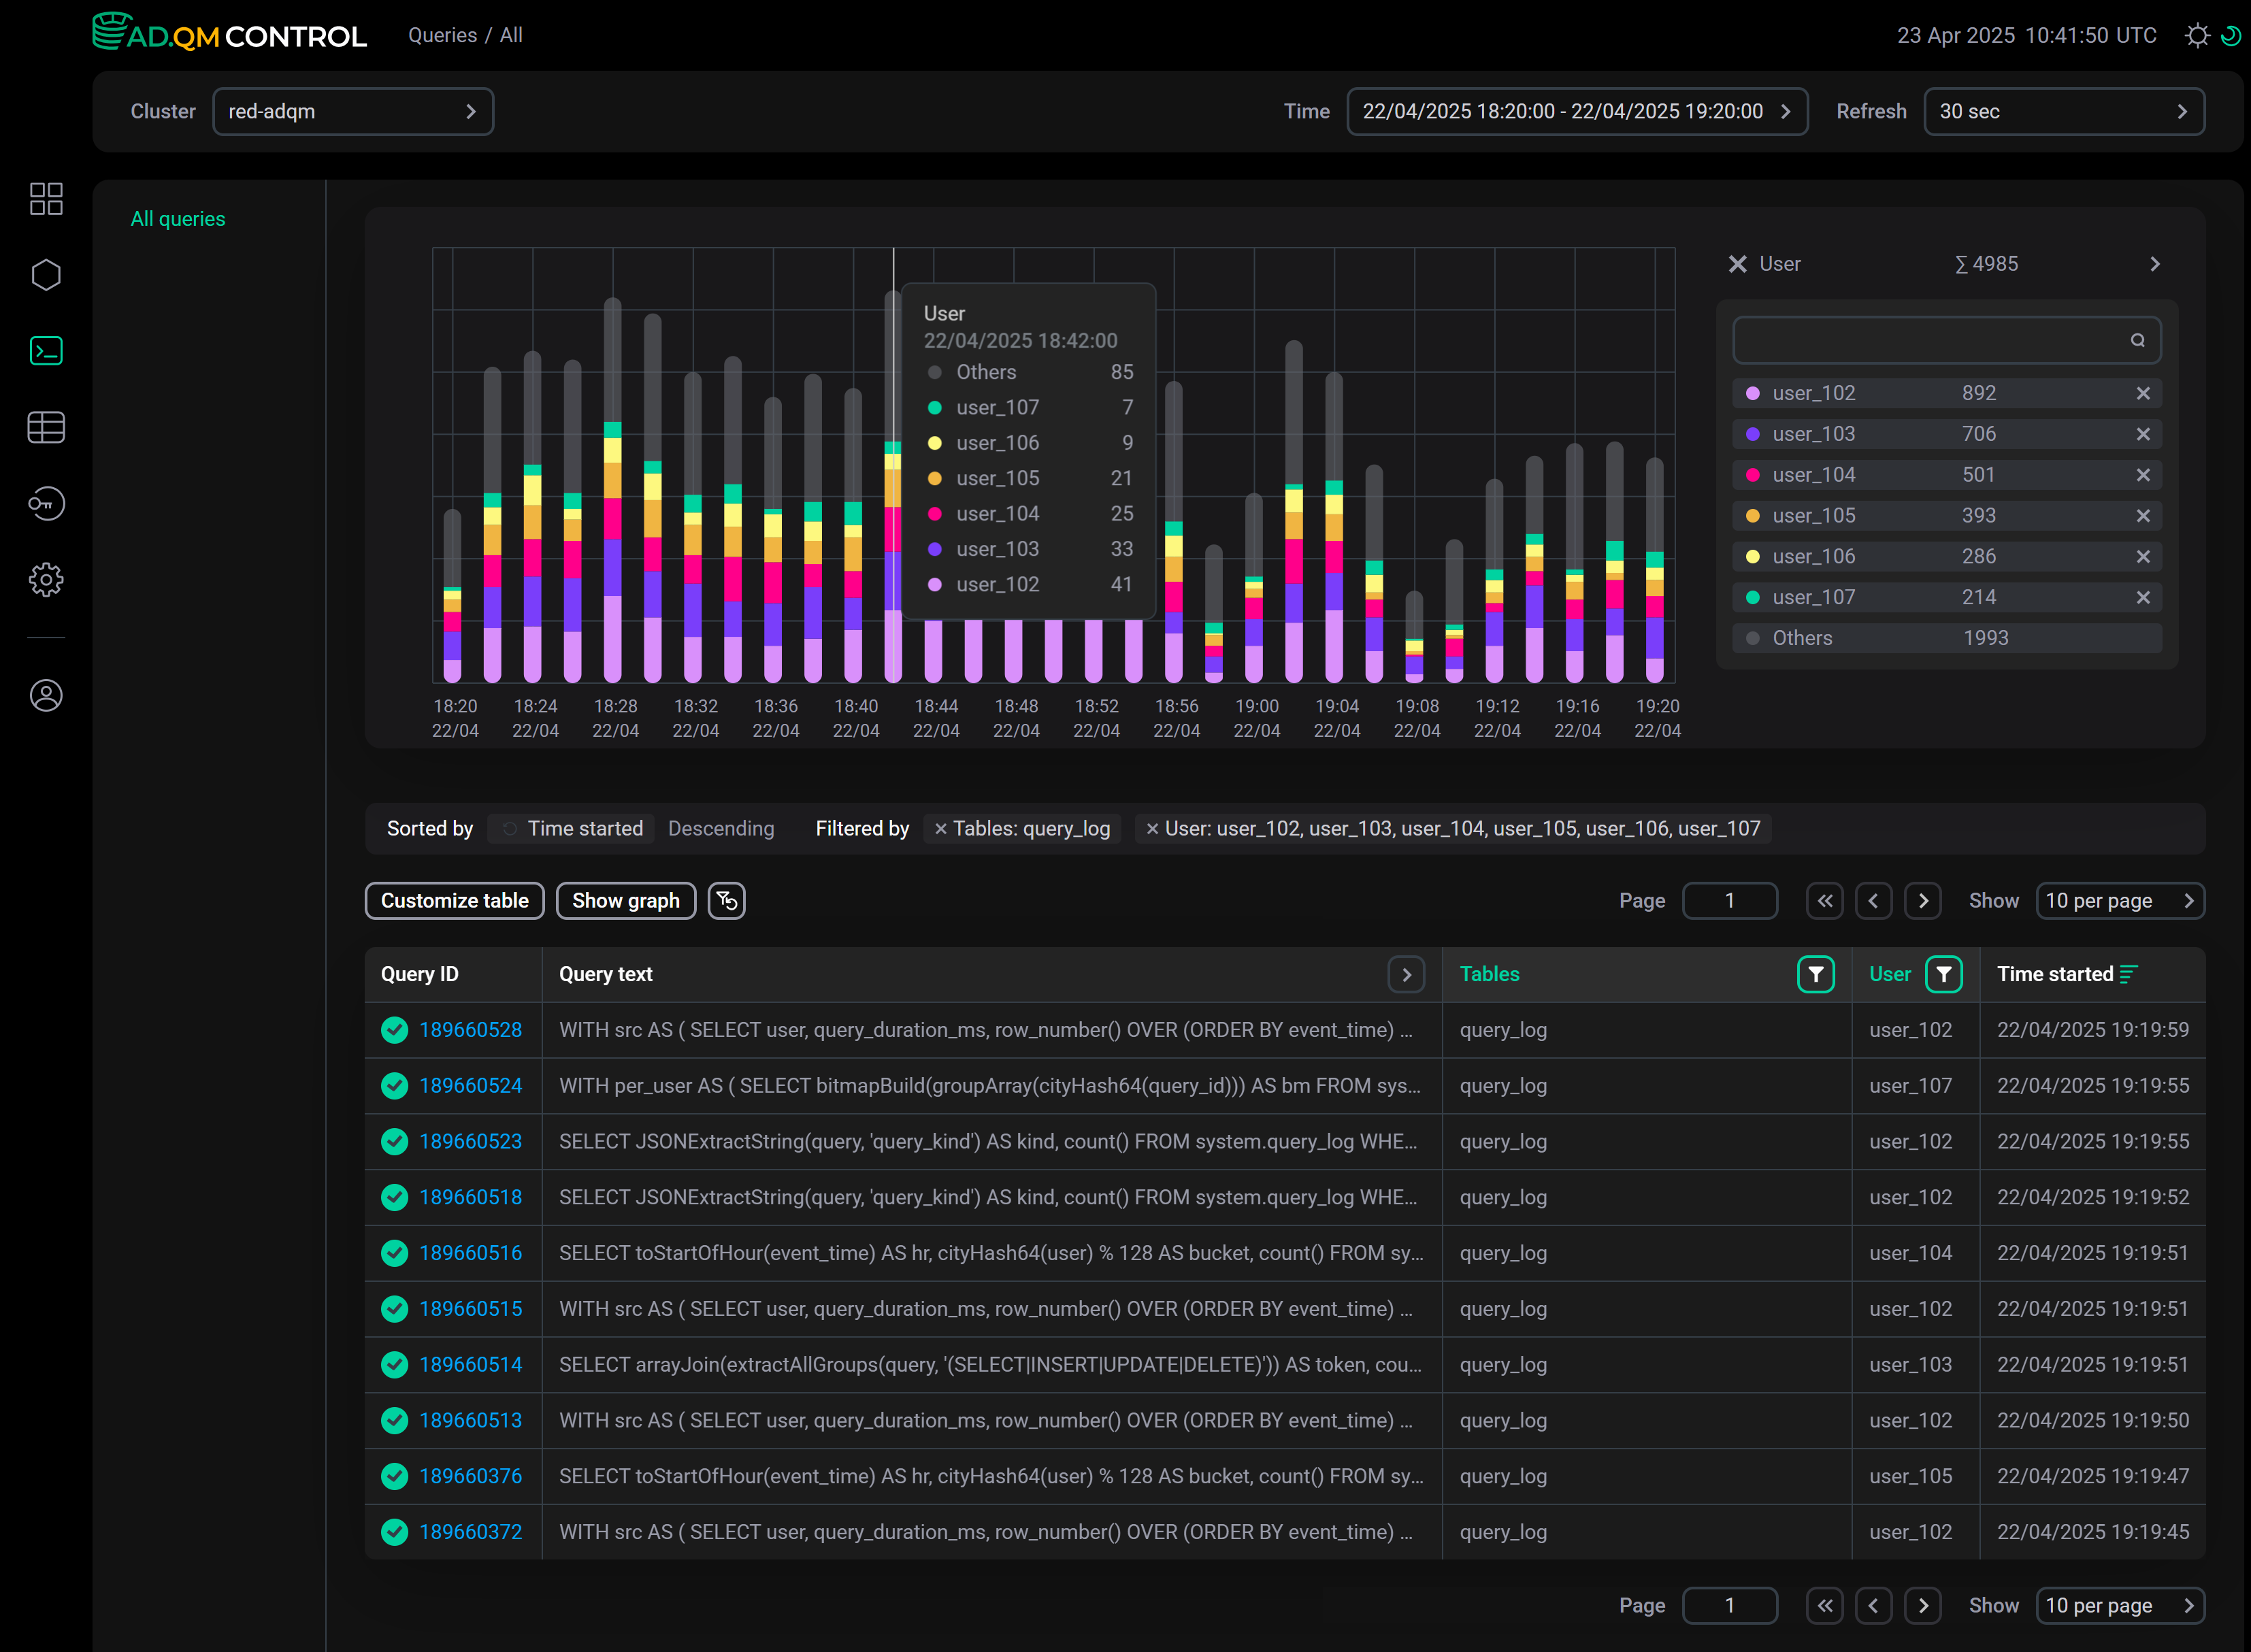
User
The User graph allows you to see the number of queries sent to the cluster by each user and evaluate this number relative to the number of queries from other users and to the total of all queries. The graph is built using data on queries from users whose names are listed in the filter by the User column. You can also specify user names in the field to the right of the graph (the list of selected users is automatically synchronized with the filter by the User column).
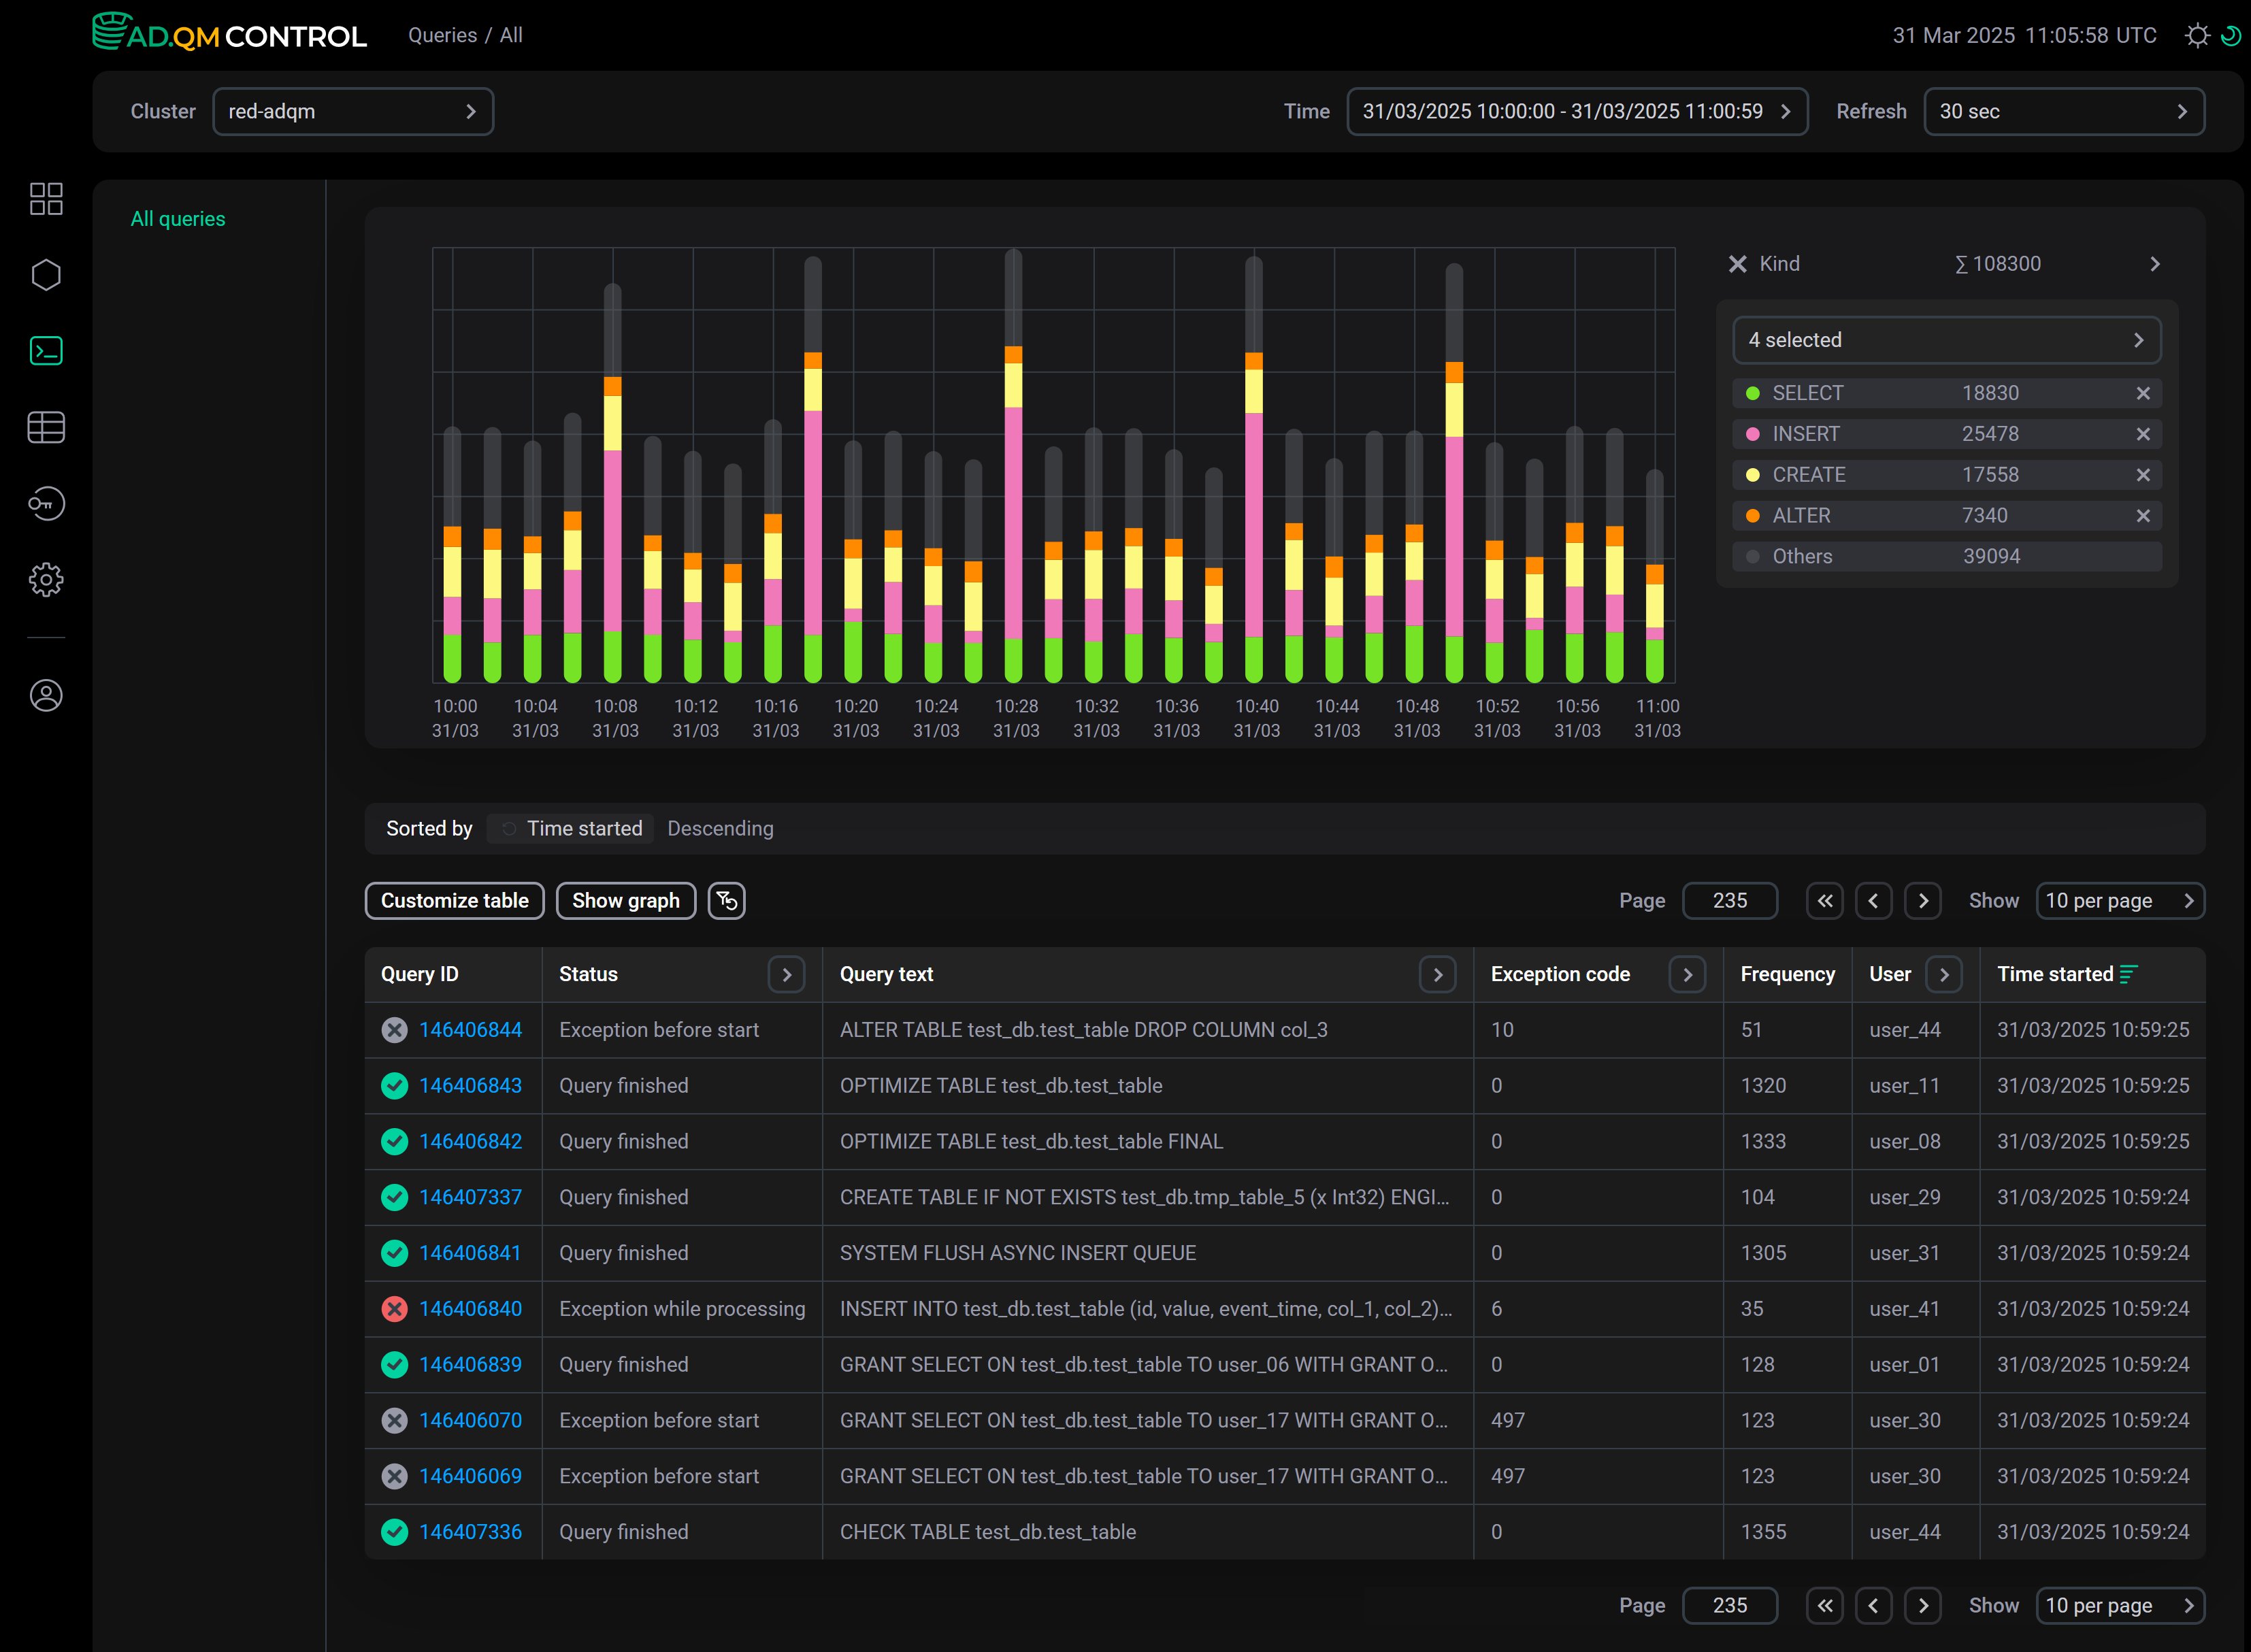
Kind
On the Kind graph, you can see how many queries of different types were executed — select the required query types using the drop-down list to the right of the graph.
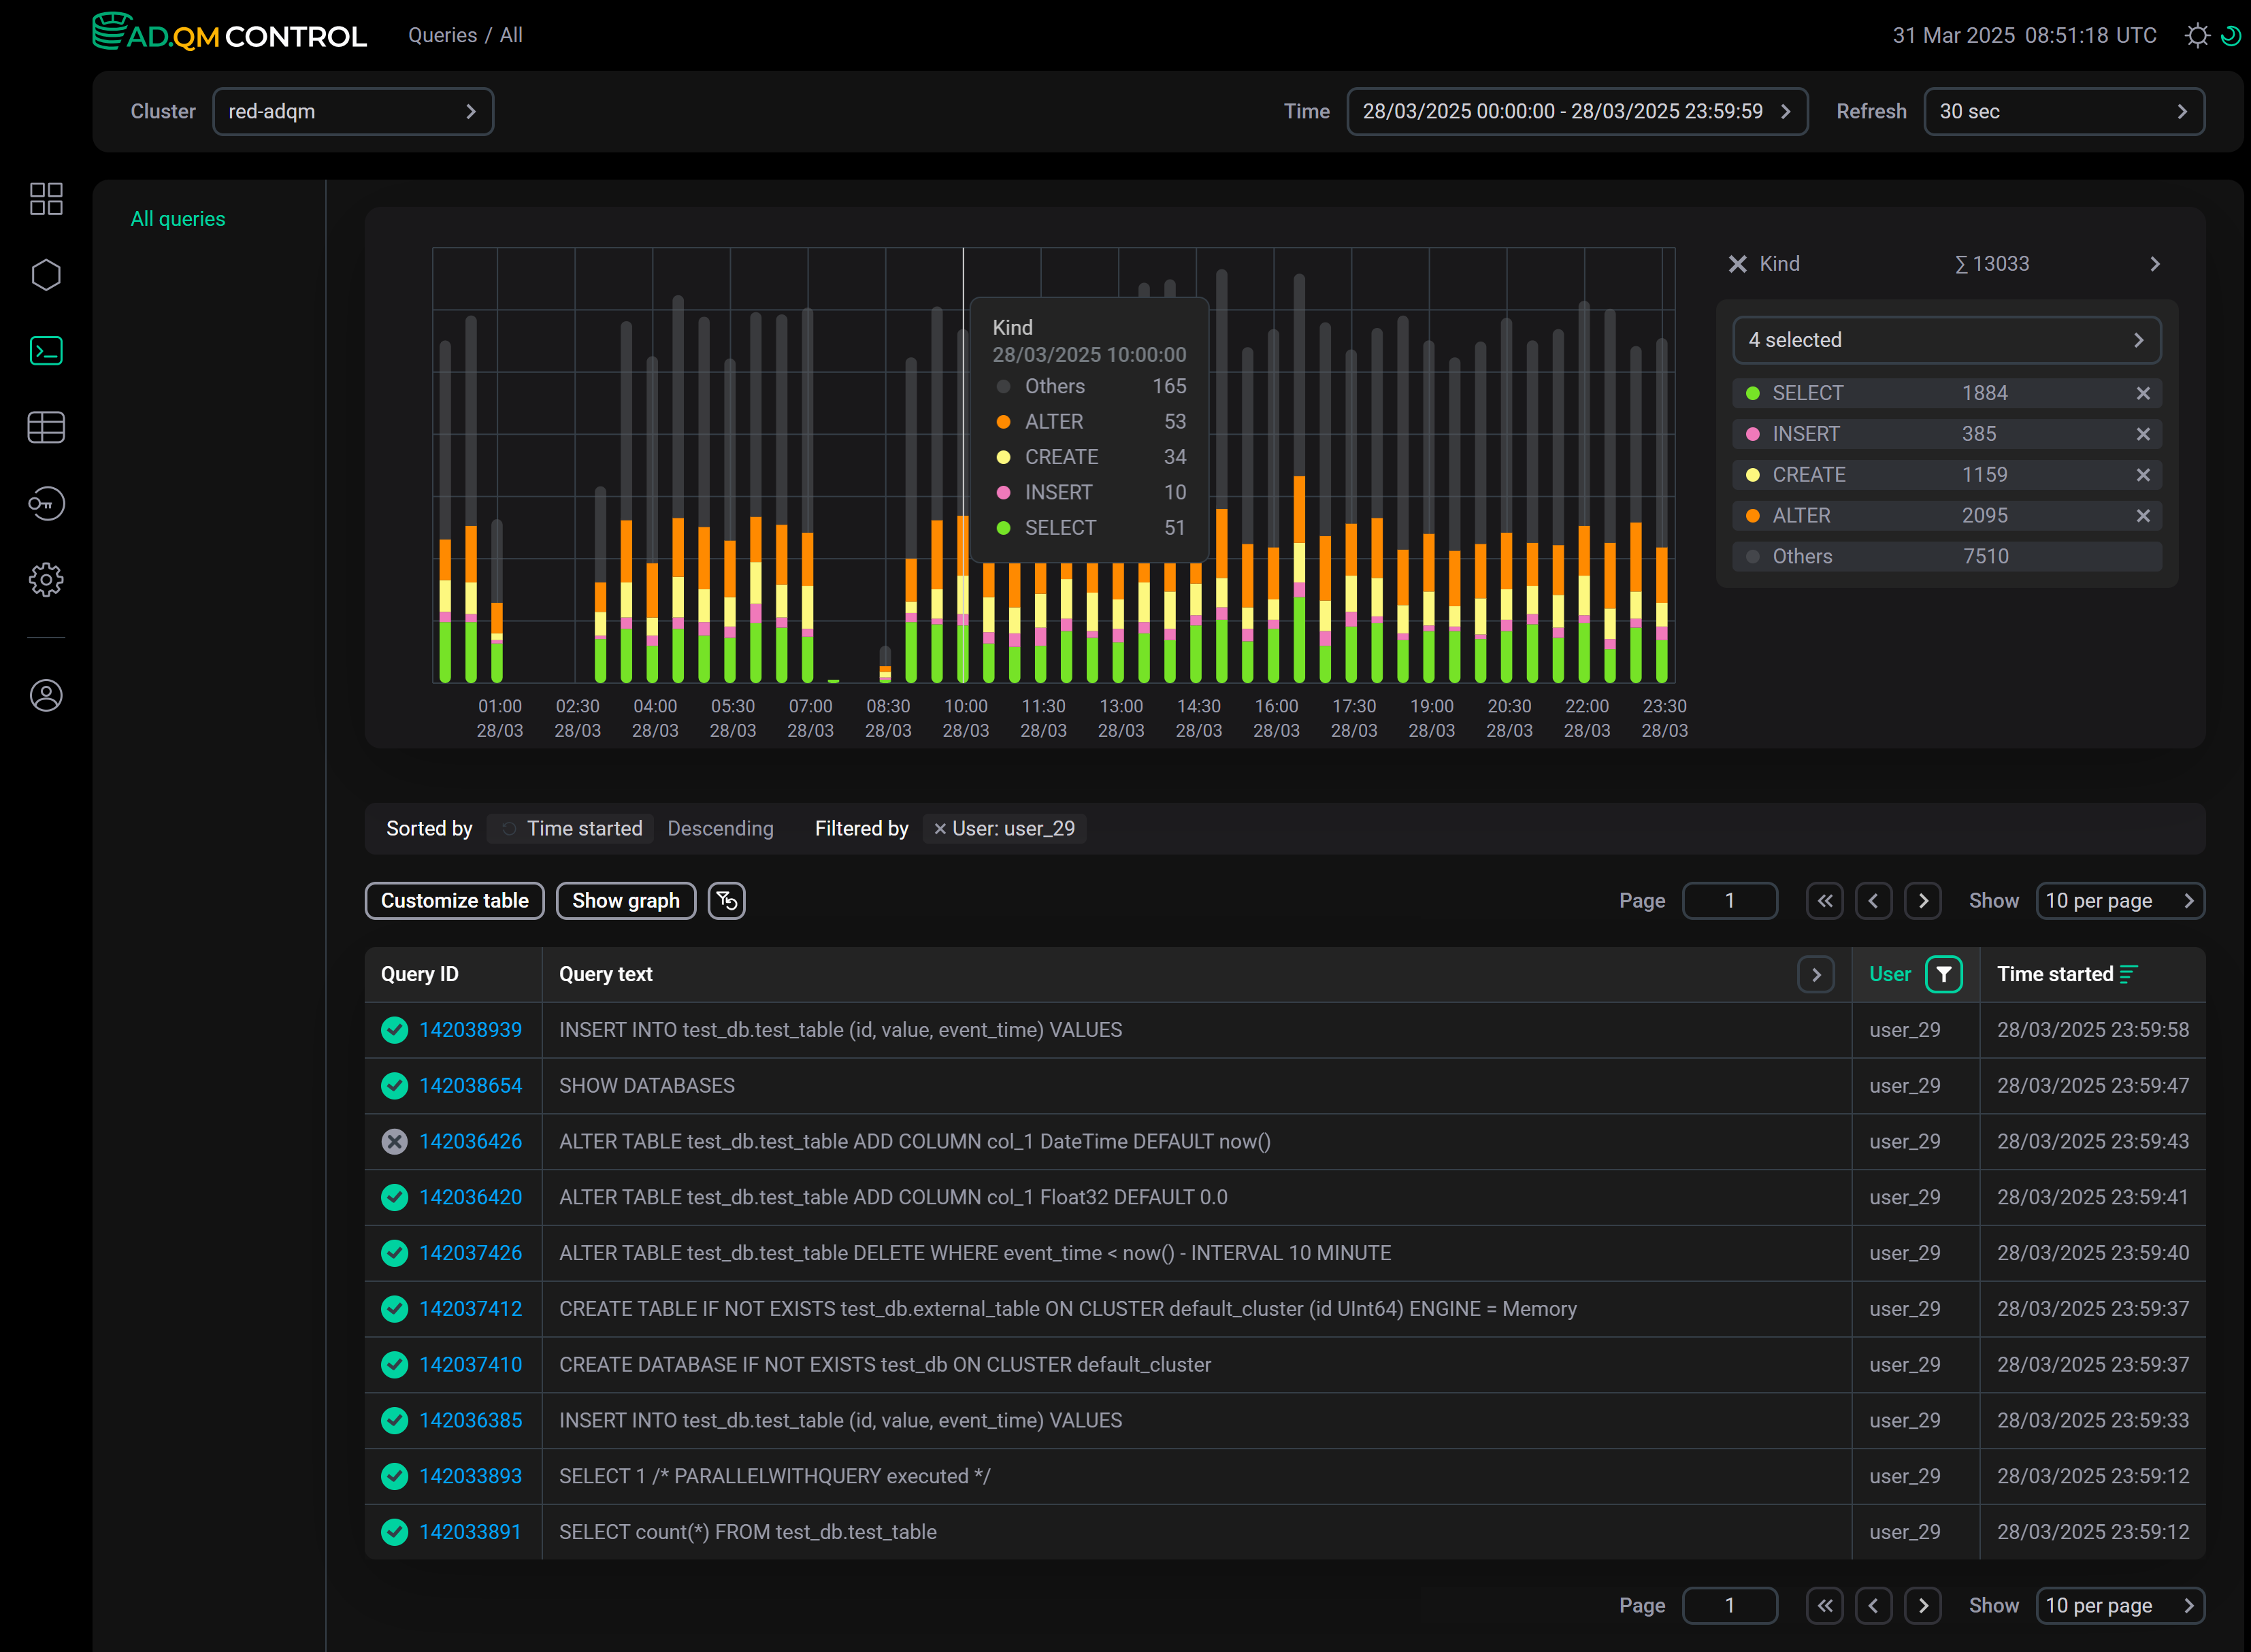
The graph is built according to the filters set in the table of queries. For example, the graph above shows the number of queries performed by the user_29 user for the selected time period.
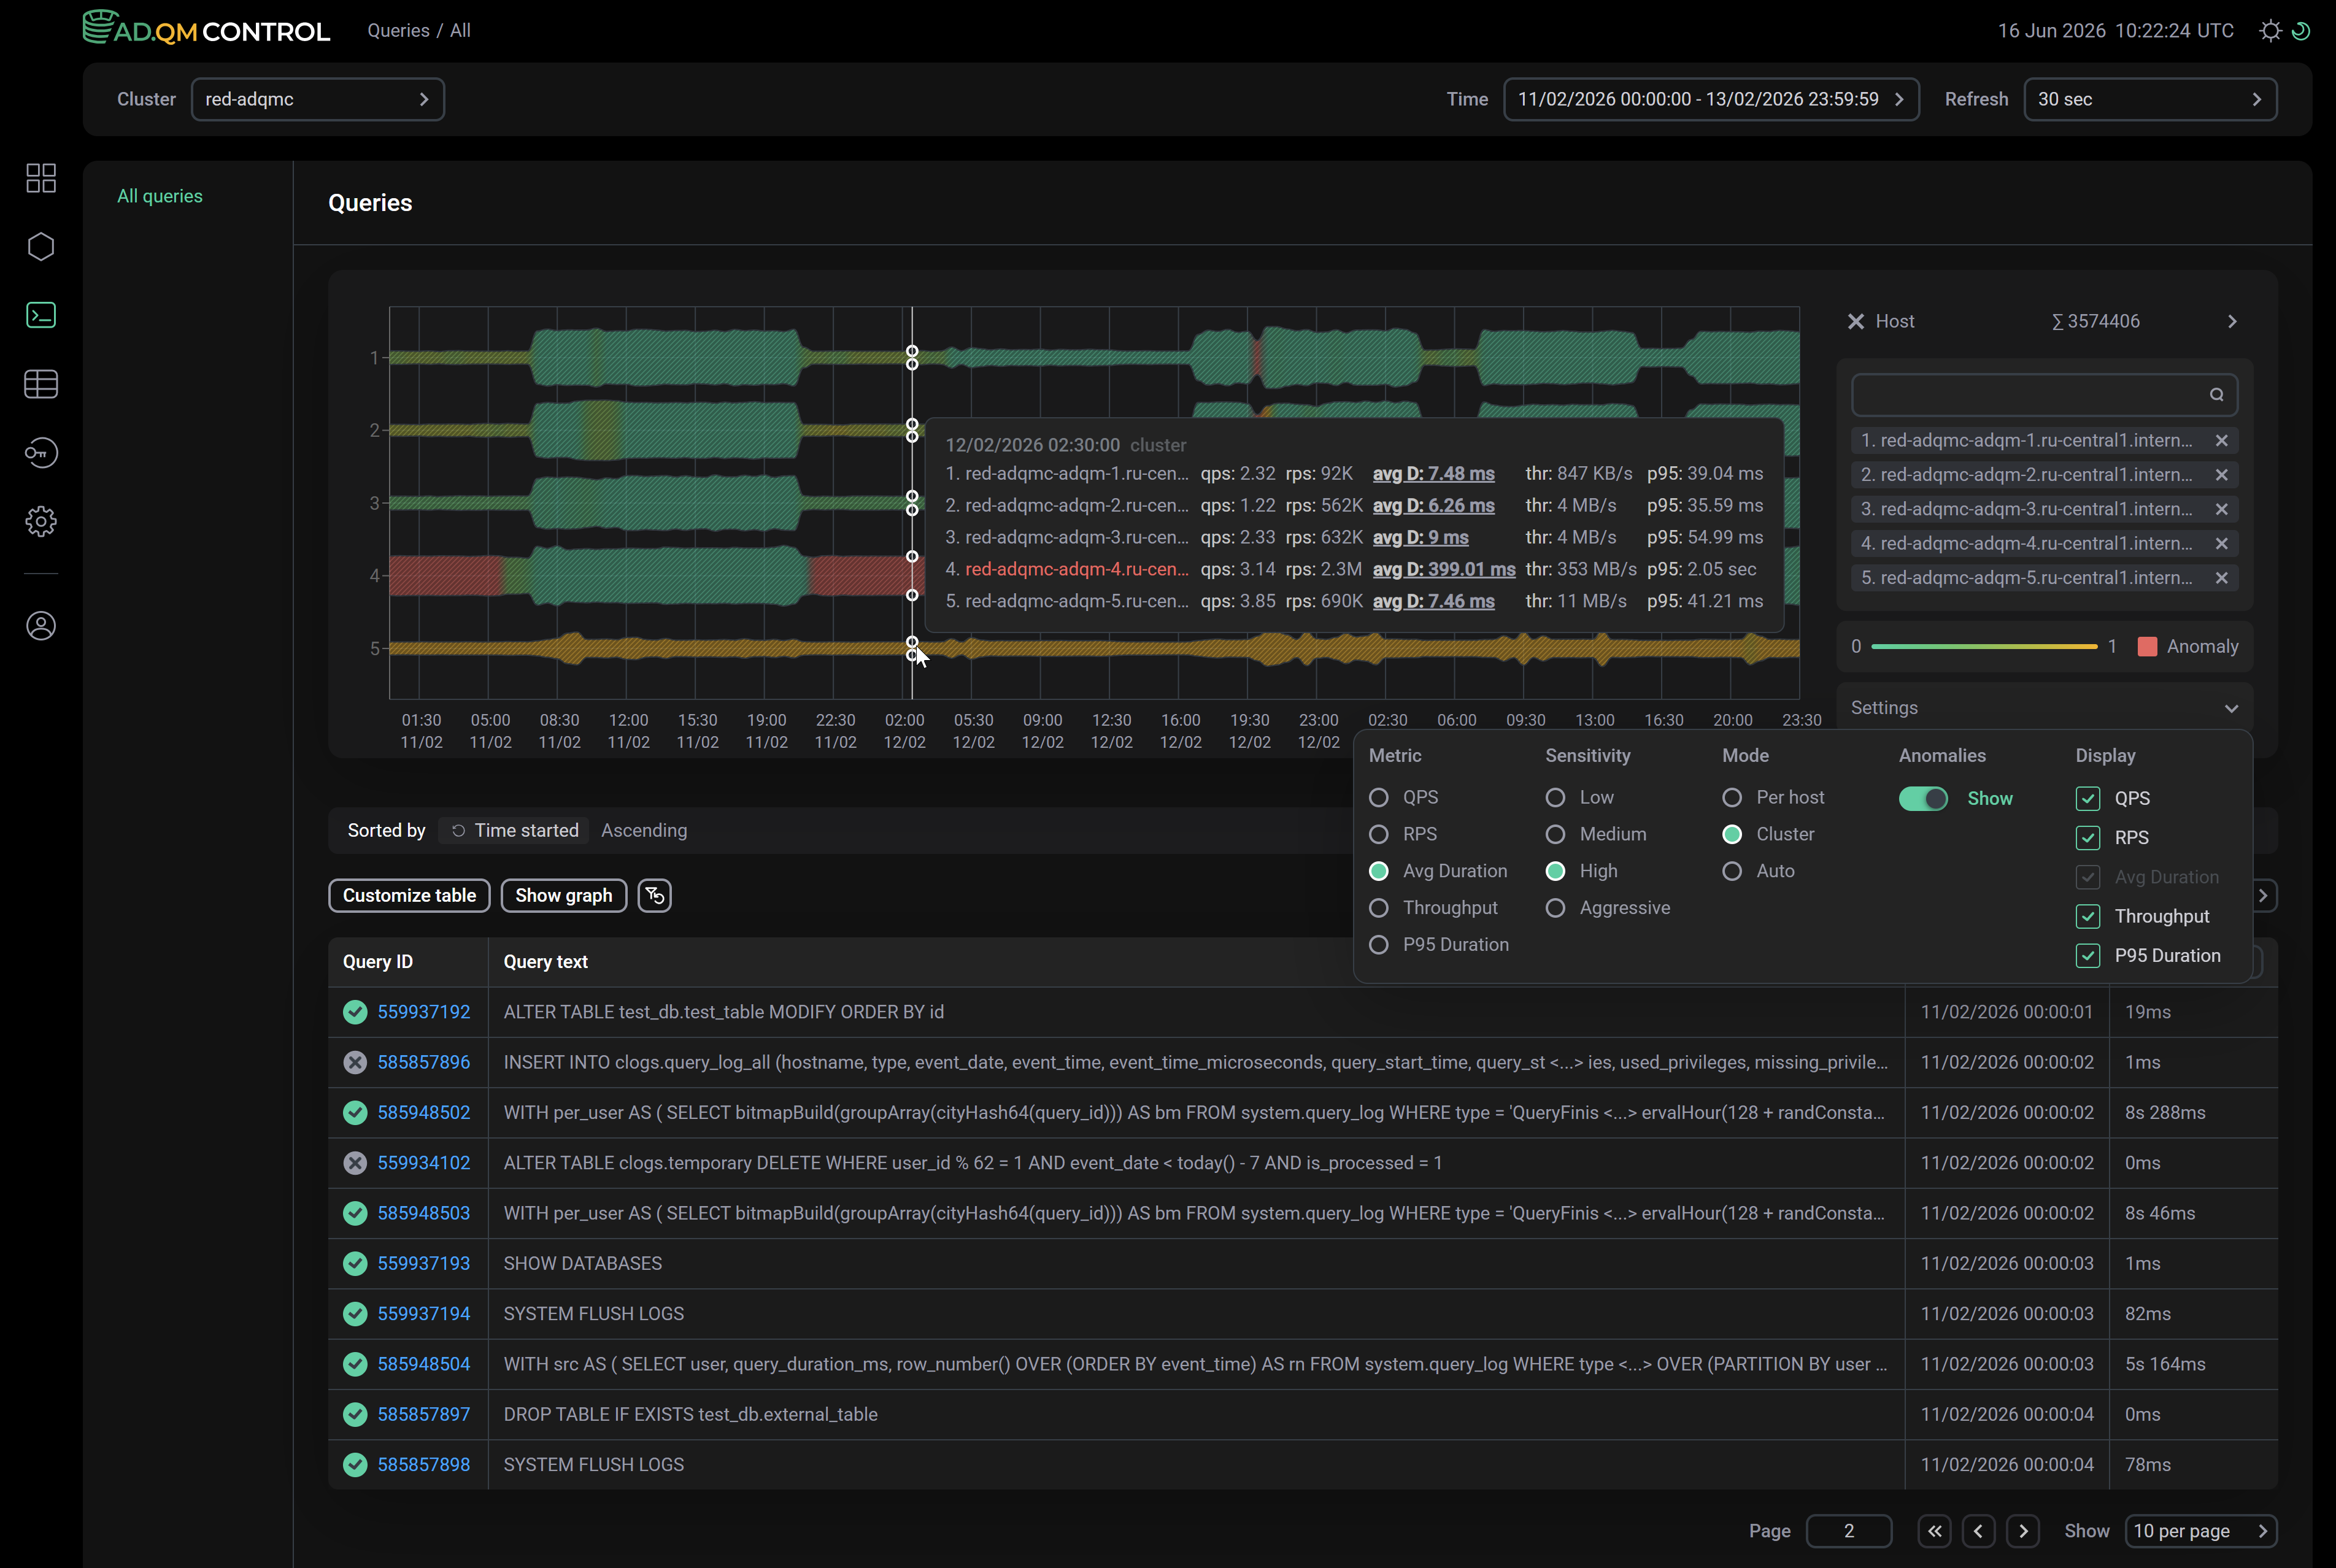
Host
Using the Host graph, you can analyze the load on ADQM cluster hosts and find potential anomalies in their work on executing database queries. In this context, an anomaly is a deviation in the value of a metric at a certain point in time compared to its values within the host’s operation over a selected time period or compared to the values of this metric at the same time on other hosts. Values of the metric being analyzed are shown as the width of the graph line. Anomalies are highlighted in red (if the corresponding option is enabled in the graph settings — see the description of the settings below). The color gradient of the graph line from green to yellow indicates the "level of confidence" in the presence of an anomaly.
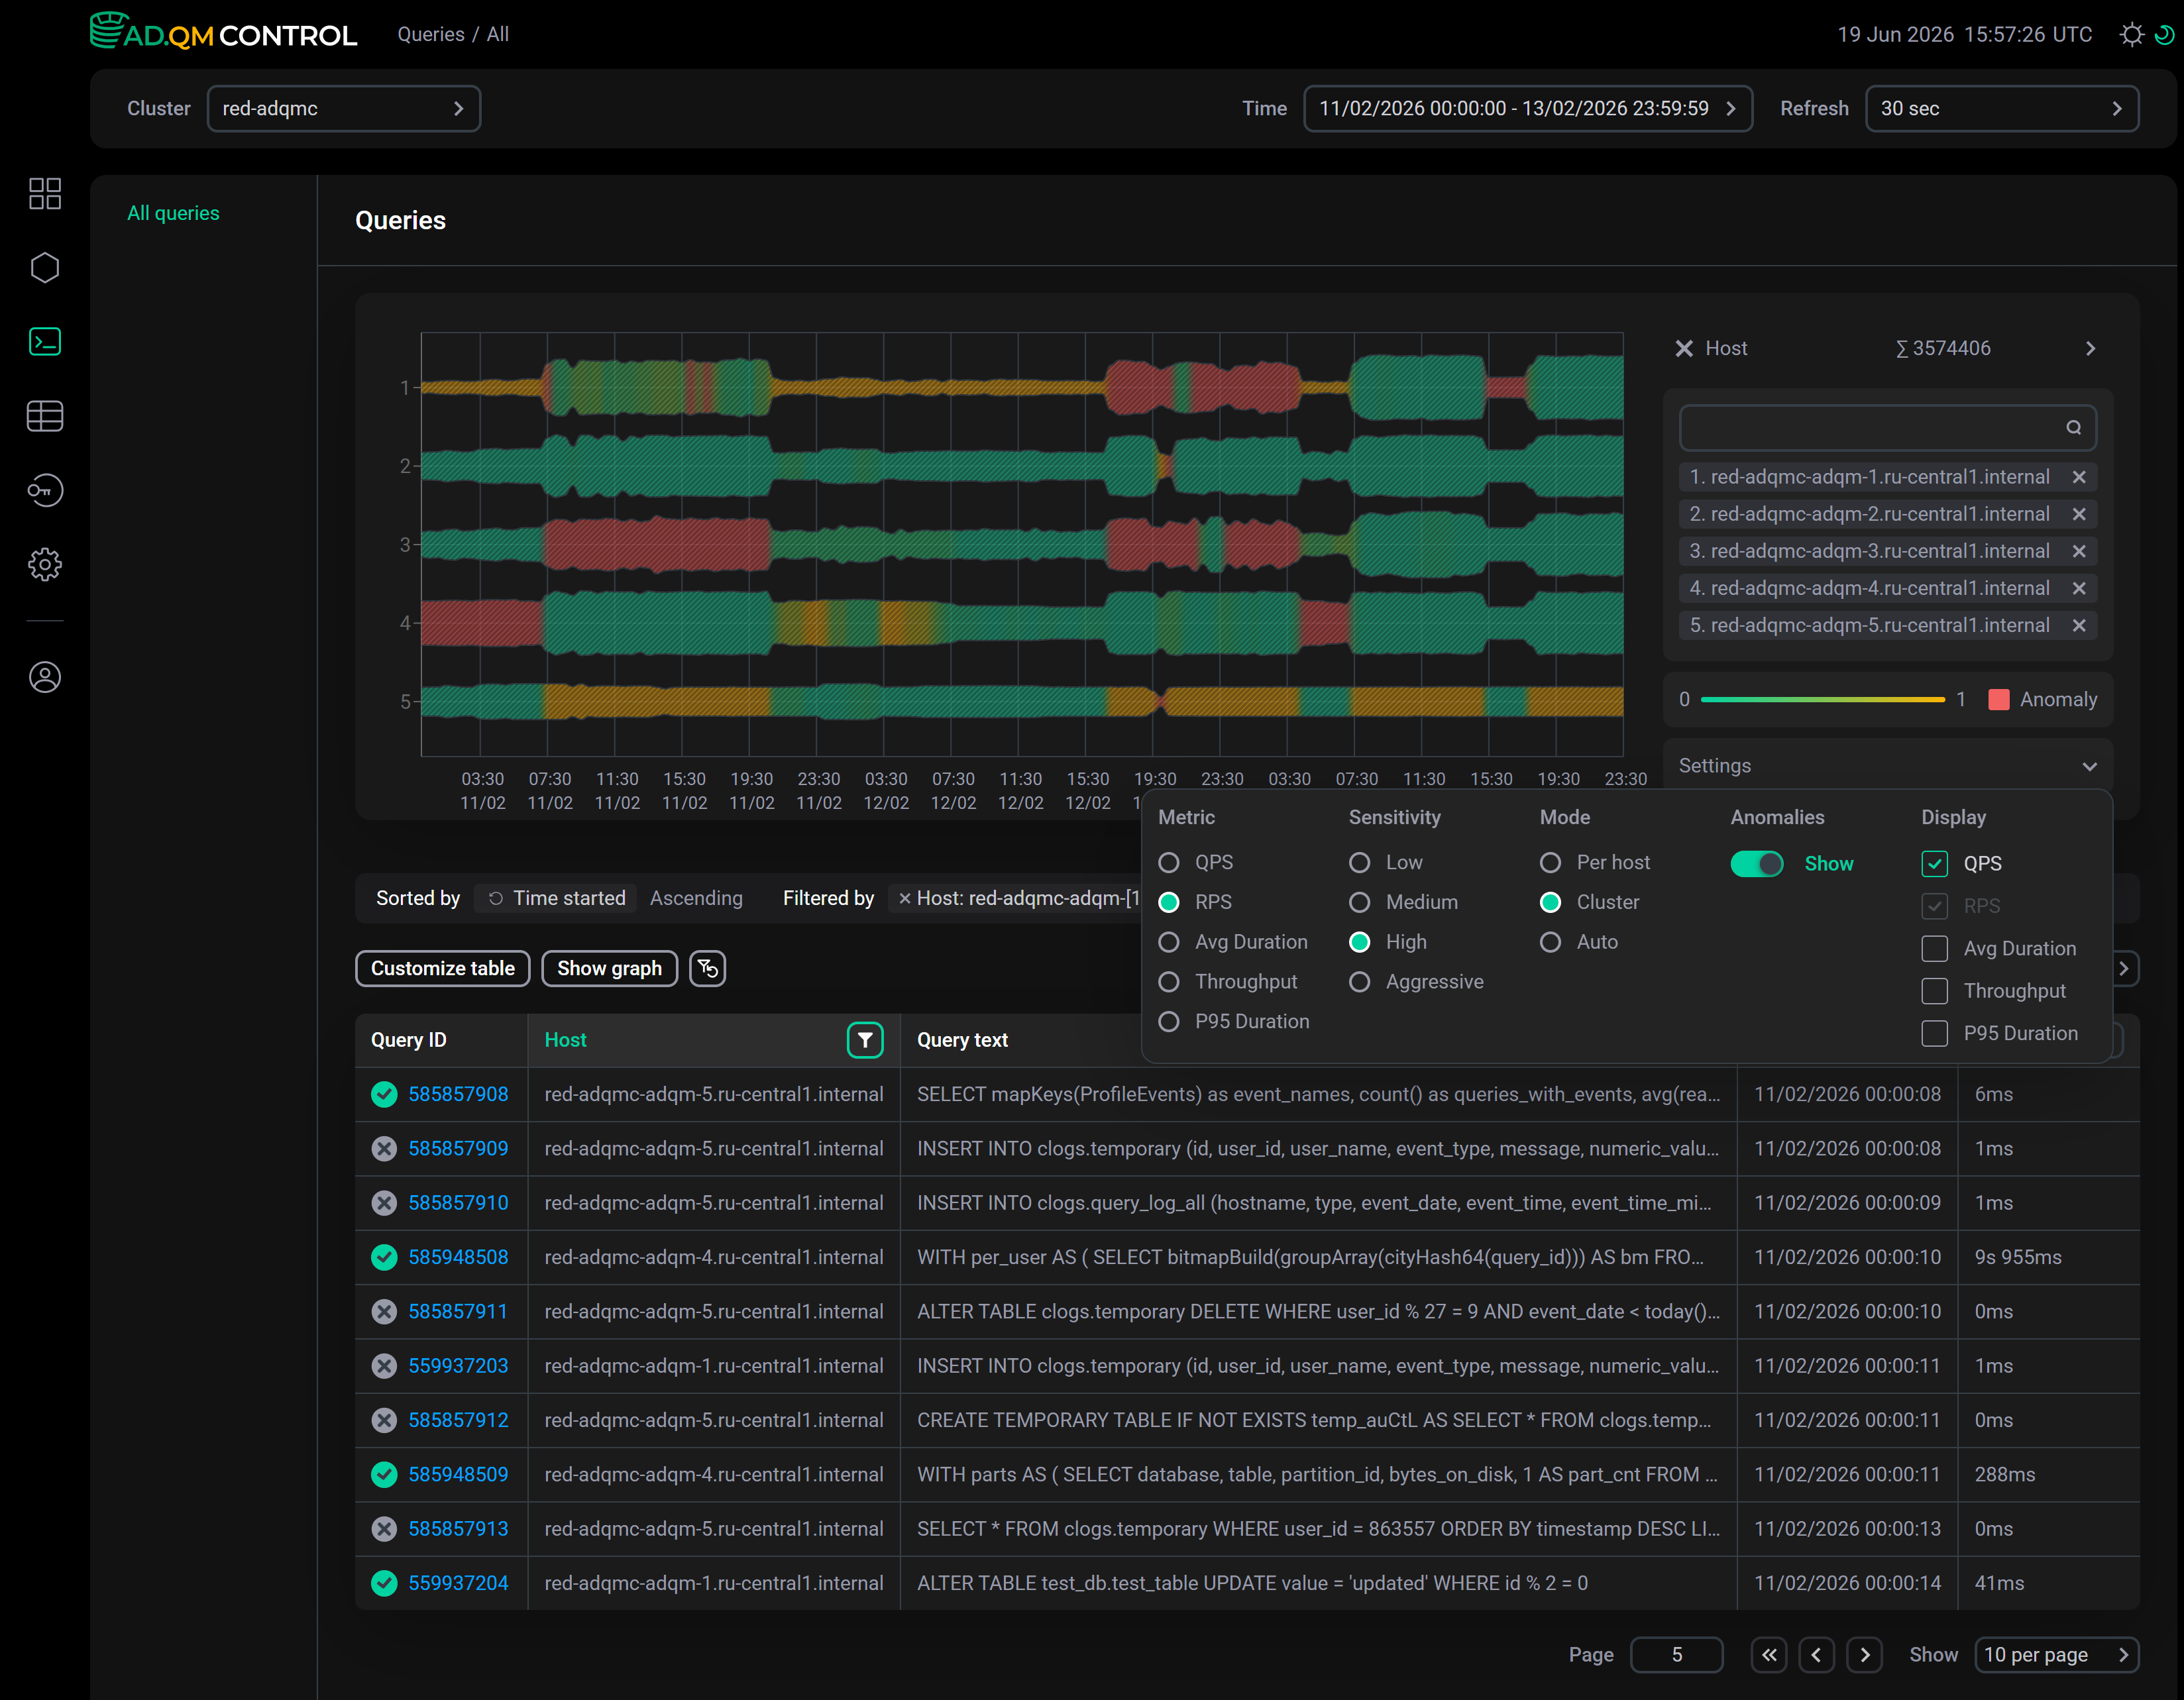
The graph is built for the hosts selected in the Host column filter. You can also manage the list of selected hosts in the panel to the right of the graph. Up to 8 hosts can be added to the graph simultaneously. If there are more than 8 hosts in a cluster and they are not filtered, the graph will be built for the first 8 hosts in alphabetical order. If you need to display other hosts on the graph, remove some selected hosts from the list to add the necessary ones instead.
The Settings menu to the right of the graph (click it to expand) contains the following settings:
-
Metric — metric on which the graph is based. You can select one of the metrics:
-
QPS — number of queries executed per second;
-
RPS — number of data rows processed per second (when performing read and write operations);
-
Avg Duration — average query execution time;
-
Throughput — amount of data processed per second (when performing read and write operations);
-
P95 Duration — 95th percentile of query execution time.
-
-
Sensitivity — level of sensitivity to deviations in metric values when detecting anomalies (for example, Aggressive — even a minor deviation in the metric value is considered an anomaly; Low — only a large deviation in the metric value is considered an anomaly). For each sensitivity level, the evaluation of metric values and the detection of anomalies are performed separately (independently of the calculations made for the previously selected sensitivity level).
-
Mode — metric value evaluation mode. Available options:
-
Per host — host metric values are compared over a selected time interval (a metric value is considered normal if it is within the range that is "normal" for the host within the selected time interval);
-
Cluster — host metric values are compared with the values of the same metric on the other hosts;
-
Auto — set of values of all metrics is evaluated.
-
-
Anomalies — the Show switch turns on/off highlighting anomalies in red on the graph.
-
Display — metrics to be displayed in a tooltip that appears when you hover over the graph. The metric on which the graph is based is shown in the tooltip anyway — its visibility cannot be controlled via Display. In the Auto mode, the tooltip displays all metrics.