

Cluster metrics
The Cluster metrics page of the ADQM Control web interface is designed to display information about an ADQM cluster state based on values of metrics collected from the cluster hosts. The page includes three tabs described below: Heat map, Incidents, and Alerts history.
To select data to be shown on the Cluster metrics page, you can use the fields at the top of the screen:
-
Cluster — ADQM cluster for which information should be displayed.
-
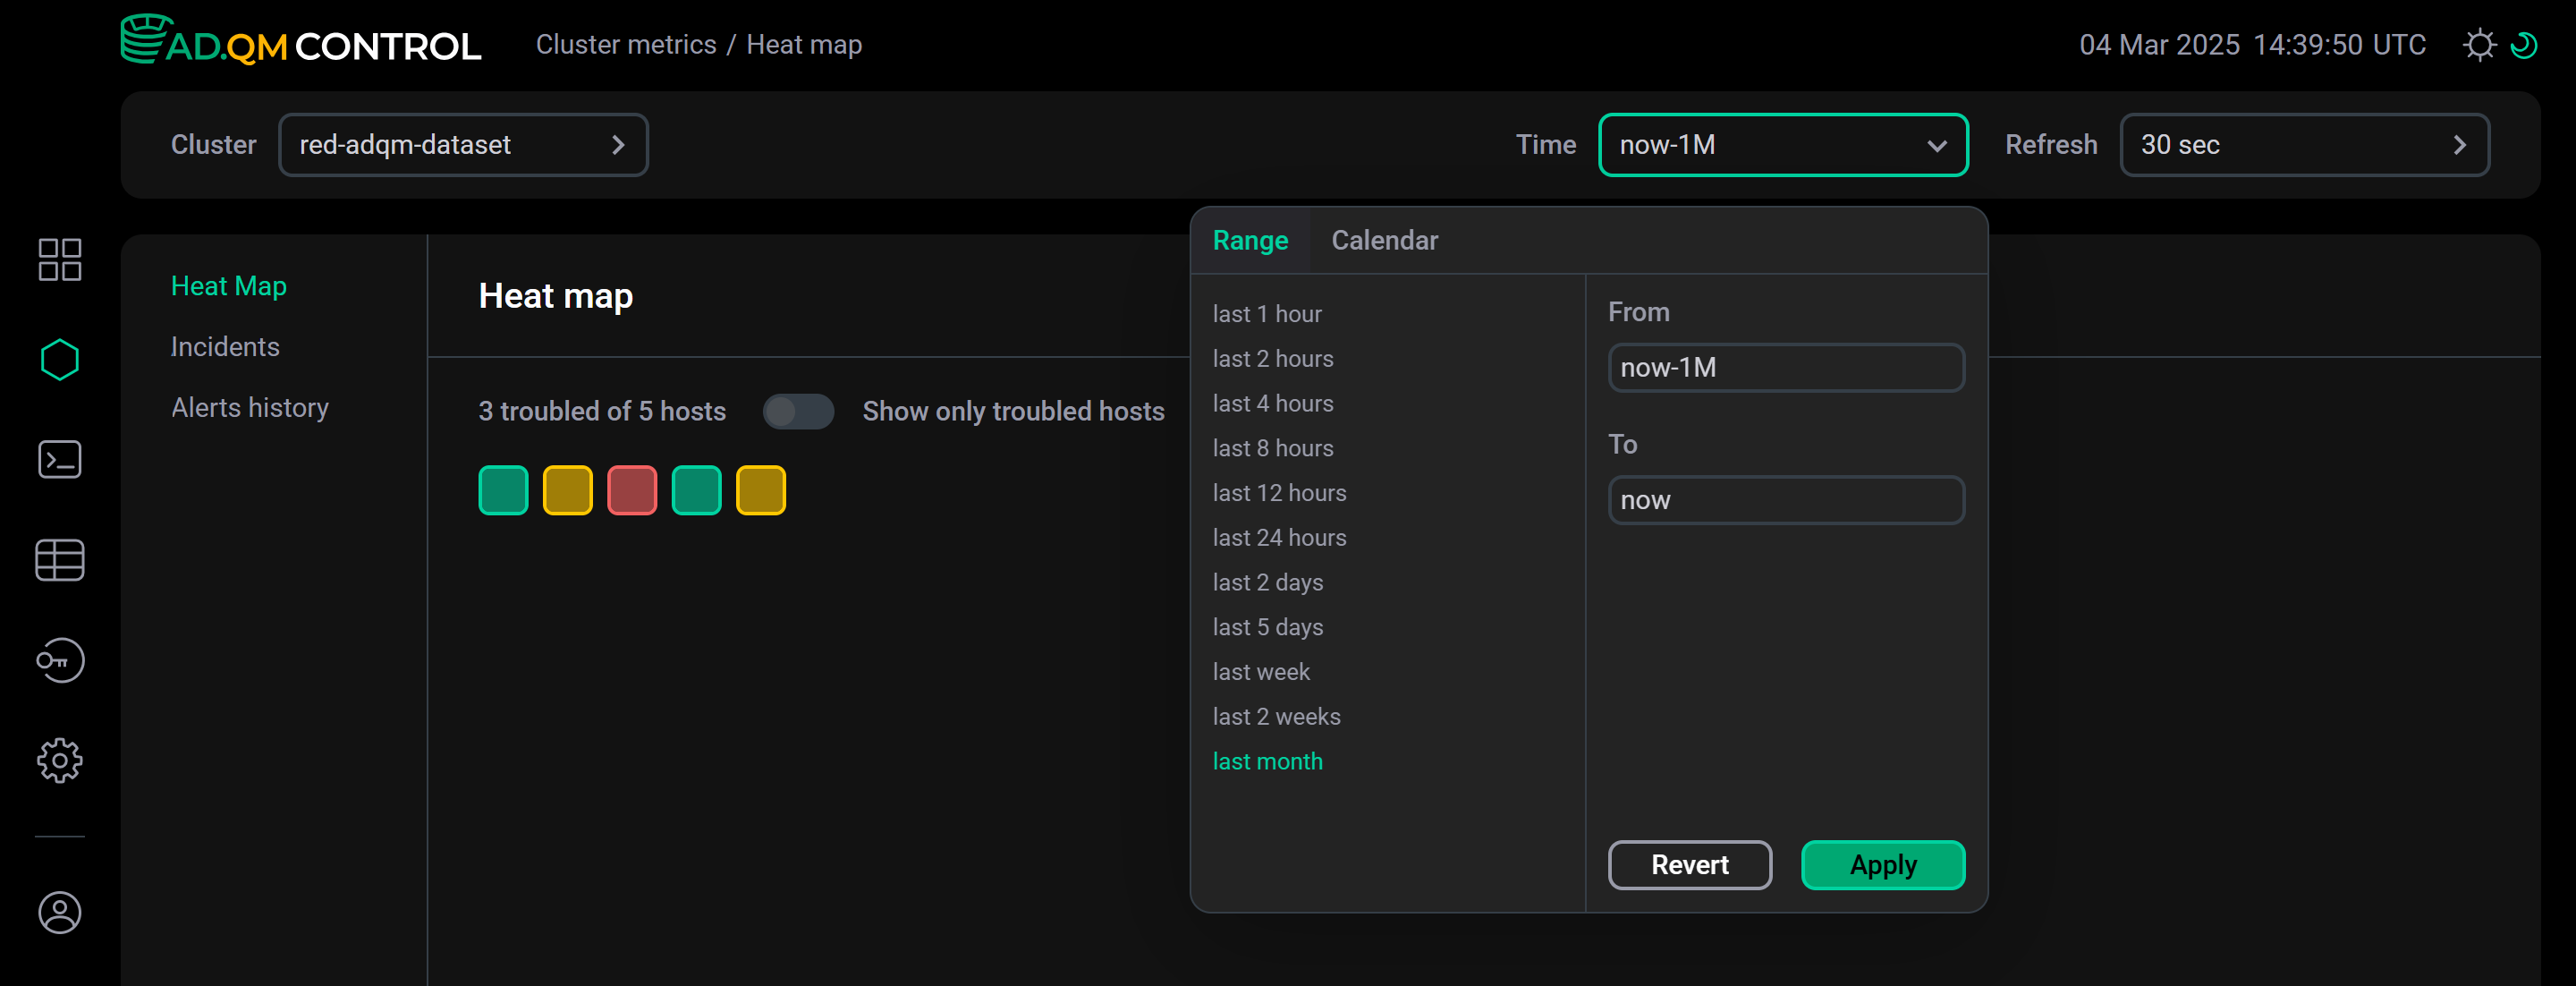
Time — time period for which information is required. In the window that opens when you click the field, you can select an interval from the offered options on the Range tab or set a custom time range on the Calendar tab.
-
Refresh — frequency of data updates.
Heat Map
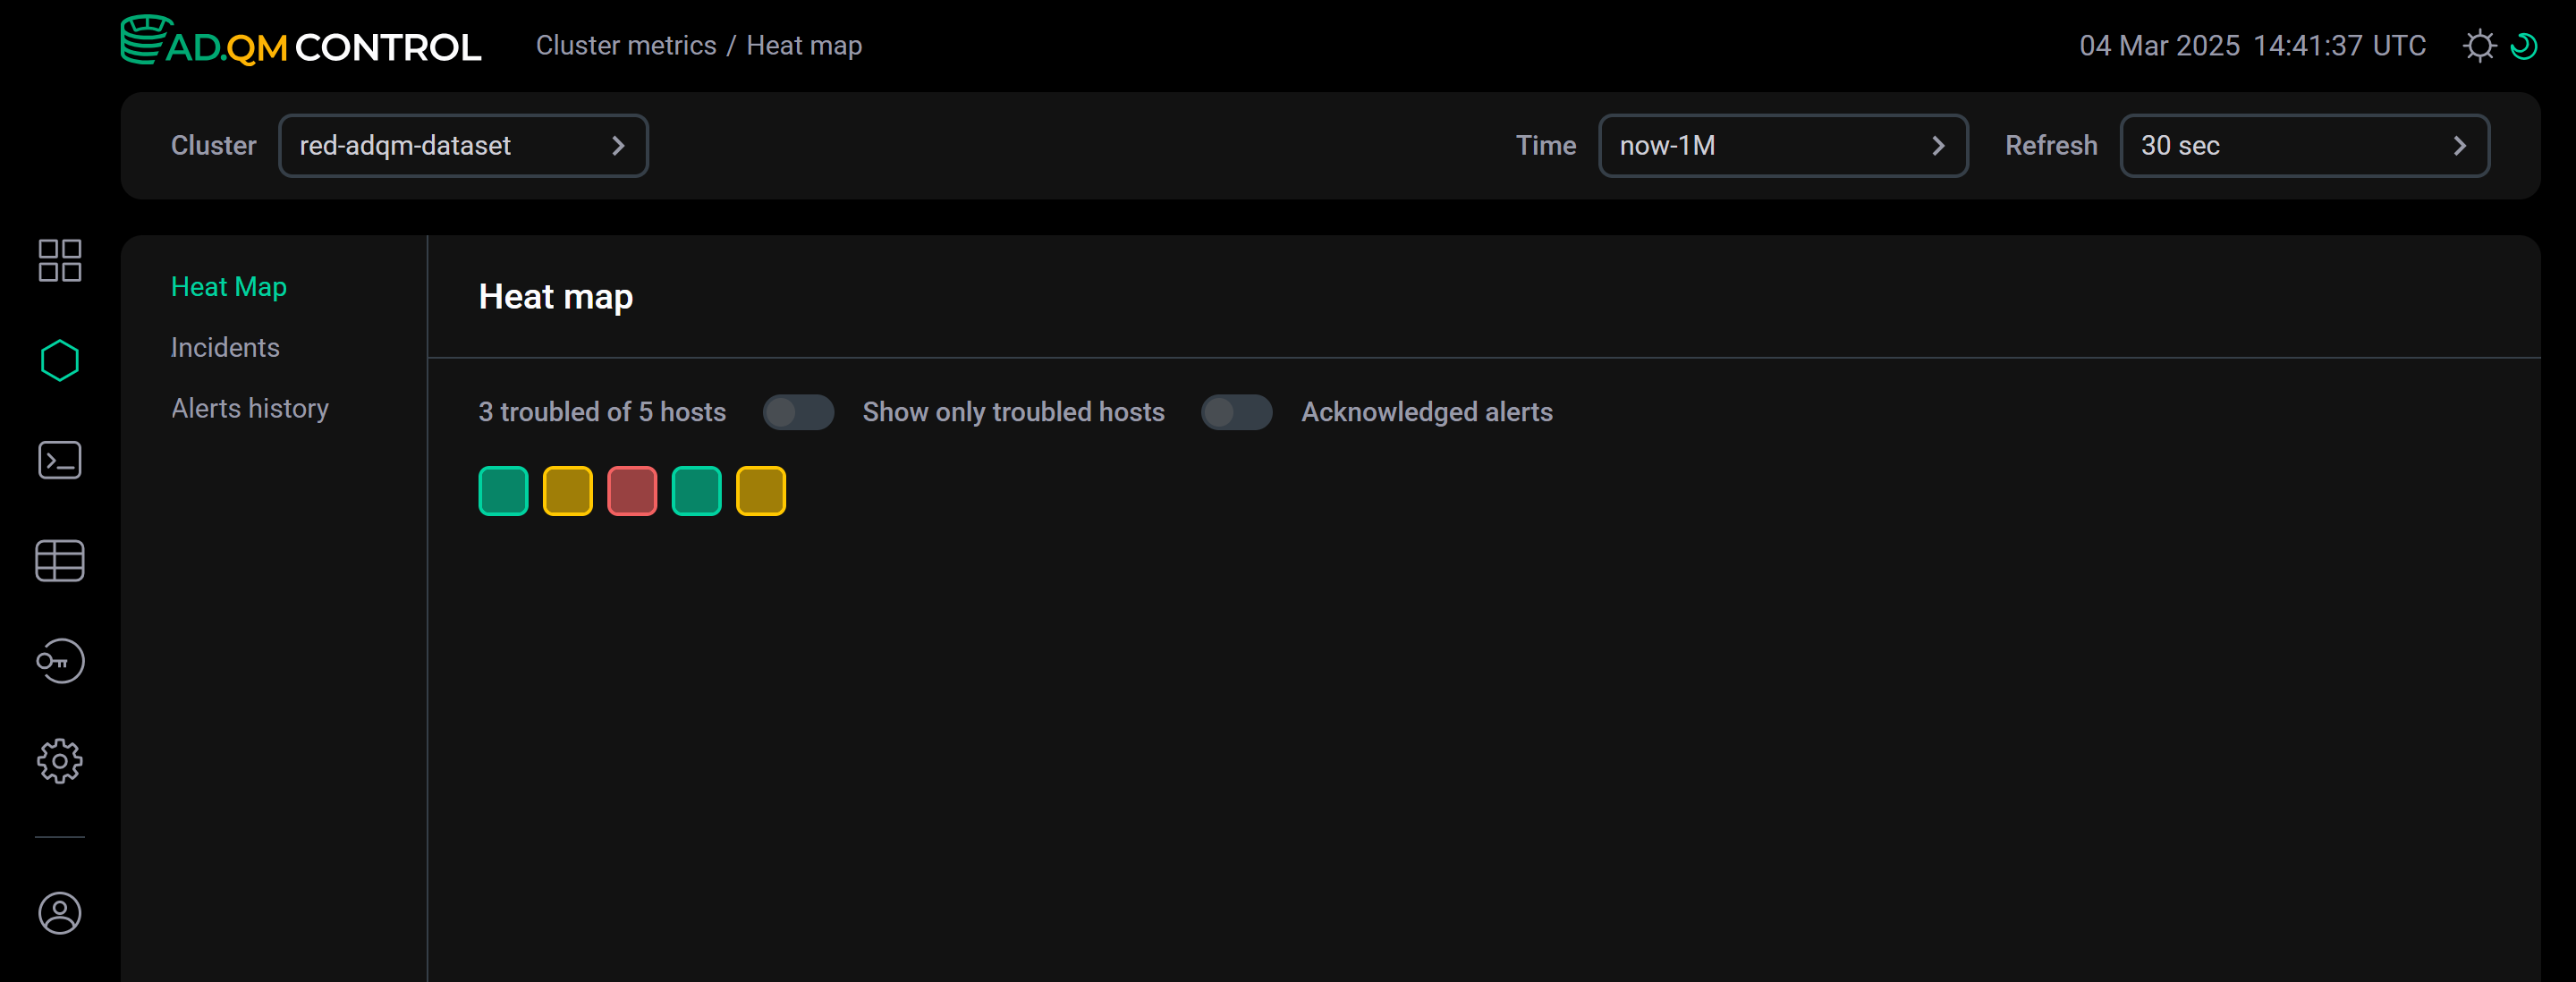
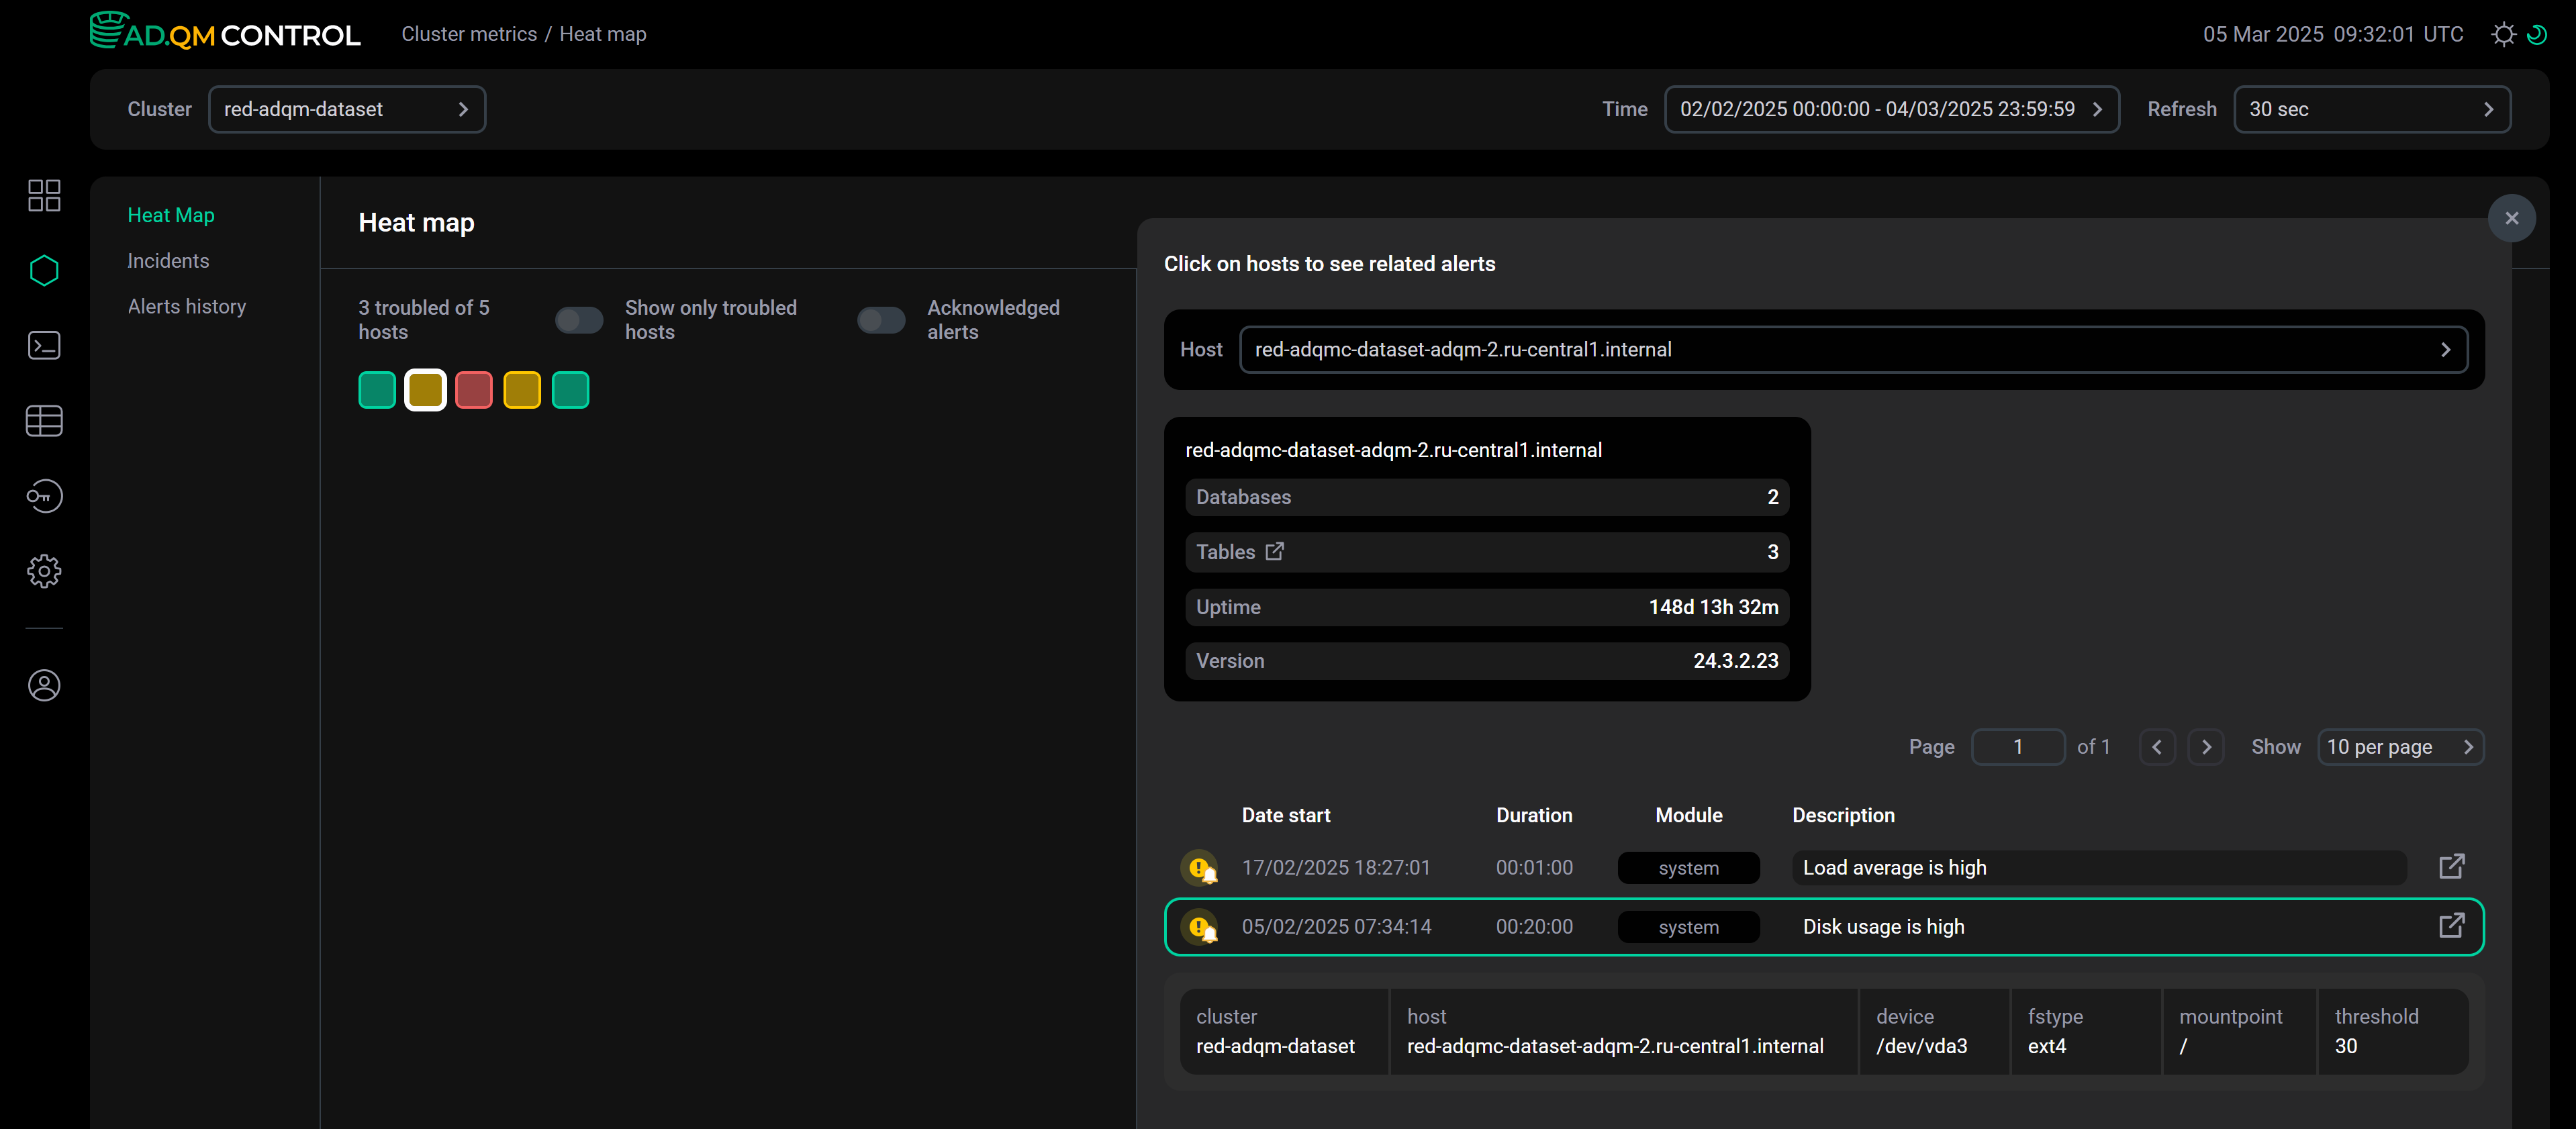
A heat map visualizes information about states of all hosts in an ADQM cluster — each host is drawn as a square and its color indicates the system state.
Host state
ADQM Control determines a host state and assigns the corresponding color to it in the Heat map matrix based on existing alerts about host issues:
 — there are no alerts about any issues on a host in ADQM Control (a healthy host).
 — only potential issues have been detected on a host (for example, the increase in the values of some system metrics), but they are not yet critical. Appropriate warning alerts about these issues have been generated and remain relevant in ADQM Control.
 — at least one critical issue has been detected on a host and the corresponding alert of the high-importance level about it exists in ADQM Control.
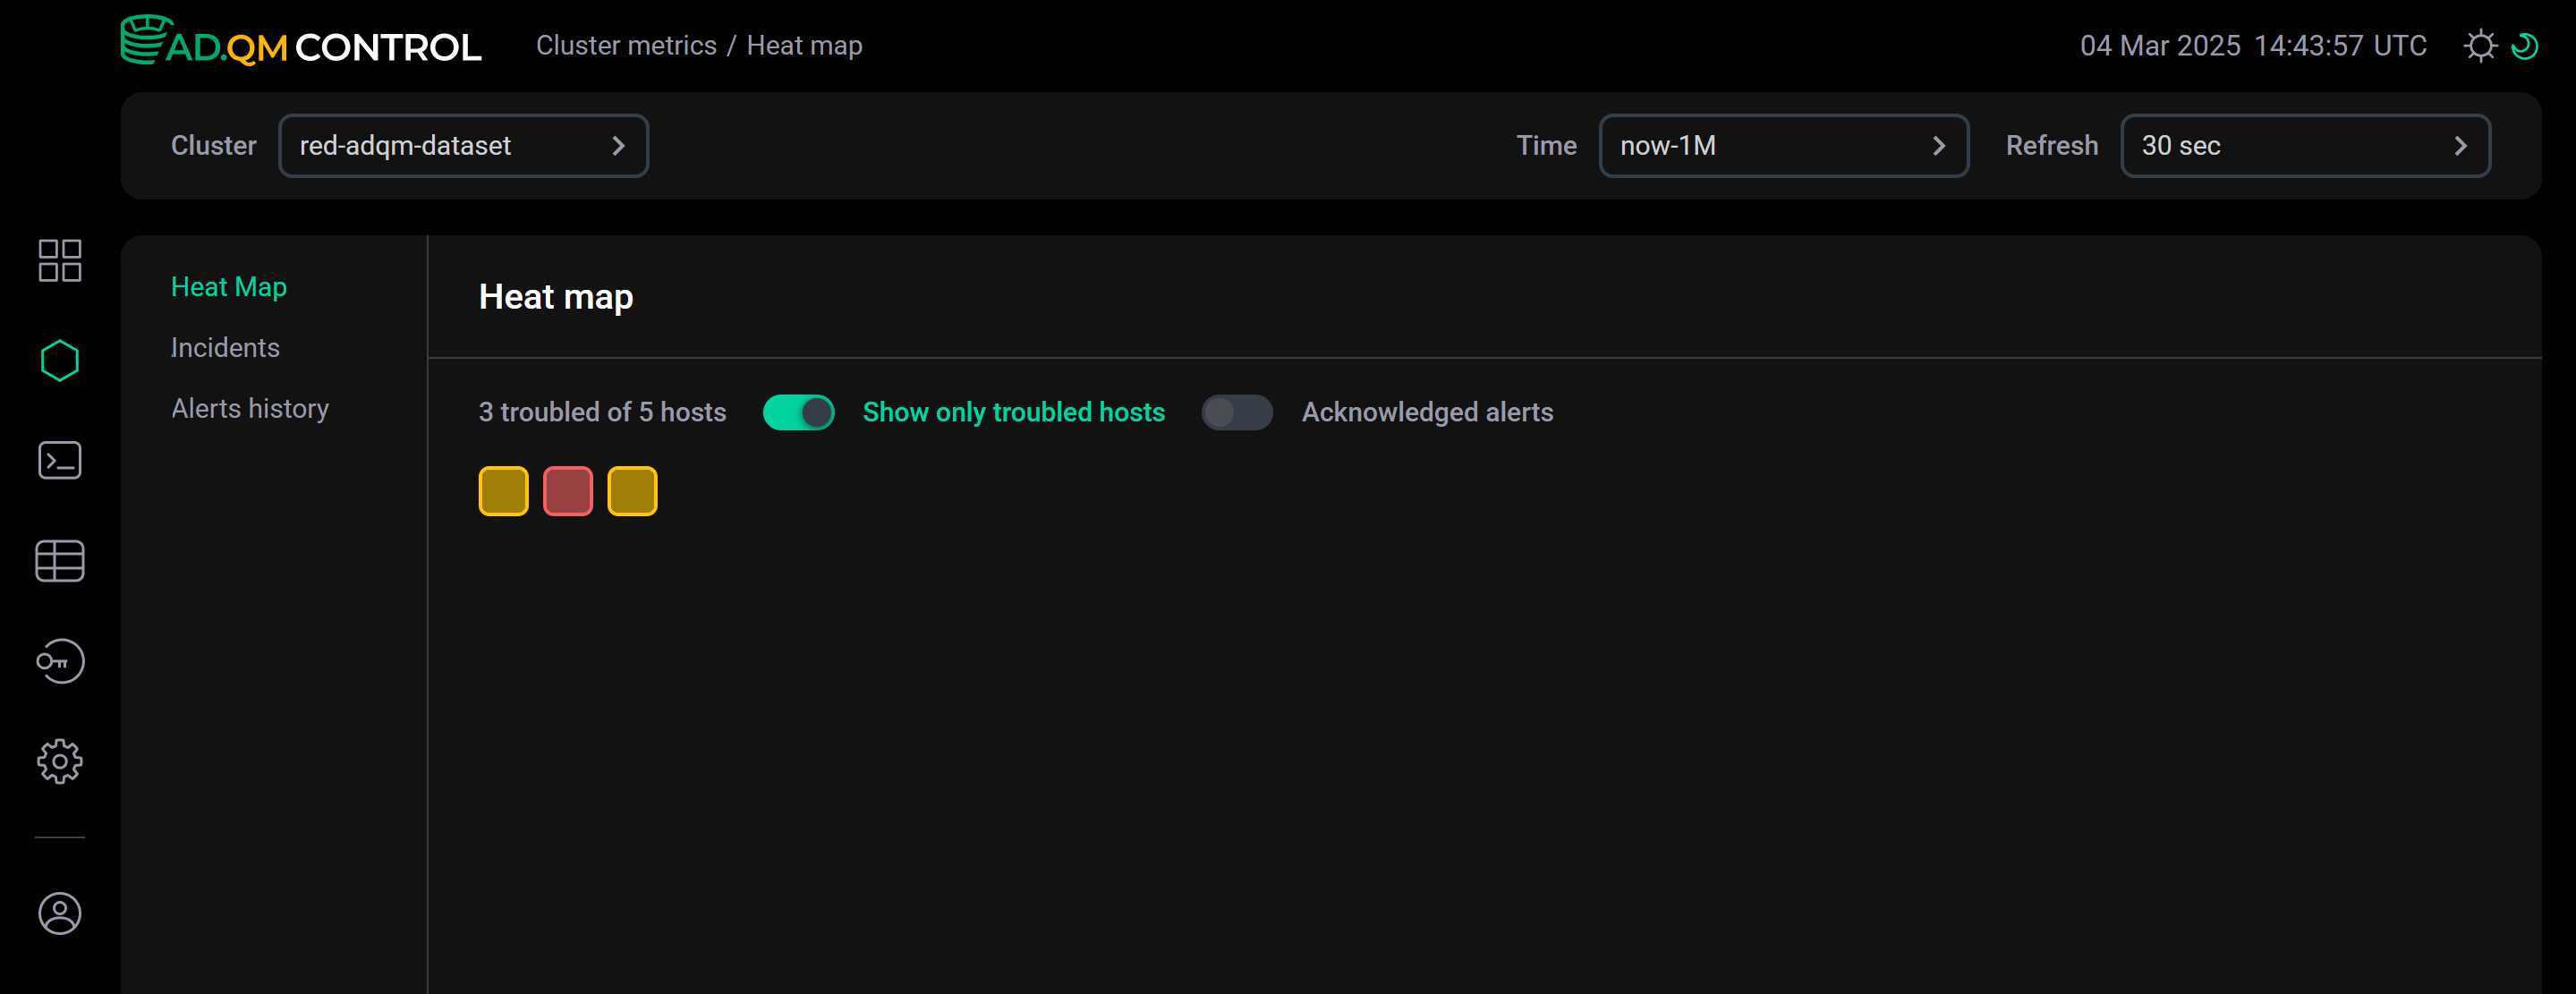
The Show only troubled hosts switch at the top of the Heat map tab allows you to configure the heat map so that it displays only troubled hosts.
The Acknowledged alerts option specifies which alerts about problems on hosts ADQM Control should take into account when creating the cluster heat map — all alerts generated during the selected time period or only those that are not marked as acknowledged. See the example in the Acknowledged alerts section.
Alerts related to a host
When you select one or more hosts by clicking them in the heat map, ADQM Control displays a table with a list of host-related alerts generated during the specified period of time. Depending on the Acknowledged alerts setting, the list includes all alerts or only alerts requiring analysis — see Acknowledged alerts for details. In the Host field above the table, you can change a set of hosts for which the list of alerts is displayed. There is also general information on each selected host where ClickHouse is installed: number of databases, number of tables, server uptime, and ClickHouse version.
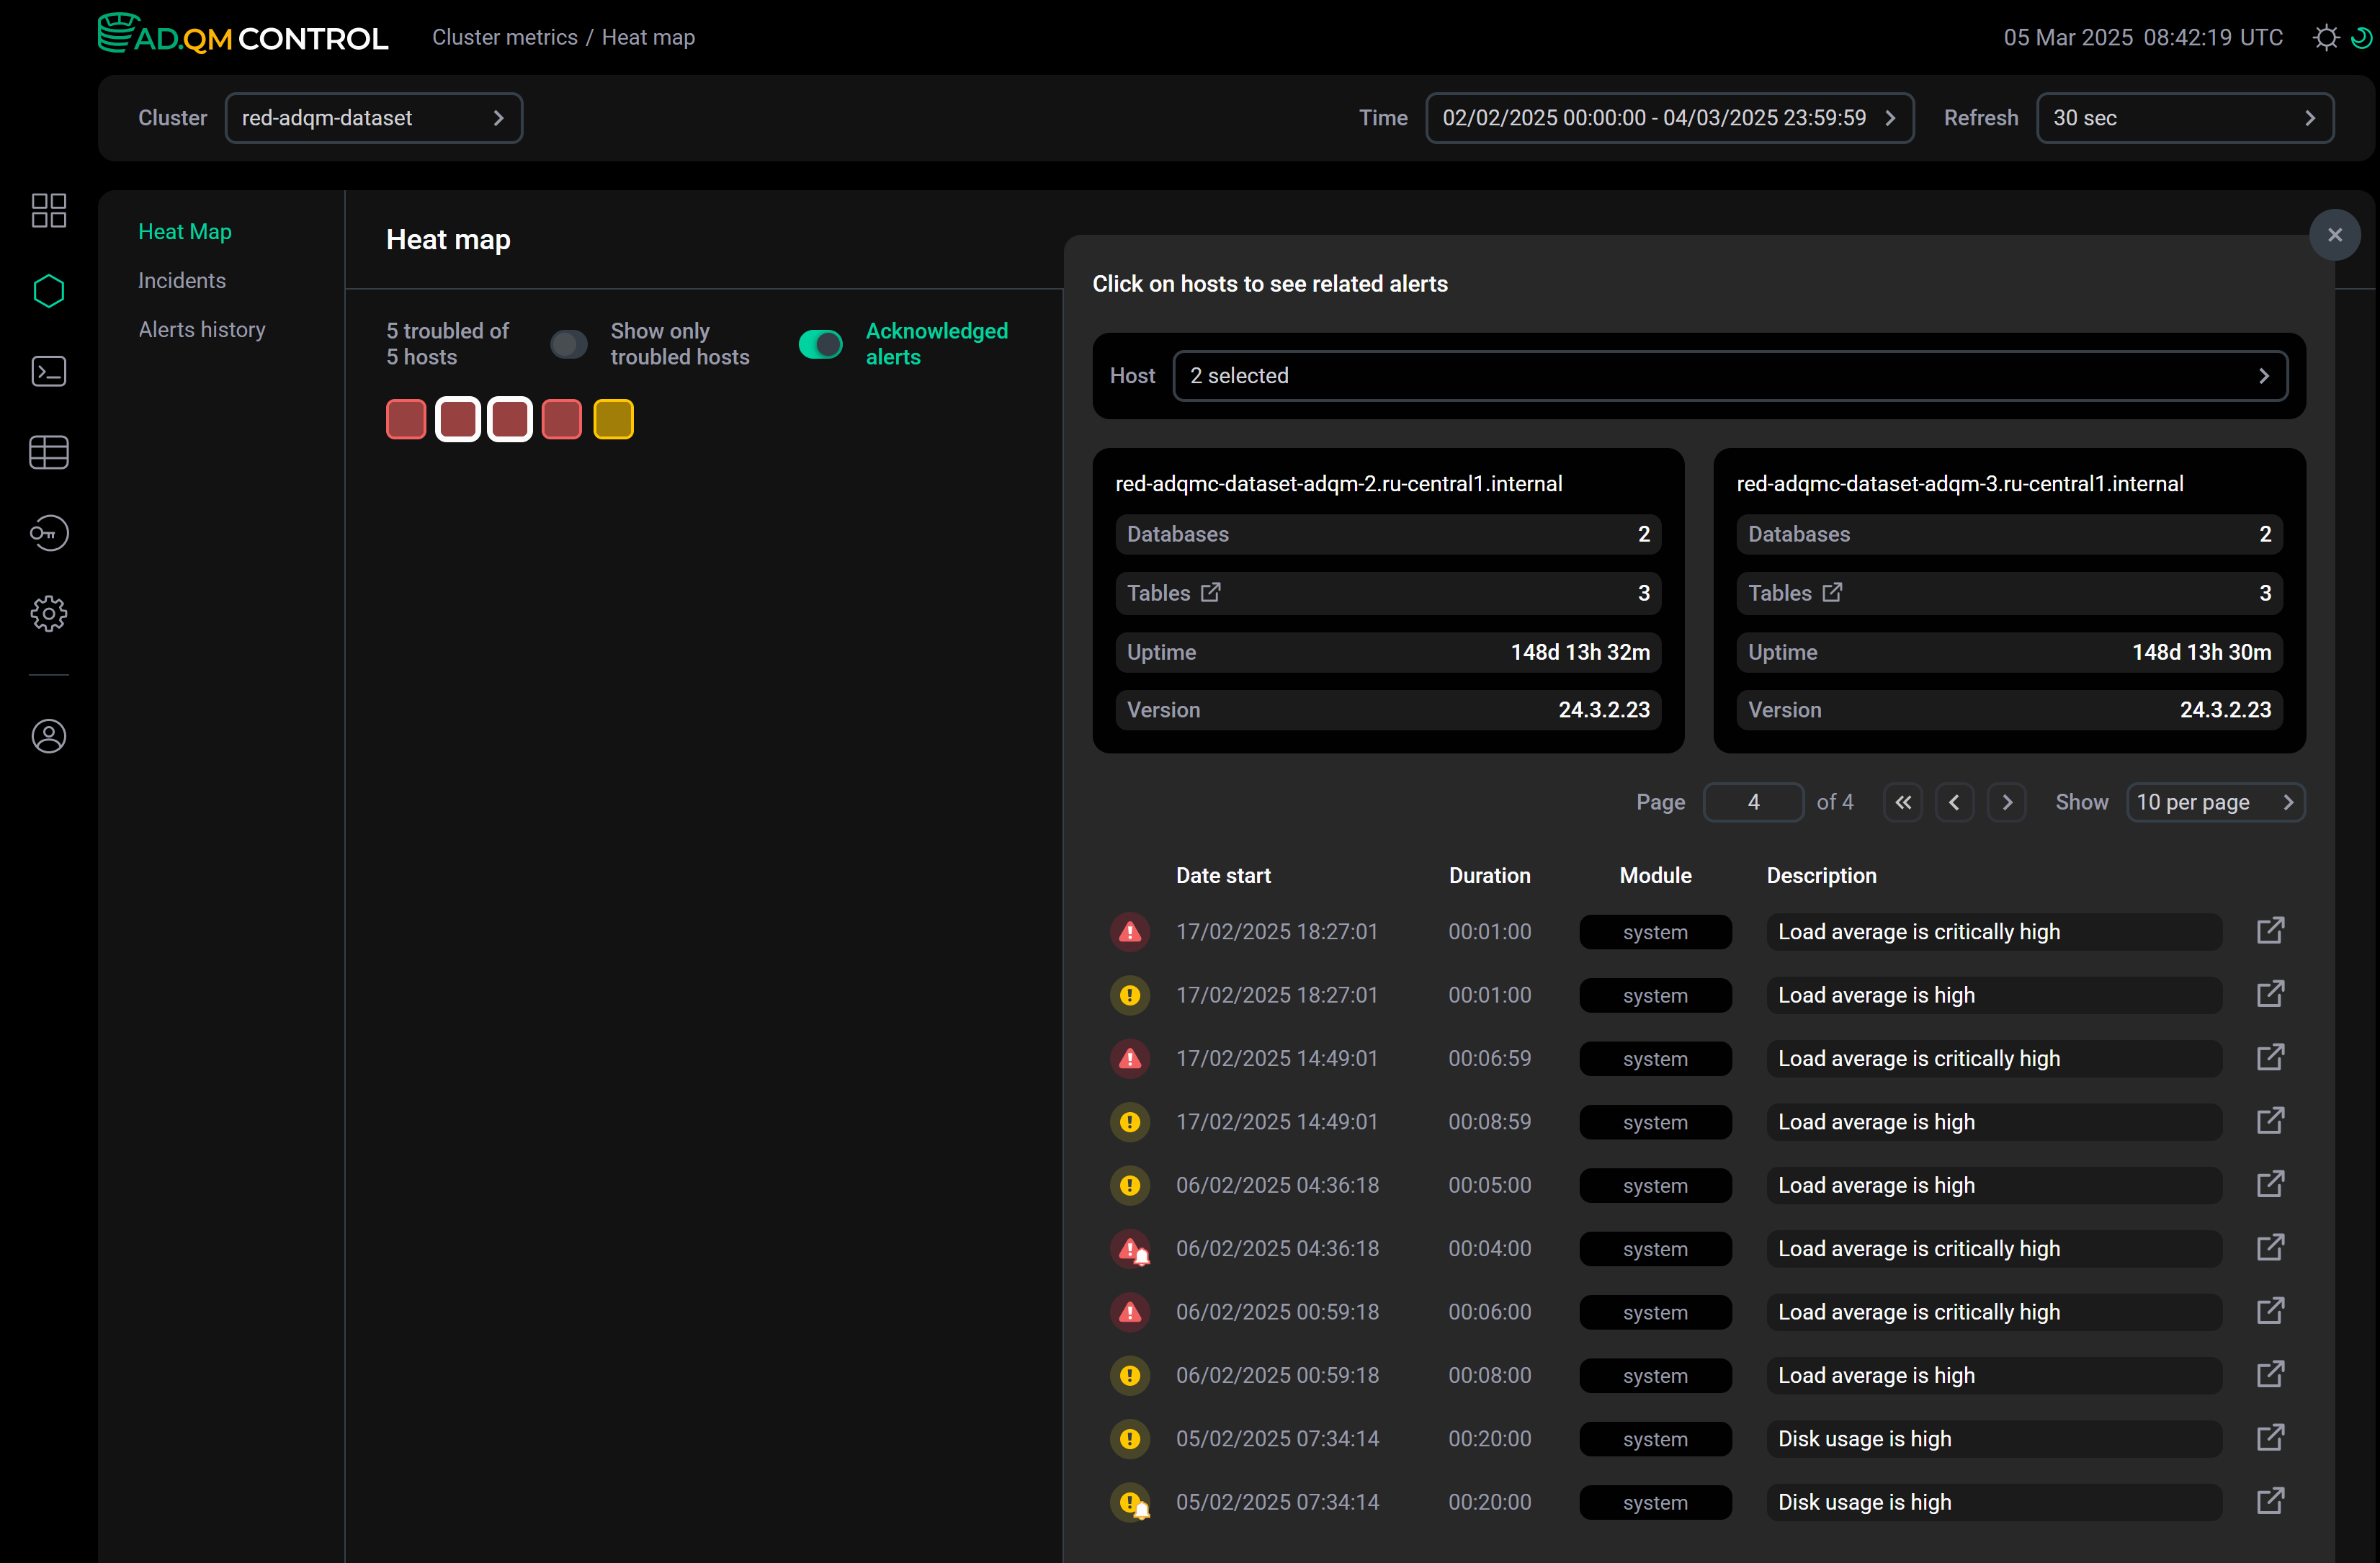
The table with a list of alerts contains the following information.
| Field | Description |
|---|---|
Date start |
Timestamp when an alert was generated (in the |
Duration |
Total time that a host issue alert remained active |
Module |
Module that includes an alert. Currently, ADQM Control only supports these modules: |
Description |
Description of an issue detected on a host |
The first column of the table with a list of alerts contains an icon that indicates the severity level of an alert:
 ,
,  — warning alert that informs about a potential issue on an ADQM cluster host (the issue has not reached the critical level yet). Generated when a system metric value exceeds a threshold set via the Warning parameter in the System alerts configuration.
 ,
,  — high-importance alert about a critical issue on a host. Generated when a system metric value exceeds a threshold set via the Critical parameter in the System alerts configuration.
Icons without the bell sign indicate alerts about issues that are considered acknowledged (in other words, known/resolved). You can set this status on the alert details page. The icons , are assigned to new and attention-requiring alerts that are not yet marked as acknowledged.
To get more details about an alert, do one of the following:
-
Click an alert row in the list — alert details will appear below the row. The threshold field contains the metric threshold value based on which the alert was generated.
 Alert details within the list
 -
Click the icon

 within an alert row — this will take you to a separate page with alert details (the page has a unique address that you can share). The Acknowledged alerts option allows you to change the alert status — mark the corresponding issue as acknowledged so that it does not affect the cluster heat map.
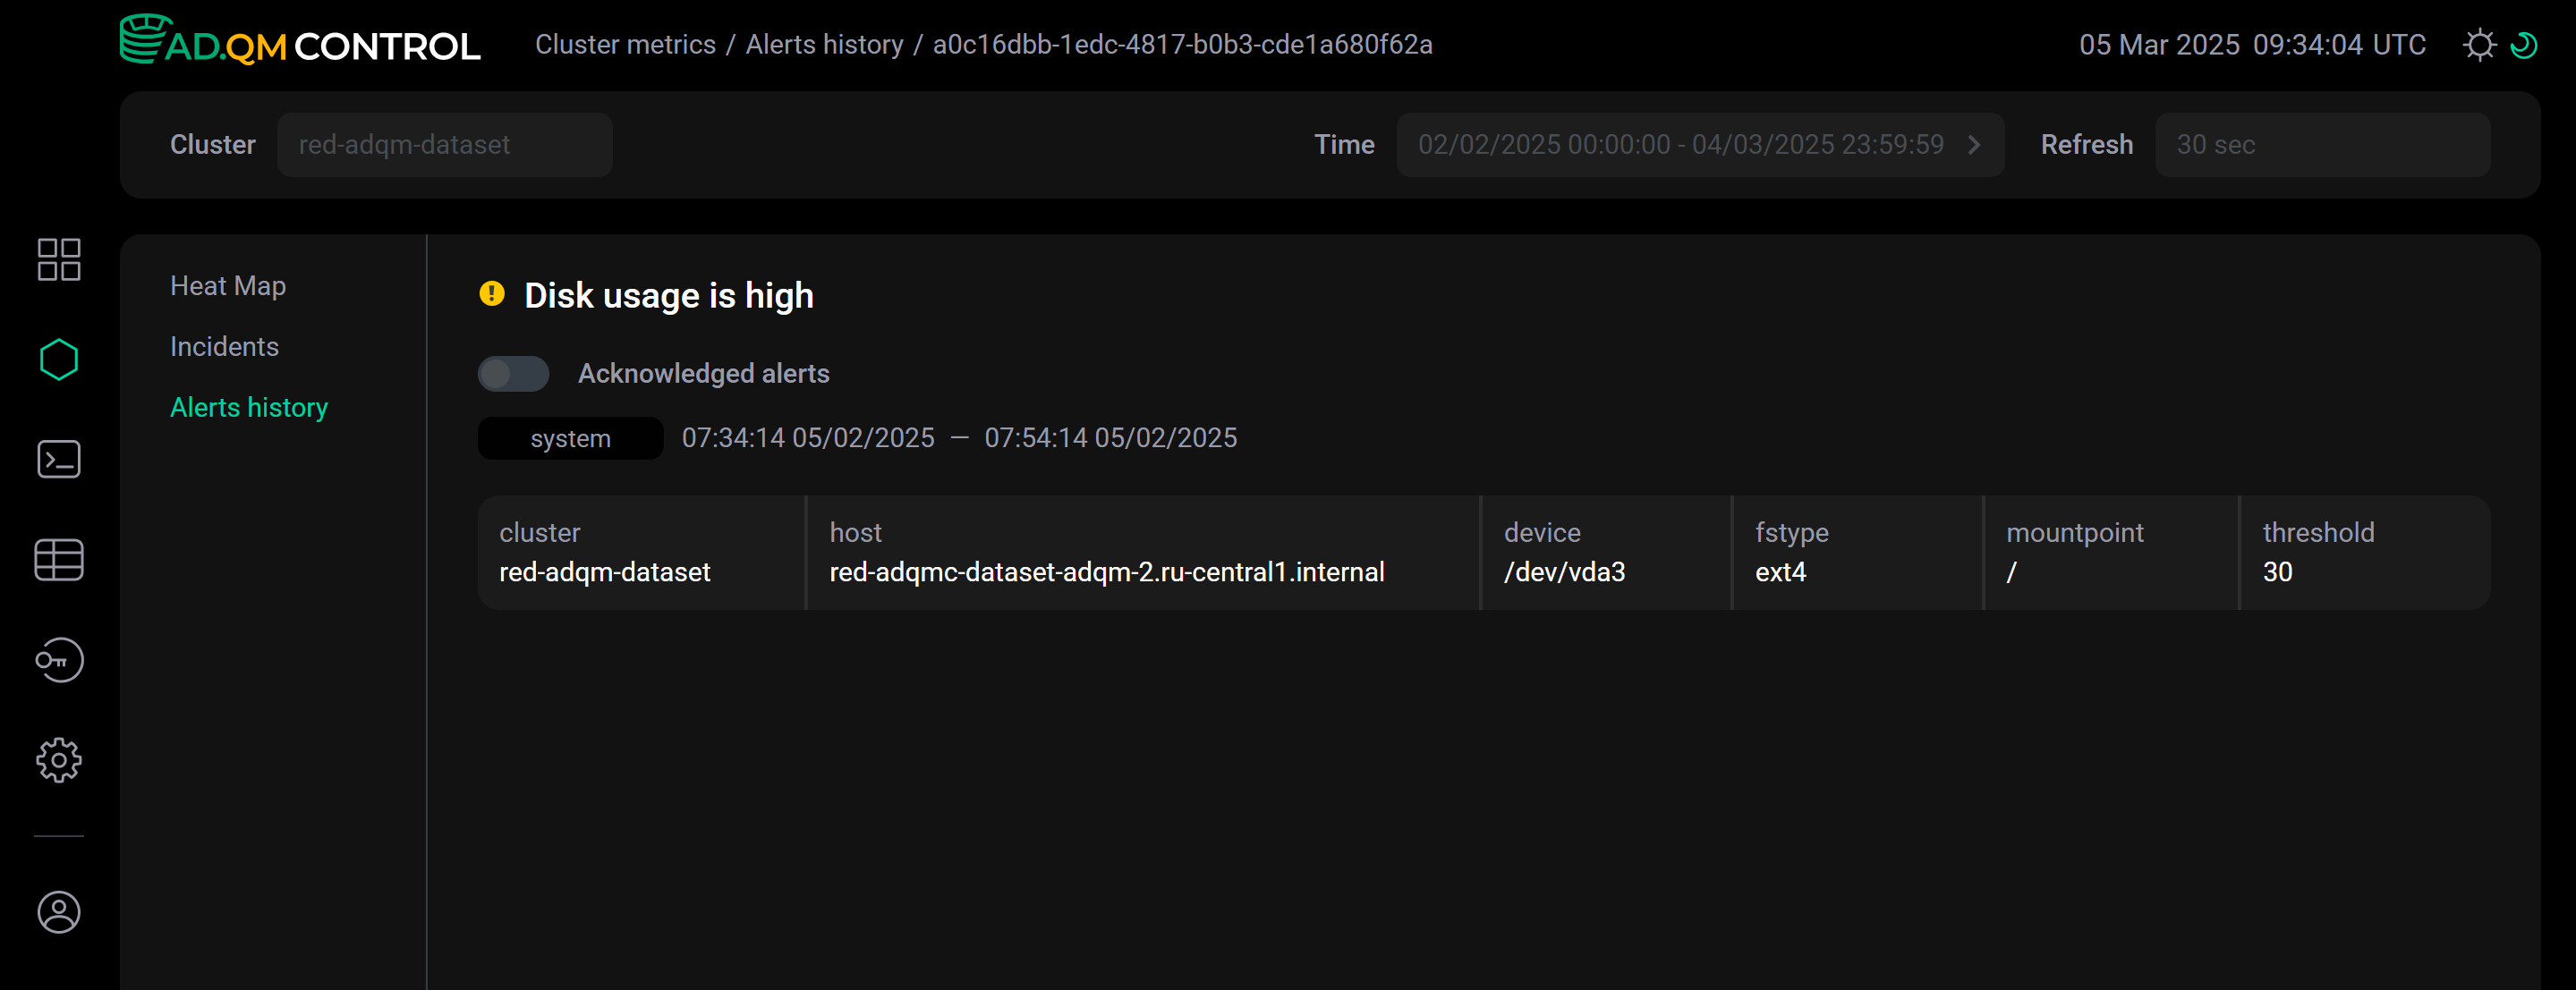 Alert details on a separate page
Incidents
On the Incidents tab, ADQM Control combines alerts about issues occurred on cluster hosts during the selected time period into incidents — groups of alerts that are closest to each other in time of creation.
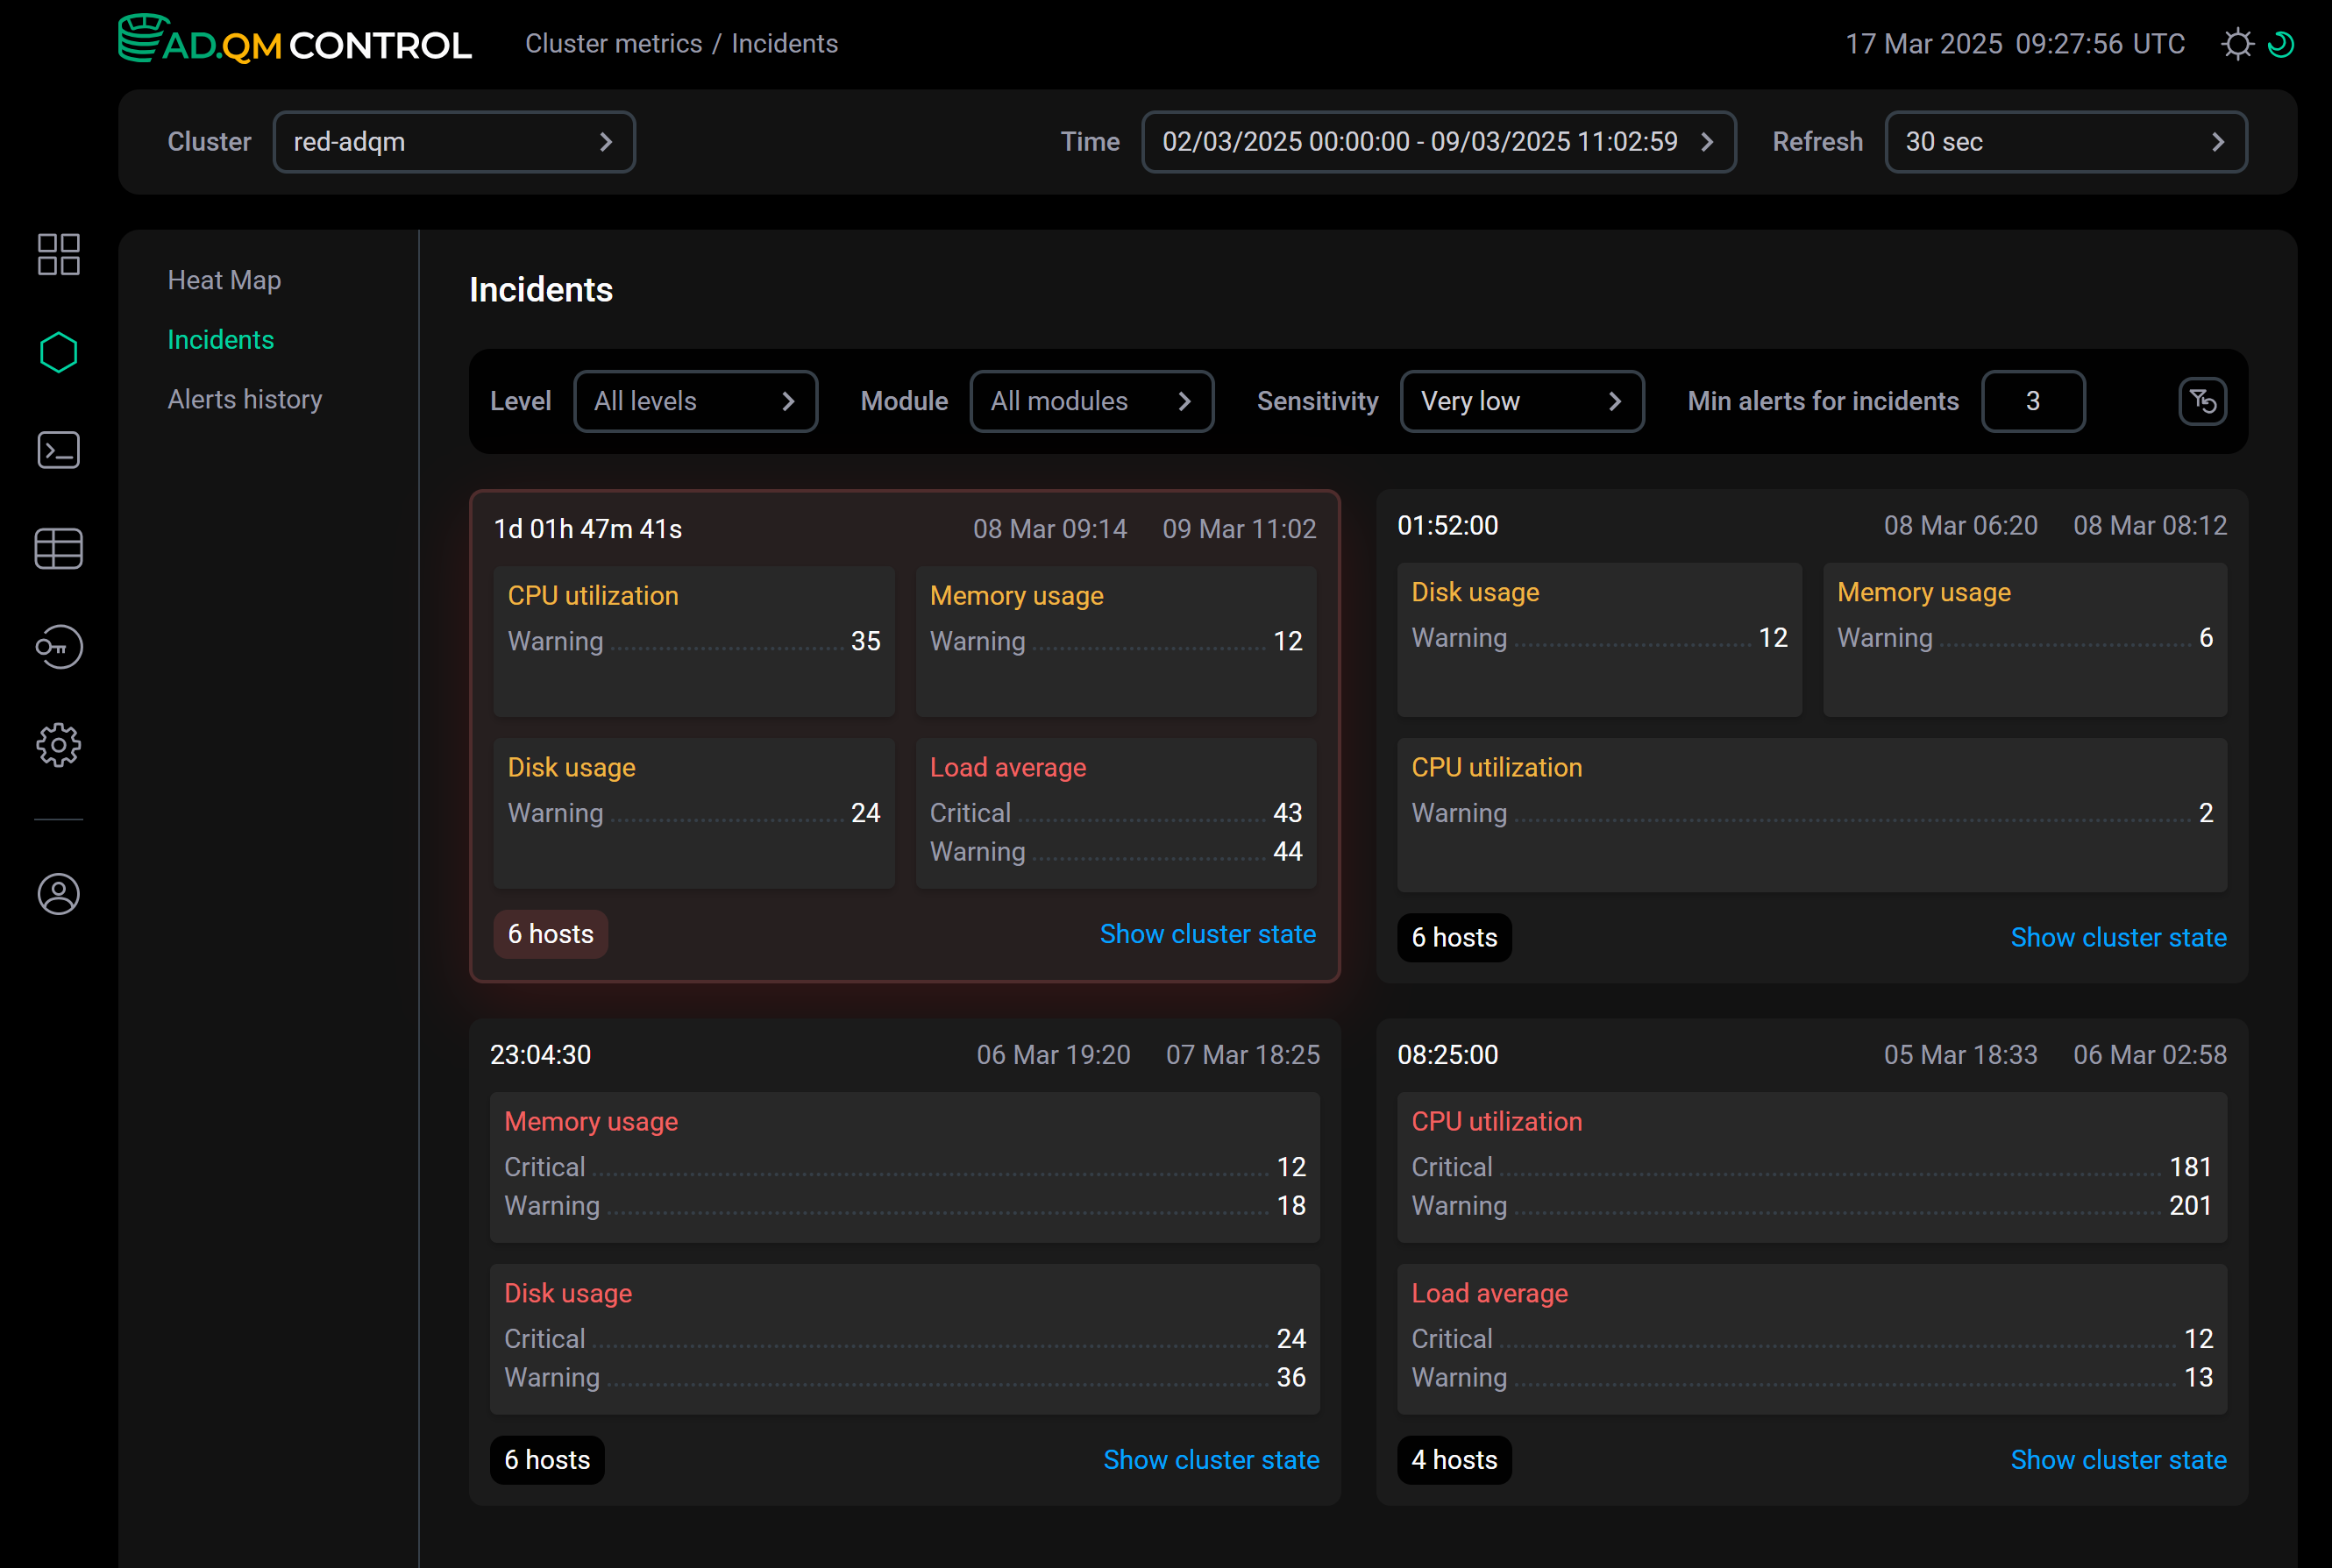
An incident is displayed as a block that includes:
-
incident duration;
-
incident time interval — from the time the first alert in the incident was generated until the time the last alert in the incident was deactivated (the metric-related issue was resolved);
-
metrics for which thresholds were exceeded on cluster hosts, with information about how many warnings and high-importance alerts were generated;
-
number of hosts where problems were detected;
-
Show cluster state link — refers to the Dashboard page with the Acknowledged alerts option enabled and the Time period equal to the incident interval. If an incident interval is less than an hour, ADQM Control automatically increases it to 1 hour by adding equal parts to each boundary (since 1 hour is the minimum allowed time interval that can be set in the Time field). On the Dashboard page, you can analyze your cluster state during the time period corresponding to the incident — for example, you can see which hosts had problems; which queries were too long or memory-consuming during this period; which tables were the largest in size and which ones were the most queried.
A block highlighted in red indicates an active incident — if a new alert arrives, it will be added to this incident.
How incidents are generated
To generate incidents, ADQM Control calculates time intervals between alerts and determines the interquartile range (IQR) based on this data. Then, it calculates a threshold value that is the minimum time interval between alerts, at which the next alert will be added to a new incident: , where is the sensitivity level set via the Sensitivity parameter.
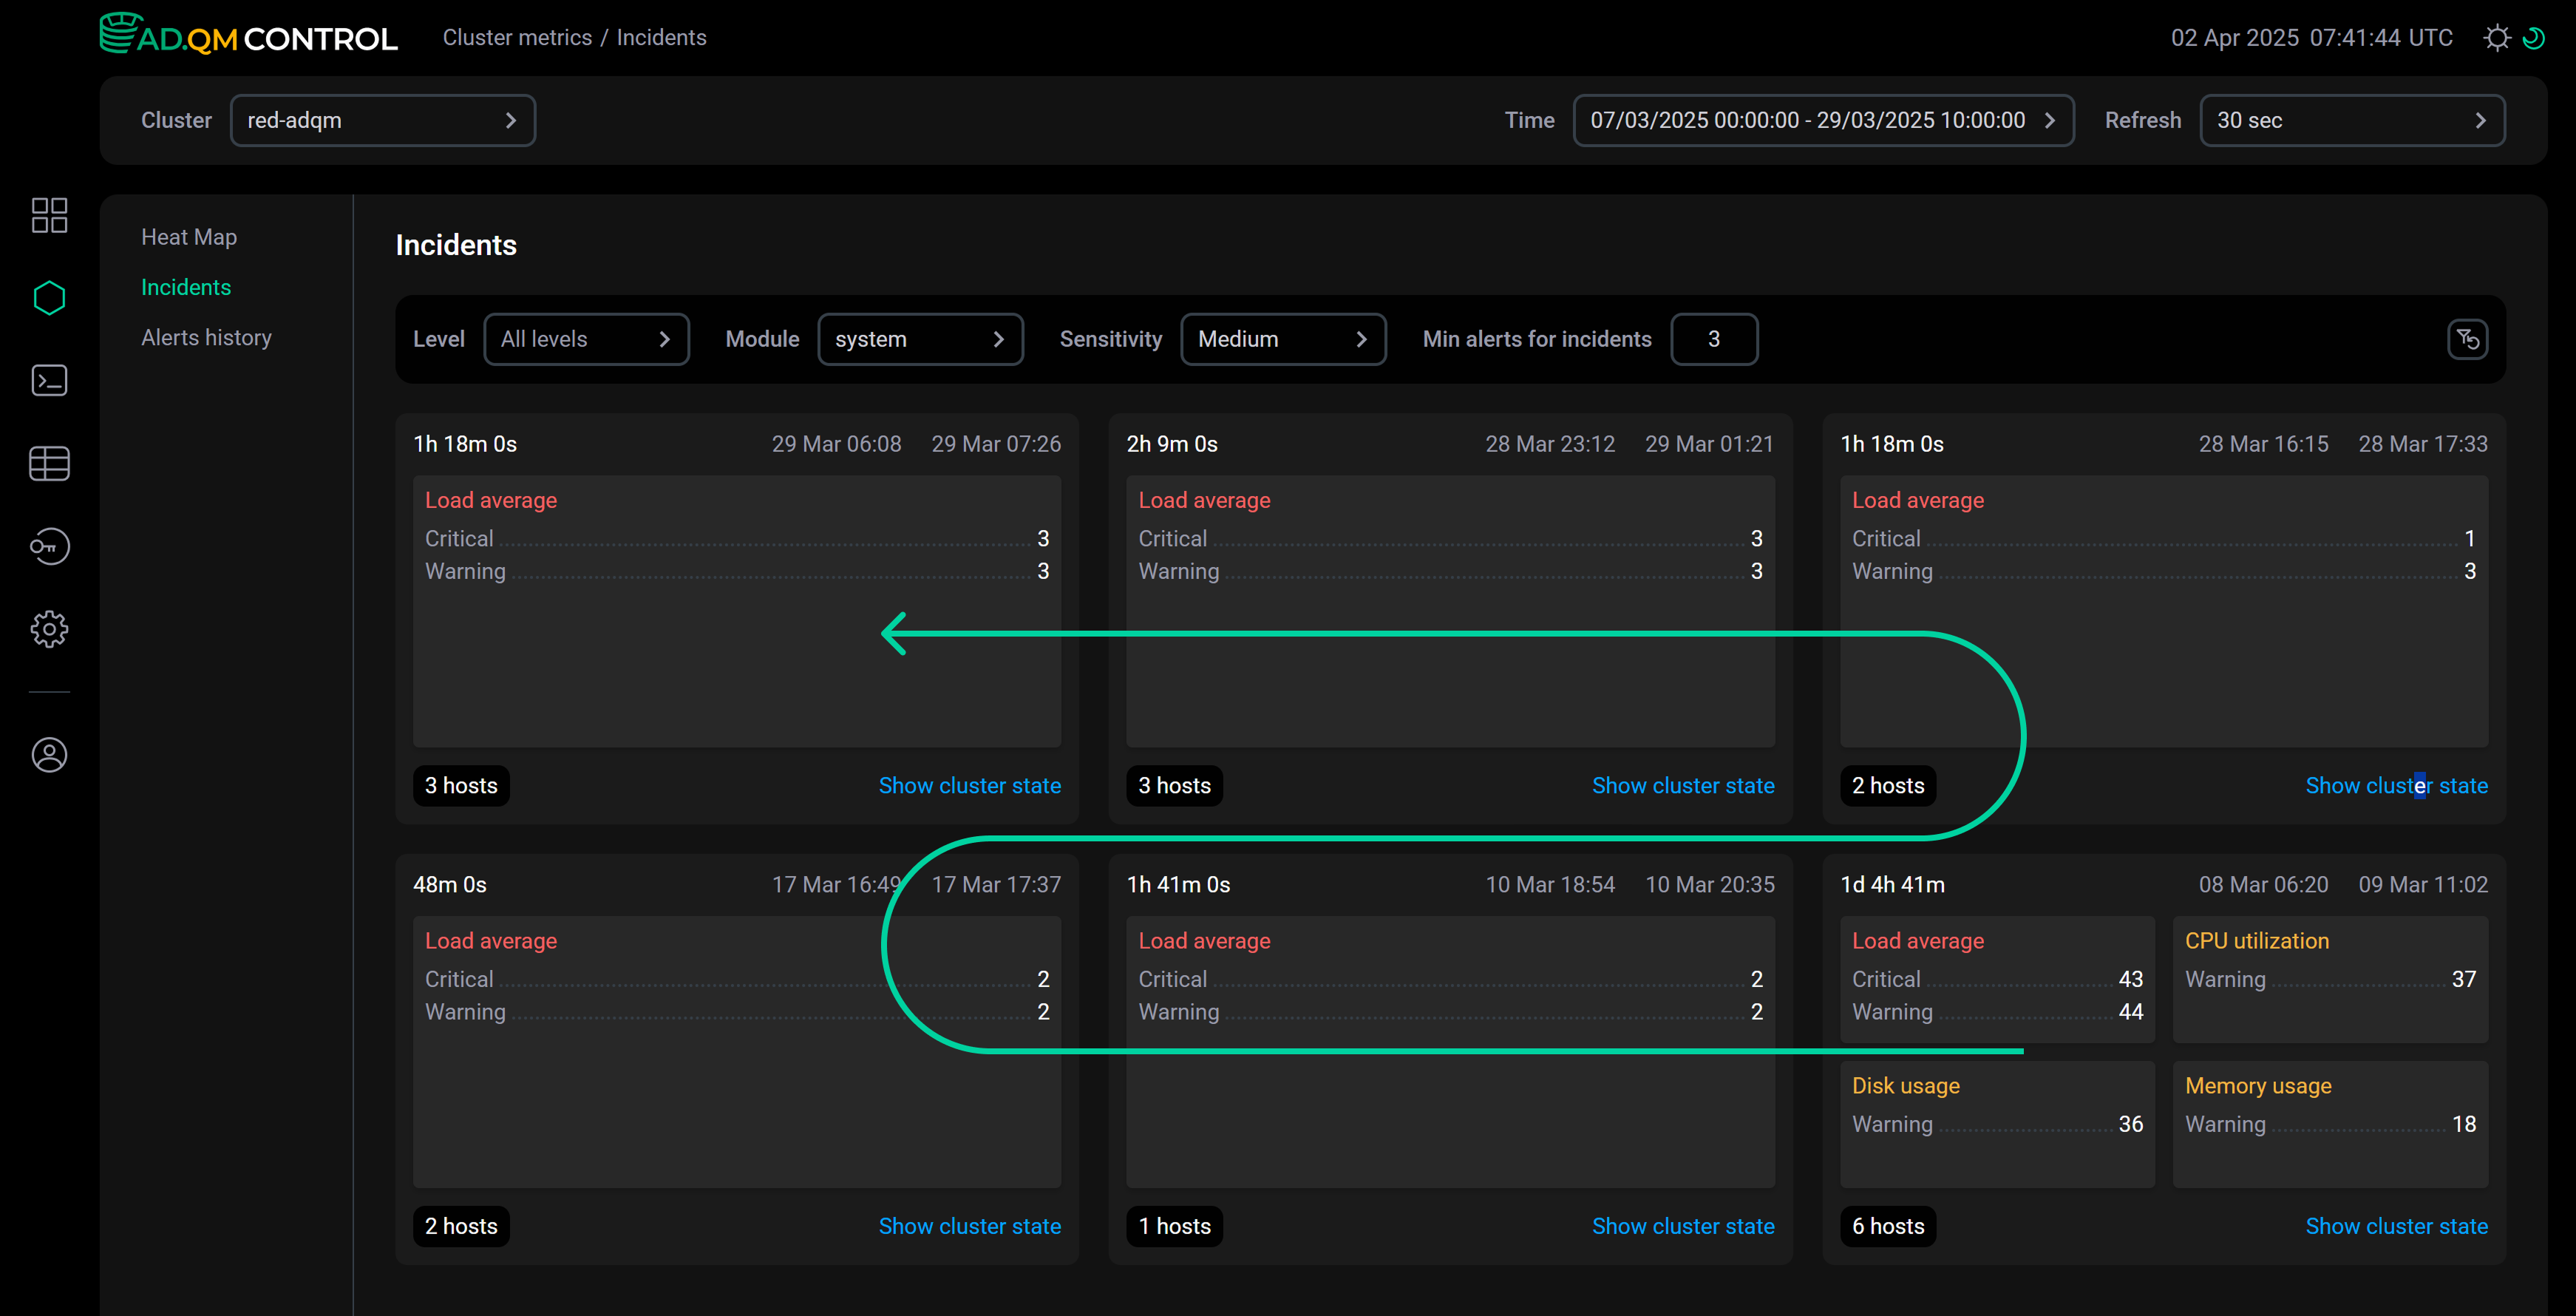
The following image illustrates the sequence of incident generation and their arrangement on the page.
Alerts are grouped into incidents dynamically depending on the specified parameters (see the section below) and the time interval selected in the Time field:
-
For a fixed time interval in the past, the structure of incidents is generated when the Incidents page is opened and remains fixed because the set of alerts for this time interval does not change.
-
If you select a time interval relative to the current moment (for example, the interval
now-12h,now-2d,now-1M, etc.), the structure of incidents on the page may change, since the actual boundaries of the time interval shift over time, which means the set of active alerts may change (new alerts may occur or the time of previously valid alerts may become outside the current time frame).
Settings
The Incidents tab contains the following parameters that affect which alerts are used to build incidents and how alerts are combined:
-
Level — alert importance level. Possible values:
warning,critical. -
Module — module to which alerts belong. Possible values:
system,internal. -
Sensitivity — coefficient that affects how much time should pass between an alert and the previous one so that they fall into different incidents. The lower the sensitivity, the longer the time should pass between alerts to place them into different incidents. Possible values:
Very low,Low,Medium,High,Very high.ExampleThe images below show examples of the alert distribution for the same time interval across incidents depending on the specified sensitivity.
-
With the
Very lowsensitivity, all alerts for the selected time period are combined into one incident.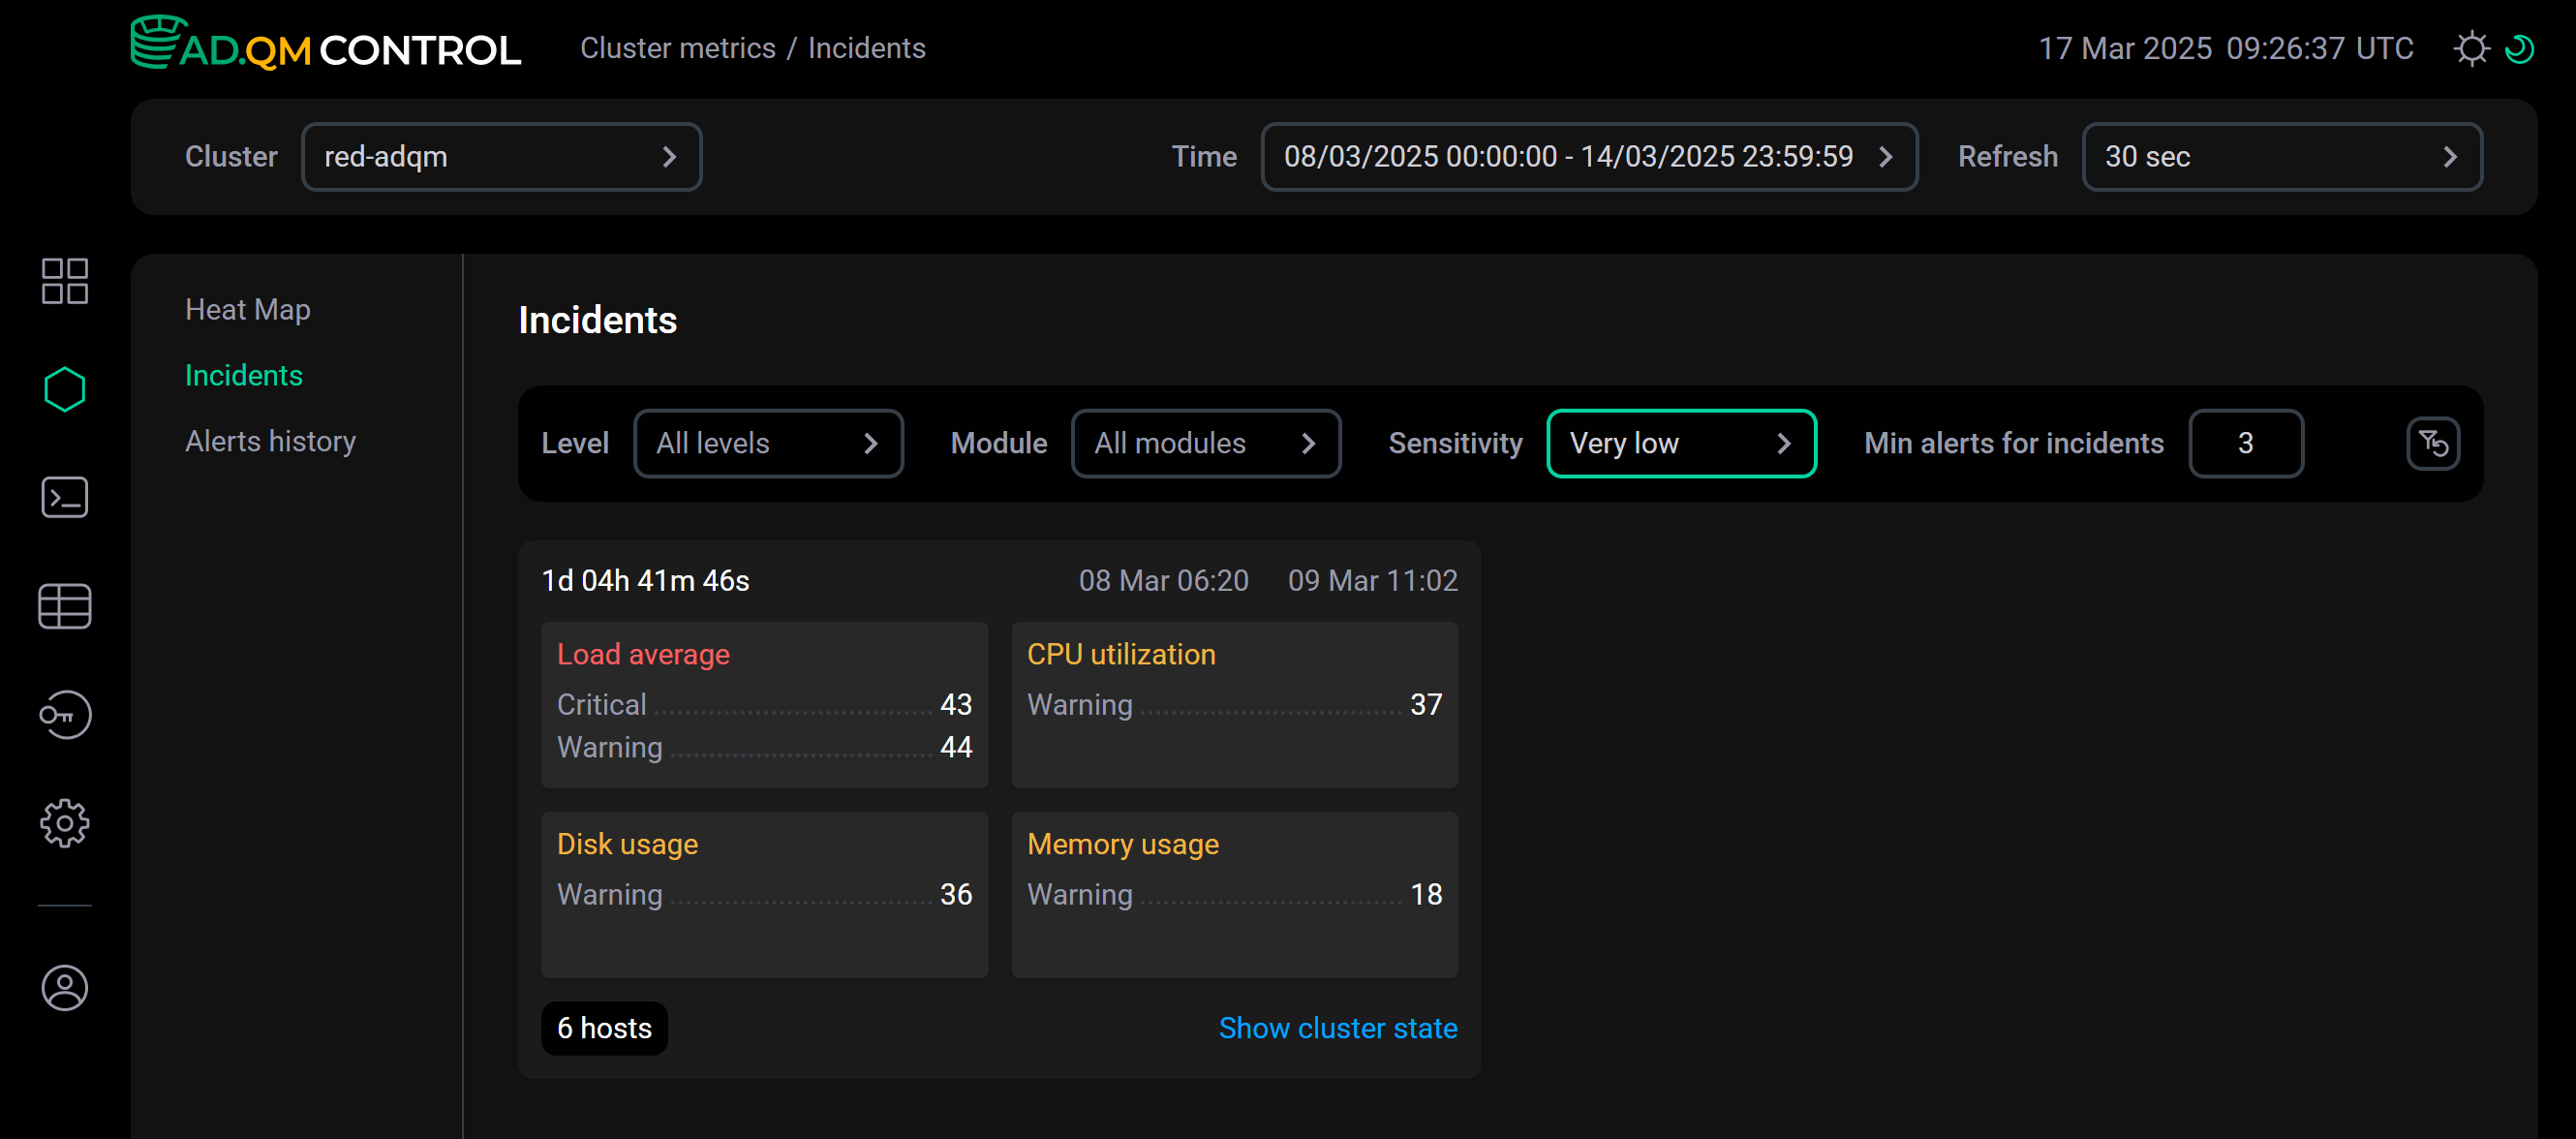 Sensitivity is very low
 -
With the
Very highsensitivity, alerts for the same time period are grouped into two incidents.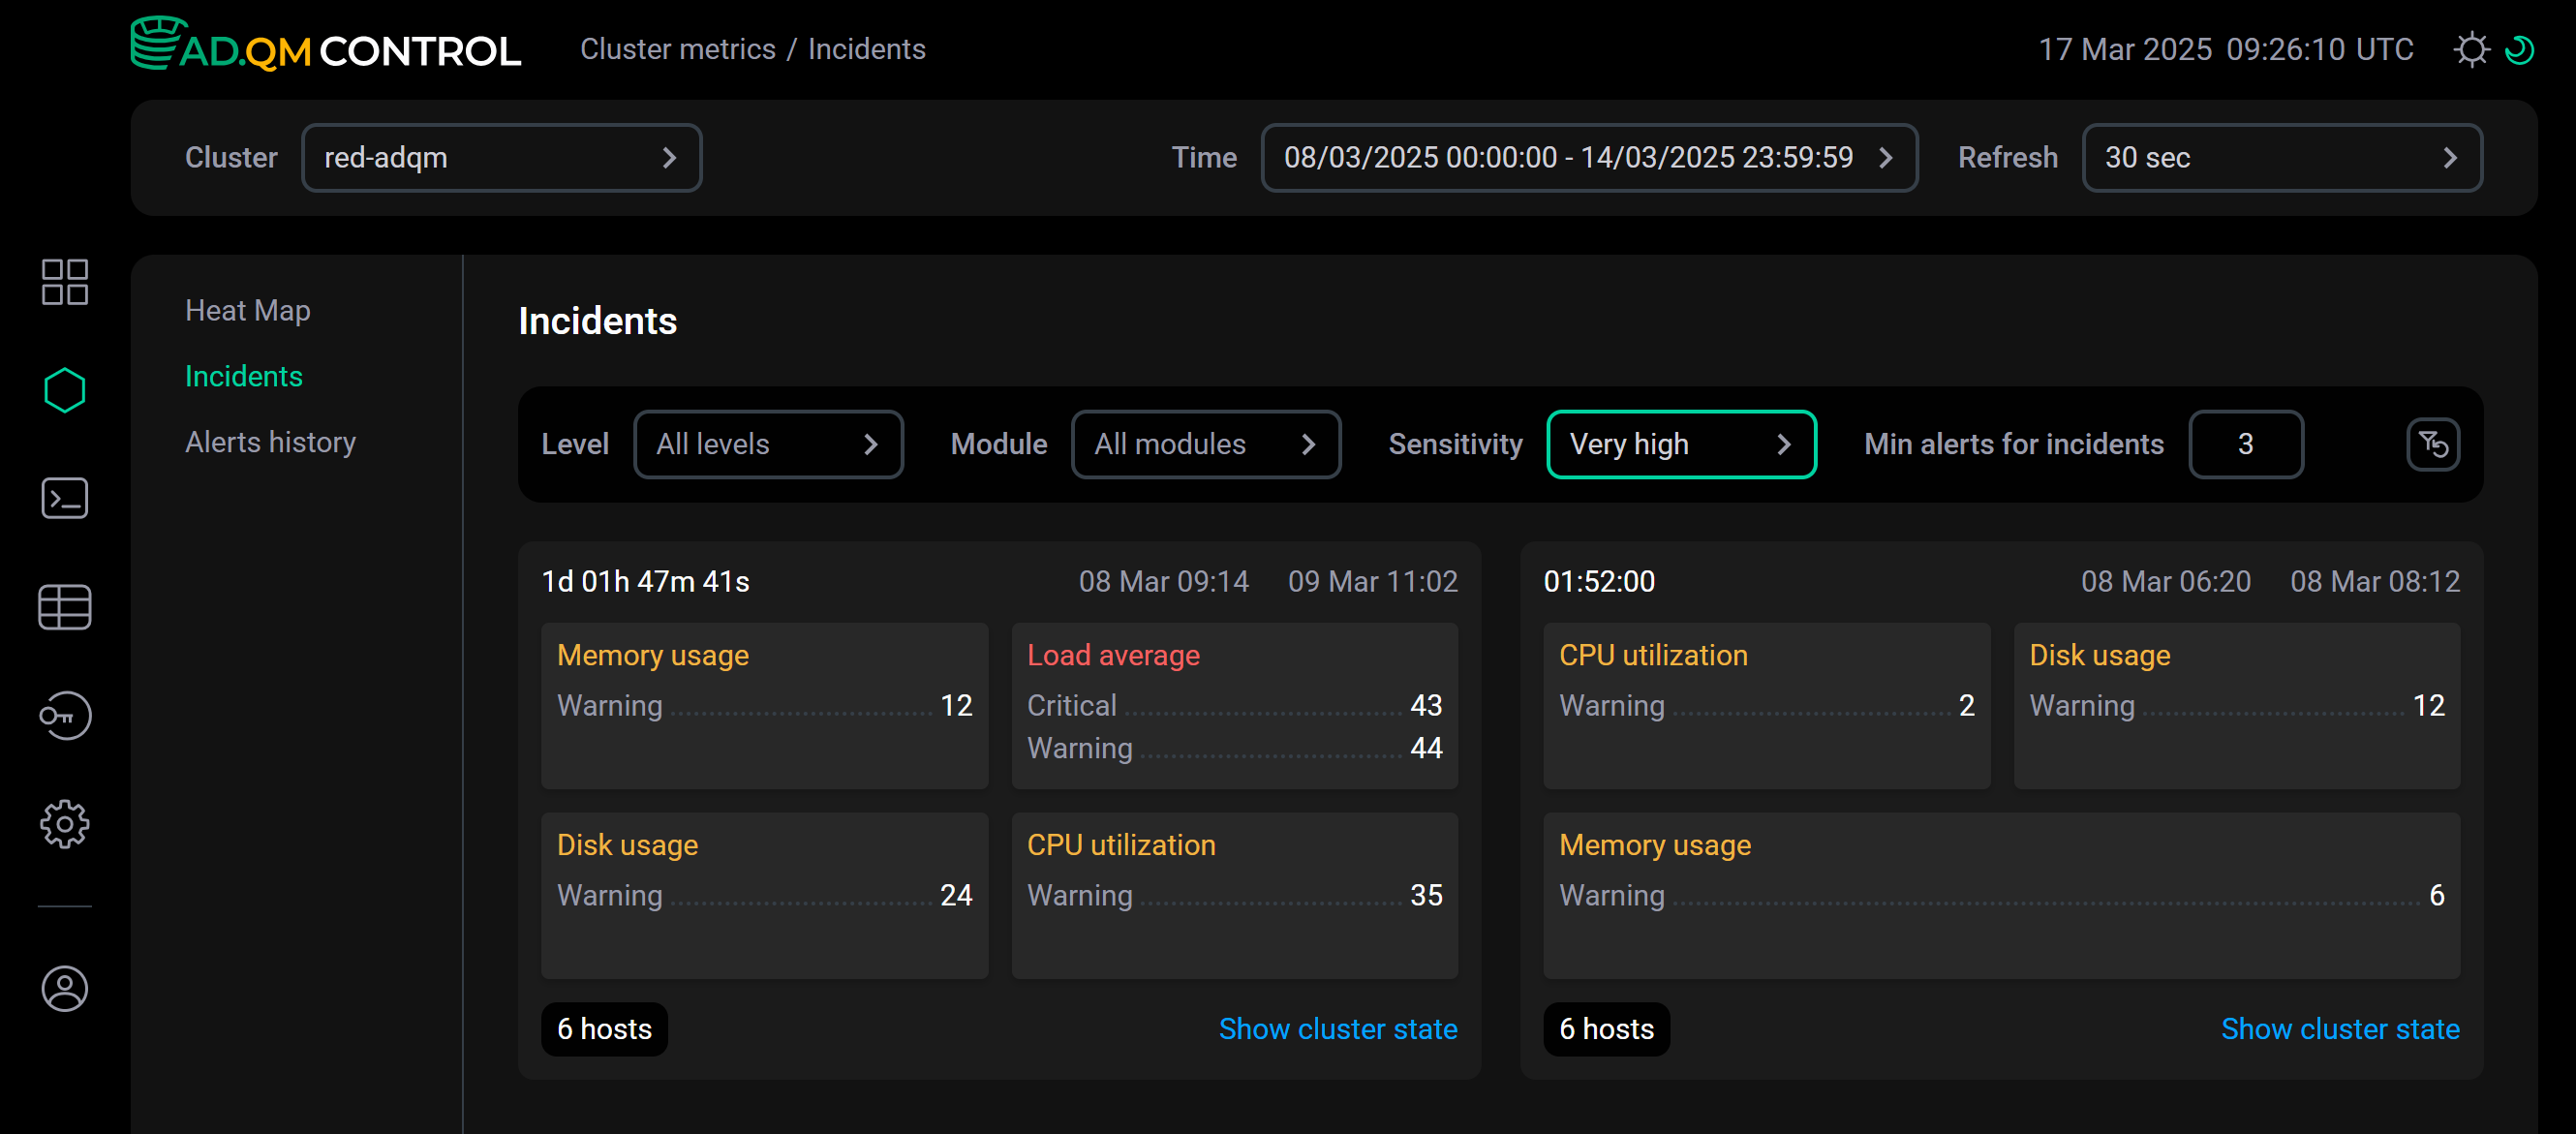 Sensitivity is very high
-
-
Min alerts for incidents — minimum number of alerts to create an incident.
Alerts history
The Alerts history tab displays a full list of alerts that were generated based on metrics of ADQM cluster hosts for the period of time specified in the Time field at the top of the screen.
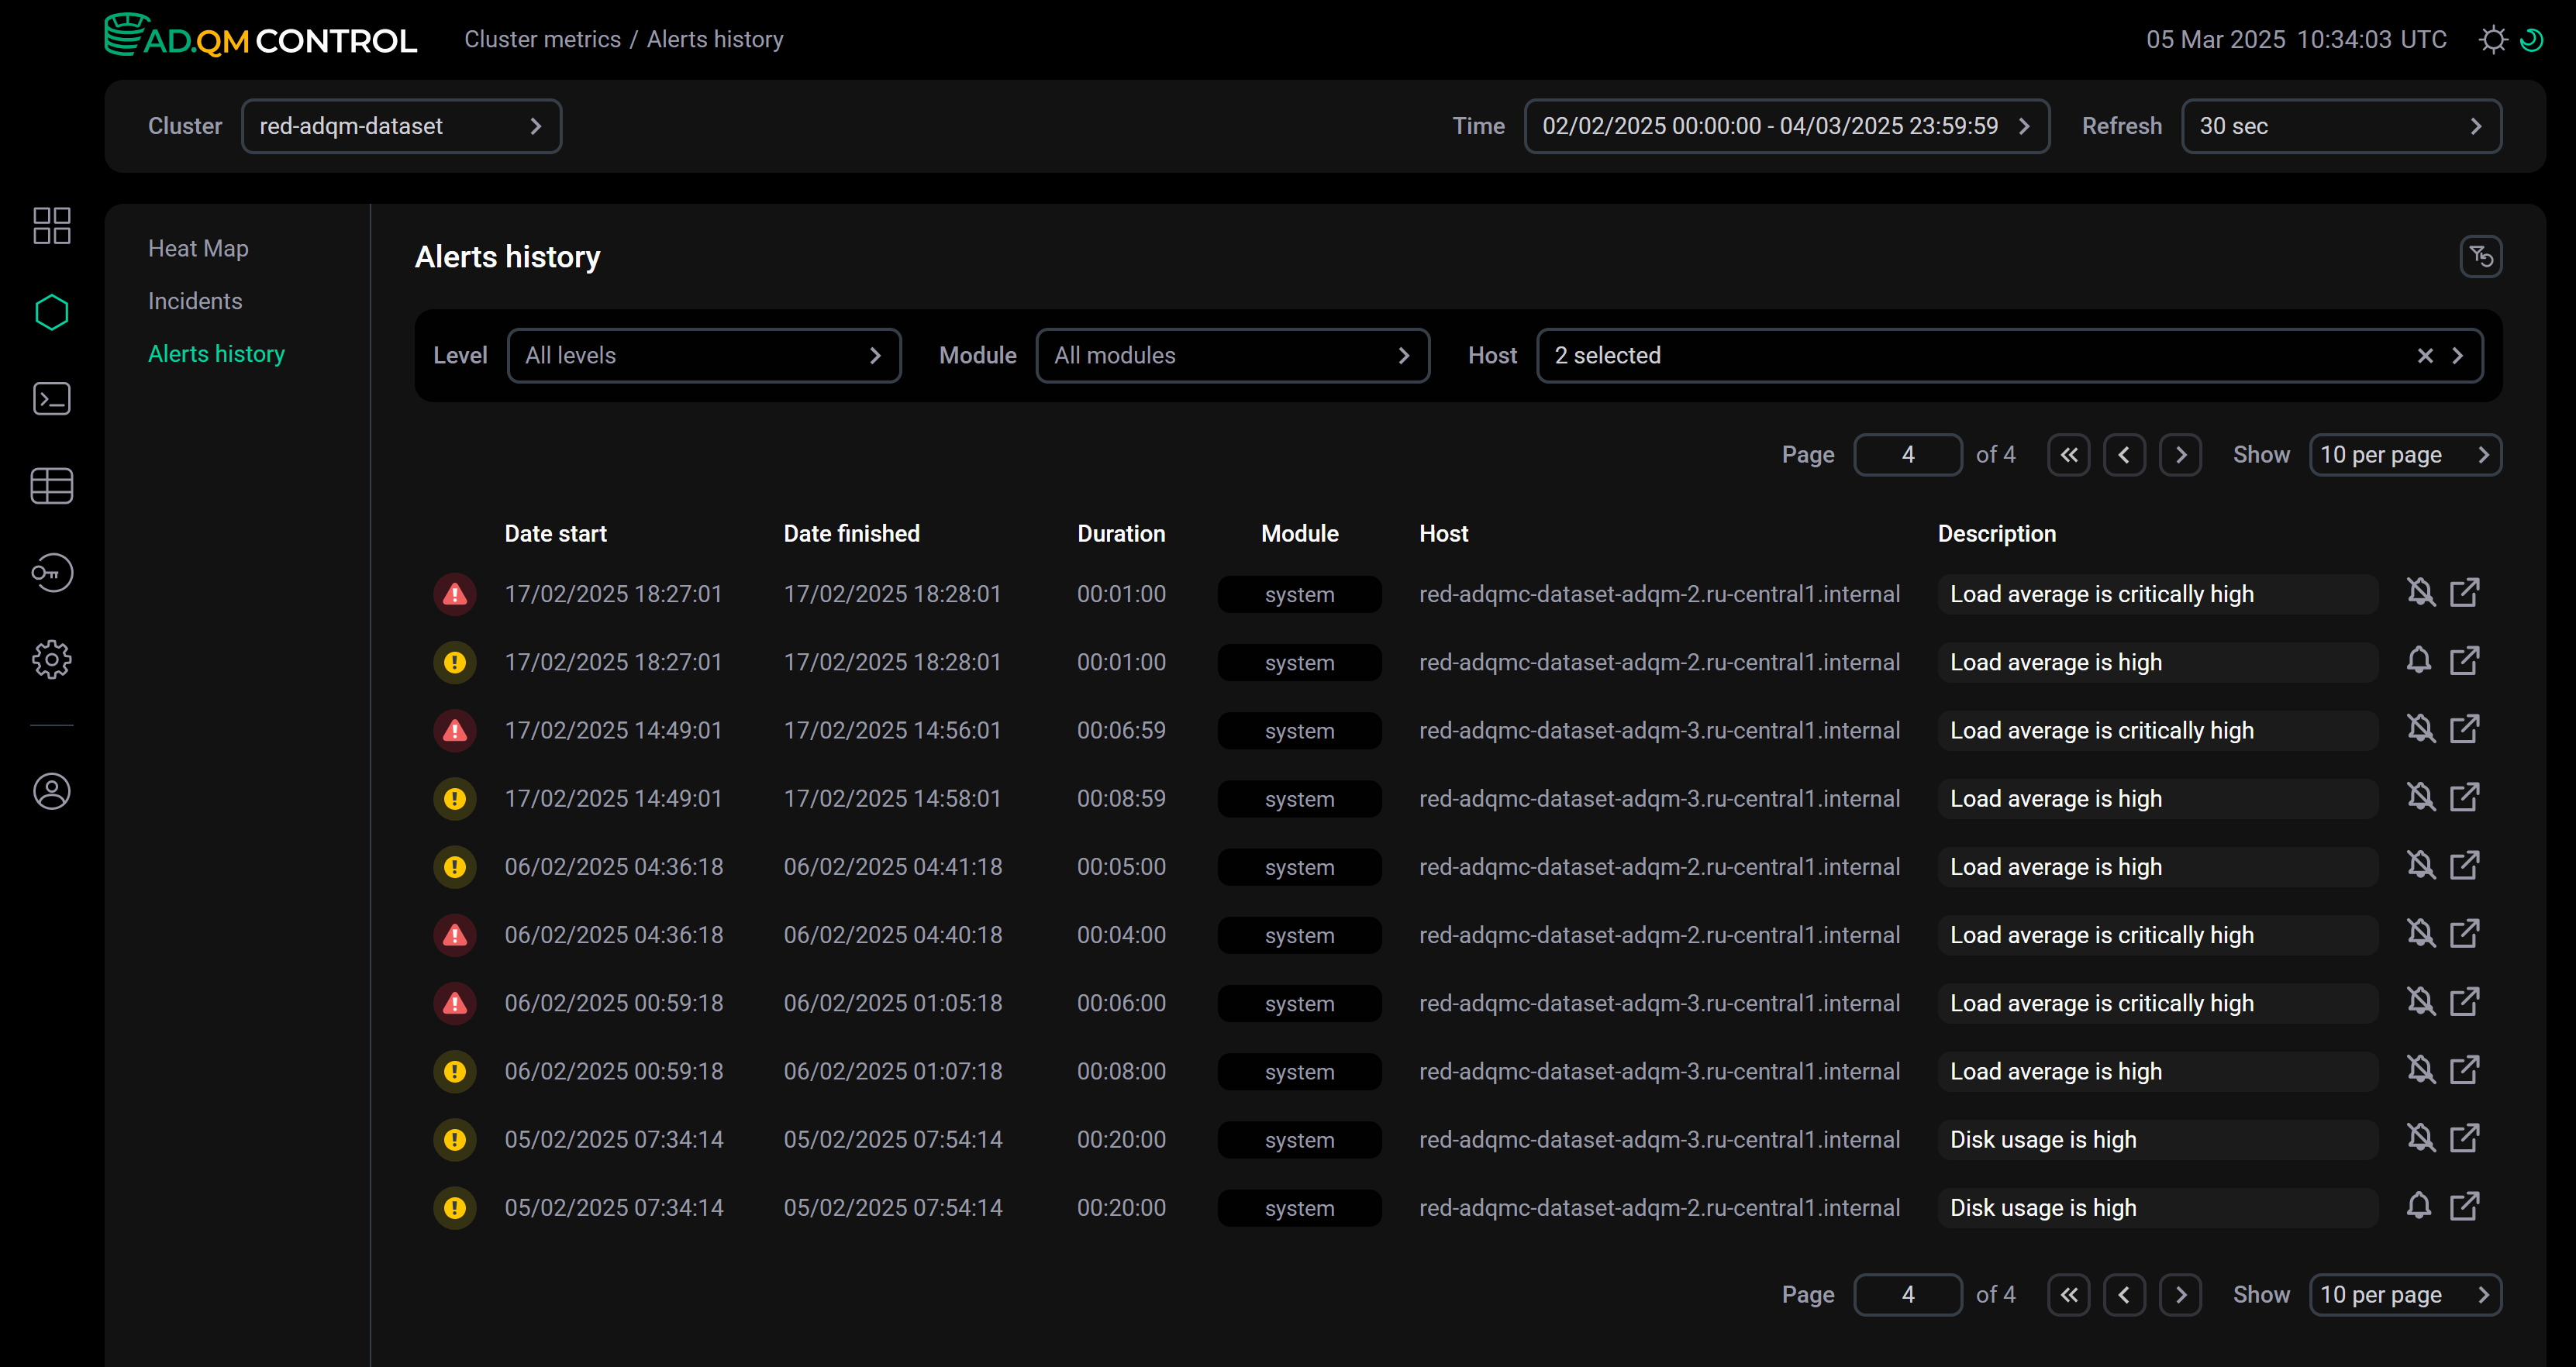
Most of the fields in the Alerts history table match the fields that are described above for the Heat map tab. Additionally, the following fields are available:
-
Date finished — timestamp (in the
DD/MM/YYYY HH:mm:ssformat) when an alert became no longer valid, i.e. the corresponding issue was resolved on the host. If an alert is still active, the field shows a time in the future. -
Host — host on which an issue was detected.
The icon ![]()
![]() or
or ![]()
![]() indicates whether an issue requires attention or is set as acknowledged.
indicates whether an issue requires attention or is set as acknowledged.
Alert filters
You can use filters located at the top of the Alerts history tab to specify which alerts to display in the table:
-
Level — alert importance level. Possible values:
-
warning— potential issues on hosts (); -
critical— critical issues on hosts ().
-
-
Module — module into which alerts are grouped. Possible values:
system,internal. -
Host — host for which you want to display alerts on issues found in the system. You can select multiple or all hosts at once.
To reset all applied filters, click the icon ![]()
![]() Reset all filters.
Reset all filters.
Alert details
As for the Heat map tab, it is possible to obtain alert details from Alerts history in two ways:
-
Click an alert row in the list — alert details will appear below the row.
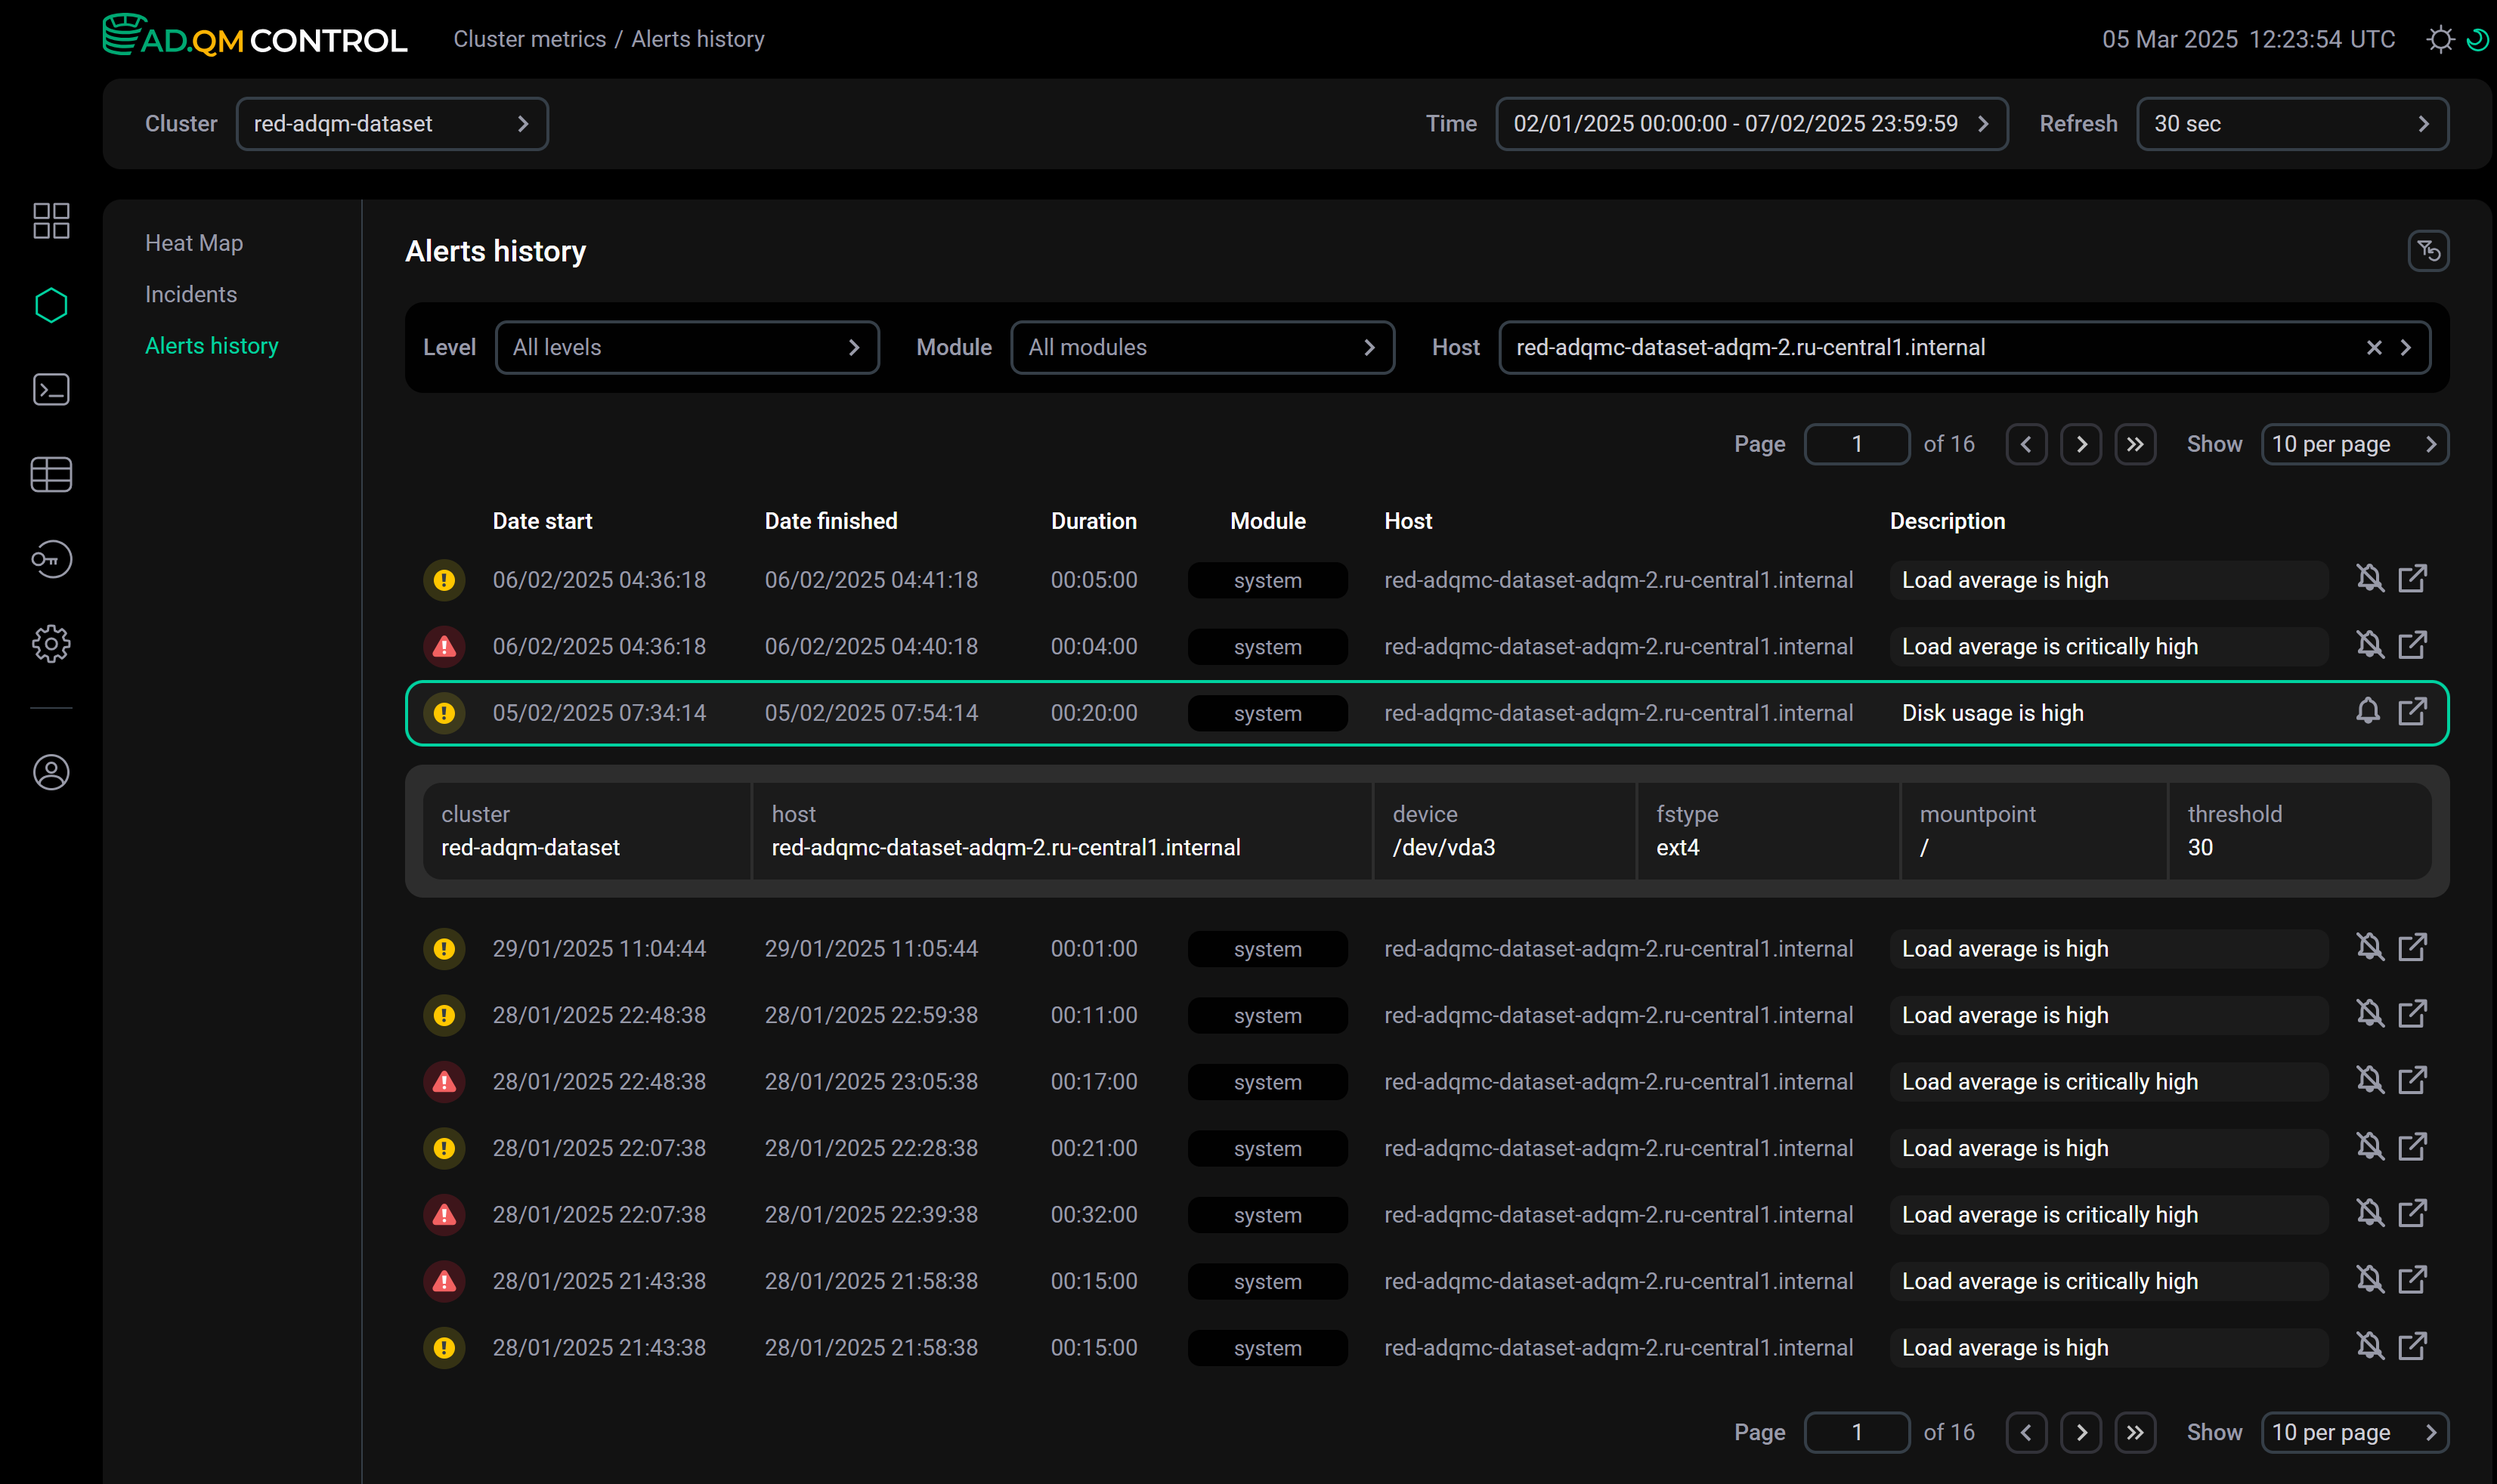 Alert details within the list
 -
Click the icon
within an alert row — a separate page with alert details will open.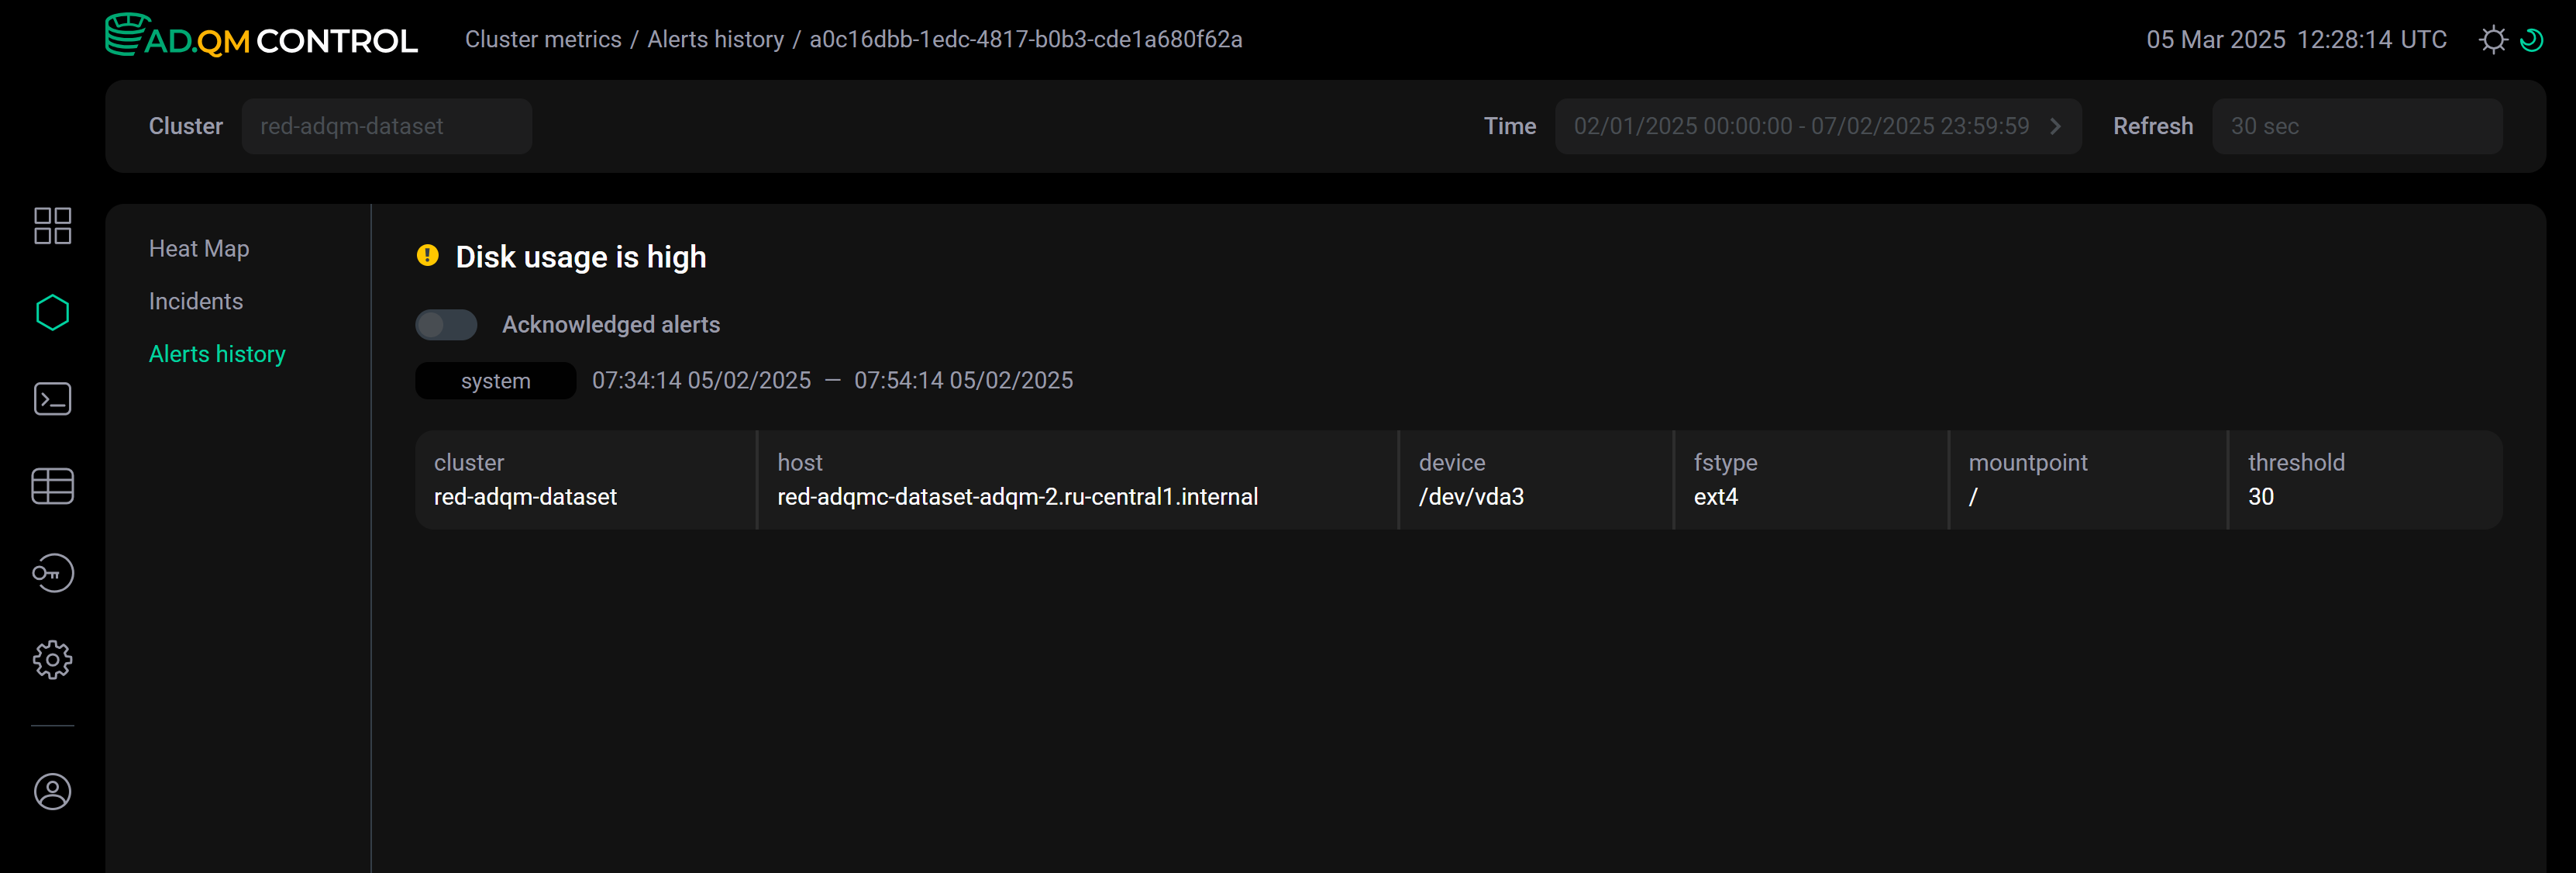 Alert details on a separate page