

ADS Control UI overview
Below you can find the overview of the features contained in the ADS Control UI.
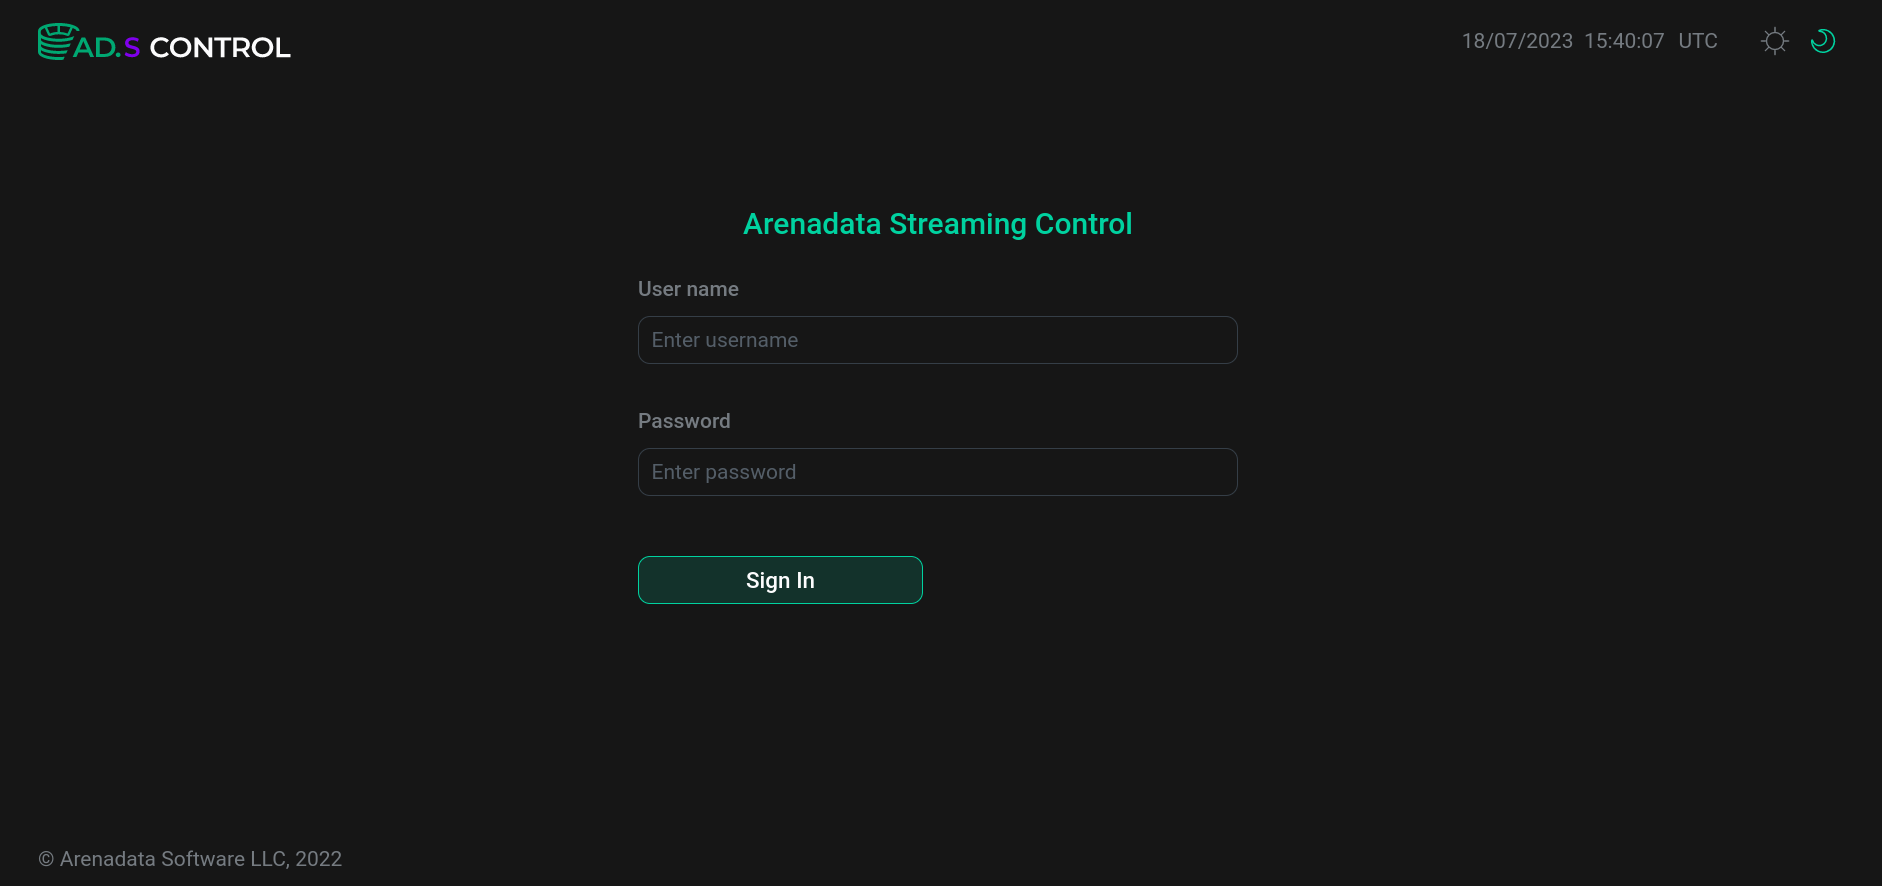
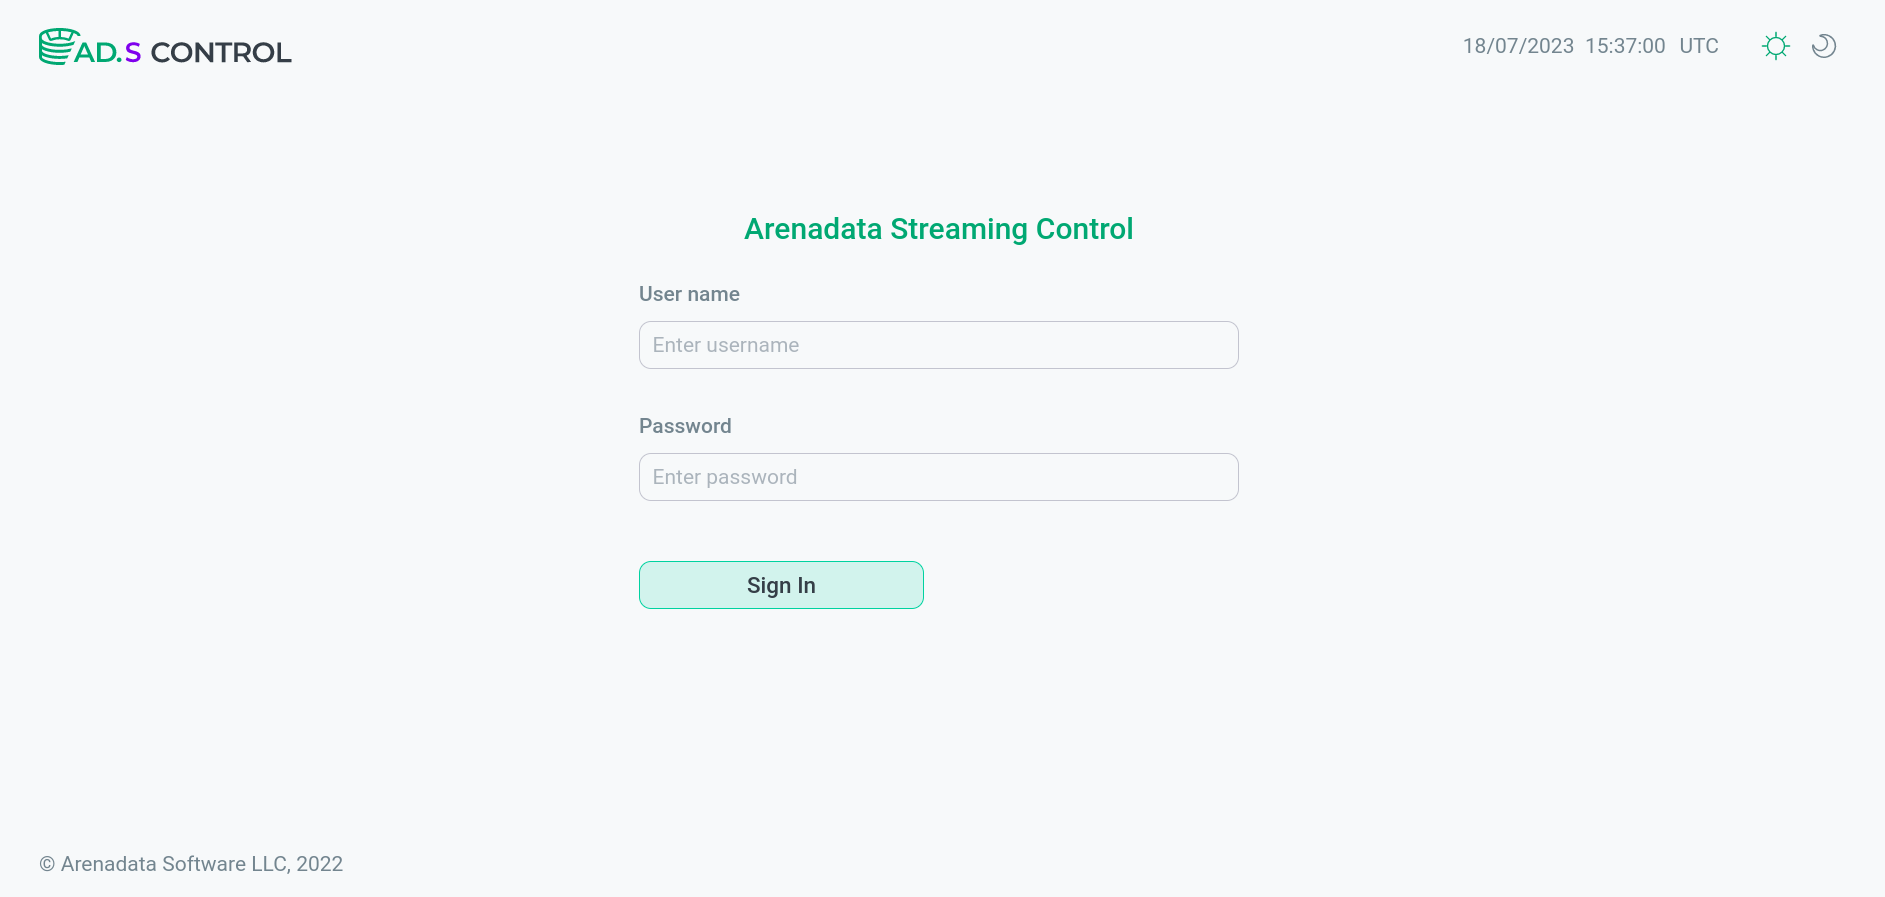
Login window
This is the first window the user sees after connecting to ADS Control. In order to access to ADS Control, you are prompted to enter your credentials (login and password) in the corresponding fields. After you entered your credentials, click Sign in.
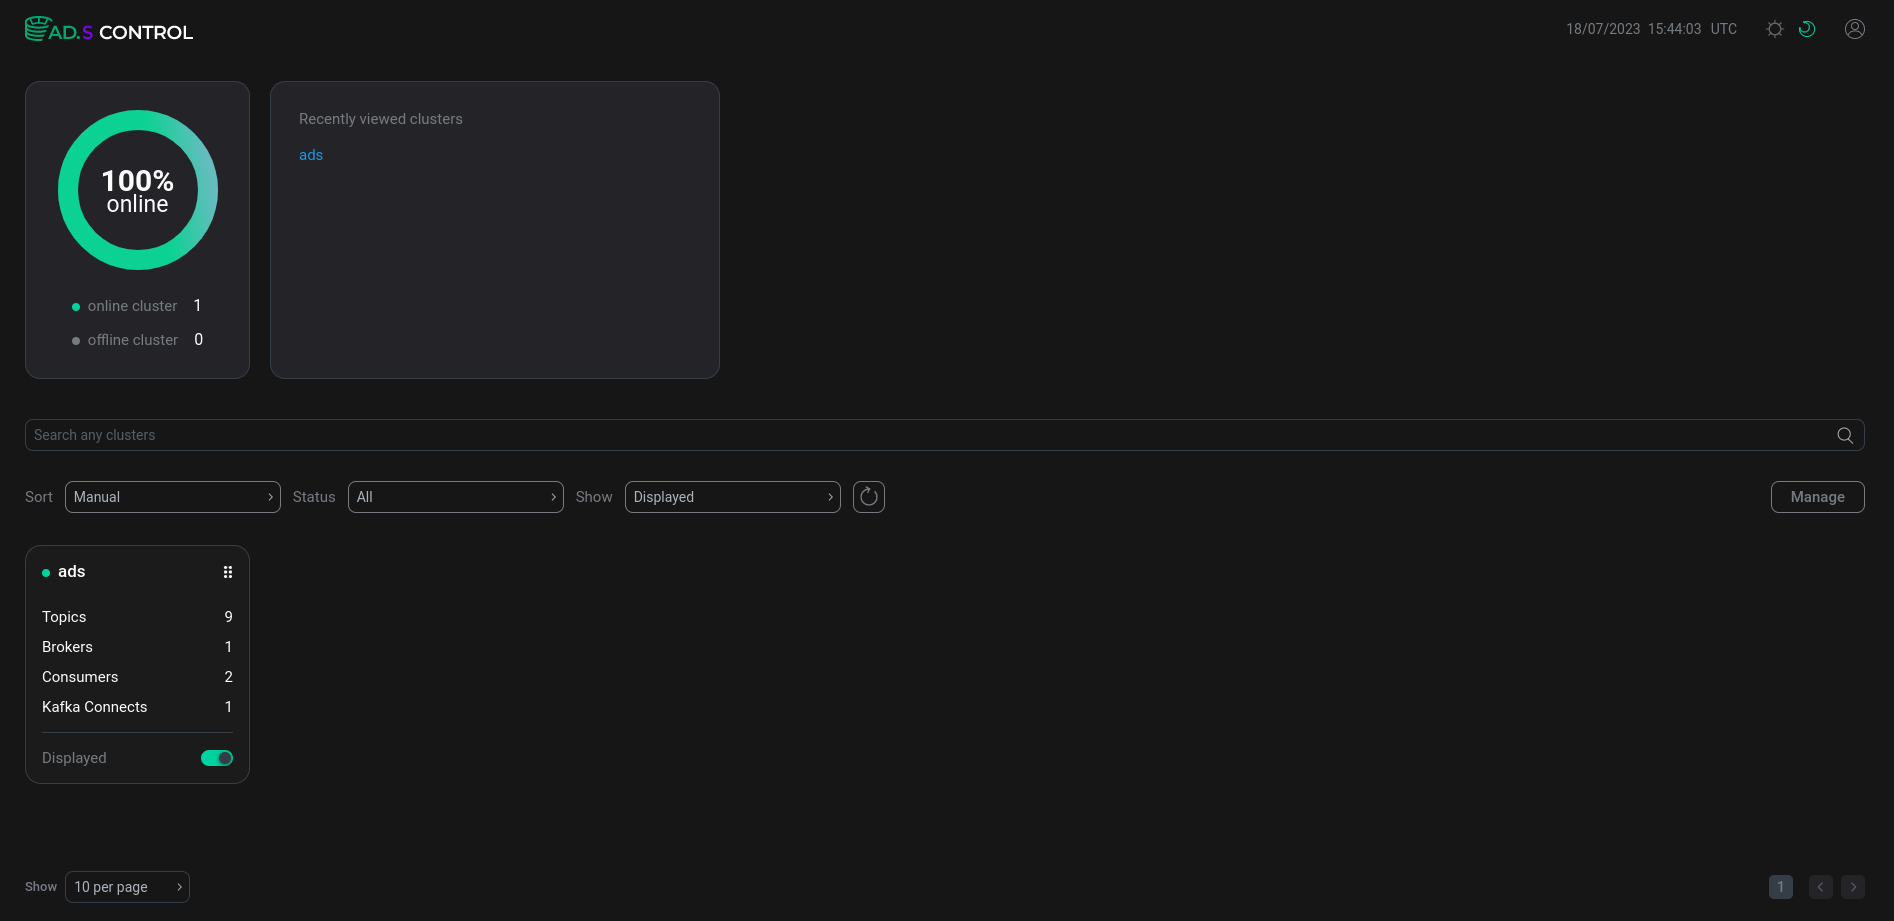
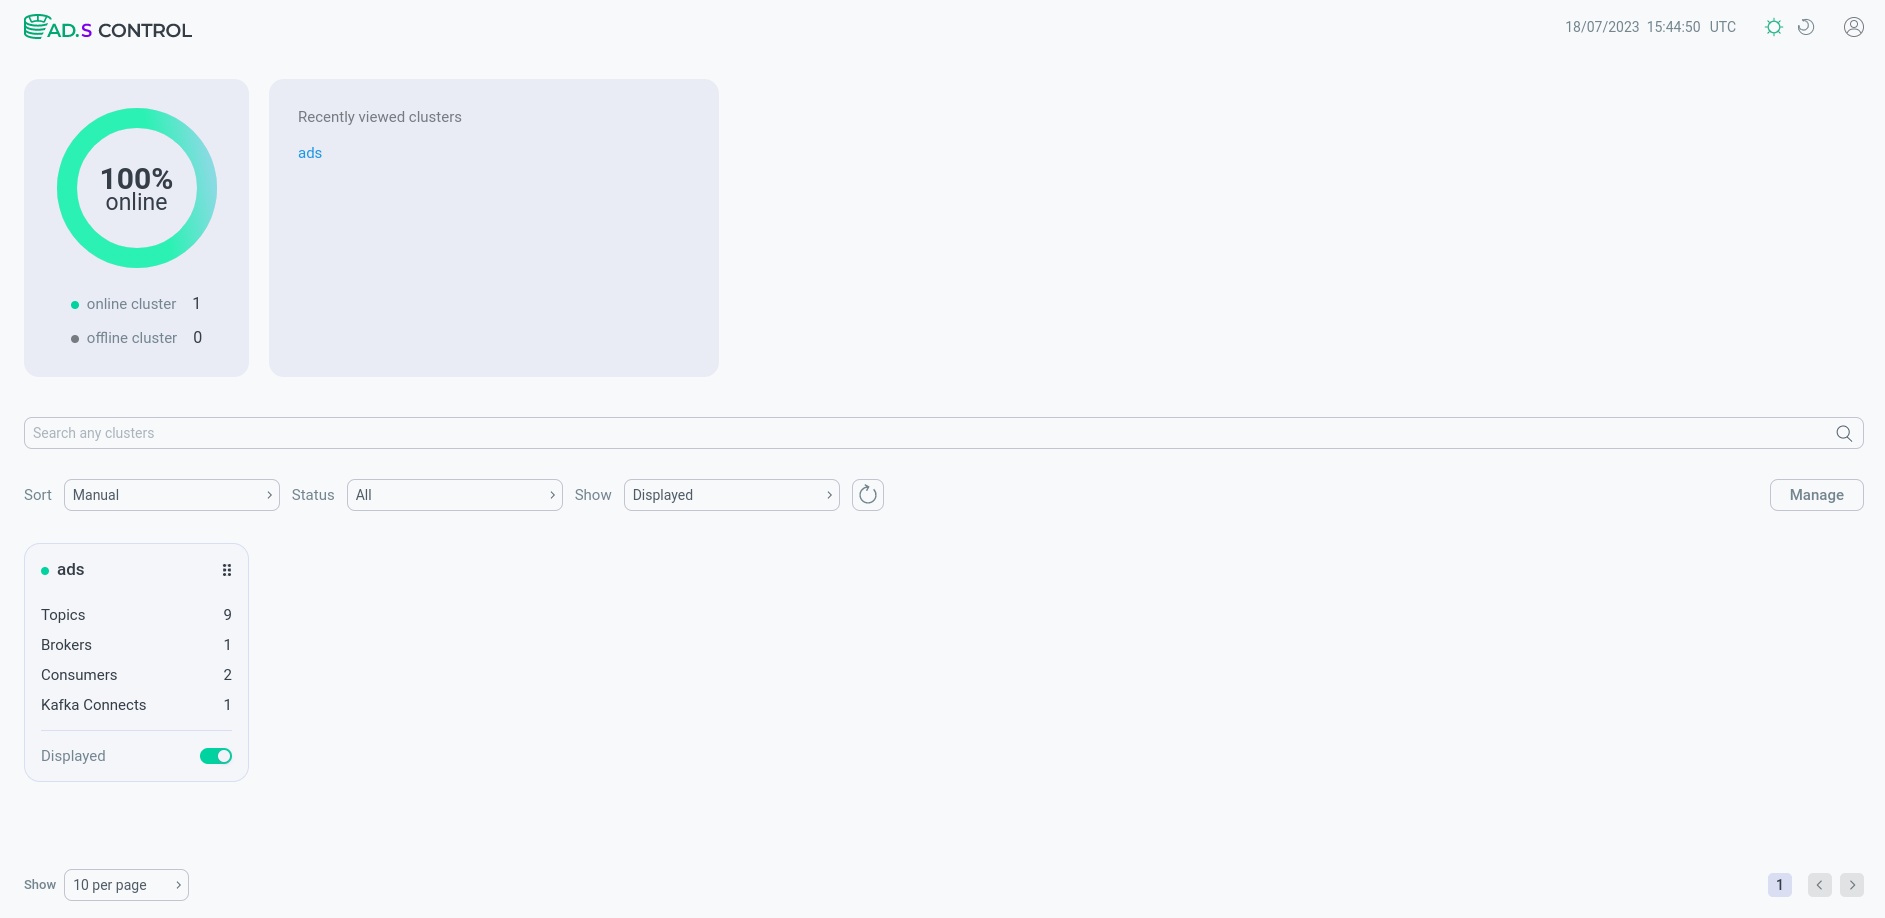
Main window
This is the window that the user sees after logging into ADS Control. The main window contains four sections:
-
Authorization section is located at the top of the screen.
-
Information section is located in the upper half of the screen.
-
Search section is located in the middle of the screen.
-
The cluster management section is located in the lower half of the screen.
All subsections and their contents are described in detail below.
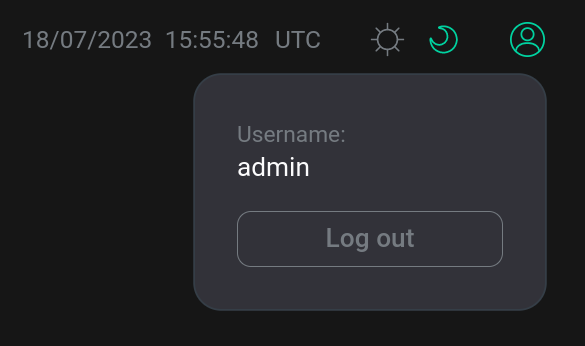
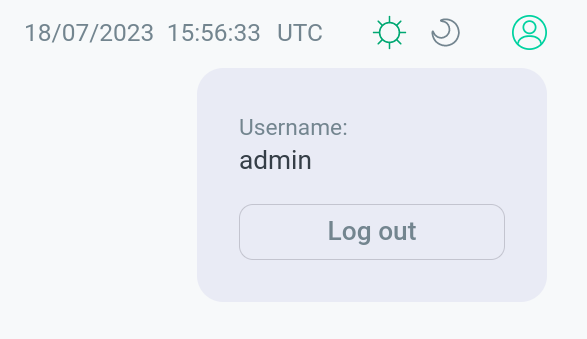
Authorization section
The authorization section appears after clicking on the icon ![]()
![]() located in the upper right corner. The authorization section contains:
located in the upper right corner. The authorization section contains:
-
username under which the session was logged in;
-
Log out button to exit ADS Control or change user.
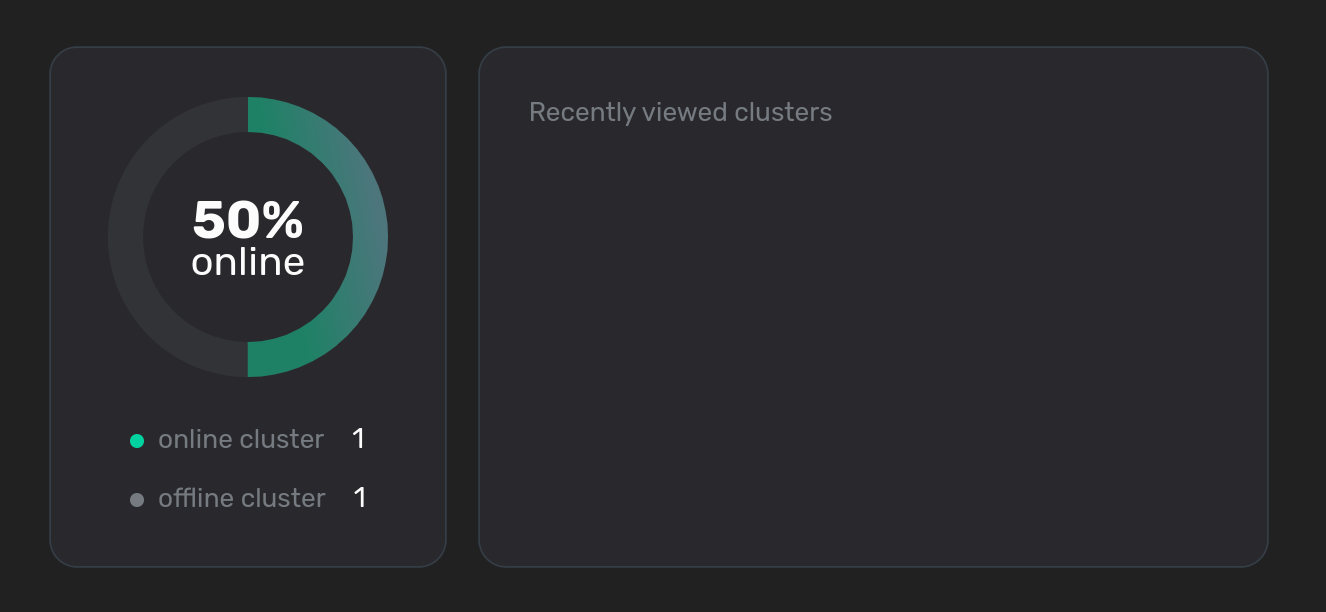
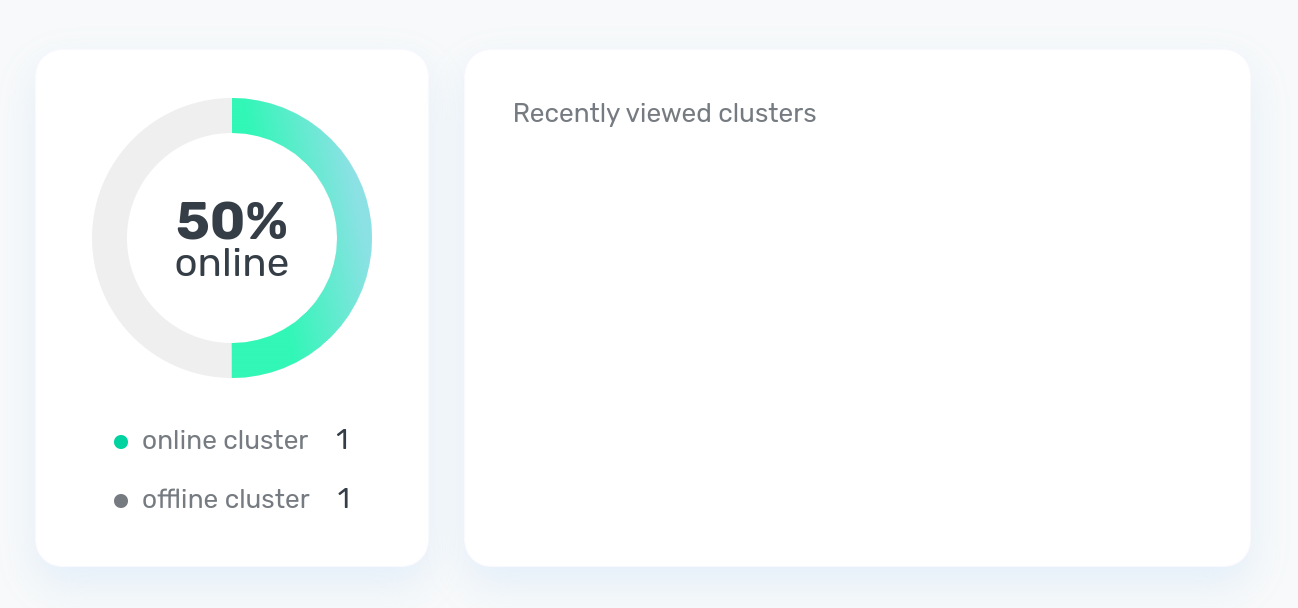
Information section
The information section contains data on the percentage of the number of clusters in the online and offline state. The data is presented in graphical form. Also in this section is available a list of the latest clusters with which work was carried out.
Search section
In this section, you can search for clusters by the entered designation. You can also set filters to search — cluster states.


As a result of the search, clusters matching the search conditions will appear in the cluster management section.
Cluster management section
This section selects a cluster for management.
In the cluster management section, it is possible to set filters for sampling:
-
Sort — defines the sorting method:
-
Ascending — sorting by name in ascending alphabetical order;
-
Descending — sorting by name in descending alphabetical order;
-
Manual — manual sorting.
-
-
Status — defines the cluster status for the sample:
-
Online — clusters in the online state;
-
Offline — clusters in the offline state;
-
All — all clusters.
-
-
Show — indicates which clusters with which visibility should be included in the selection:
-
Hidden — hidden clusters;
-
Displayed — visible clusters
-
All — all clusters.
-
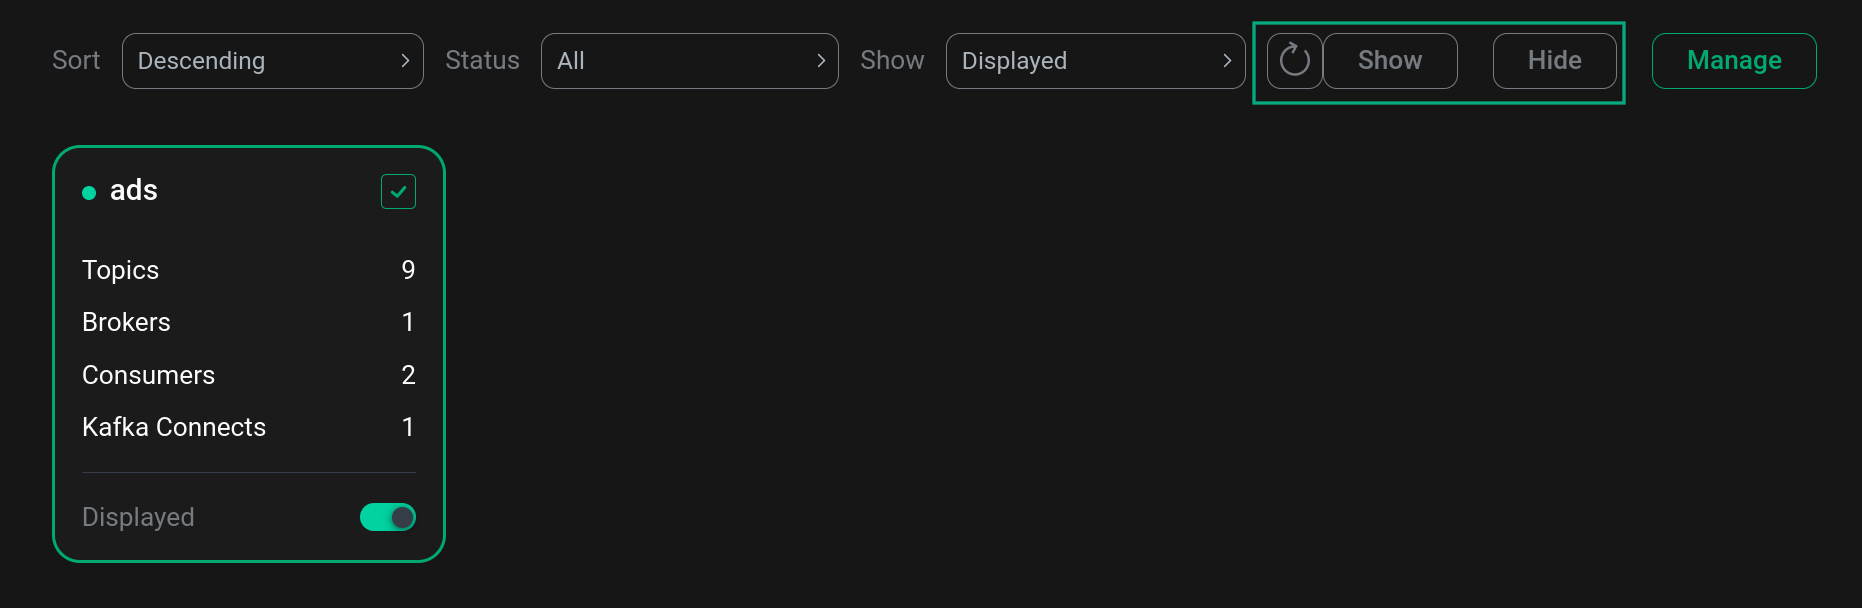
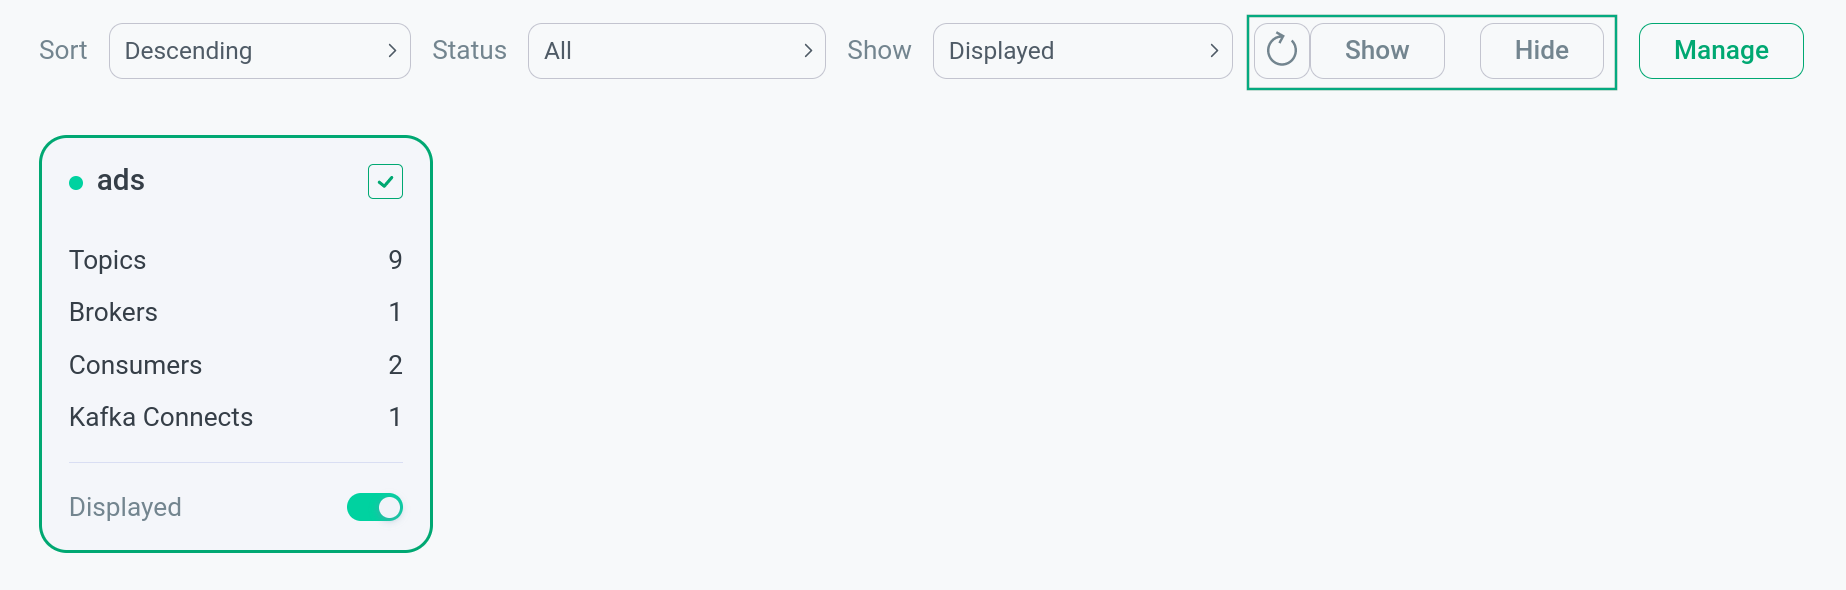
After clicking Manage it becomes possible to hide or open the clusters using the Show and Hide buttons.
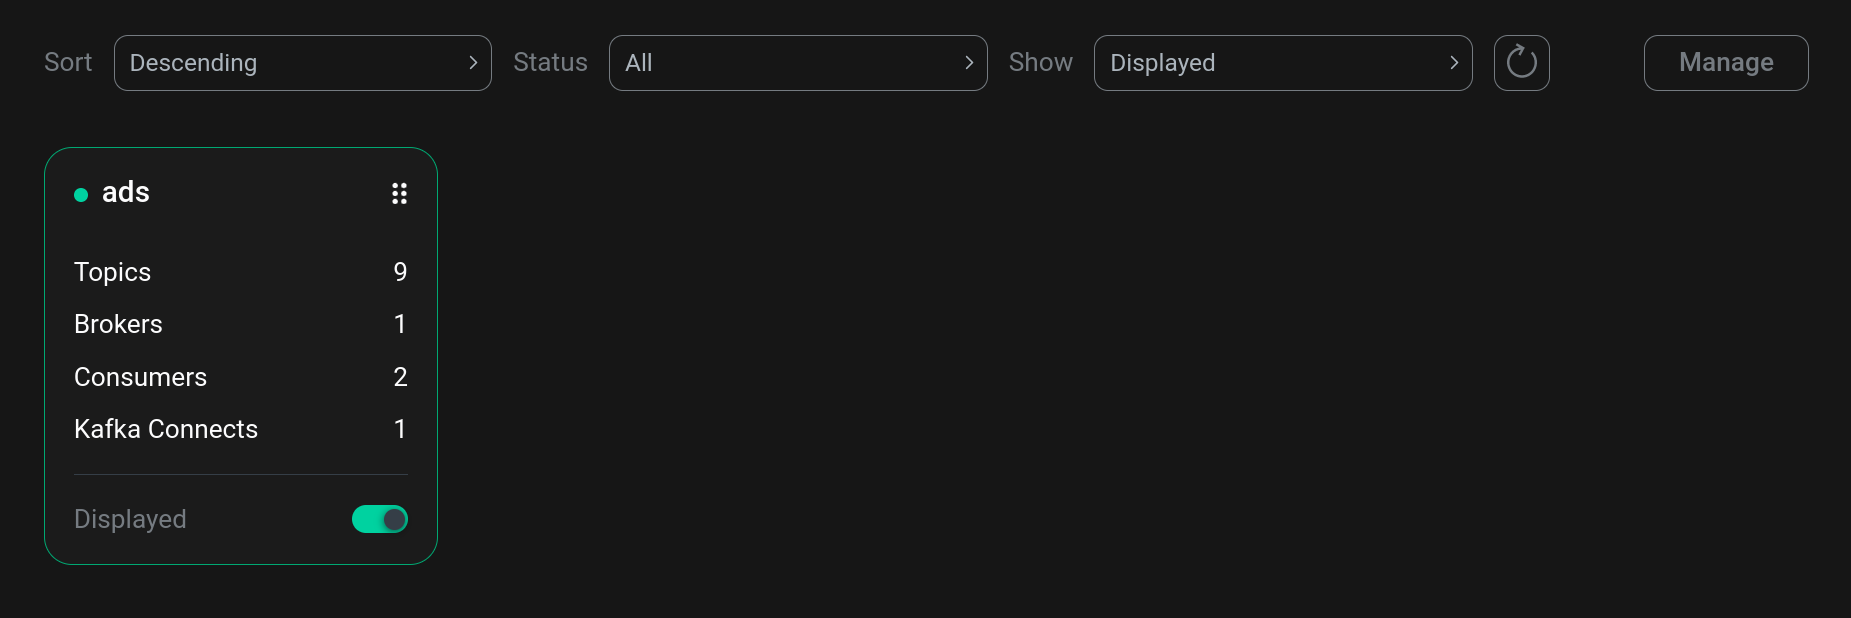
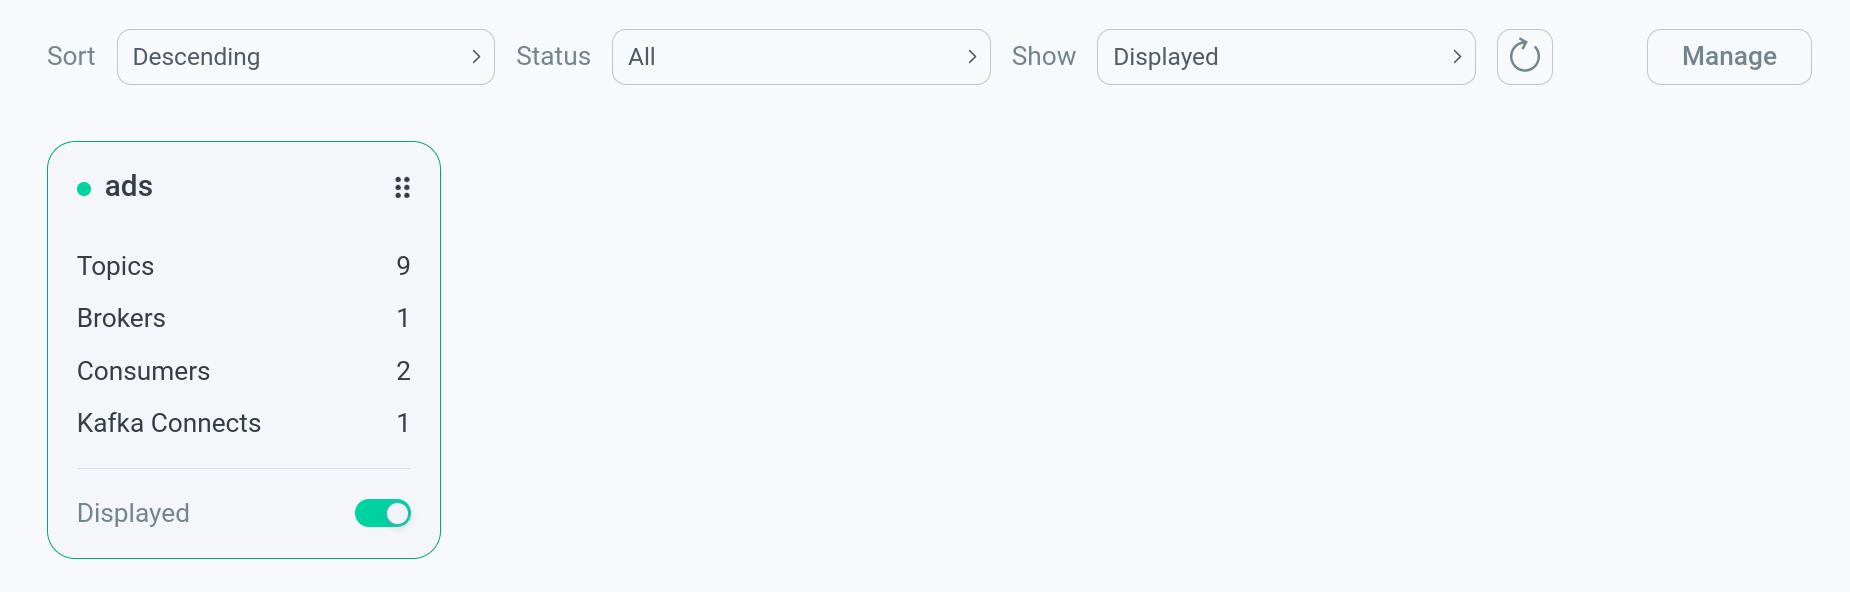
At the bottom of the cluster management section there are graphical displays of the clusters in use.
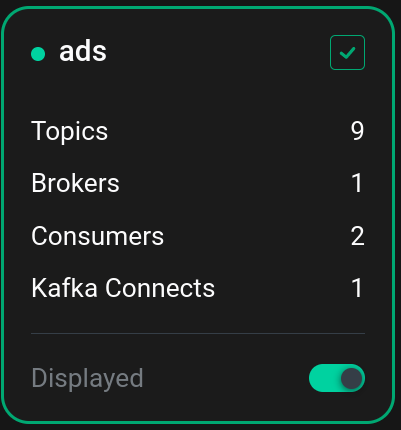
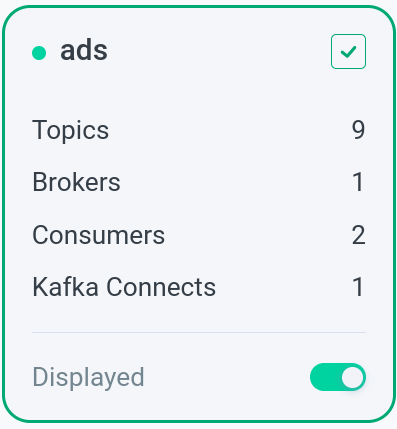
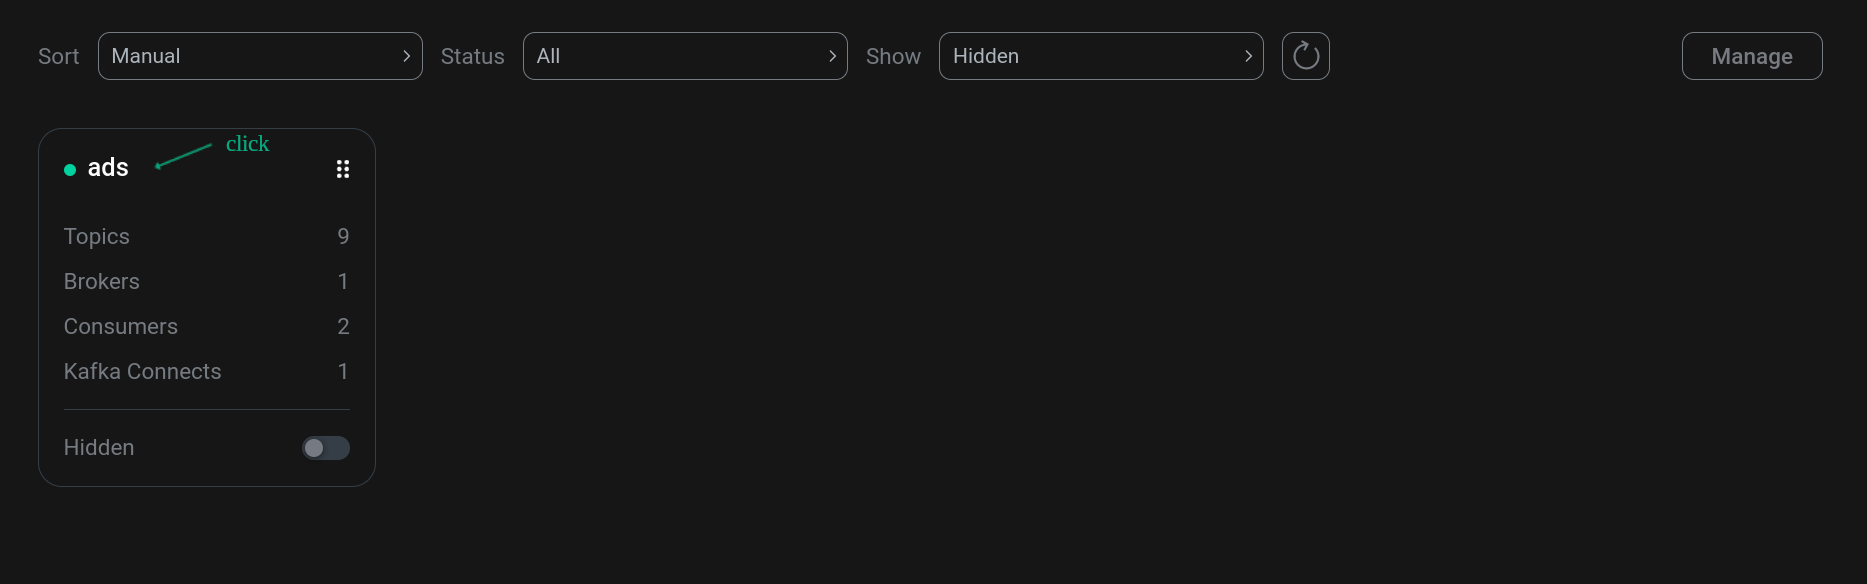
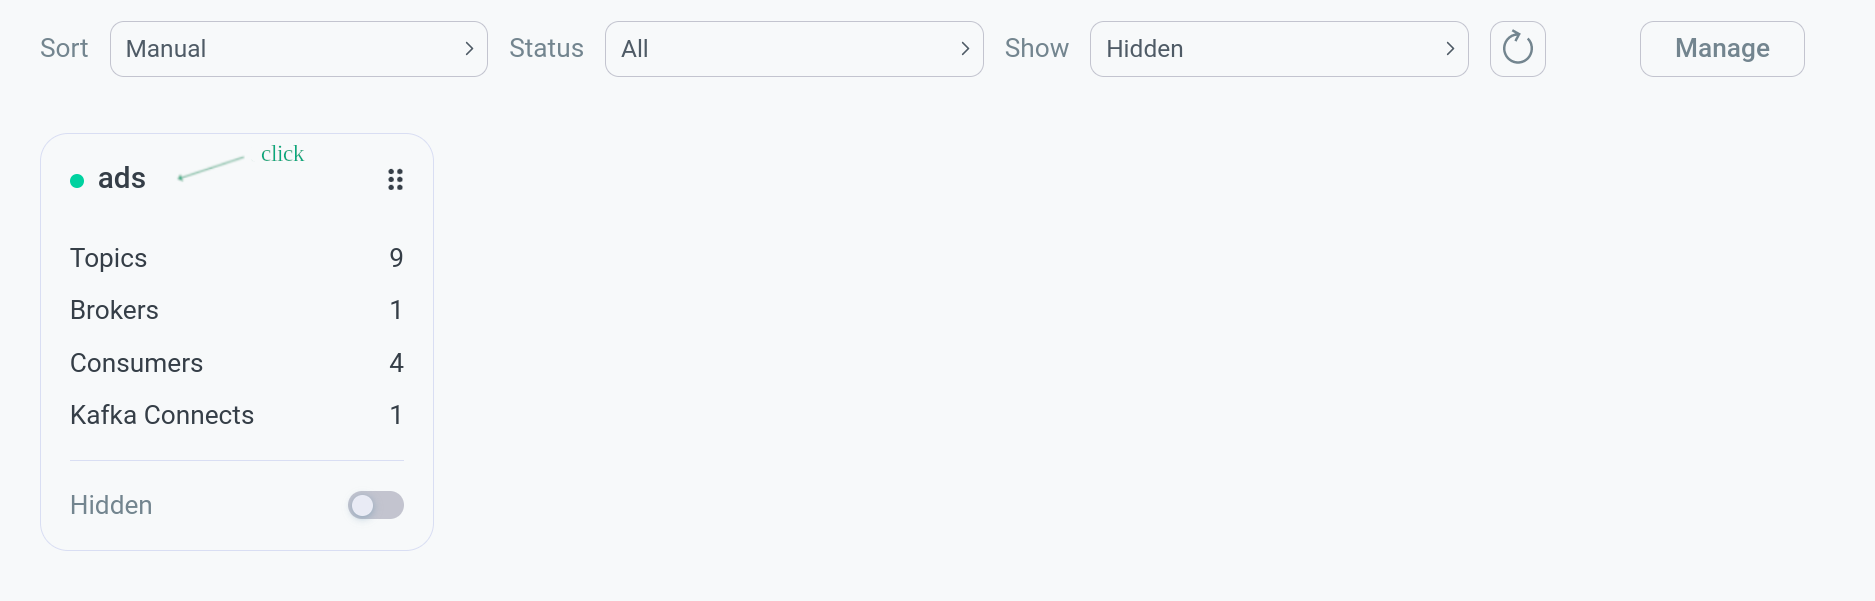
The elements are described below using the example of the presented clusters:
-
Сluster status indicator:
-
 — cluster is online;
 -

 — cluster is offline.
-
-
ads — cluster name.
-
Flag that enables the ability to control the visibility of the cluster using the Show and Hide buttons:
-

 — the cluster is available for visibility control;
 -

 — the cluster is not available for visibility control.
Displayed only when Manage is enabled.
-
-

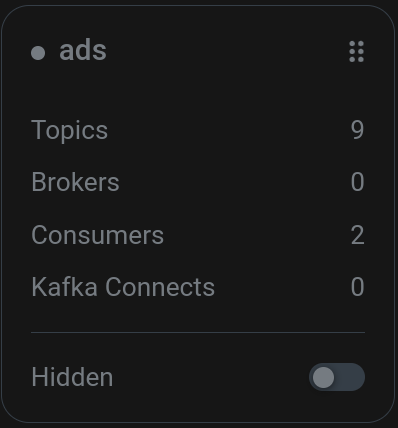
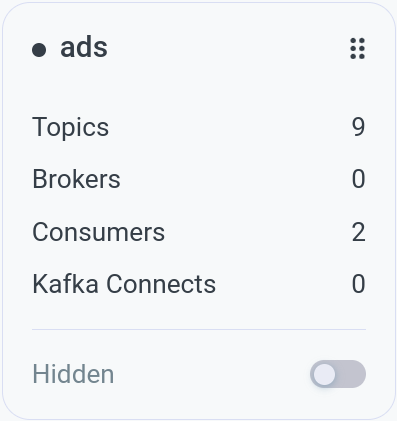
 — icon, dragging which it is possible to move the cluster image in the cluster management section. Available only when Manage is disabled.
 -
Cluster data showing cluster elements:
-
number of topics;
-
number of brokers;
-
number of consumers;
-
number of Kafka Connect instances;
-
a valid instance of the Schema Registry service.
-
-
switch to change cluster visibility:
-

 — cluster is displayed ;
 -

 — cluster hidden .
-
Cluster management
To manage a cluster, in the cluster management section, click on the graphical display of the cluster.
Next, the General page opens with the available functionality and diagnostics for this cluster.
After opening the General window, you can switch to the following tabs for diagnosing and managing the cluster: