

View a dashboard
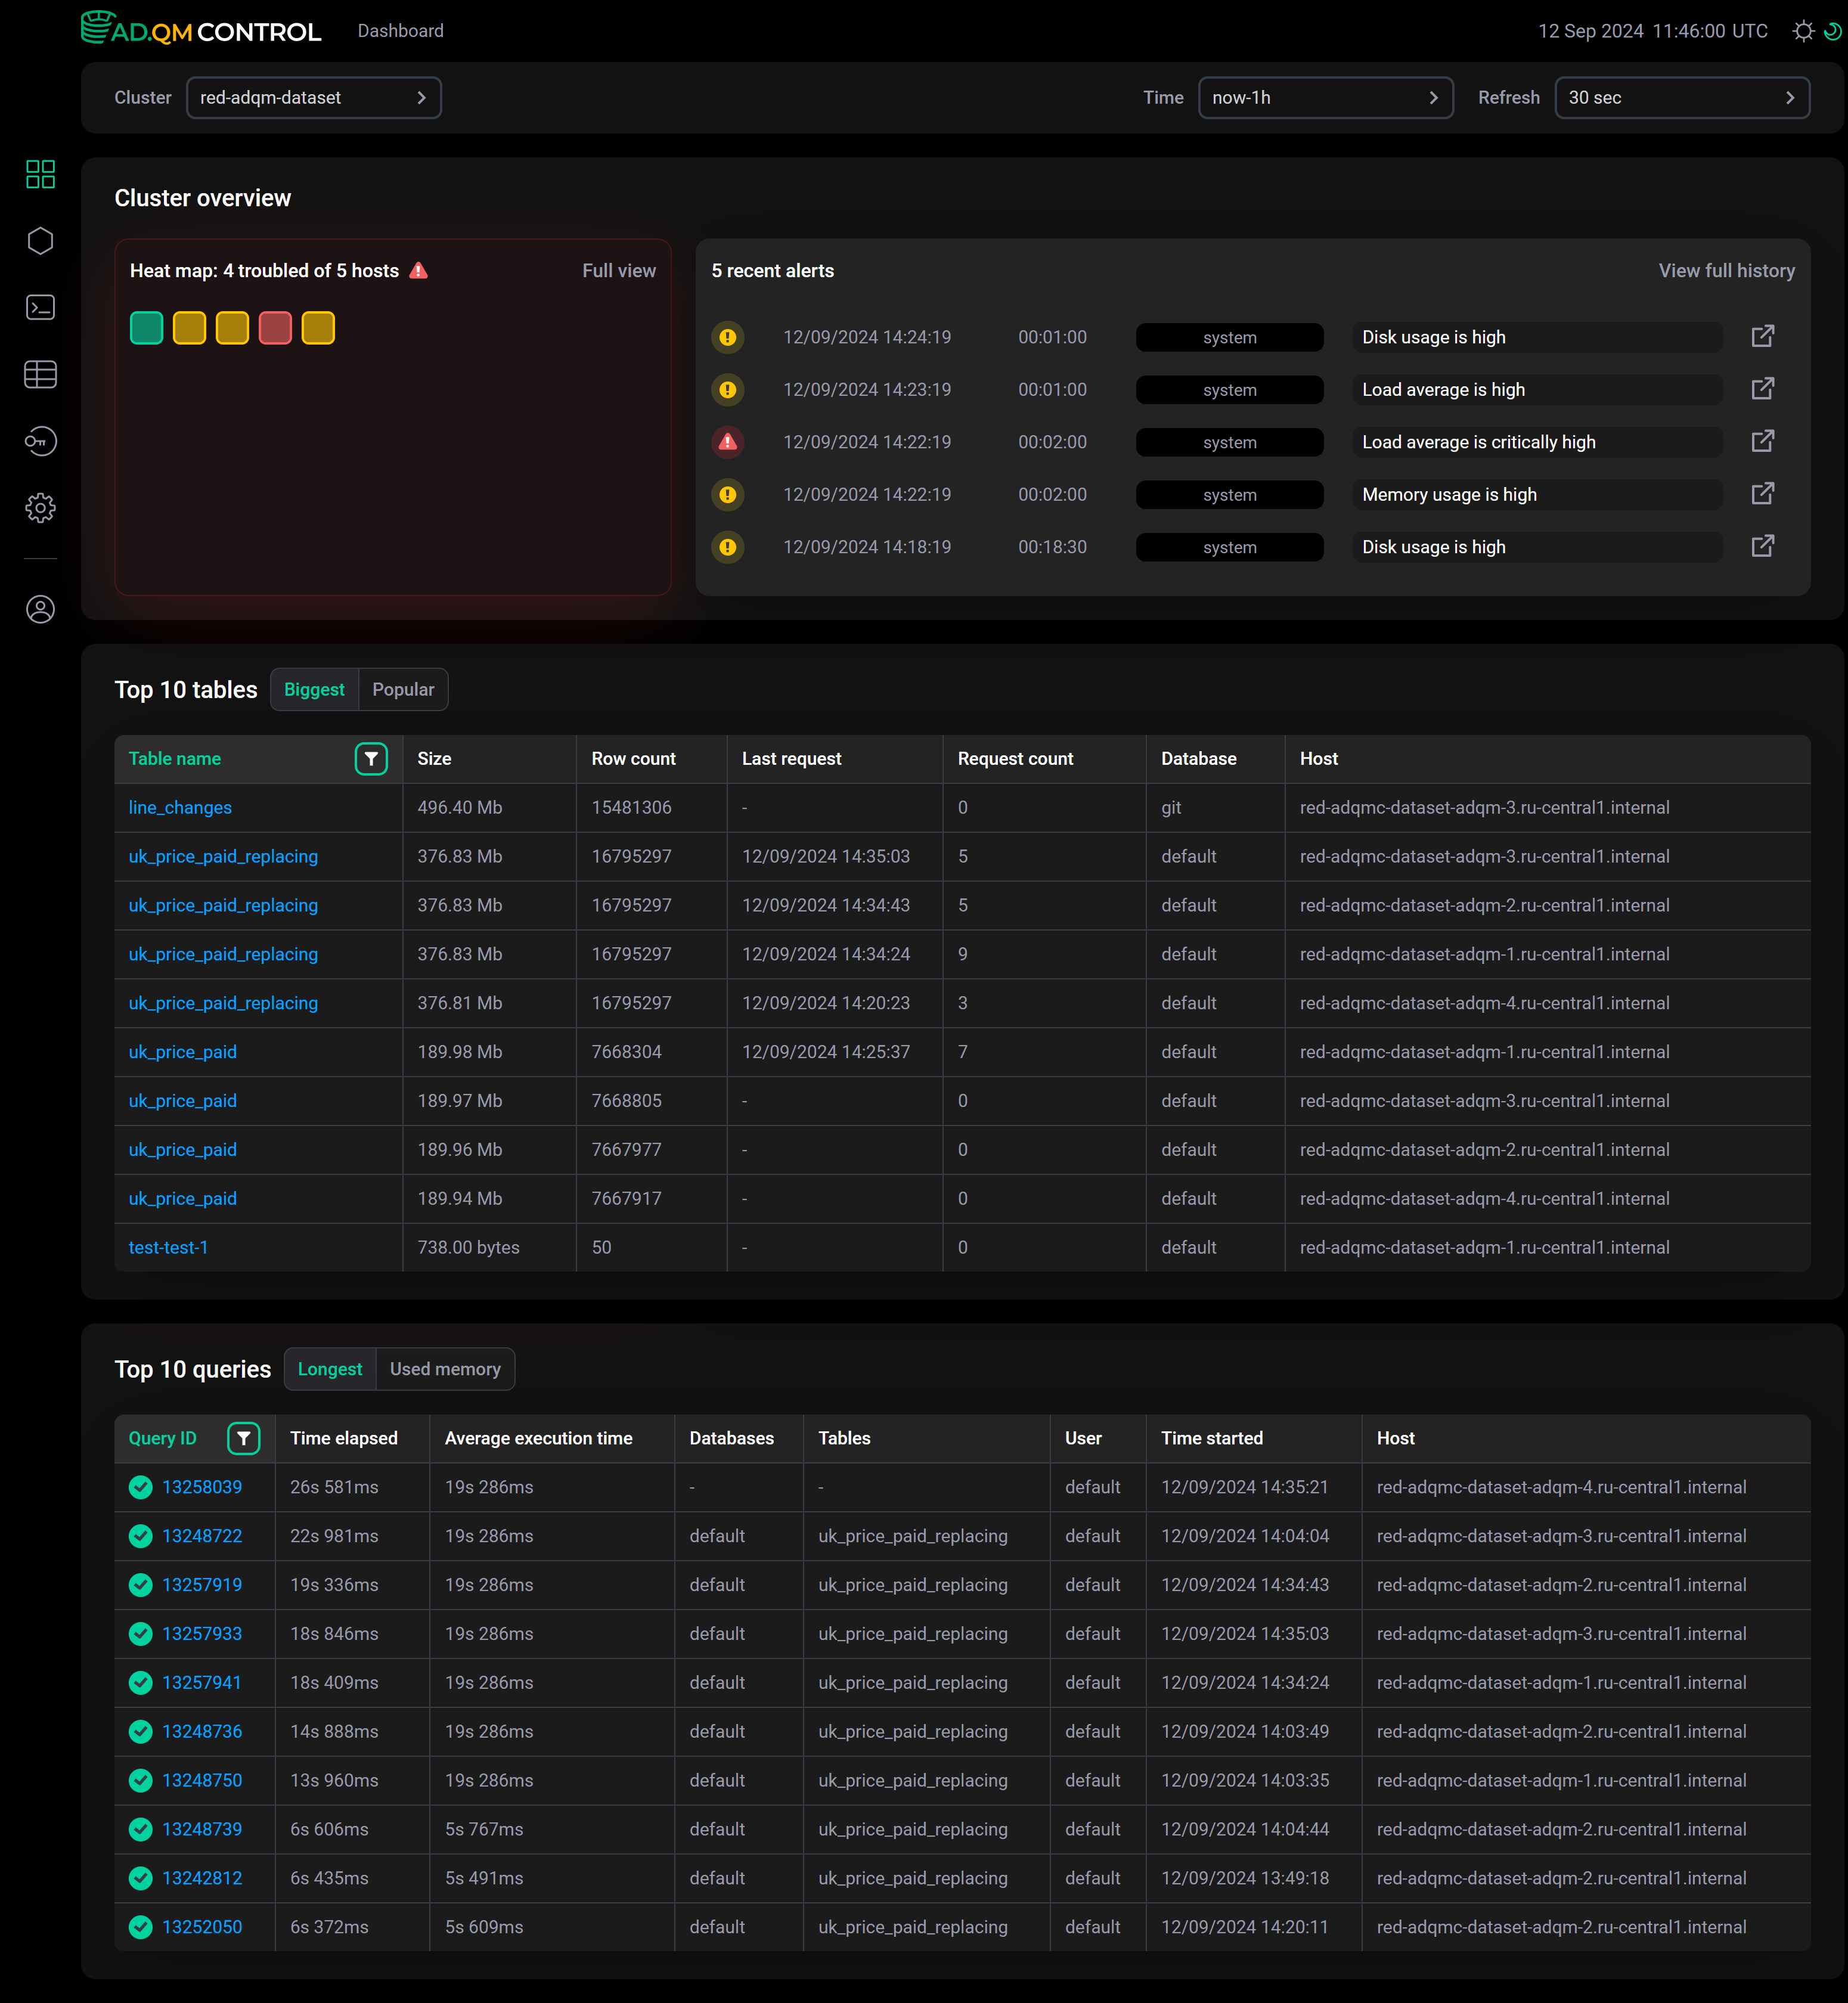
The Dashboard page of the ADQM Control web interface displays general information about an ADQM cluster state as:
-
Heat map — graphically represents the states of the ADQM cluster hosts.
-
Recent alerts — lists the latest alerts about potential and critical issues detected on the ADQM cluster hosts.
-
Top 10 tables — 10 largest tables by data amount in the ADQM cluster and 10 tables to which the most queries were sent.
-
Top 10 queries — 10 queries that took the longest to execute and 10 queries that used the most memory.
In the fields at the top of the screen, you can configure the following filters for selecting data to build a dashboard:
-
Cluster — ADQM cluster for which information should be displayed.
-
Time — time period for which information is required. In the window that opens when you click the field, you can select an interval from the offered options on the Range tab or set a custom time range (at least 1 hour) on the Calendar tab.
-
Refresh — frequency of data updates.
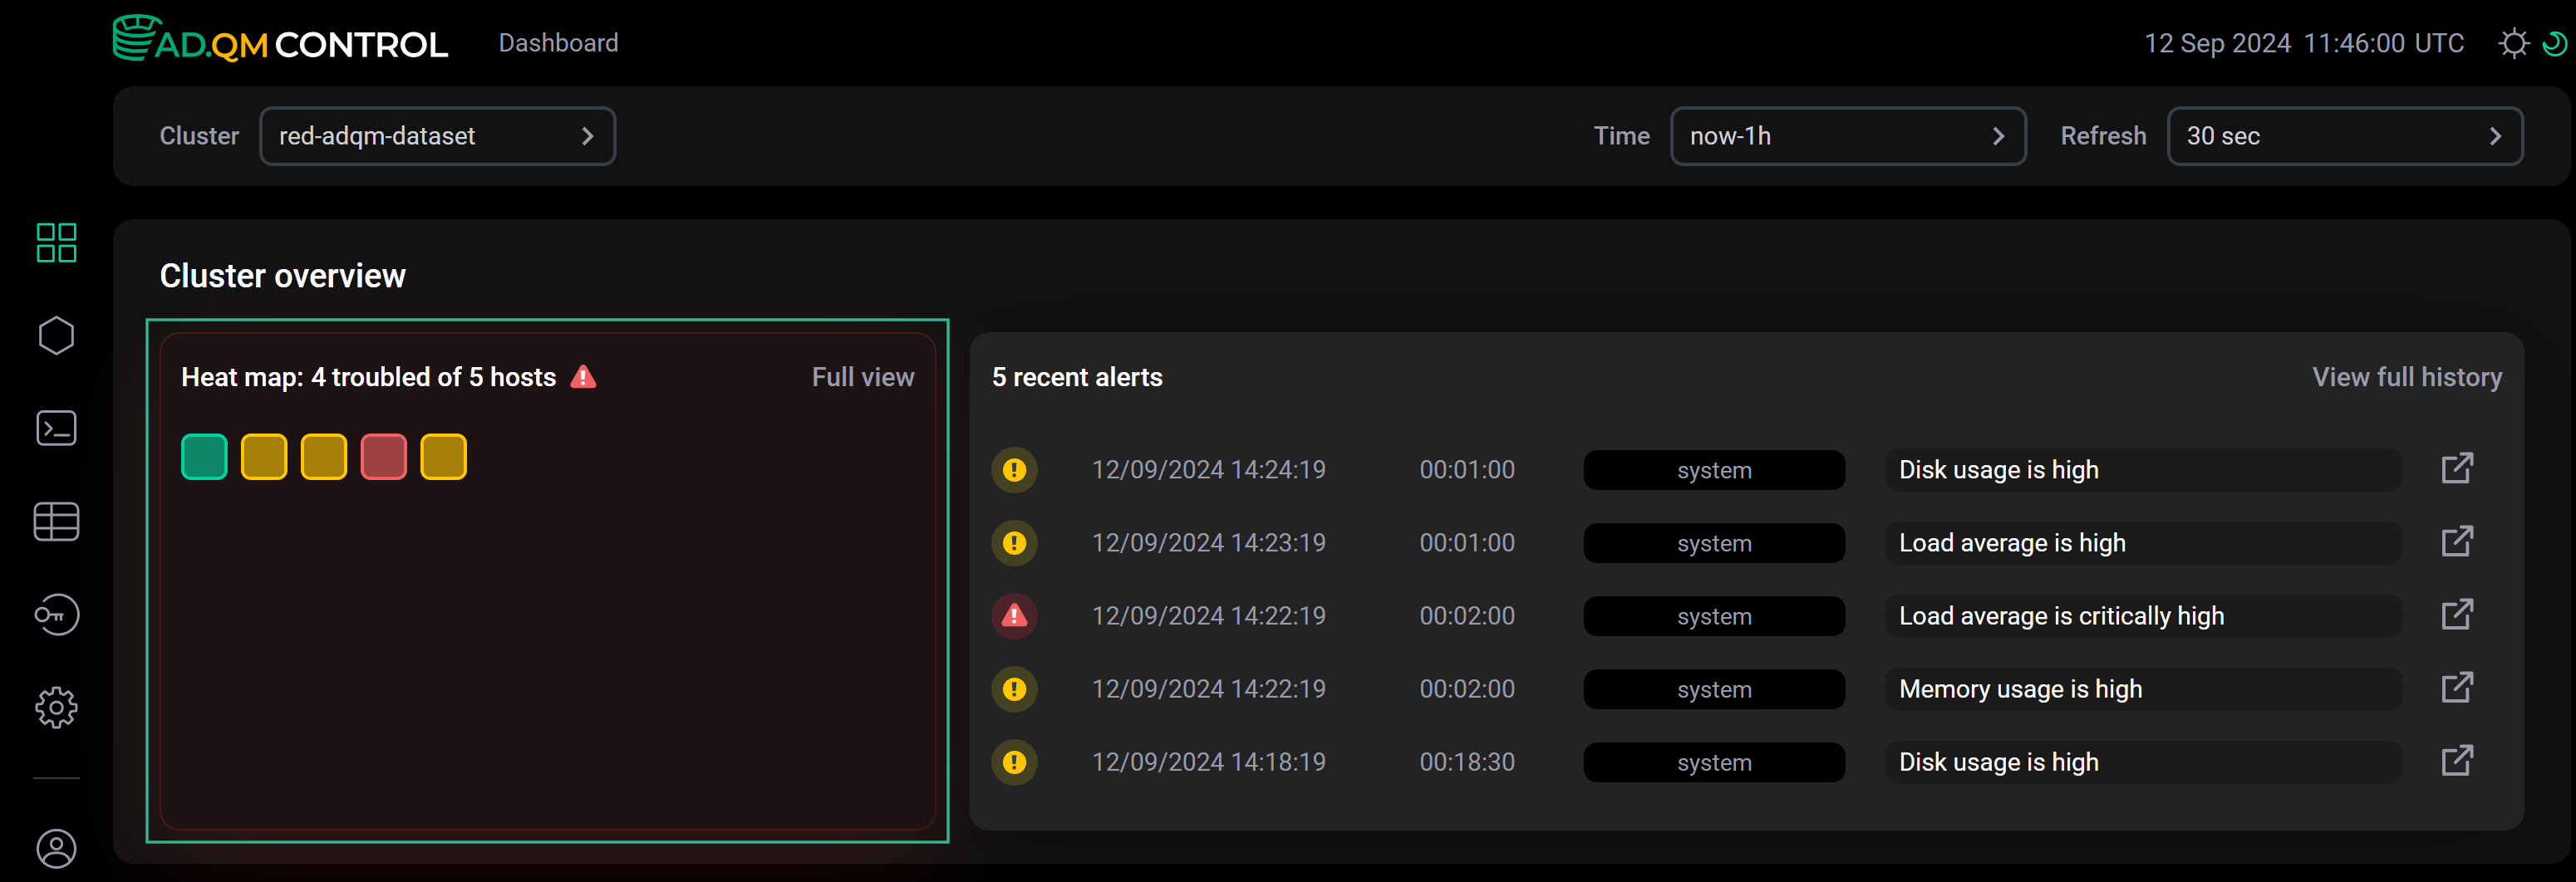
Heat map
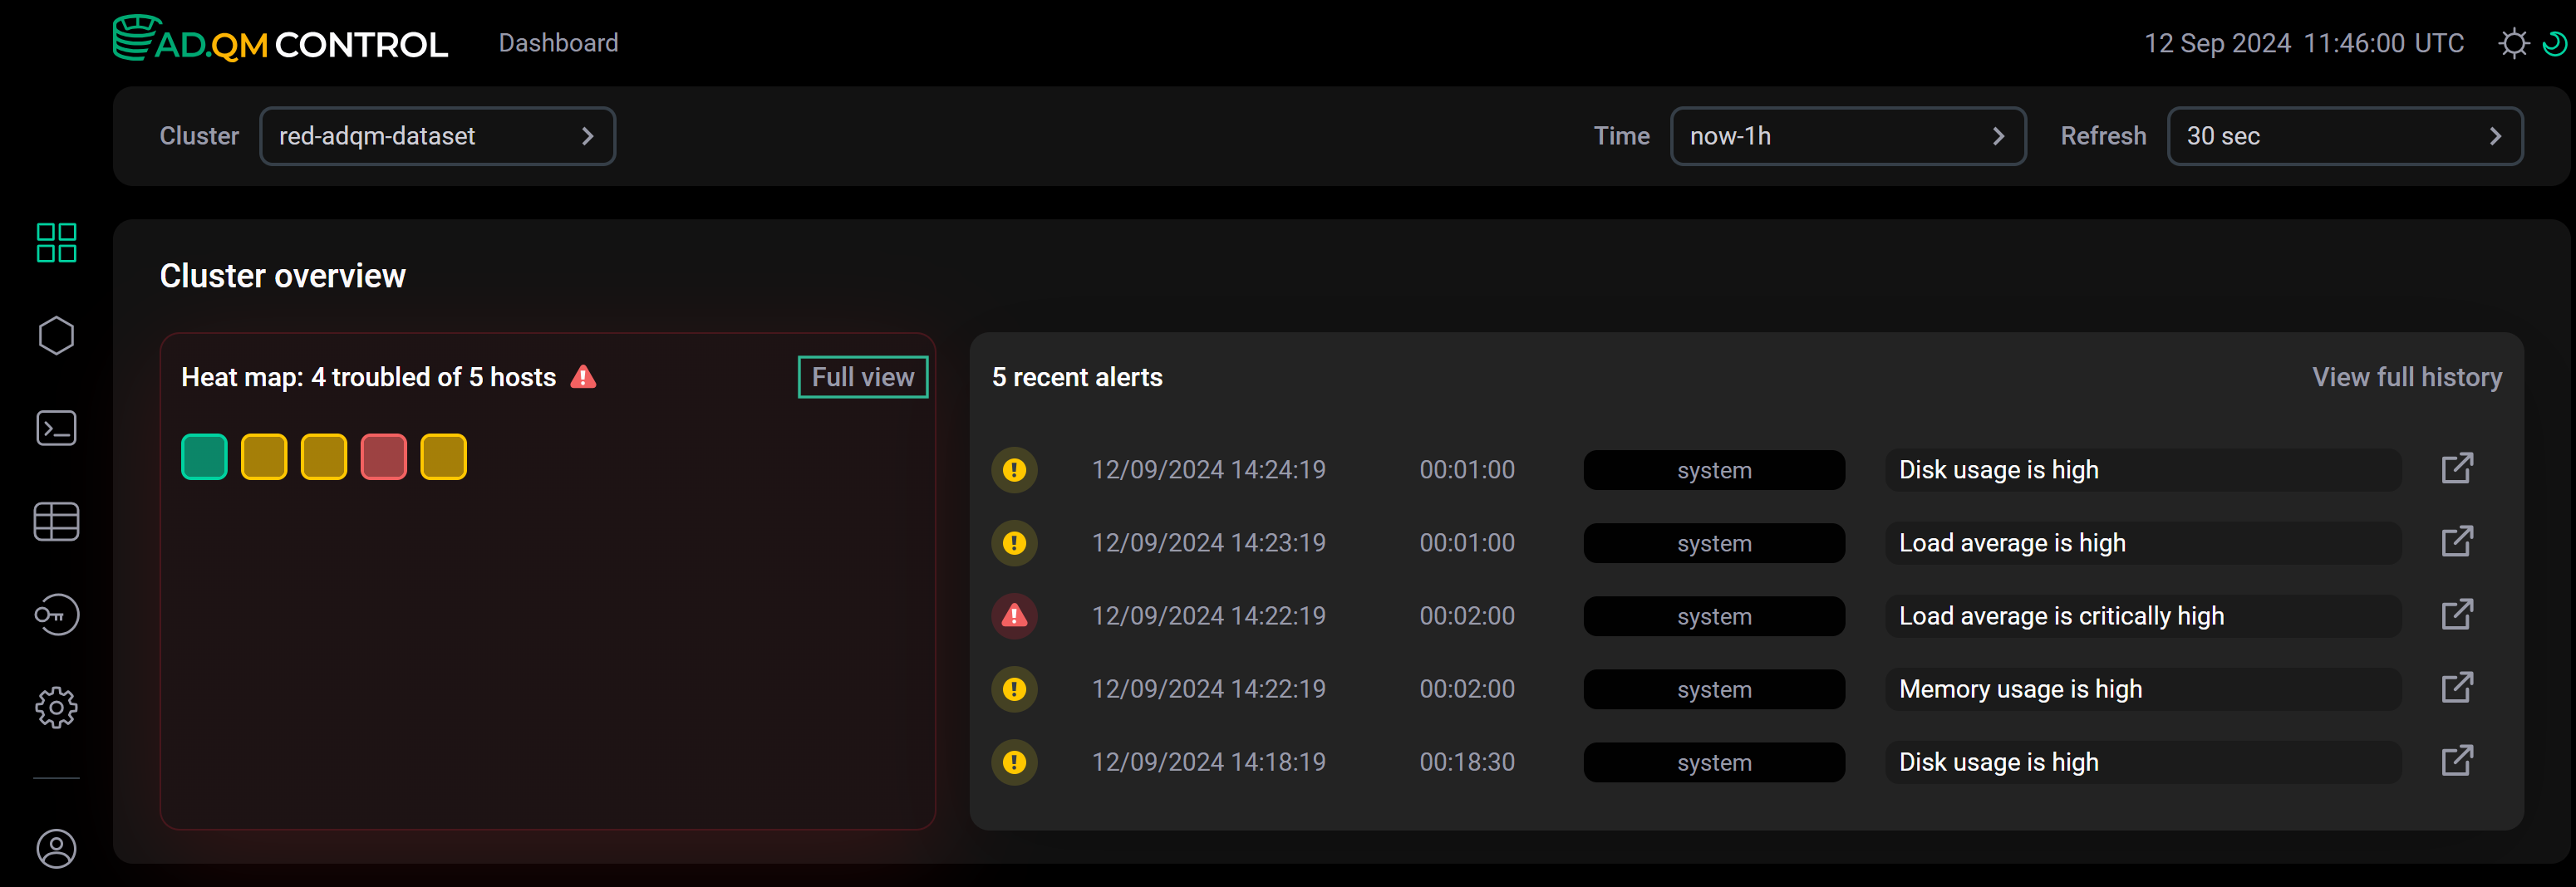
A heat map visualizes information about the states of all hosts in the ADQM cluster — each host is drawn as a square and its color indicates the system state at the selected time interval.
ADQM Control determines a host state and assigns the corresponding color to it in the Heat map matrix based on existing alerts about host issues:
 — there are no alerts about any issues on a host in ADQM Control (a healthy host).
 — only potential issues have been detected on a host (for example, the increase in the values of some system metrics), but they are not yet critical. Appropriate warning alerts about these issues have been generated and continue to remain relevant in ADQM Control.
 — at least one critical issue has been detected on a host and the corresponding alert of the high-importance level about it exists in ADQM Control.
When you hover the mouse over a host in Heat map, a pop-up window shows a list of alerts about problems found on this host (for each problem type, only the latest relevant alert is displayed).
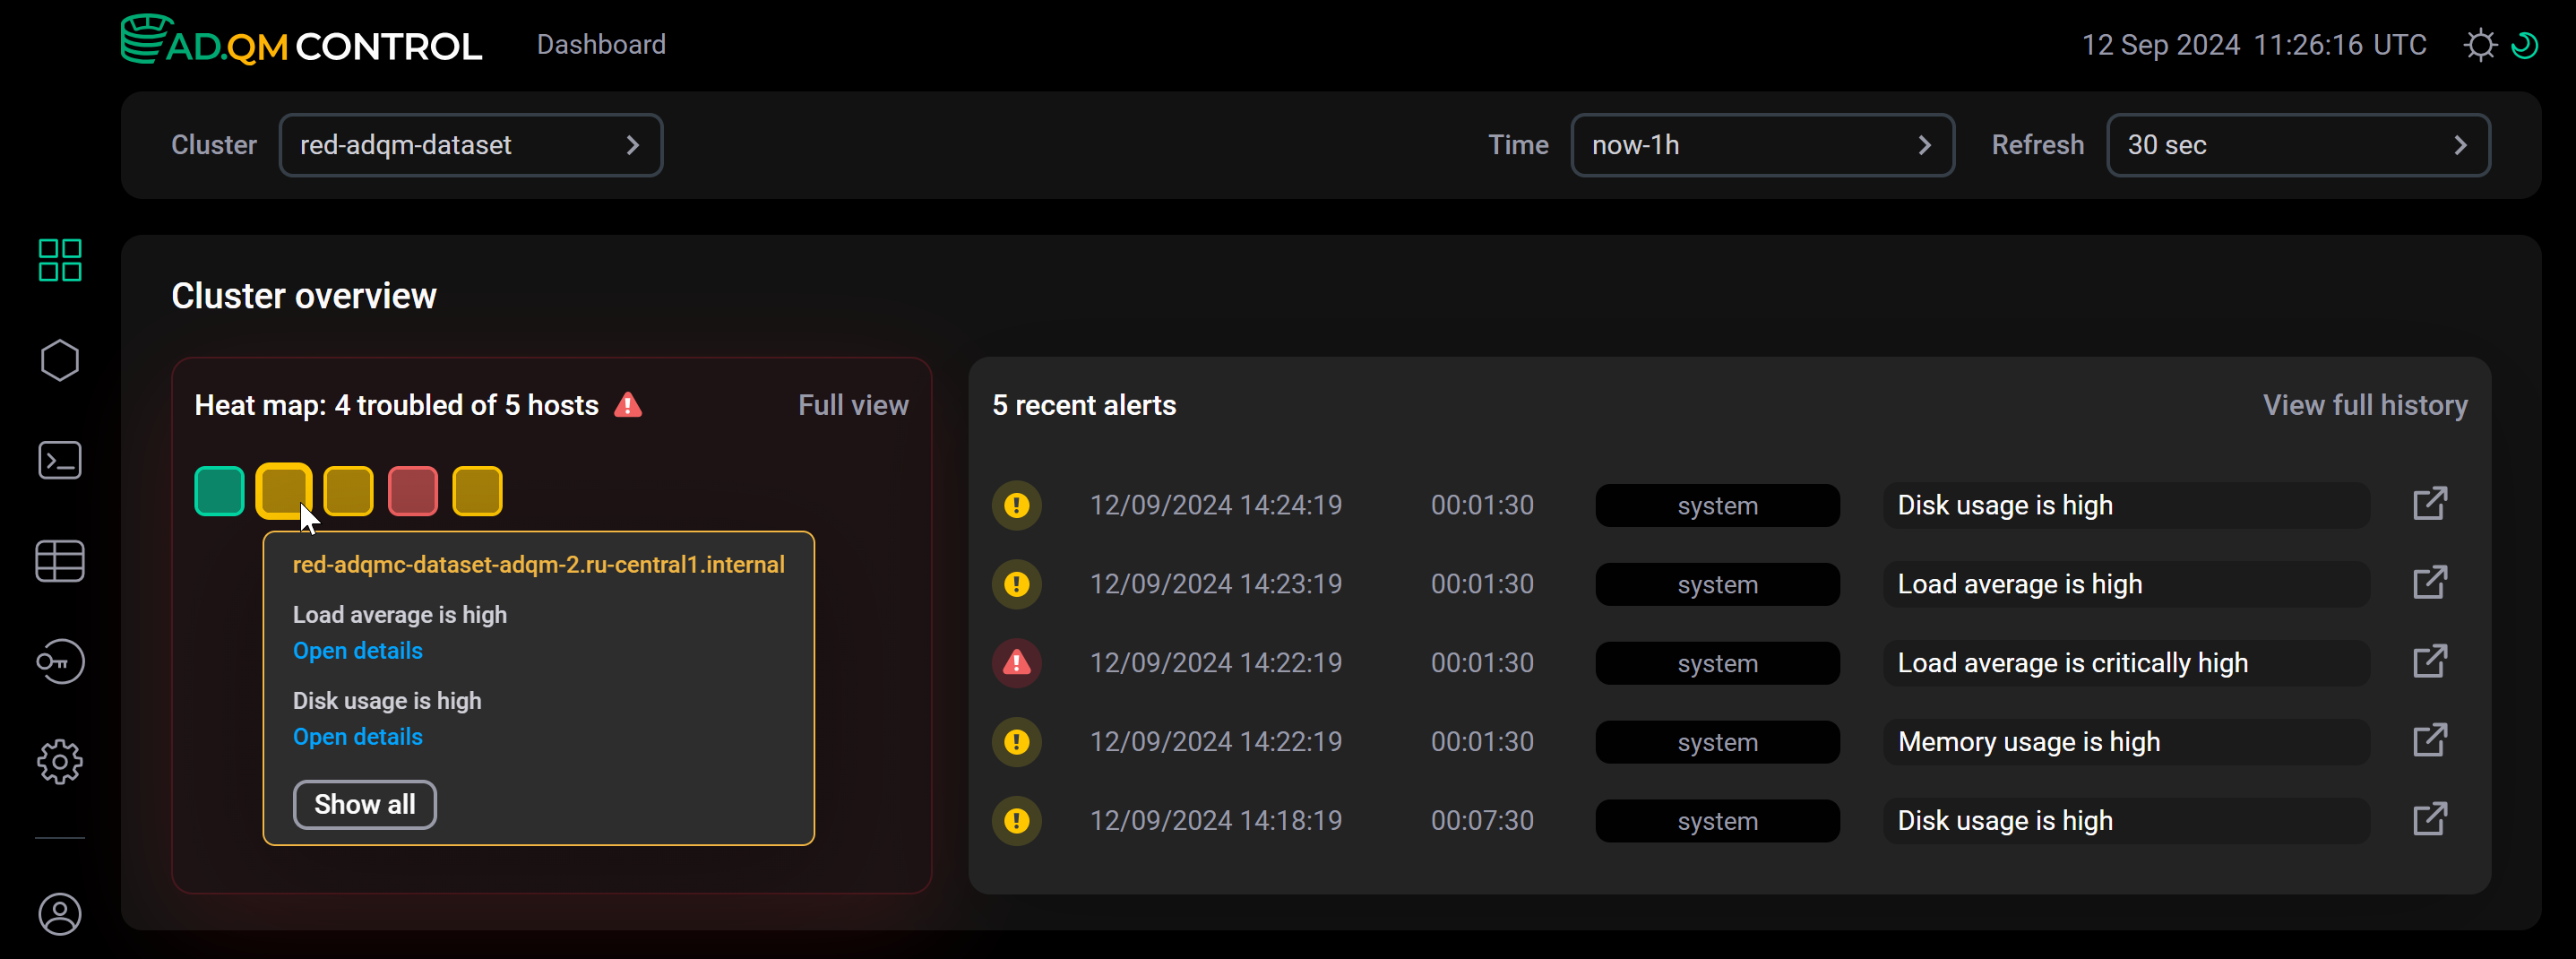
From this pop-up window, you can access more detailed information on alerts related to a host in one of the following ways:
-
Click Open details below an alert to get more information about the related issue on a separate page. For example, the details of the alert
Disk usage is highshow which device is running out of free space.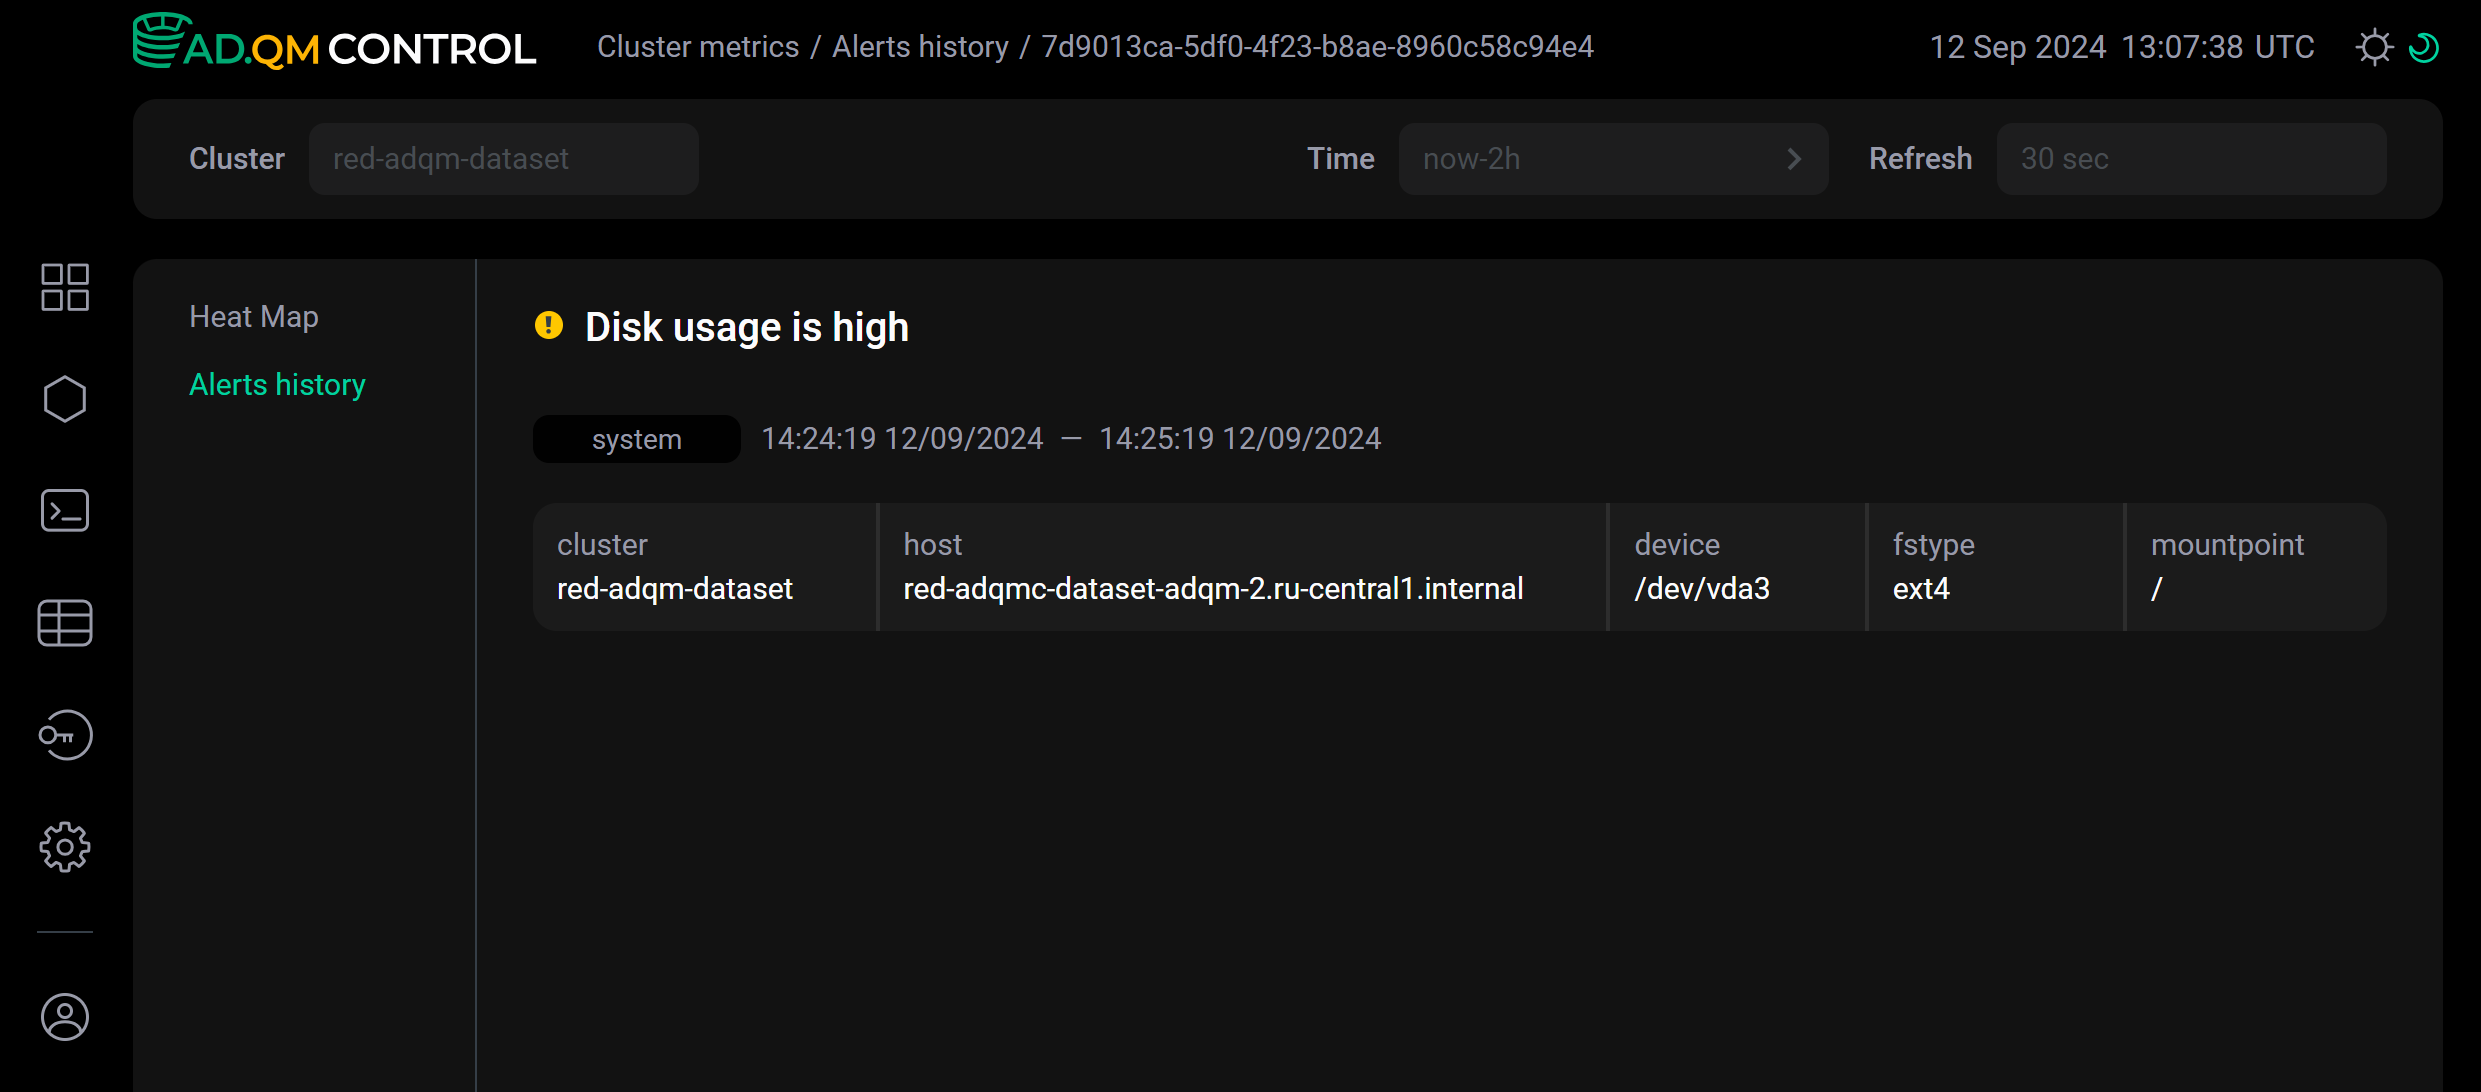 Host issue details
 -
Click Show all to open the Cluster metrics → Heat map page, where the heat map matrix is also shown and additionally a table with a list of all alerts related to the selected host is displayed on the right. To get more information about a specific alert, click the corresponding row in the table — alert details will appear below the row.
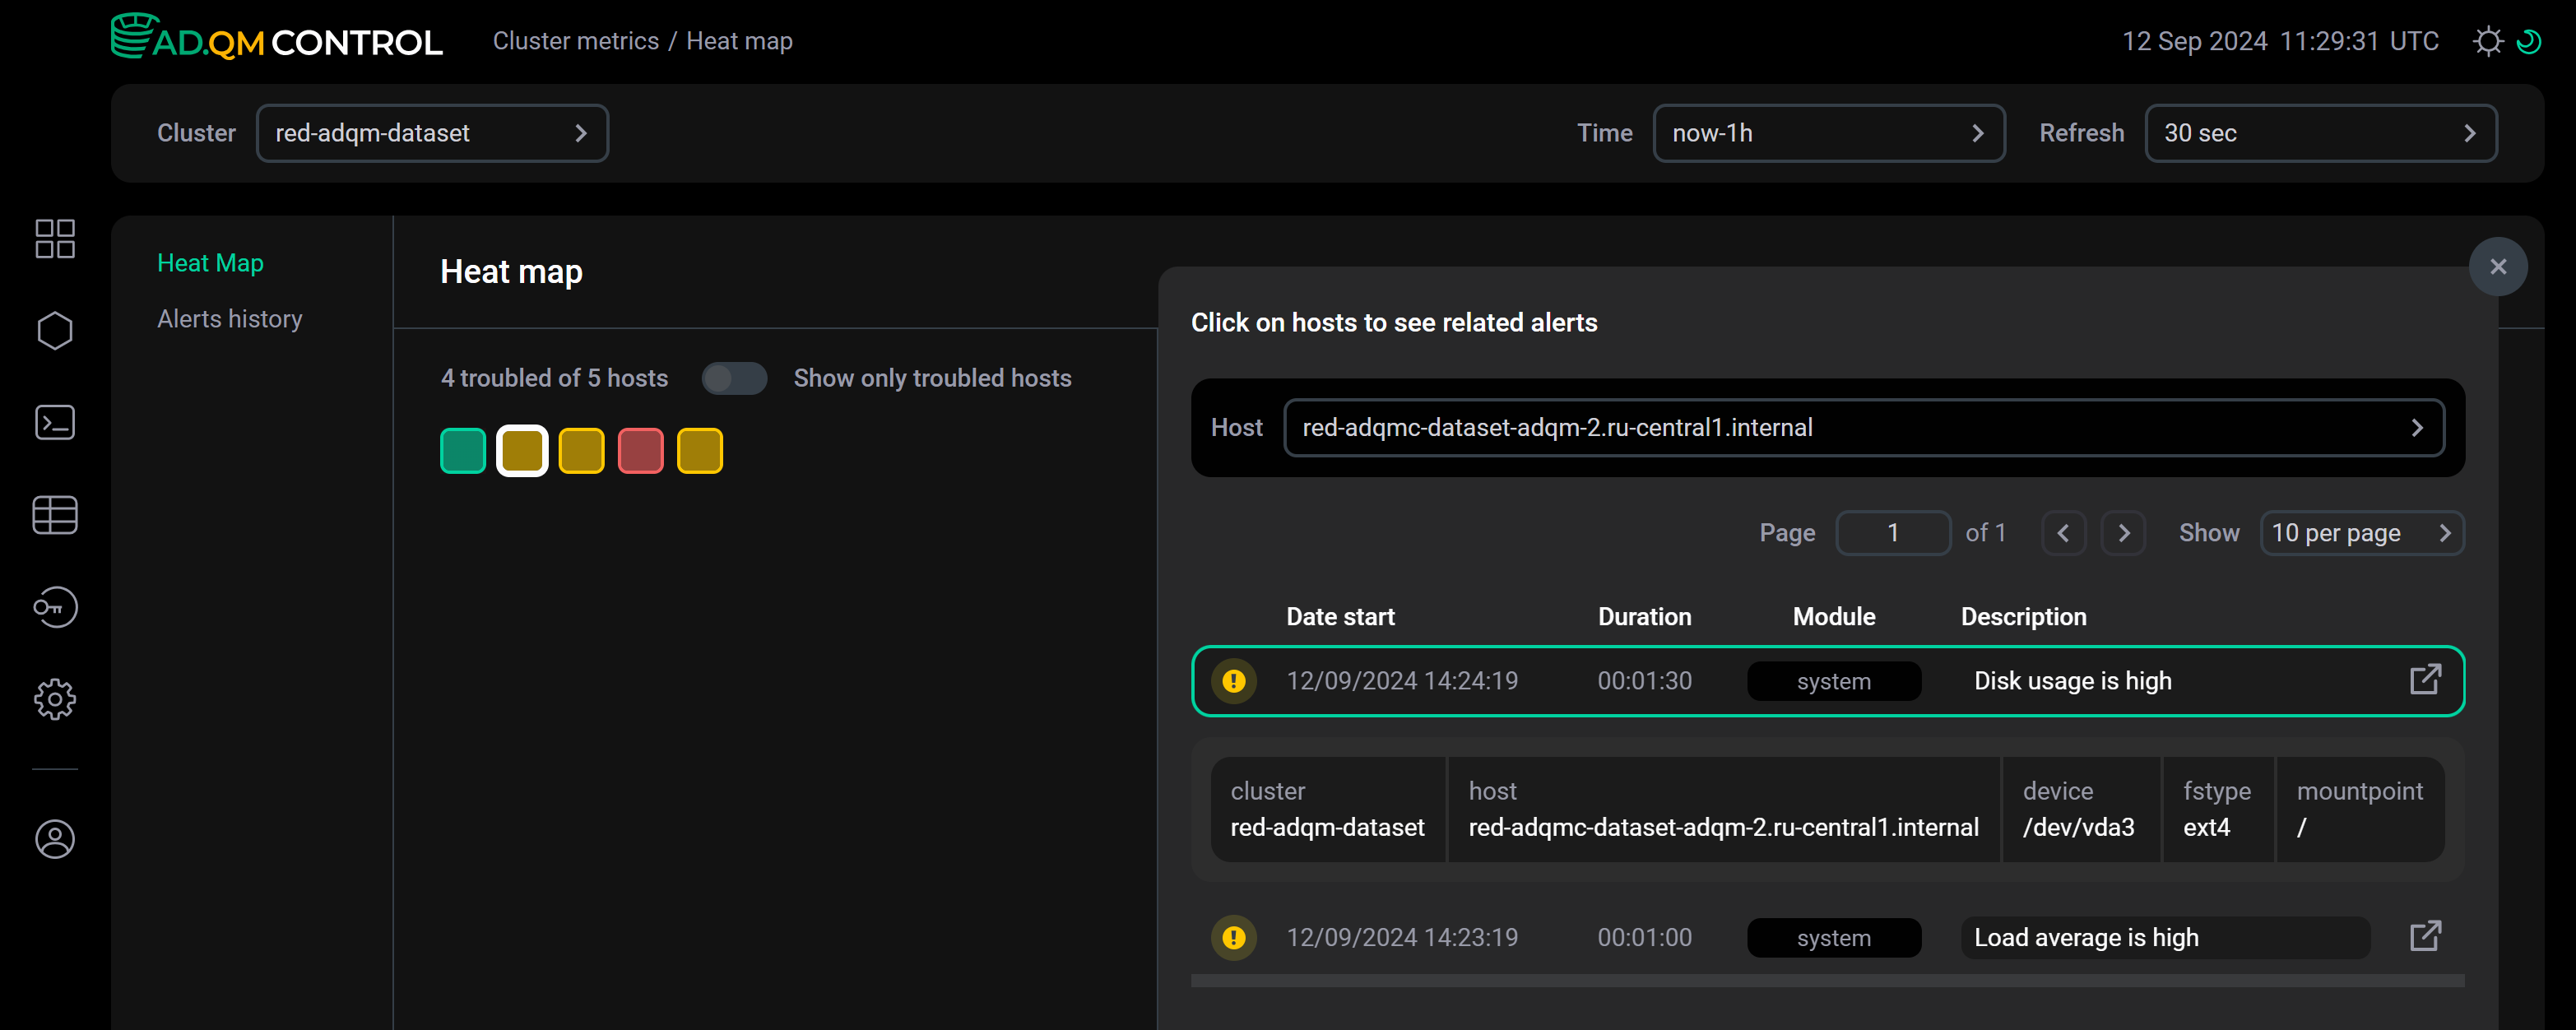 Heat map on the "Cluster metrics" page
The Cluster metrics → Heat map page also opens when you click Full view in the top right corner of the Heat map section on the Dashboard page.
 Go to the "Cluster metrics → Heat map" page
Recent alerts
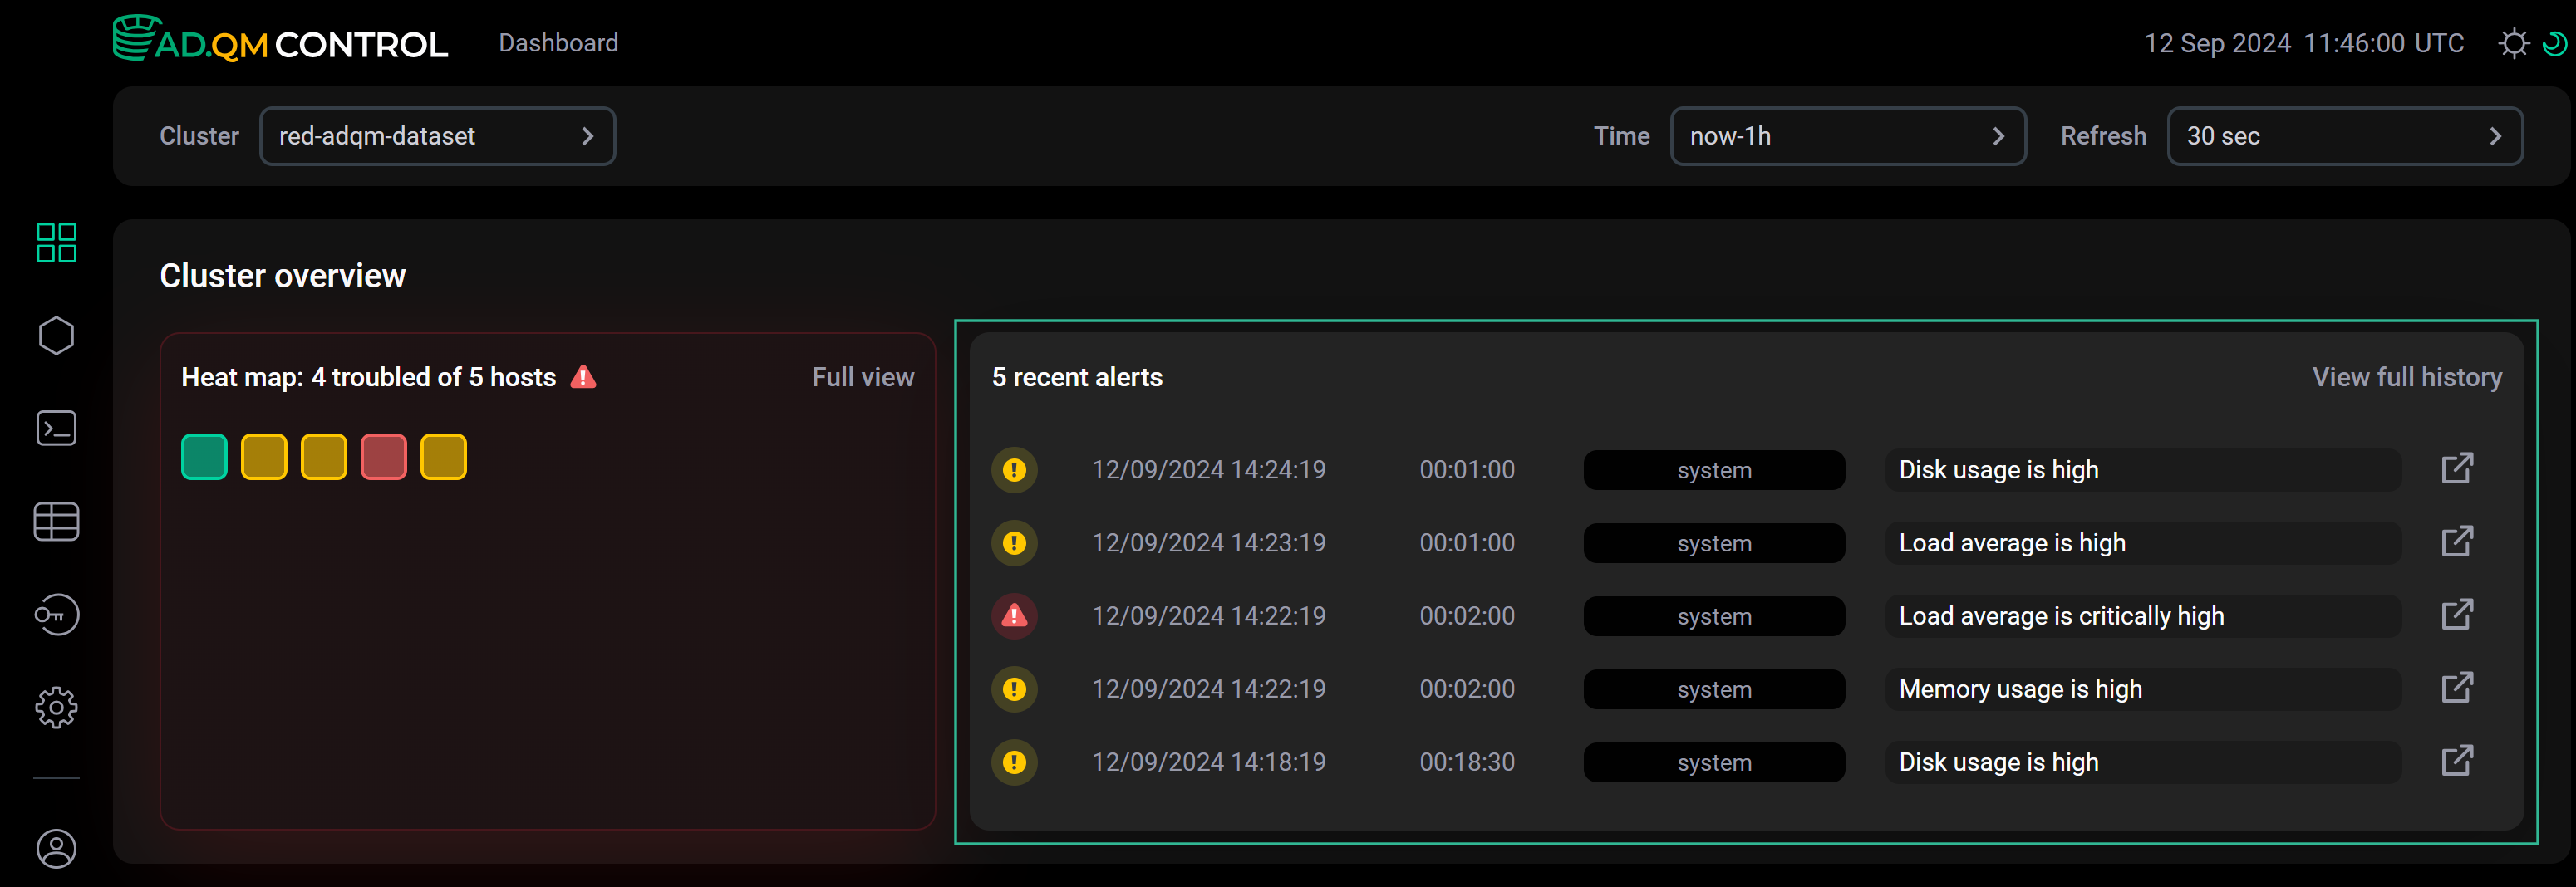
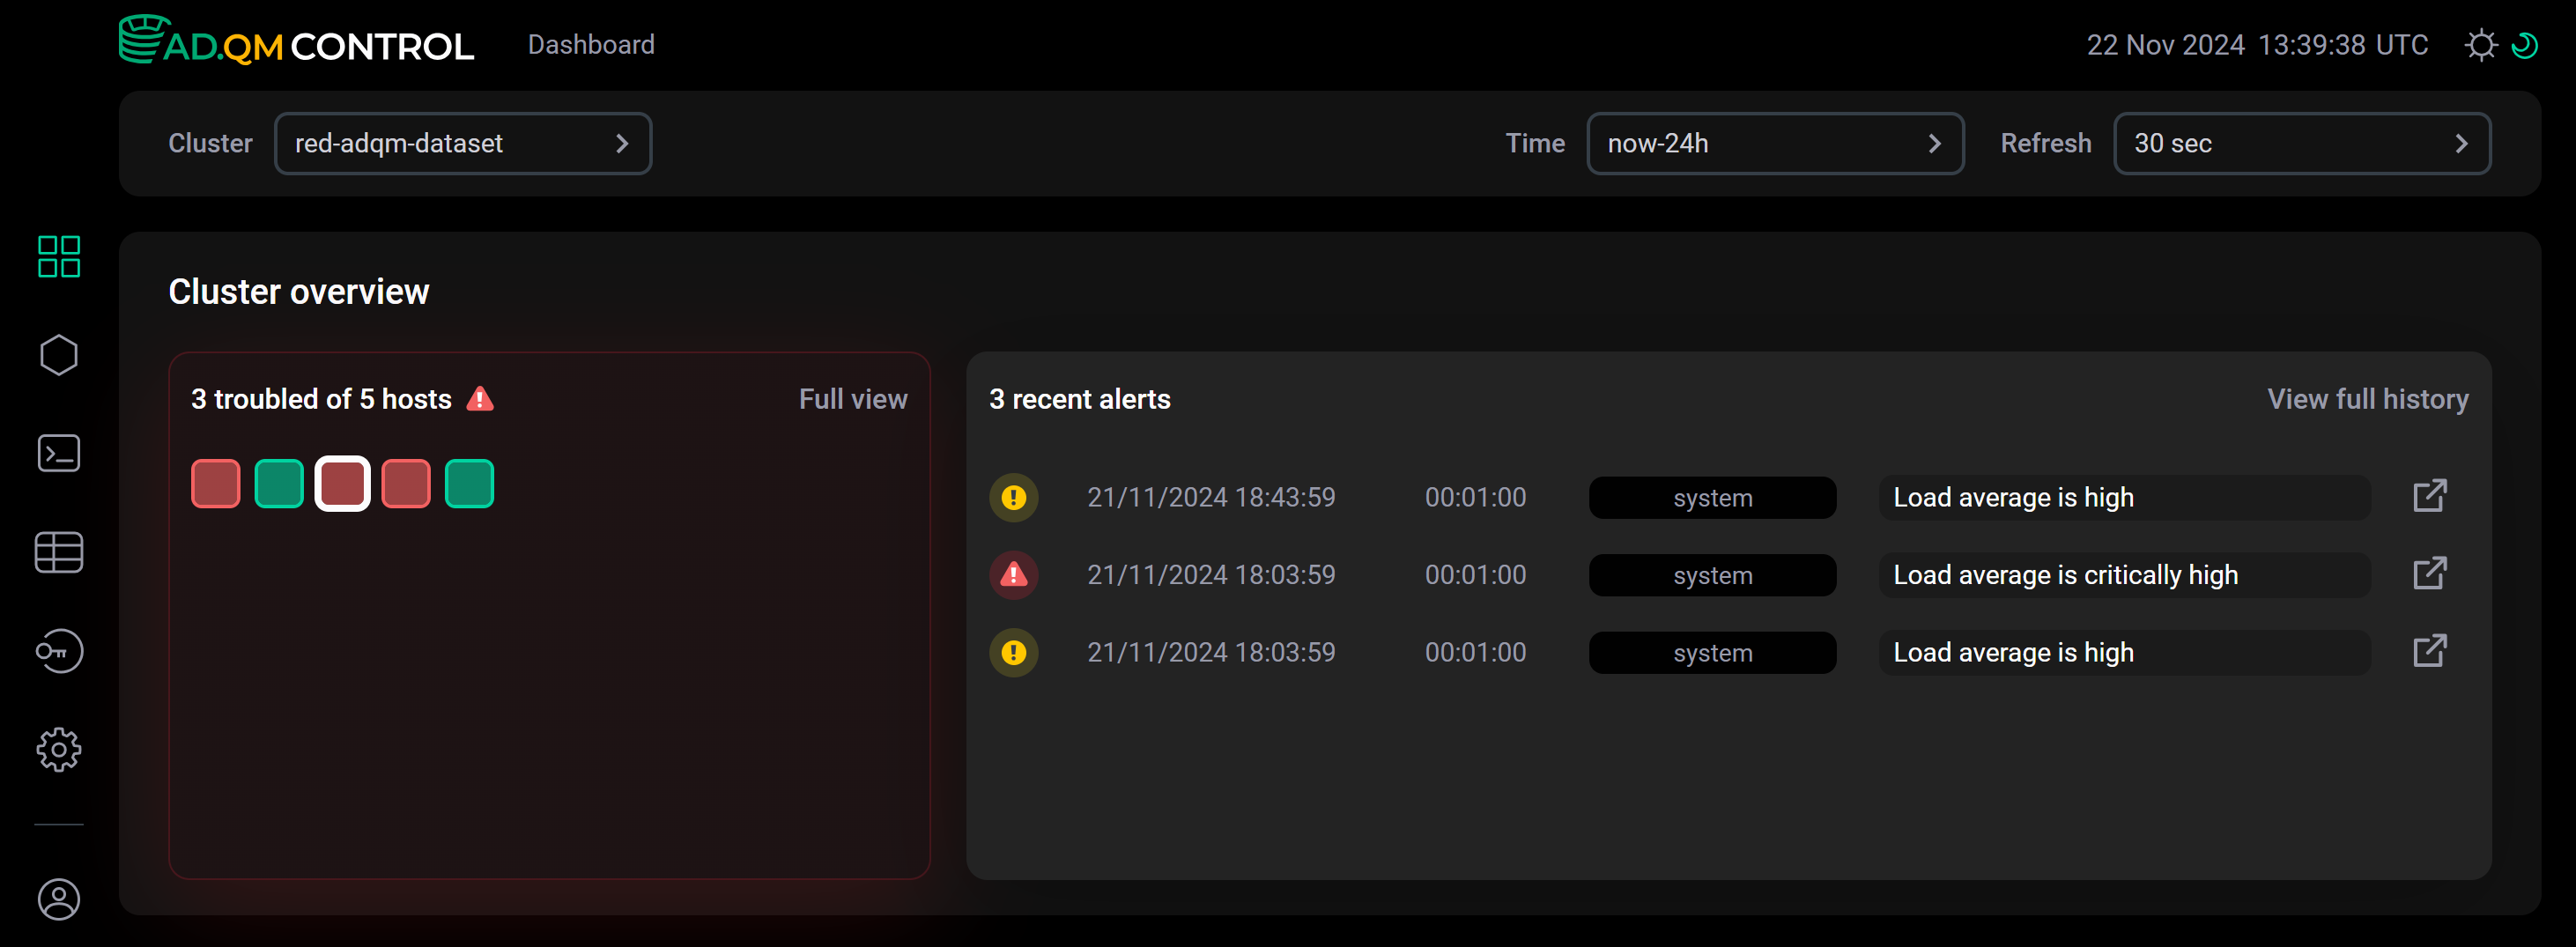
The Dashboard page also displays the 5 most recent alerts about problems on the ADQM cluster hosts (sorted in descending order by the time the alerts were generated, not by their importance).
| Alert severity level | Description | Condition for generating an alert |
|---|---|---|
|
A potential problem has been detected on a host |
A system metric value exceeds a threshold set via the Warning parameter in the System alerts configuration |
|
A critical problem has been detected on a host |
A system metric value exceeds a threshold set via the Critical parameter in the System alerts configuration |


Click the icon ![]()
![]() in an alert row to view the corresponding issue details. To get a full list of alerts for all hosts of the cluster for the specified period of time, click View full history in the top right corner within the Recent alerts section — it will open the Alerts history tab on the Cluster metrics page.
in an alert row to view the corresponding issue details. To get a full list of alerts for all hosts of the cluster for the specified period of time, click View full history in the top right corner within the Recent alerts section — it will open the Alerts history tab on the Cluster metrics page.
You can select one or more hosts in Heat map (by clicking) — then the list of recent alerts will include the alerts only for the selected hosts.
Top 10 tables
The Top 10 tables section contains two tabs with information about data tables in an ADQM cluster for a specified time interval:
-
Biggest — 10 largest tables by the amount of data they store (sorted in descending order by Size — size of compressed data in a table at the end of the selected time interval).
-
Popular — 10 tables to which the most queries were sent (sorted in descending order by Request count — number of queries sent to a table during the selected time interval).
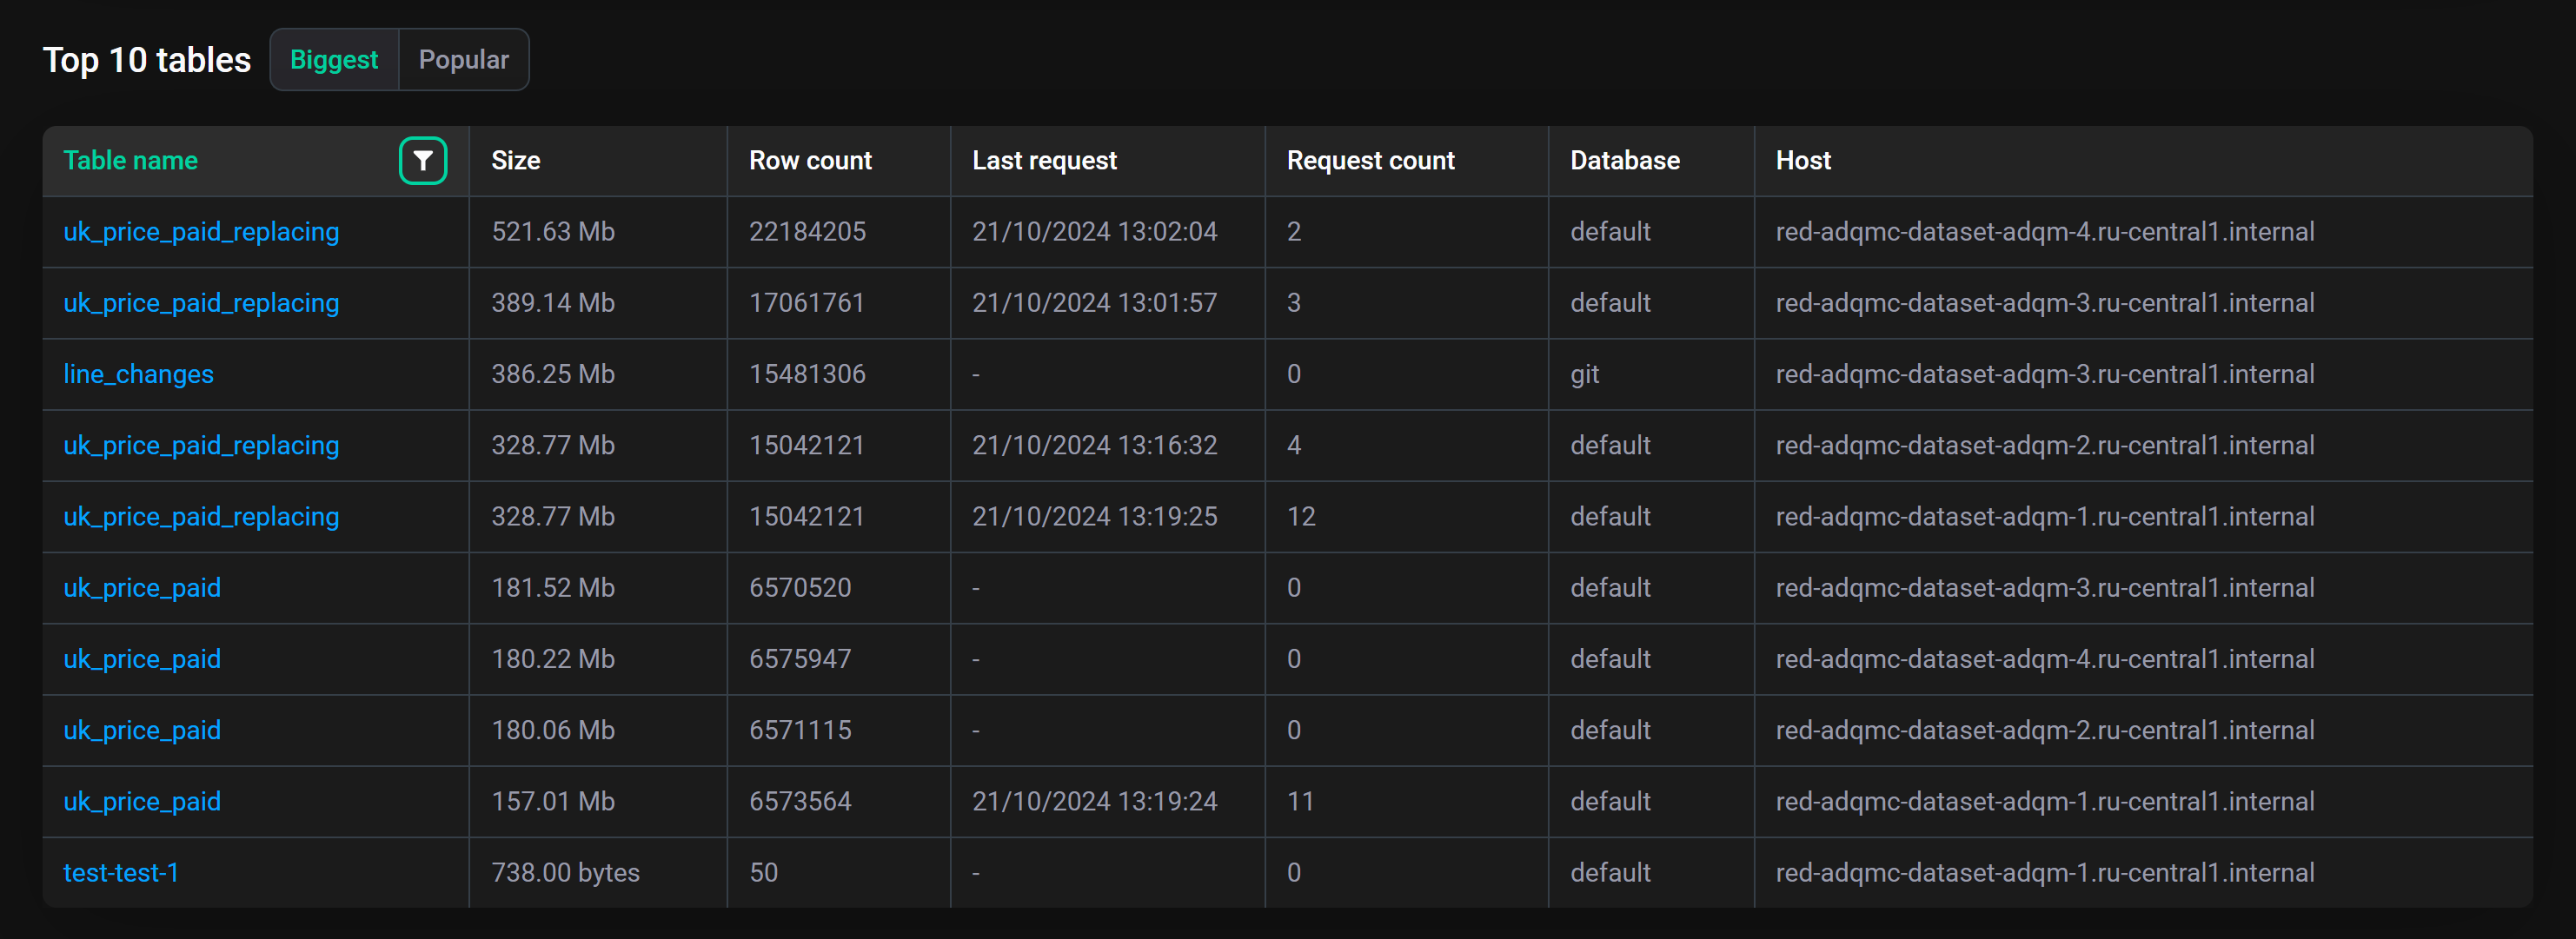
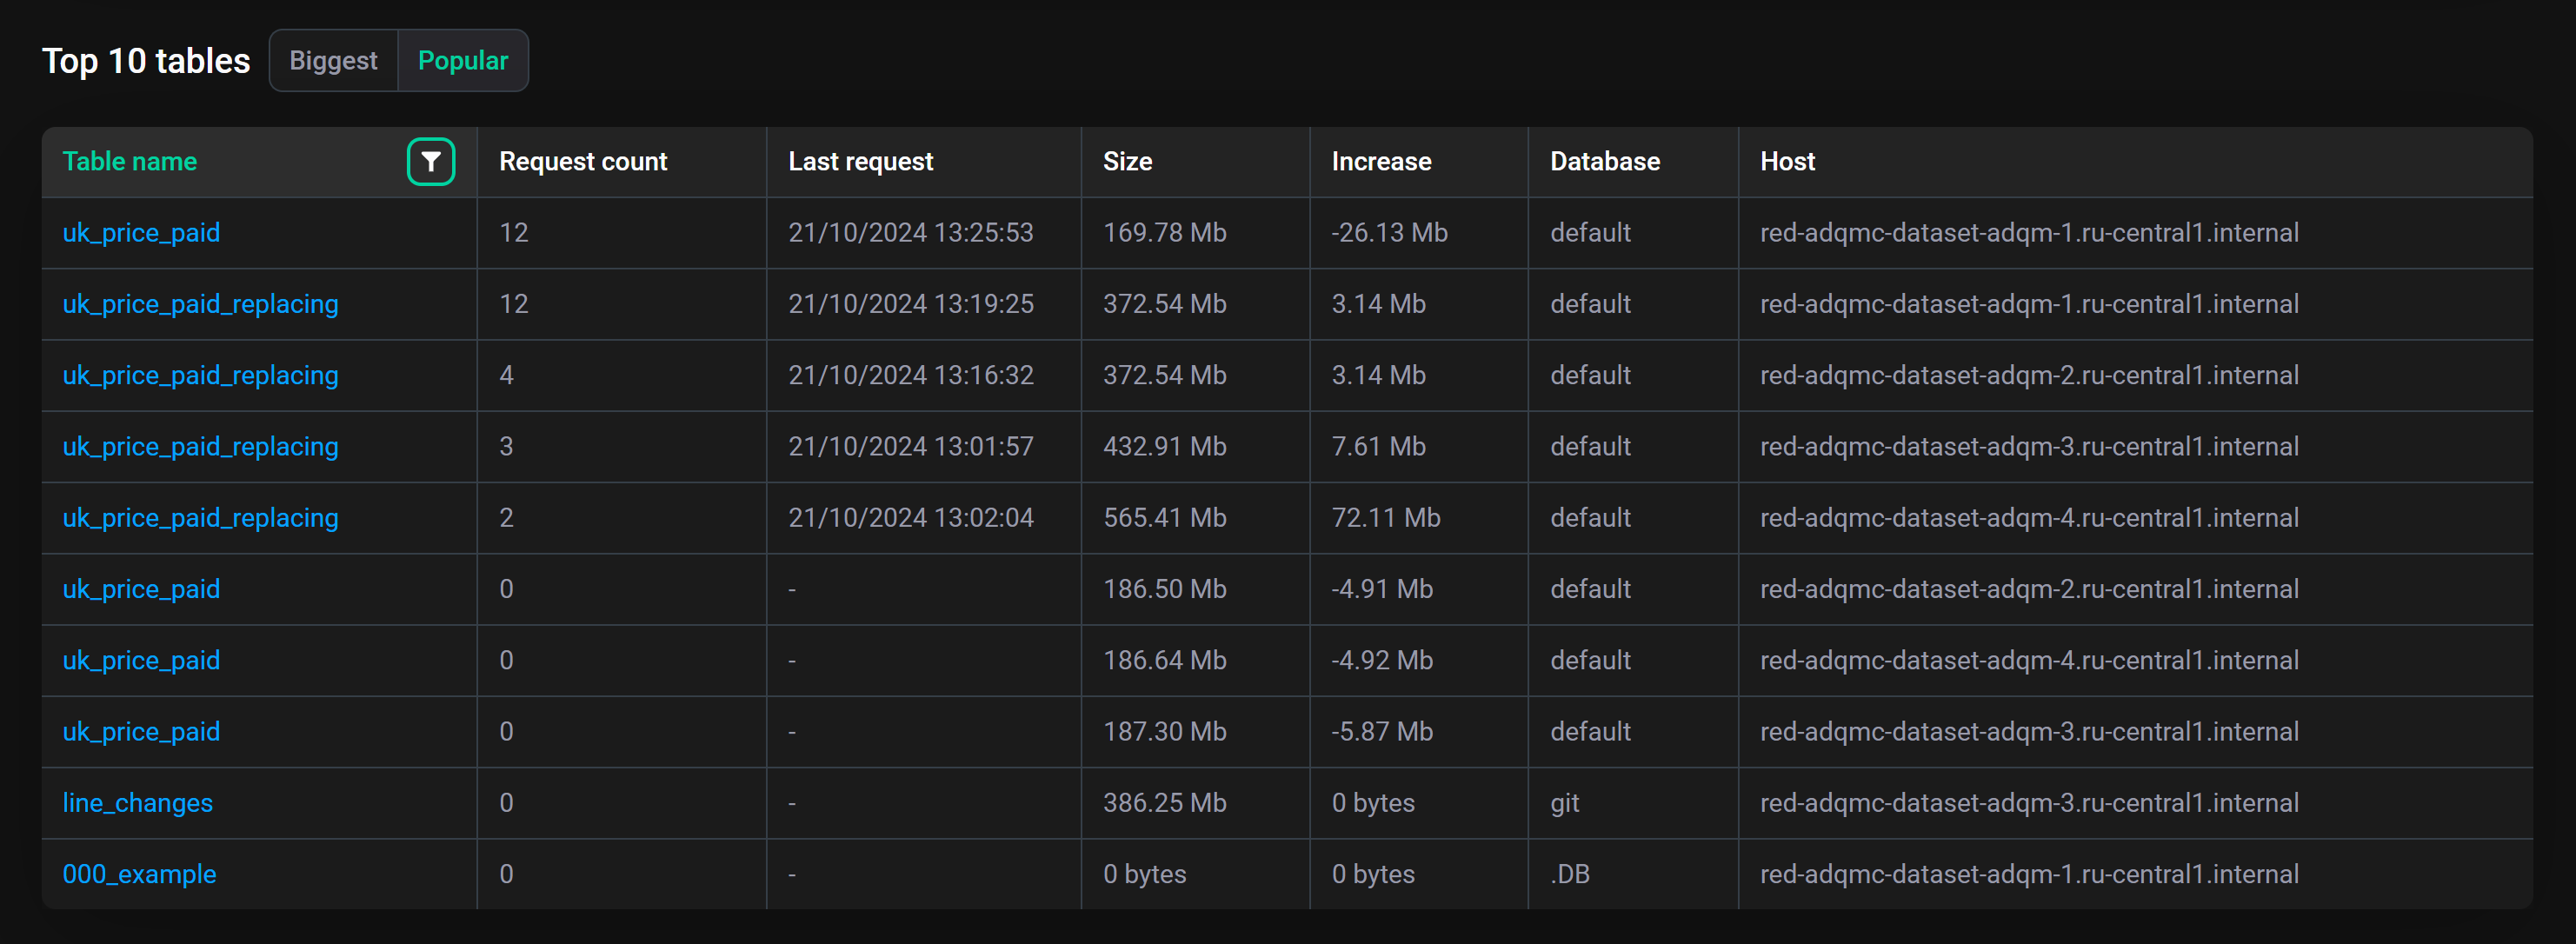
This section also provides the following information on data tables:
-
Table name — table name (click on a table name opens a page with detailed information on table columns);
-
Row count (on the Biggest tab) — number of data rows in a table at the end of the selected time interval;
-
Last request — time the last query to a table was run during the selected time interval;
-
Increase (on the Popular tab) — сhange in a table size over the selected time interval (a negative value means a decrease in the amount of data in the table);
-
Database — database to which a table belongs;
-
Host — host where a table is located.
In the header of the Table name field, there is the icon ![]()
![]() , which when clicked allows you to view or change the filter that determines from which ADQM tables the largest or most popular tables are selected. The following predefined filters are available:
, which when clicked allows you to view or change the filter that determines from which ADQM tables the largest or most popular tables are selected. The following predefined filters are available:
-
Existing (default) — top 10 tables are selected from those that exist in the cluster at the end of the specified time interval (tables are considered existing if ADQM Control continues to receive their metrics at the end of the time interval);
-
Historical — top 10 tables are selected from all tables that existed in the cluster during the specified time interval (including tables that were deleted).
To get information on all cluster tables for the specified time period, see the Tables page.
Top 10 queries
The Top 10 queries section contains two tabs with information about queries sent to ADQM cluster databases during a specified time interval:
-
Longest — top 10 successfully completed queries that took the longest time to process (sorted in descending order by Time elapsed — duration of a query execution).
-
Used memory — top 10 queries that required the most memory (sorted in descending order by Used memory — amount of memory consumed by a query).
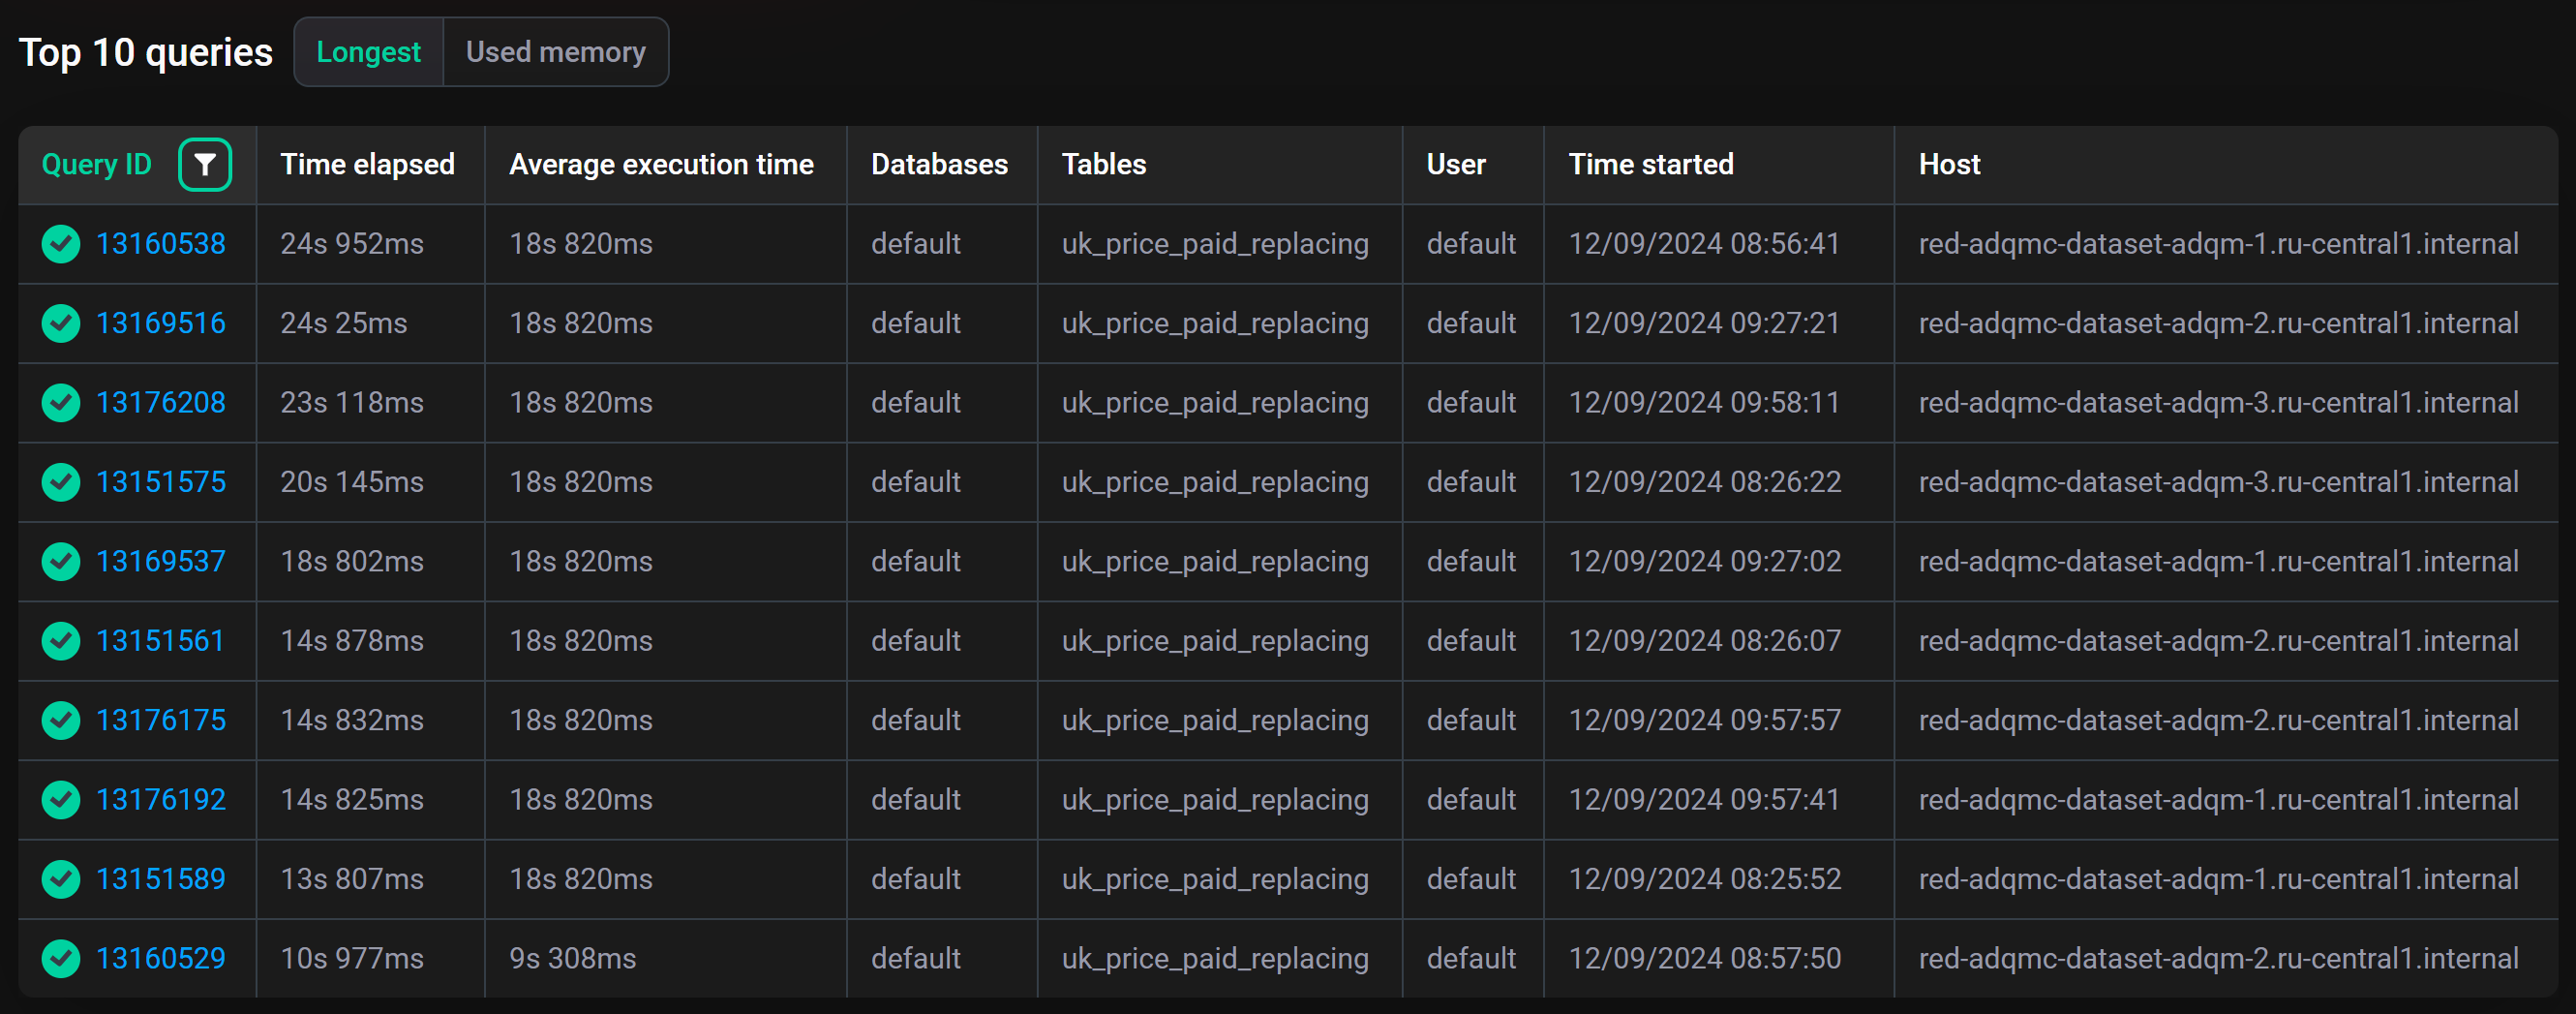
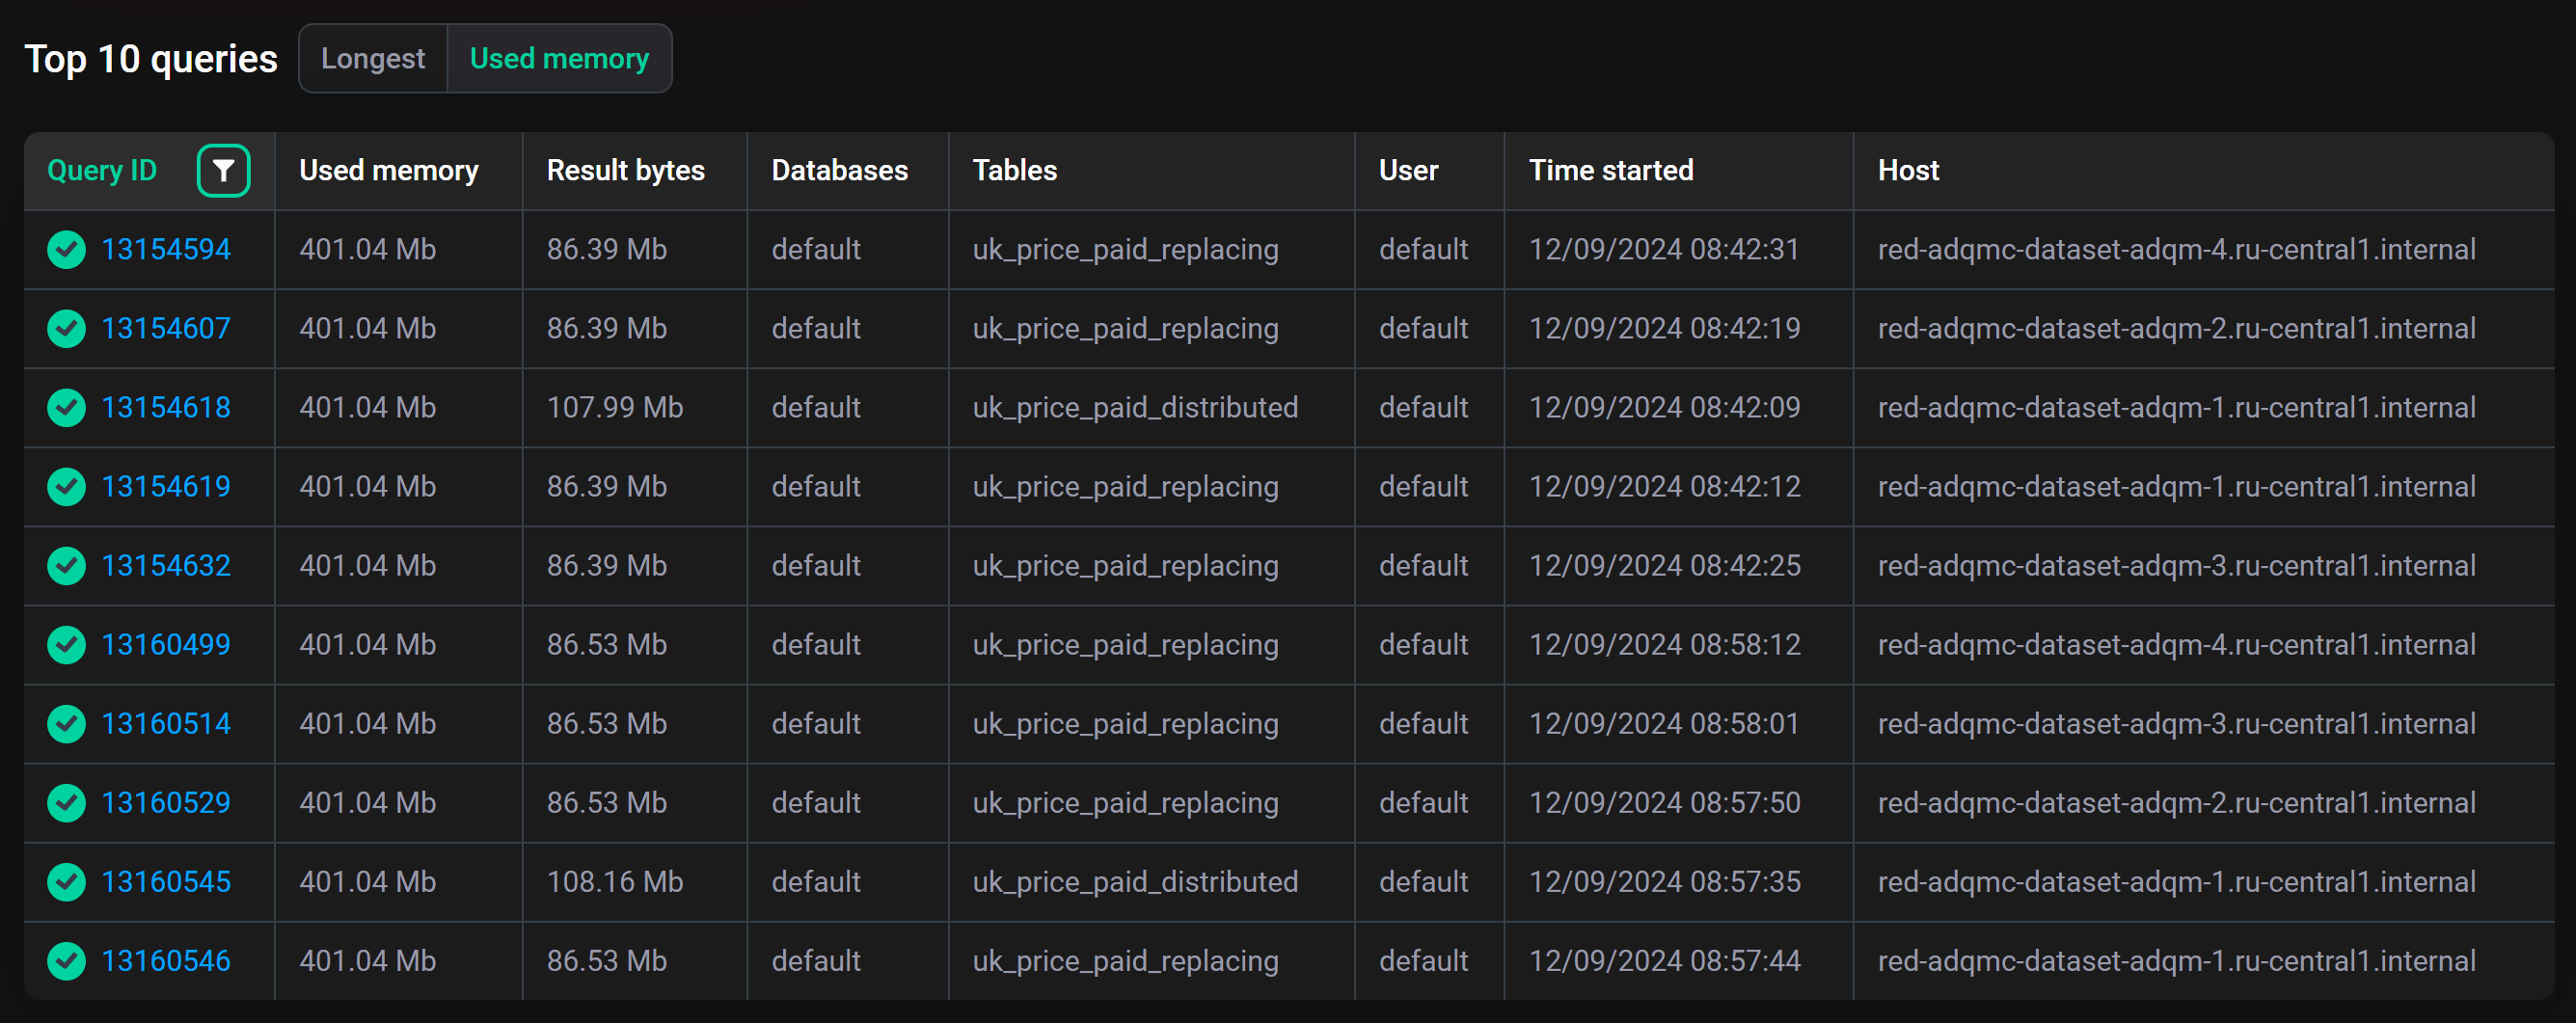
For each query, the following information is also provided:
-
Query ID — the query identifier (click on an identifier opens the Query details page where you can view the query text);
-
Average execution time (on the Longest tab) — average query execution time (statistics are calculated for queries whose text completely matches, i.e. for parameterized queries, specific parameter values are taken into account);
-
Result bytes (on the Used memory tab) — amount of memory to store the query result;
-
Databases — names of databases to which the query is sent;
-
Tables — names of tables to which the query is sent;
-
User — name of an ADQM user who initiated the query execution;
-
Time started — the query execution start time;
-
Host — host where the query was run.
In the header of the Query ID field, there is the icon ![]()
![]() , by clicking on which, you can view or change the filter that determines from which queries the longest or most memory-intensive ones are selected. The following predefined filters are available:
, by clicking on which, you can view or change the filter that determines from which queries the longest or most memory-intensive ones are selected. The following predefined filters are available:
-
Completed (on the Longest tab) — top 10 longest queries are selected from all the completed queries (i.e. from all queries except active ones);
-
All (on the Used memory tab) — top 10 most memory-intensive queries are selected from all queries;
-
Successful (default filter) — top 10 queries are selected from those that were completed successfully.
To view the full history of queries for the required period of time, switch to the Queries page.