

Cluster metrics
The Cluster metrics page of the ADQM Control web interface is designed to display information about an ADQM cluster state based on values of metrics collected from the cluster hosts. The page includes two tabs described below: Heat map and Alerts history.
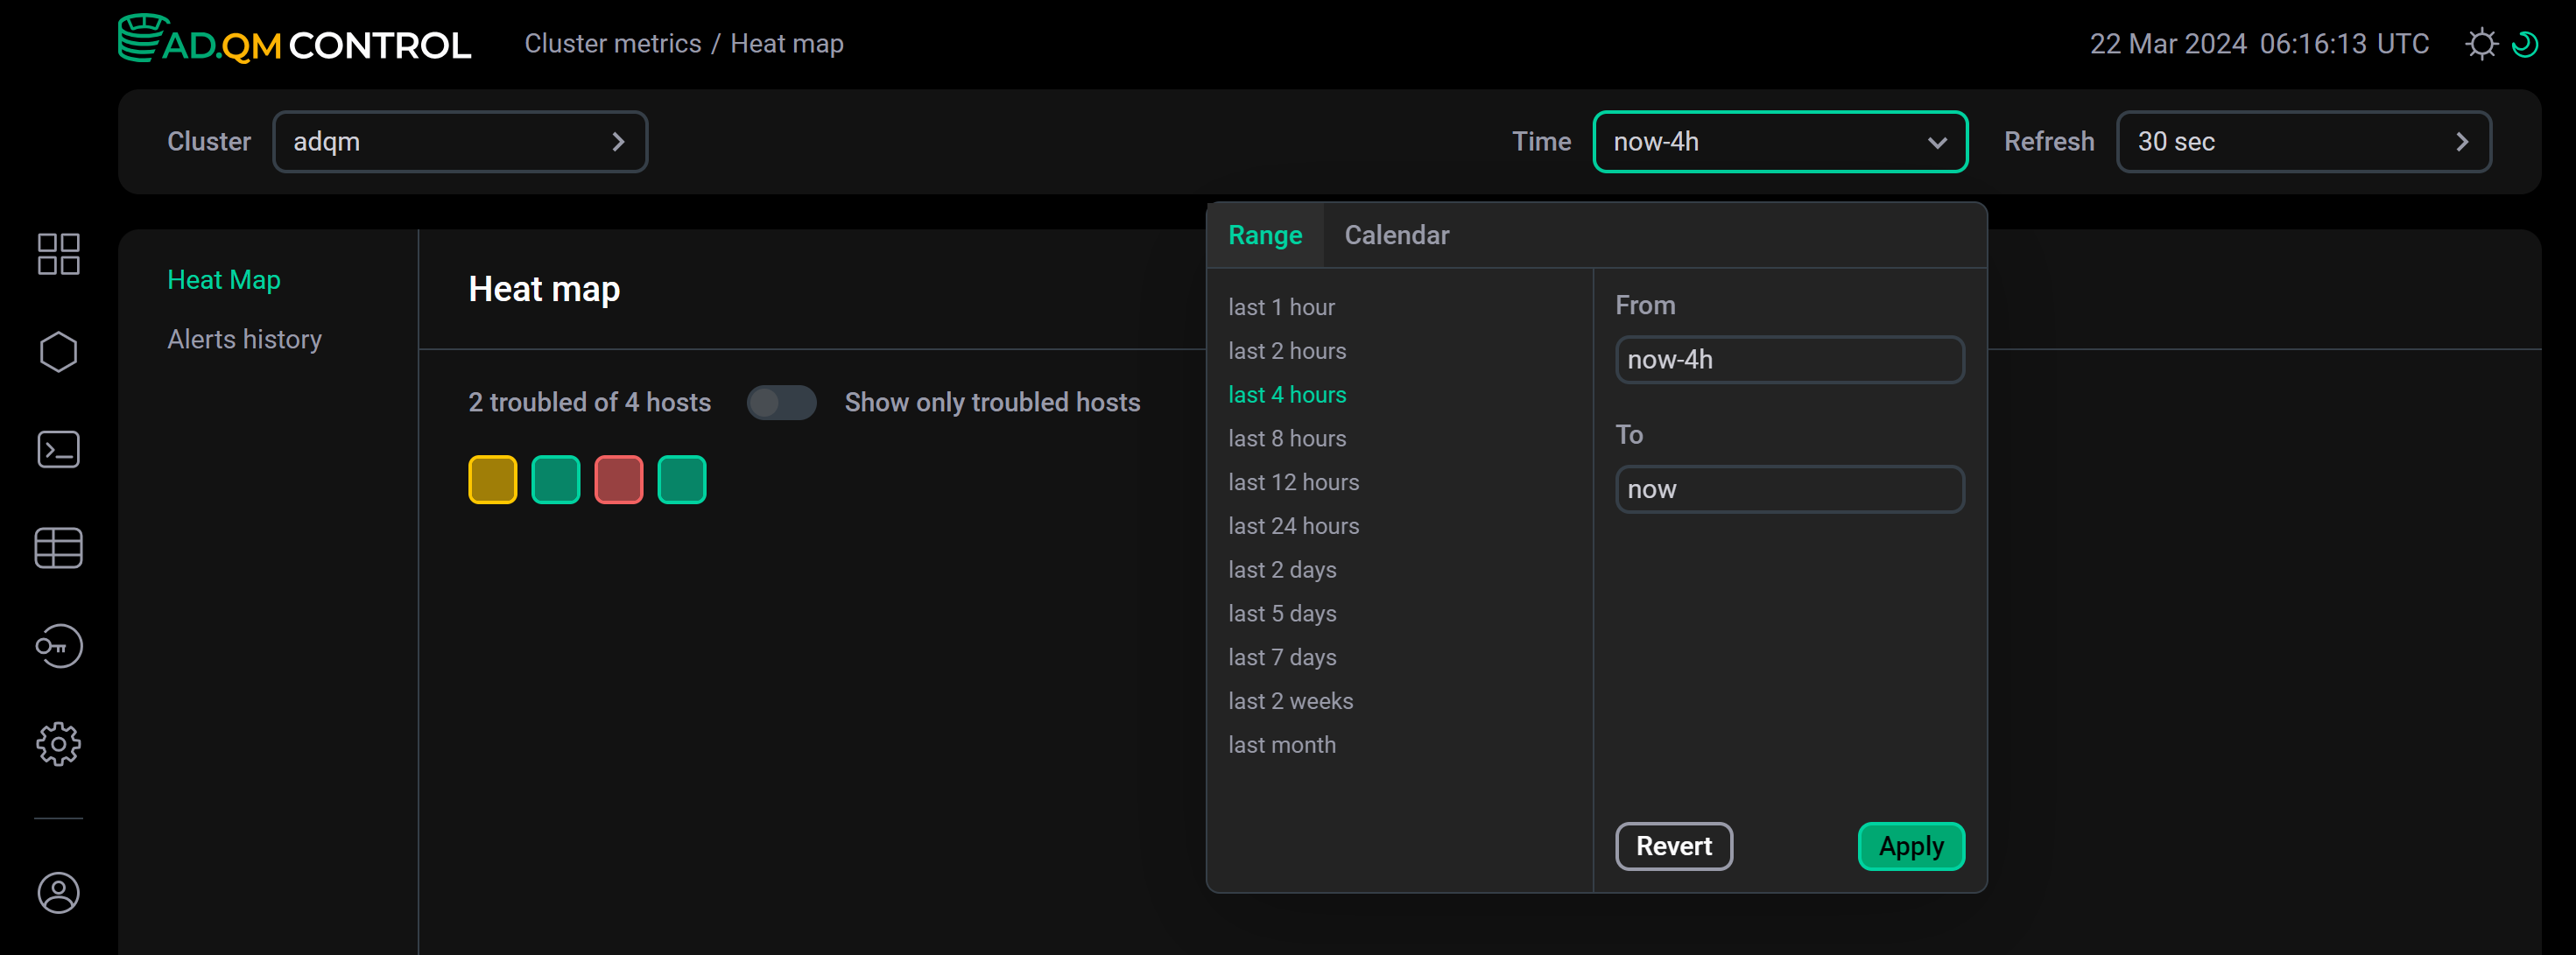
To select data to be shown on the Cluster metrics page, you can use the fields at the top of the screen:
-
Cluster — ADQM cluster for which information should be displayed.
-
Time — time period for which information is required. In the window that opens when you click the field, you can select an interval from the offered options on the Range tab or set a custom time range on the Calendar tab.
-
Refresh — frequency of data updates.
Heat Map
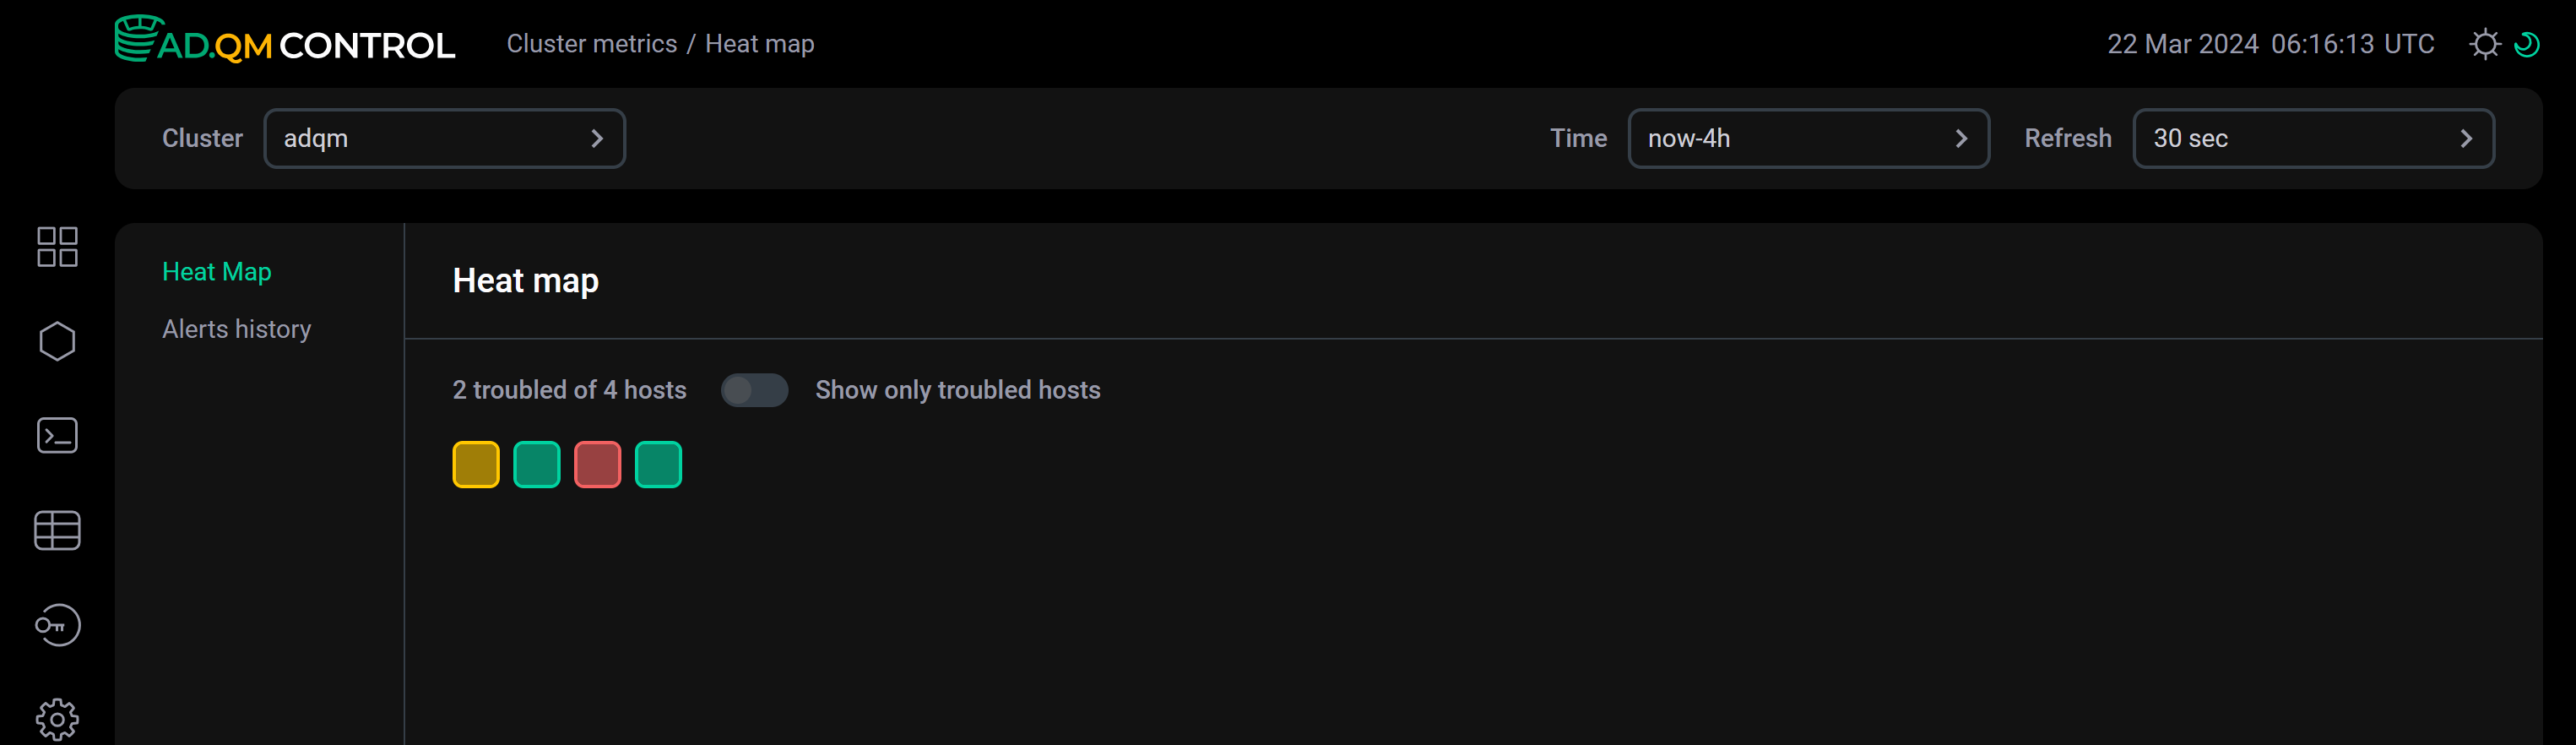
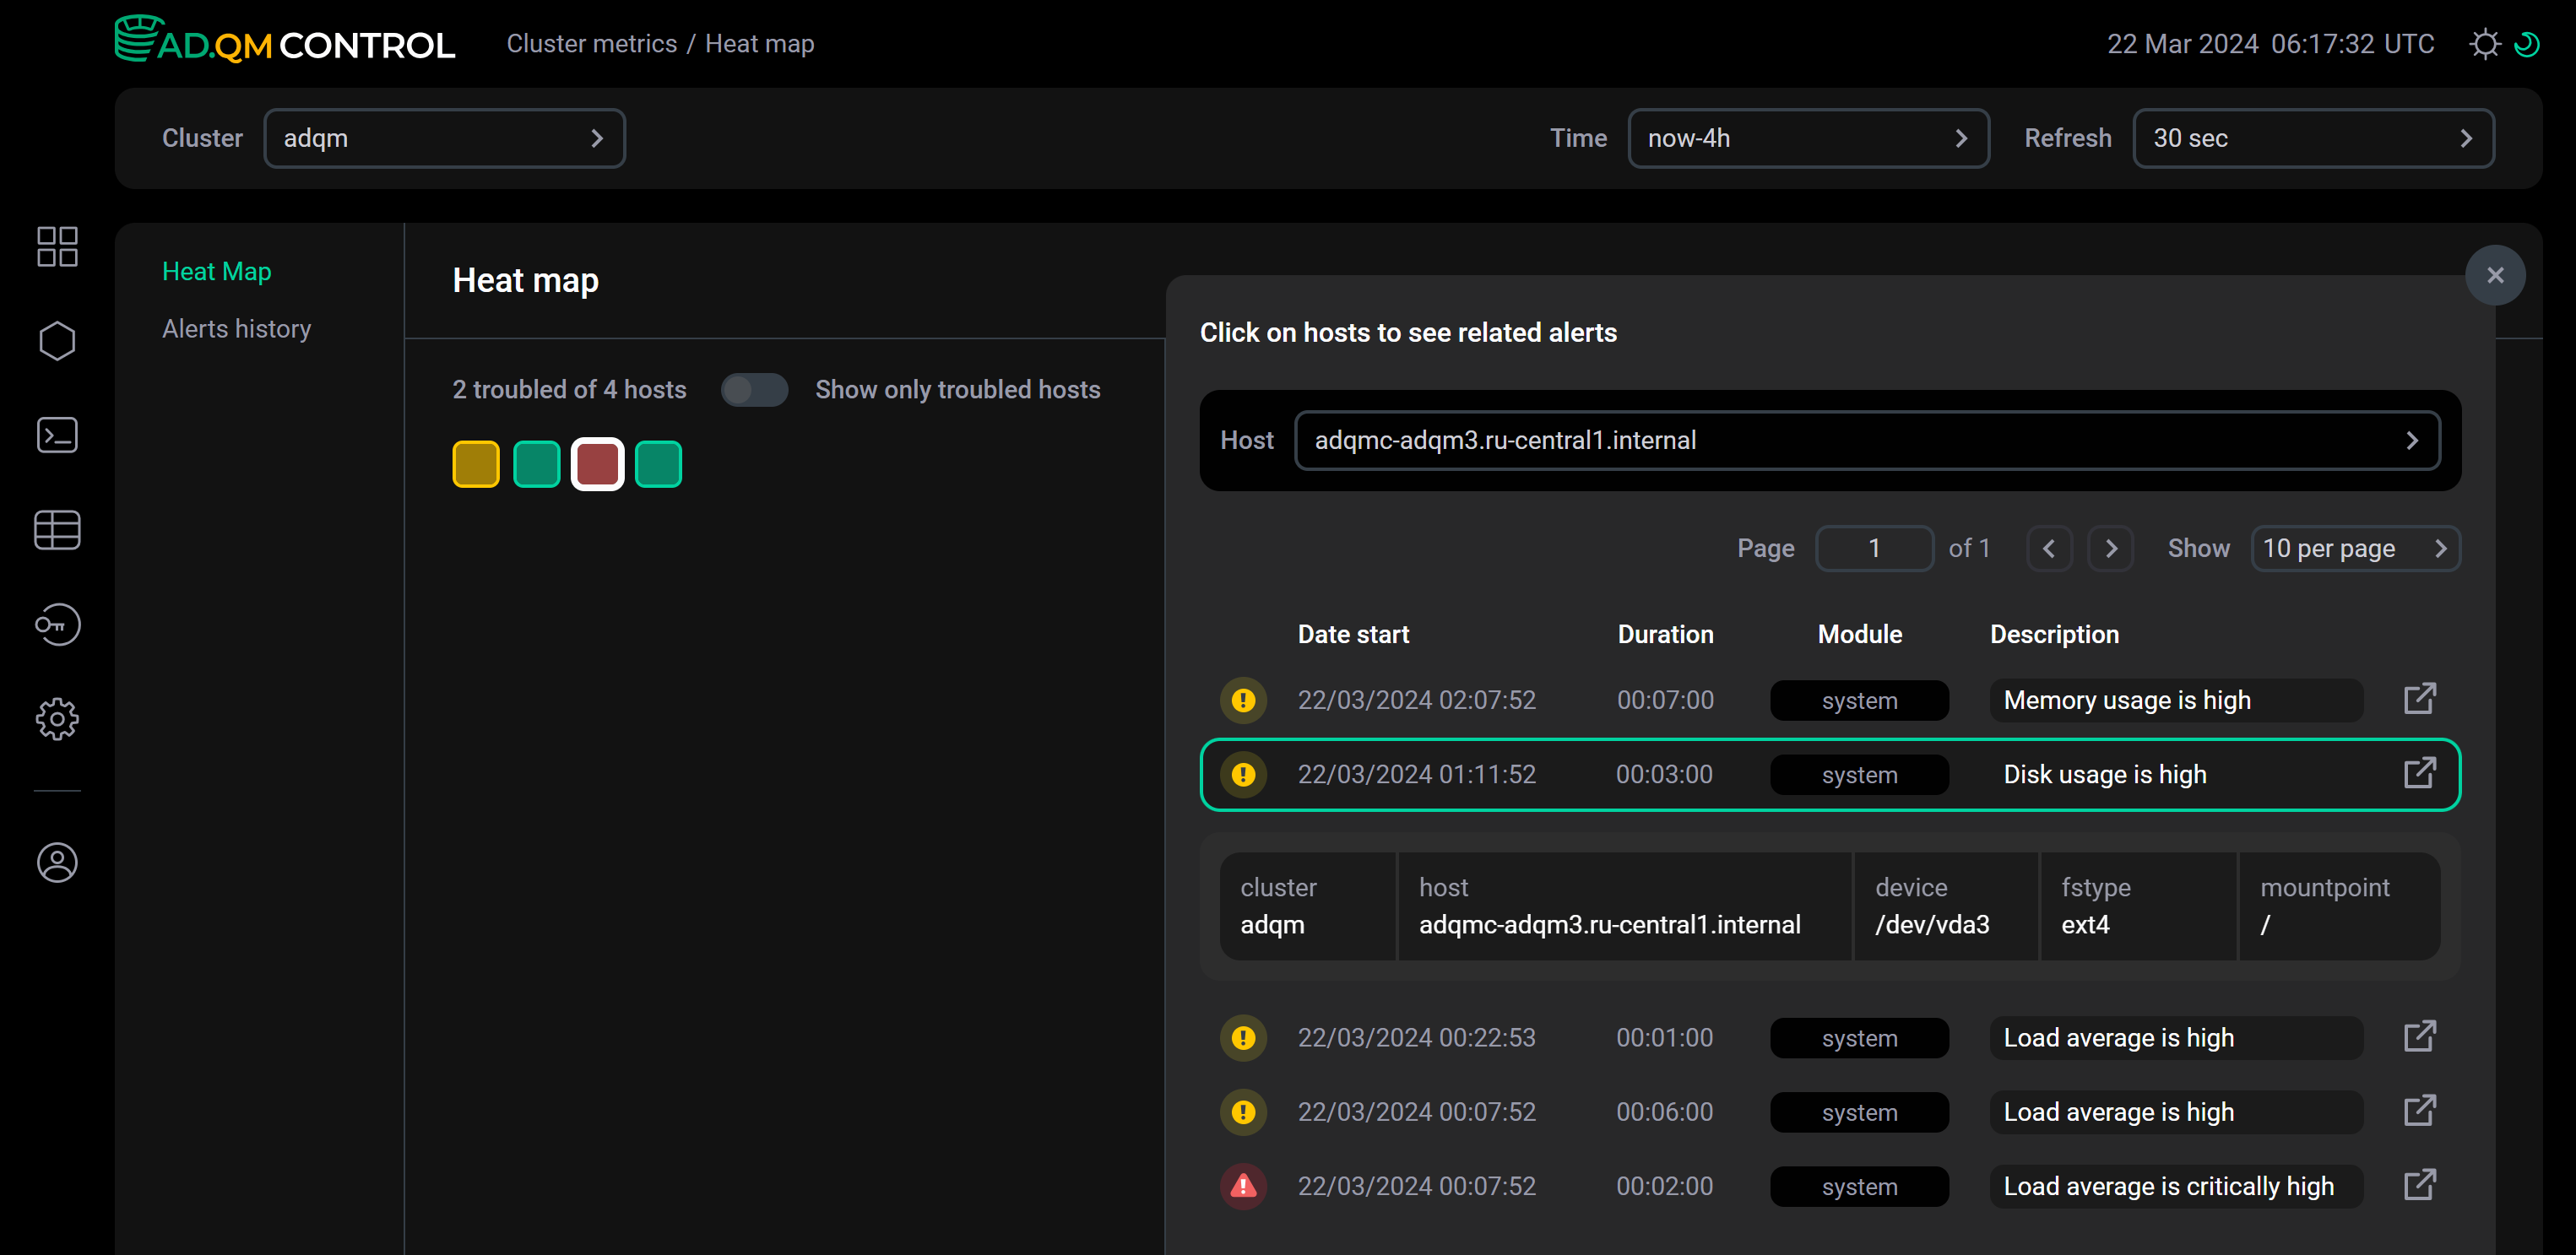
A heat map visualizes information about states of all hosts in an ADQM cluster — each host is drawn as a square and its color indicates the system state.
Host state
ADQM Control determines a host state and assigns the corresponding color to it in the Heat map matrix based on existing alerts about host issues:
 — there are no alerts about any issues on a host in ADQM Control (a healthy host).
 — only potential issues have been detected on a host (for example, the increase in the values of some system metrics), but they are not yet critical. Appropriate warning alerts about these issues have been generated and remain relevant in ADQM Control.
 — at least one critical issue has been detected on a host and the corresponding alert of the high-importance level about it exists in ADQM Control.
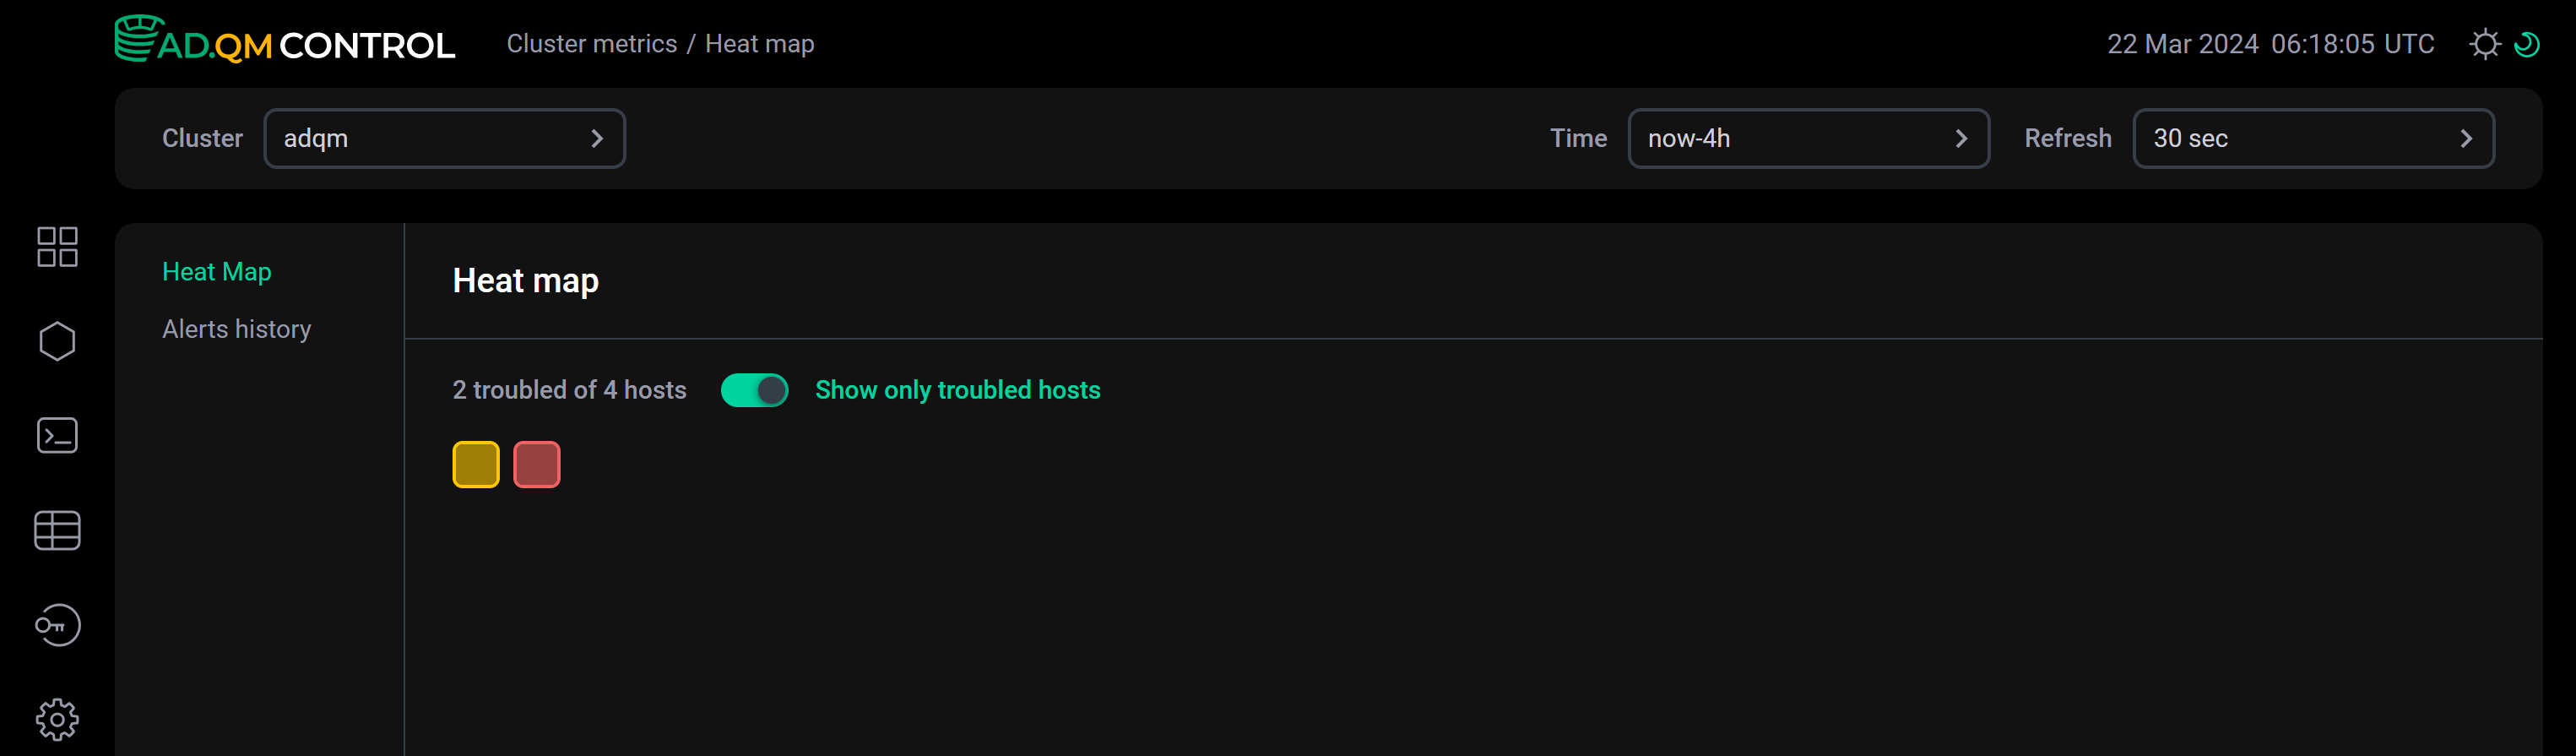
The Show only troubled hosts switch at the top of the Heat map tab allows you to configure the heat map so that it displays only troubled hosts.
Alerts related to a host
When you select one or more hosts by clicking them in the heat map, ADQM Control displays a table with a list of host-related alerts generated during the specified period of time. In the Host field above the table, you can change a set of hosts for which the list of alerts is displayed.
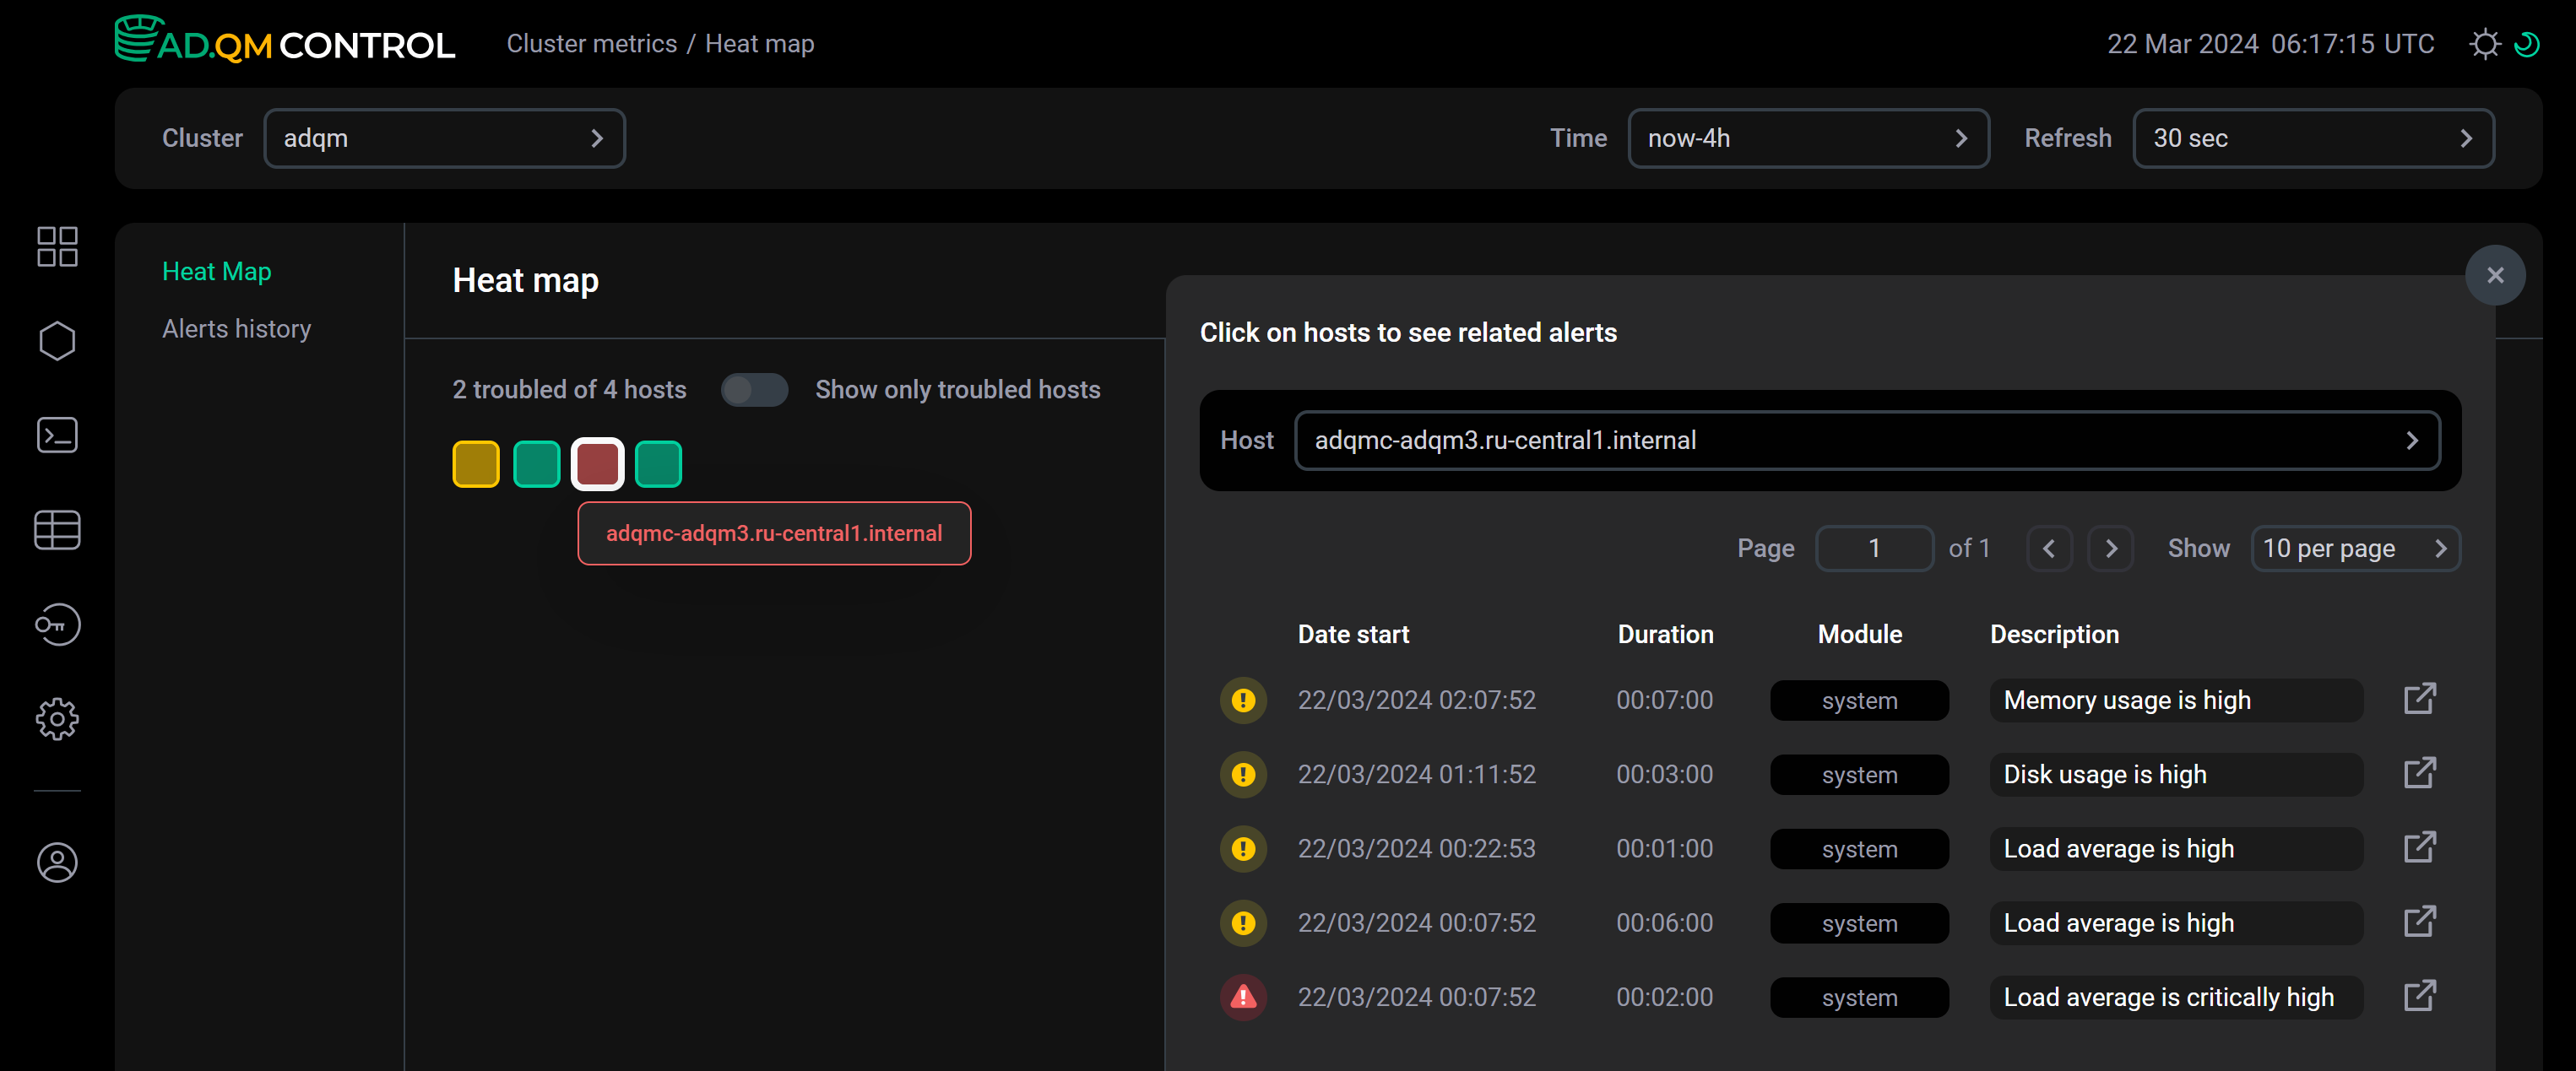
The table with a list of alerts contains the following information.
| Field | Description |
|---|---|
Date start |
Timestamp when an alert was generated (in the |
Duration |
Total time that a host issue alert remained active |
Module |
Module that includes an alert. Currently, ADQM Control only supports the |
Description |
Description of an issue detected on a host |
The first column of the table with a list of alerts contains an icon that indicates the severity level of an alert:
 — warning alert that informs about a potential issue on an ADQM cluster host (the issue has not reached the critical level yet). Generated when a system metric value exceeds a threshold set via the Warning parameter in the System alerts configuration.
 — high-importance alert about a critical issue on a host. Generated when a system metric value exceeds a threshold set via the Critical parameter in the System alerts configuration.
To get more details about an alert, do one of the following:
-
Click an alert row in the list — alert details will appear below the row.
 Alert details within the list
 -
Click the icon

 within an alert row — this will take you to a separate page with alert details (the page has a unique address that you can share).
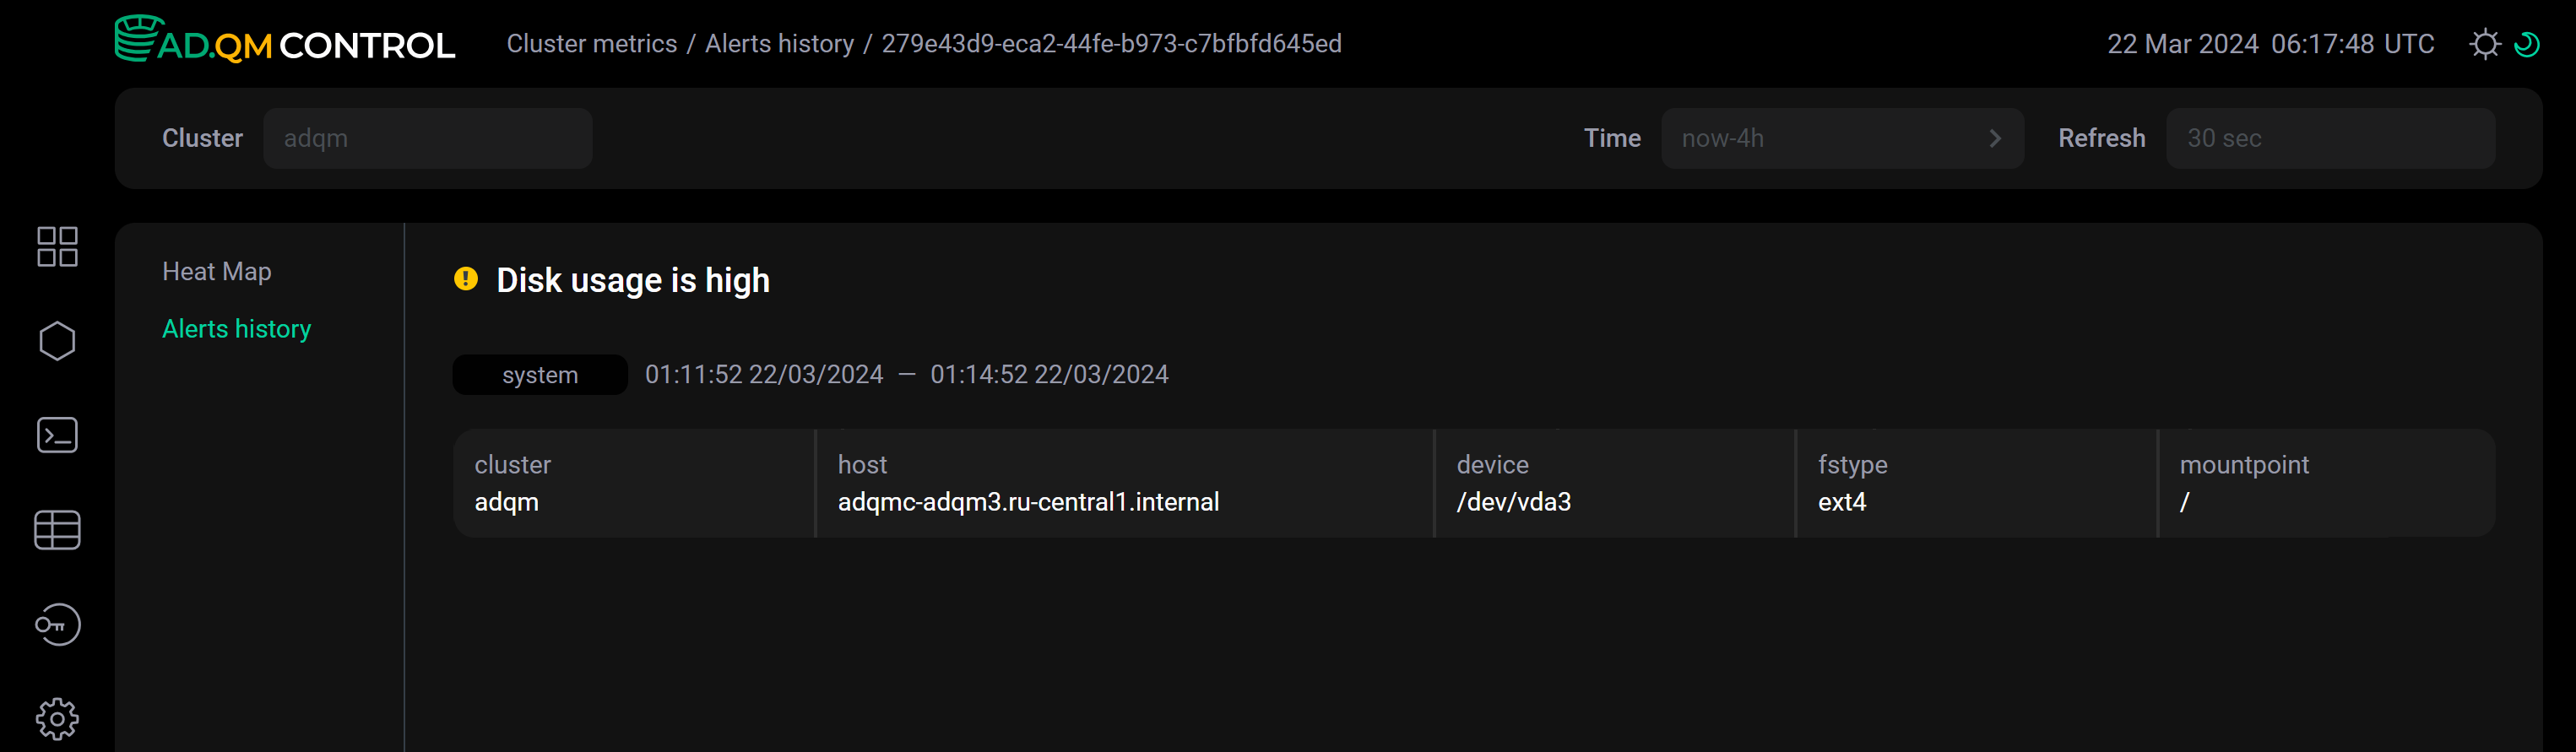 Alert details on a separate page
Alerts history
The Alerts history tab displays a full list of alerts that were generated based on metrics of ADQM cluster hosts for the period of time specified in the Time field at the top of the screen.
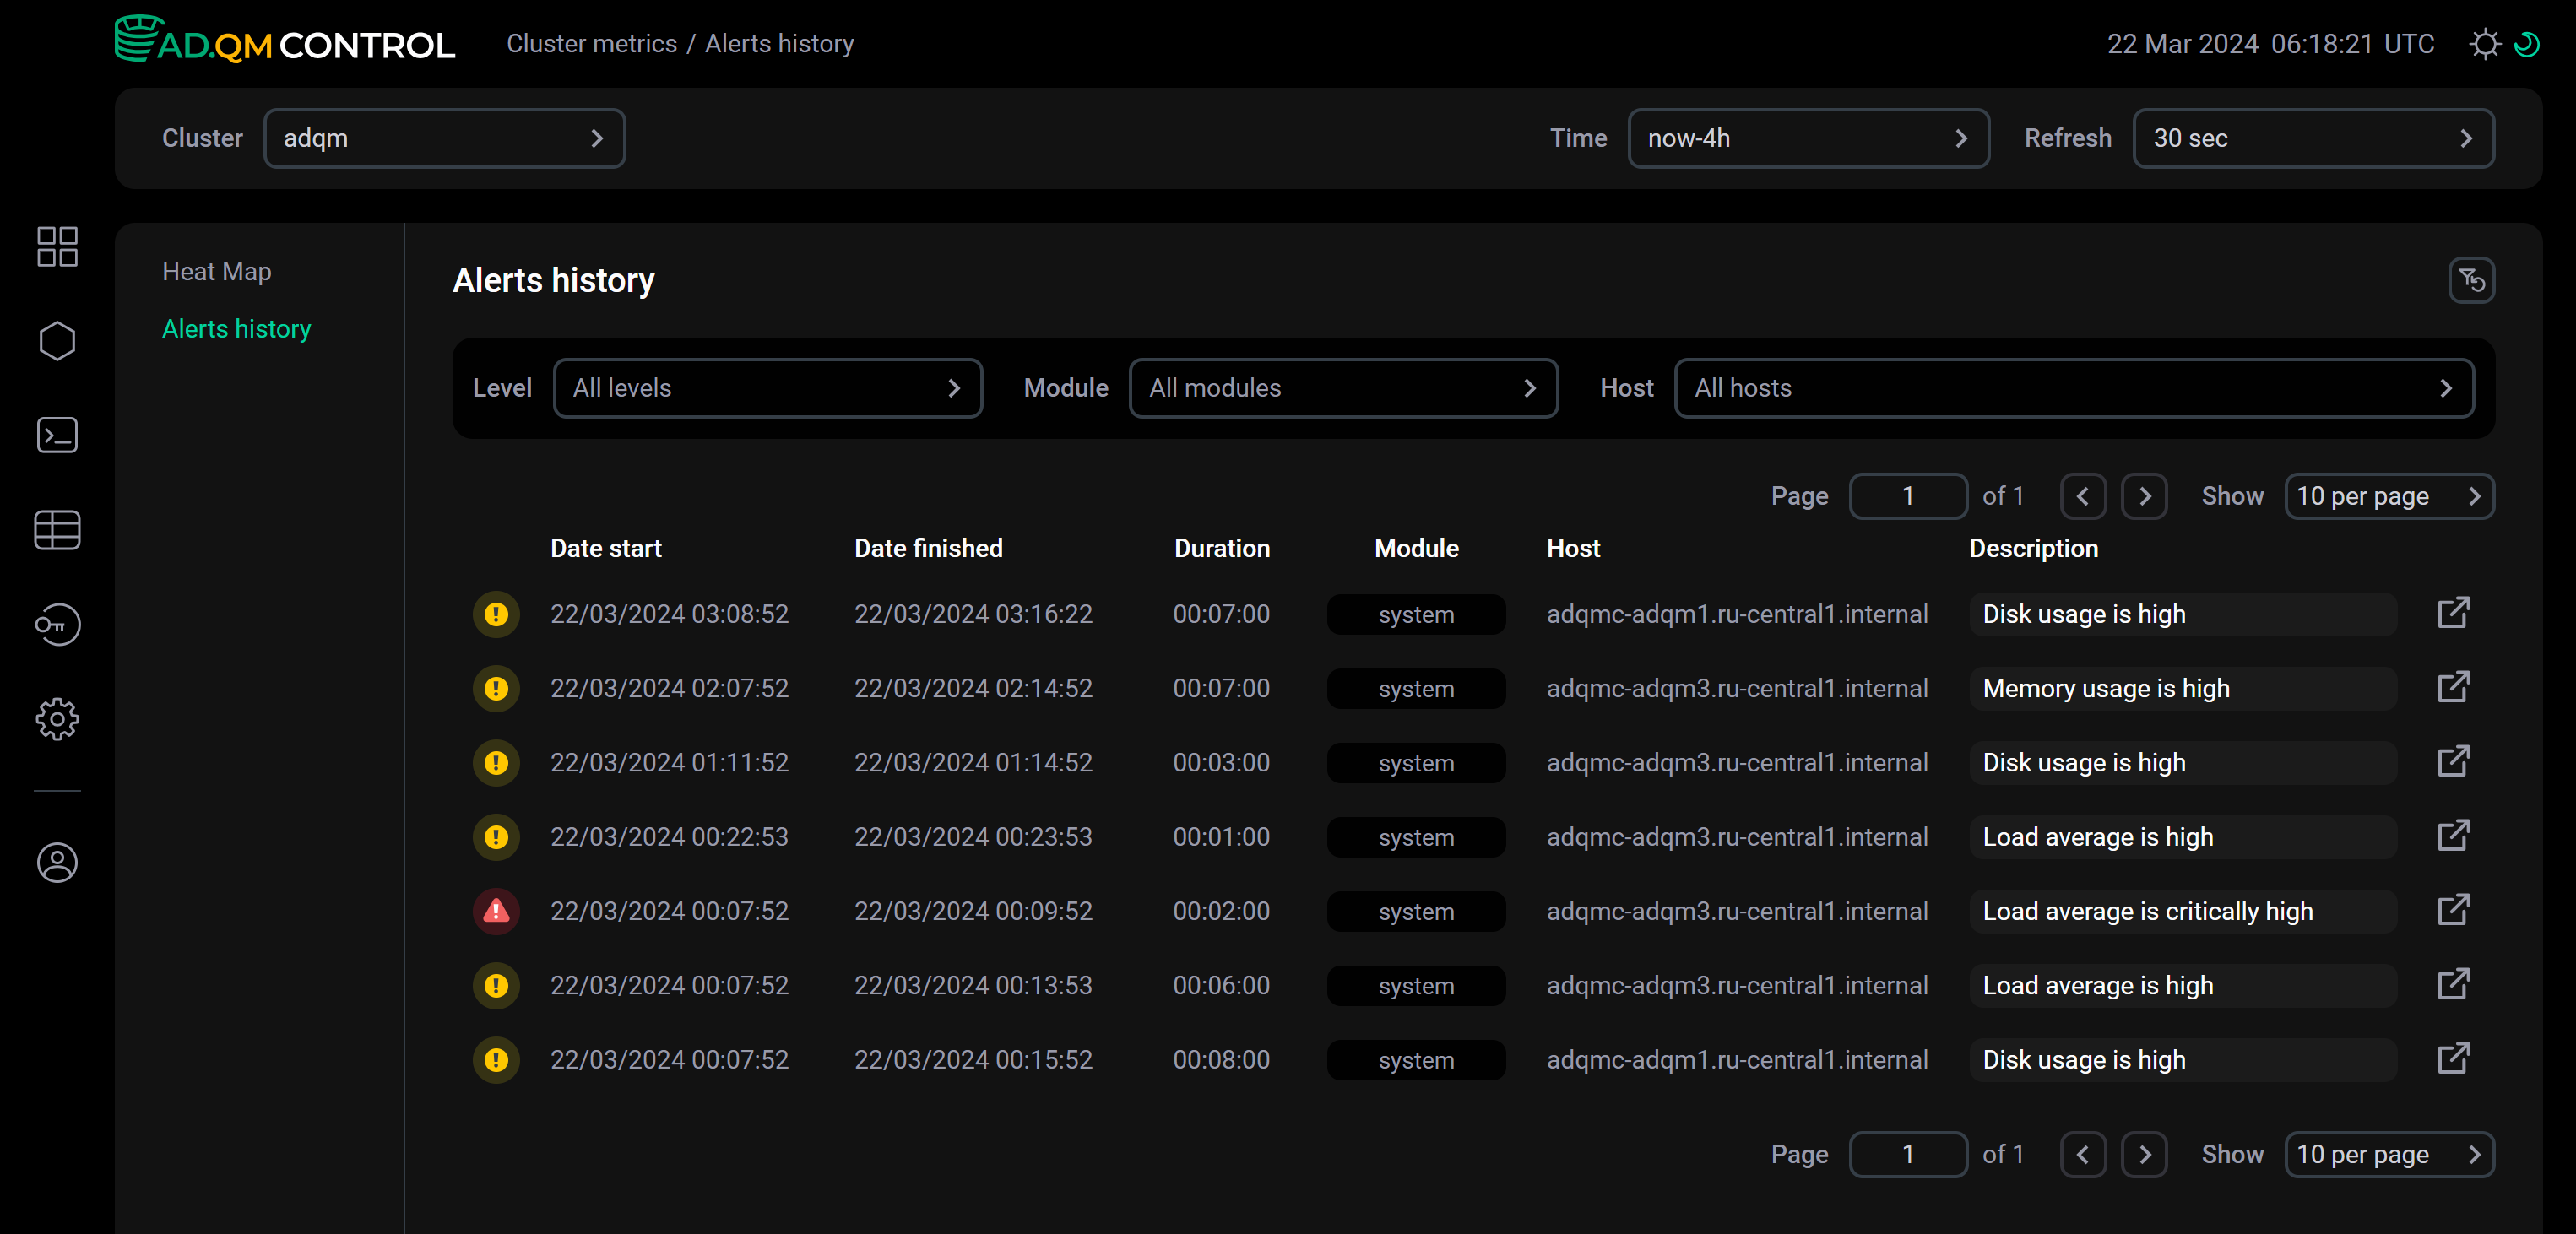
Most of the fields in the Alerts history table match the fields that are described above for the Heat map tab. Additionally, the following fields are available:
-
Date finished — timestamp (in the
DD/MM/YYYY HH:mm:ssformat) when an alert became no longer valid, i.e. the corresponding issue was resolved on the host. If an alert is still active, the field shows a time in the future. -
Host — host on which an issue was detected.
Alert filters
You can use filters located at the top of the Alerts history tab to specify which alerts to display in the table:
-
Level — alert importance level. Possible values:
-
warning— potential issues on hosts (); -
critical— critical issues on hosts ().
-
-
Module — module into which alerts are grouped. Currently, only the
systemmodule is available. -
Host — host for which you want to display alerts on issues found in the system. You can select multiple or all hosts at once.
To reset all applied filters, click the icon ![]()
![]() Reset all filters.
Reset all filters.
Alert details
As for the Heat map tab, it is possible to obtain alert details from Alerts history in two ways:
-
Click an alert row in the list — alert details will appear below the row.
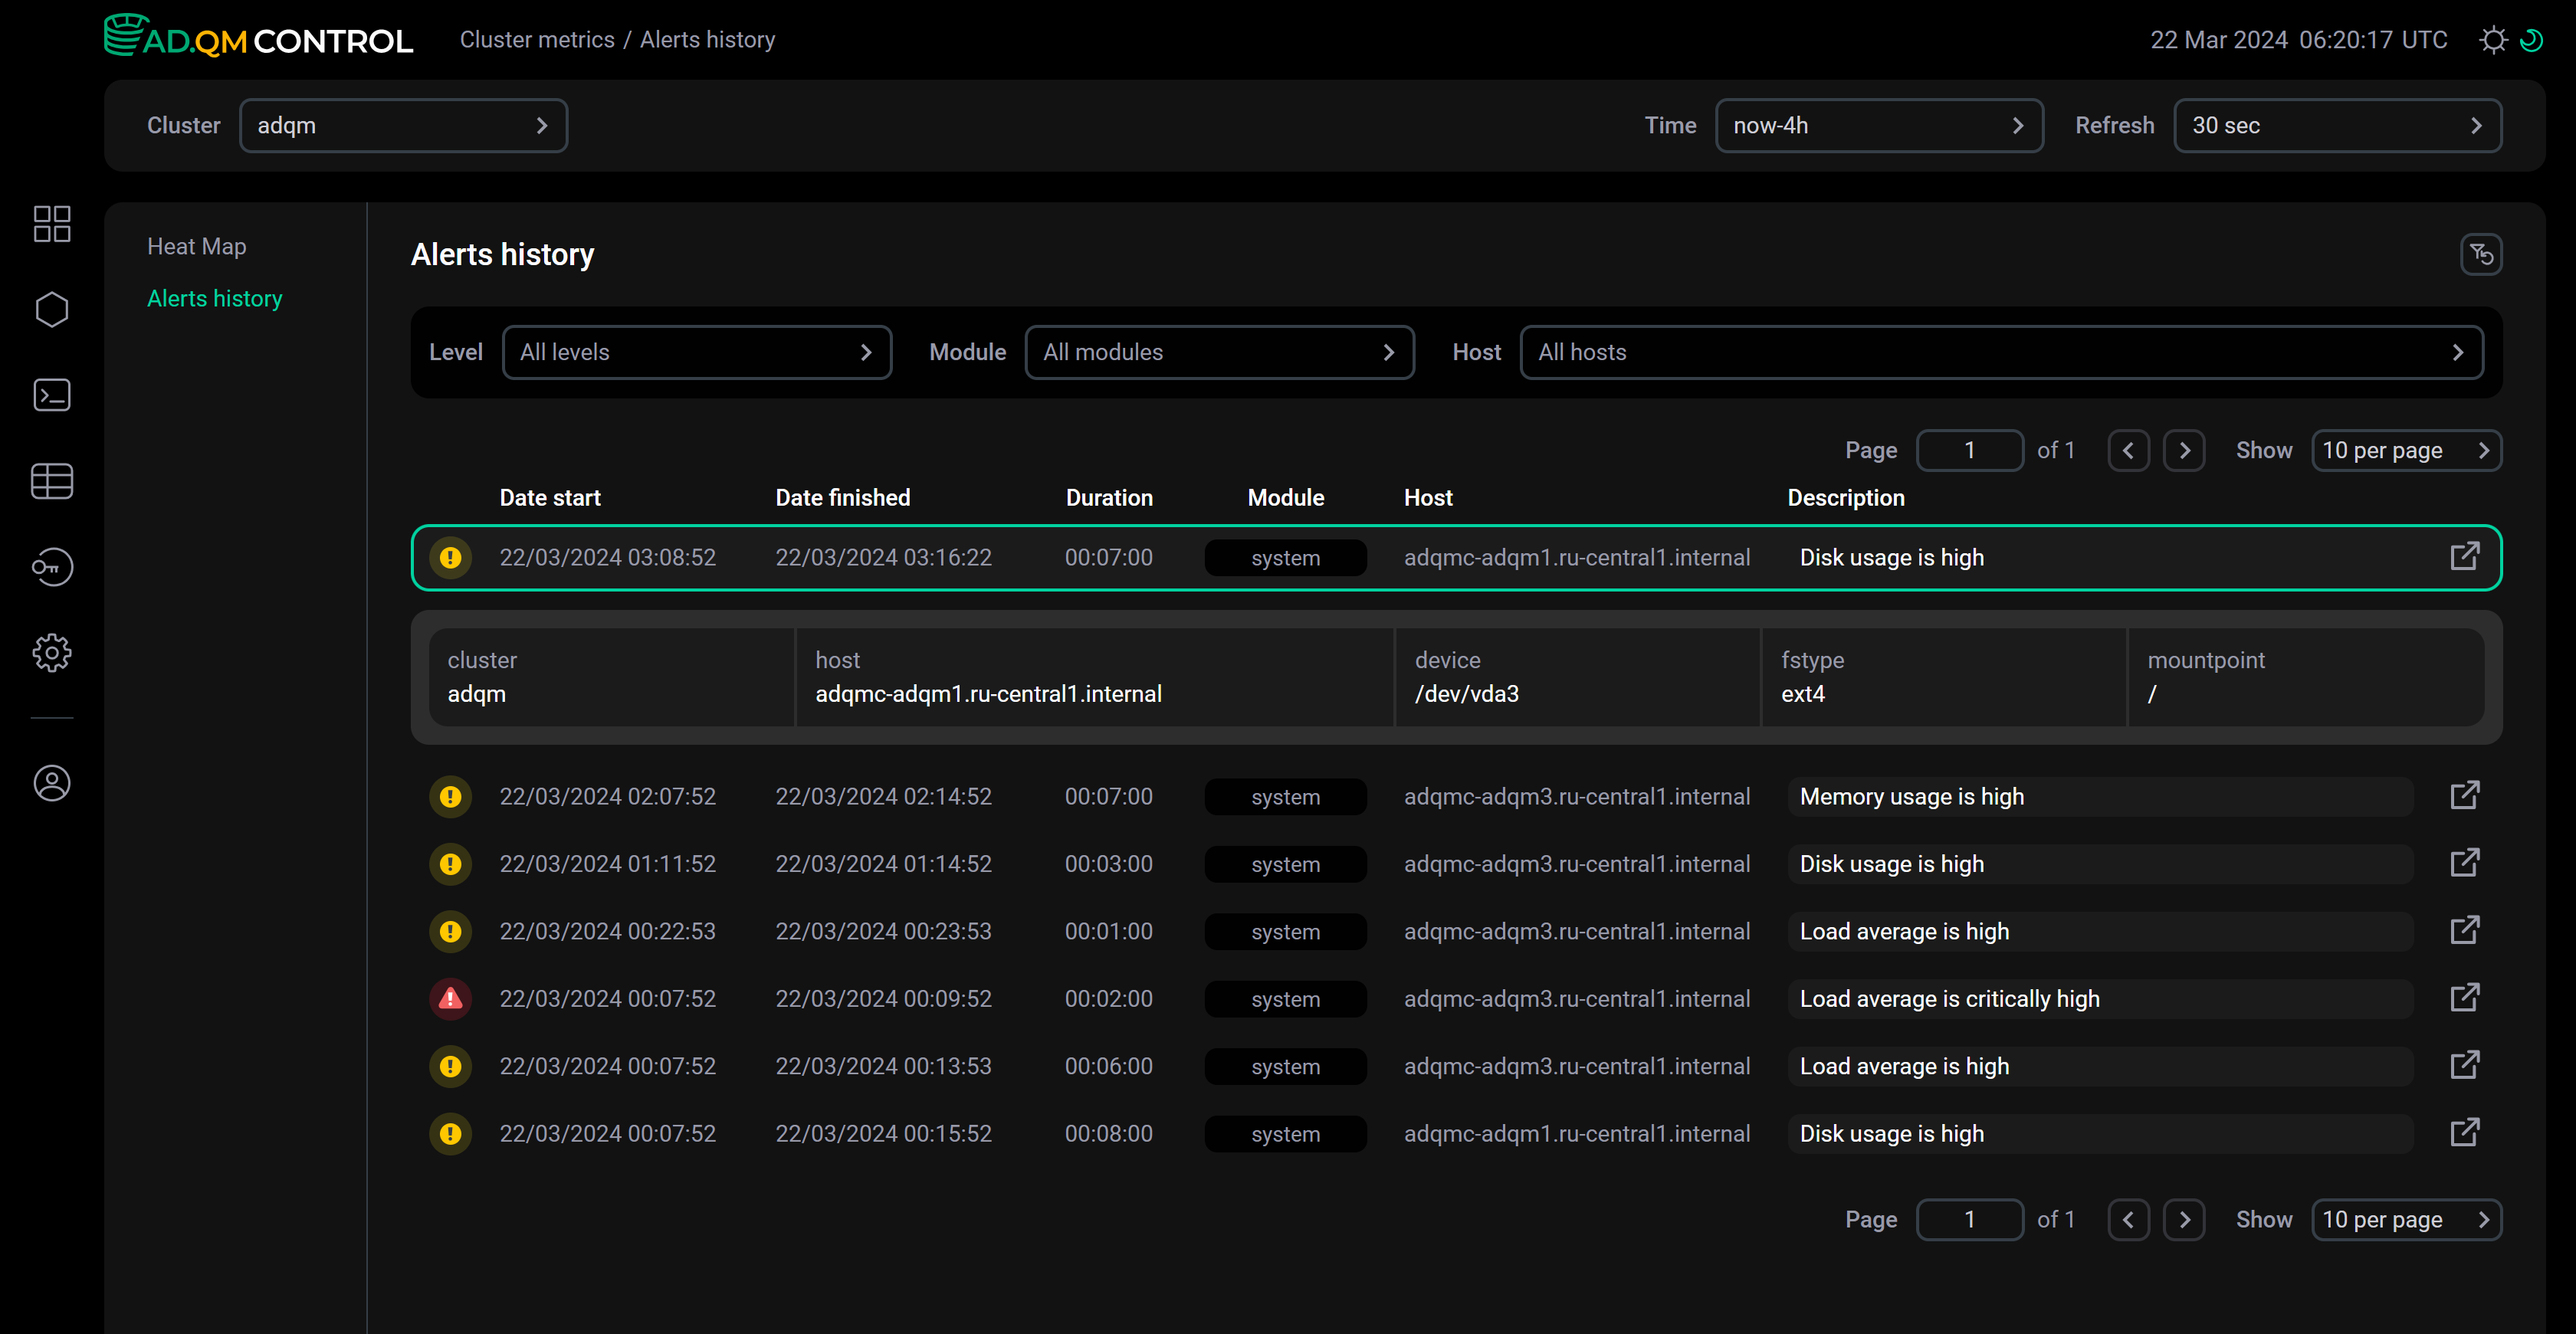 Alert details within the list
 -
Click the icon
within an alert row — a separate page with alert details will open.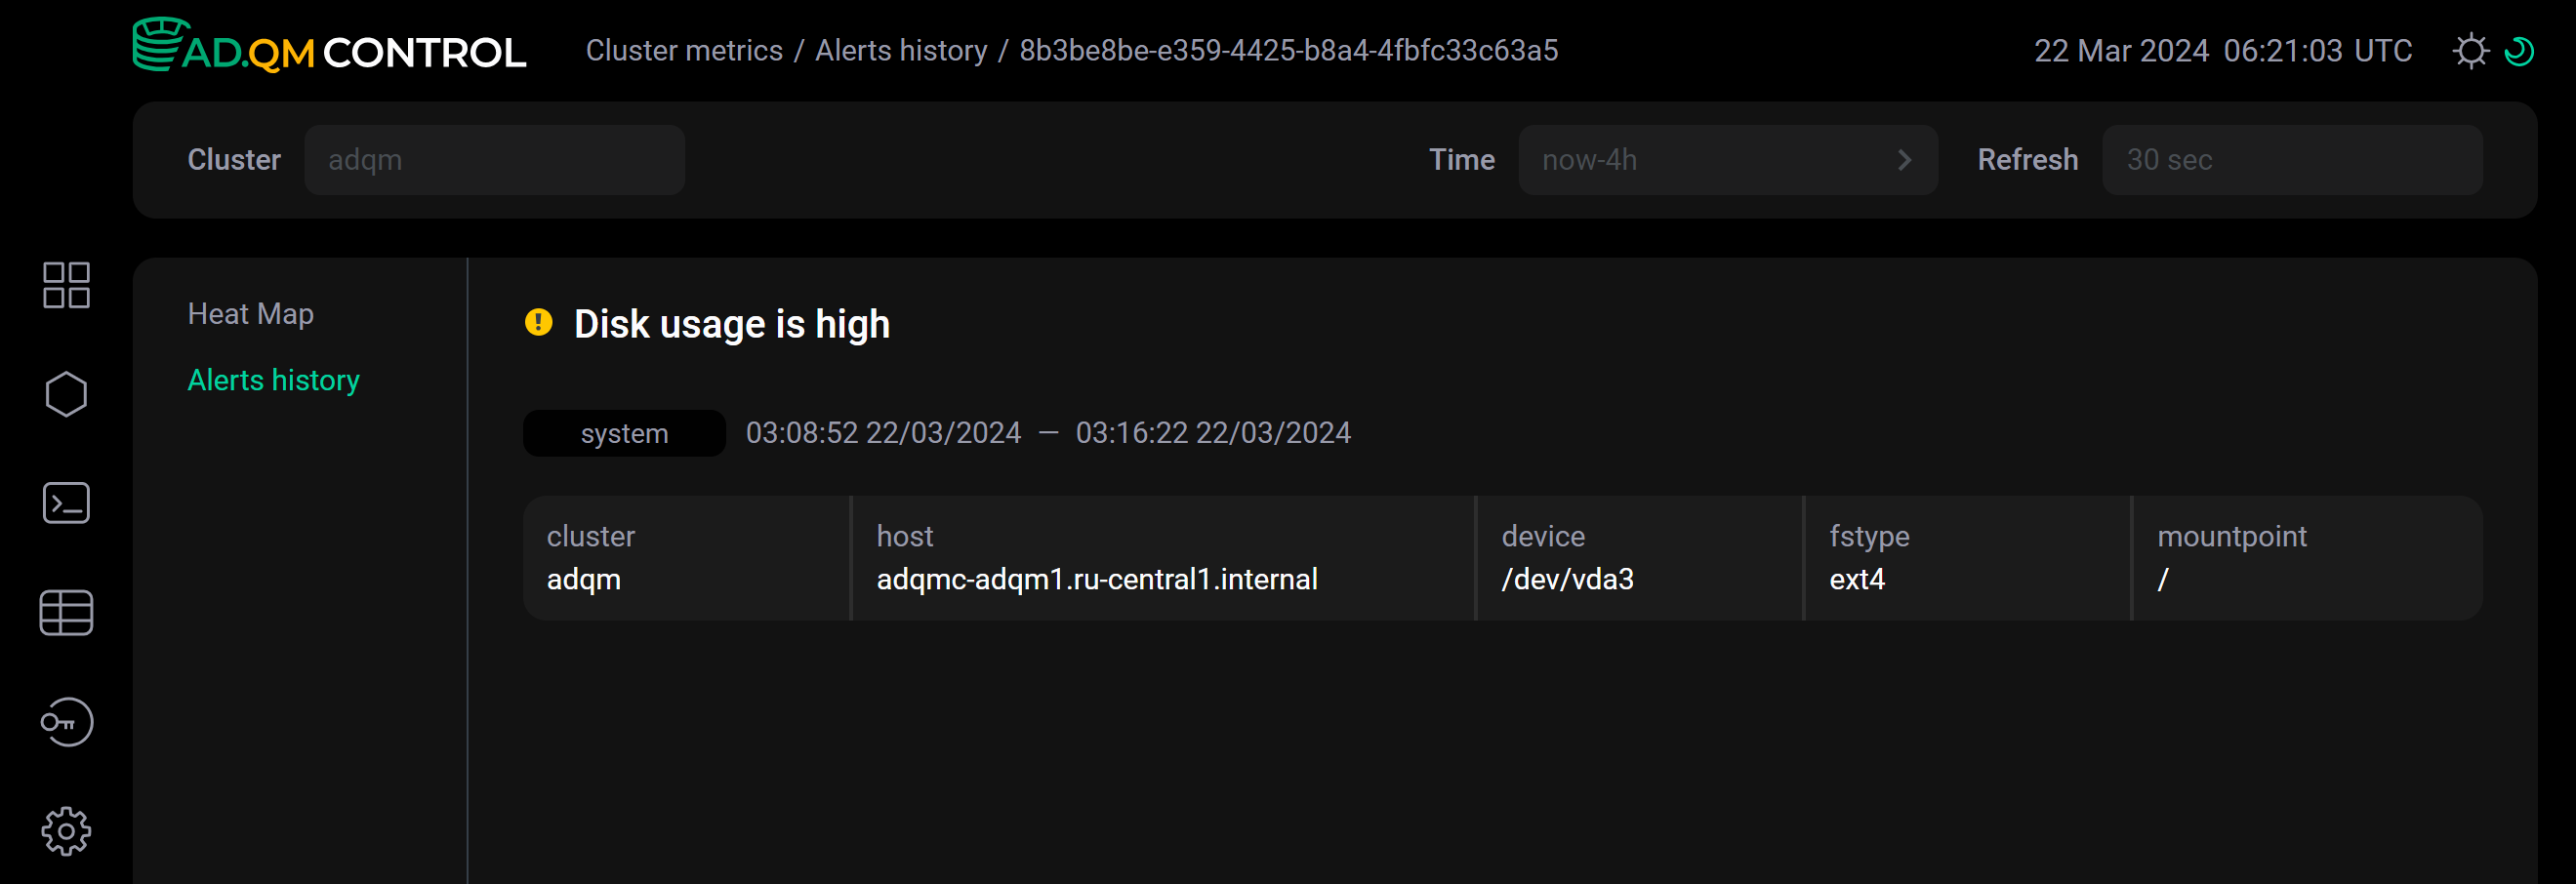 Alert details on a separate page